75282
22email: ekyritsis@physics.uoc.gr
A versatile classification tool for galactic activity using optical and infrared colors
Abstract
We use the Random Forest (RF) algorithm to develop a tool for automated activity classification of galaxies into 5 different classes: Star-forming (SF), AGN, LINER, Composite, and Passive. We train the algorithm on a combination of mid-IR (WISE) and optical photometric data while the true labels (activity classes) are based on emission line ratios. Our classifier is built to be redshift-agnostic and it is applicable to objects up to z 0.1. It reaches a completeness 80% for SF and Passive galaxies, and 60% for AGN. Applying it to an all-sky galaxy catalog (HECATE) reveals a large population of low-luminosity AGNs outside the AGN locus in the standard mid-IR diagnostics.
keywords:
activity diagnostics – star-formation – machine Learning– AGN1 Introduction
Activity classification of galaxies is of great importance for many fields of extragalactic Astrophysics, such as understanding galaxy evolution (Kewley et al., 2019) and/or AGN demographics. Traditionally, this is done using characteristic emission–line ratios which discriminate galaxies into different classes depending on the source of ionization (e.g. Kewley et al., 2019). However, the need for spectroscopic data hampers the applicability of these diagnostics to very large datasets since spectroscopic observations are available for a subset of the objects with photometric data. In addition, these diagnostics cannot be used on galaxies without emission lines rendering them inapplicable to passive galaxies. While alternative diagnostics based on mid-IR colors (Mateos et al., 2012; Assef et al., 2013, hereafter M12 and A13) are successfully used for identifying luminous AGNs, they are not as reliable in the local universe.
To address these limitations, we develop a new activity diagnostic by combining the RF machine learning algorithm (Louppe, 2014) with multi-wavelength photometric data.
2 Classification scheme and data
2.1 Photometric data
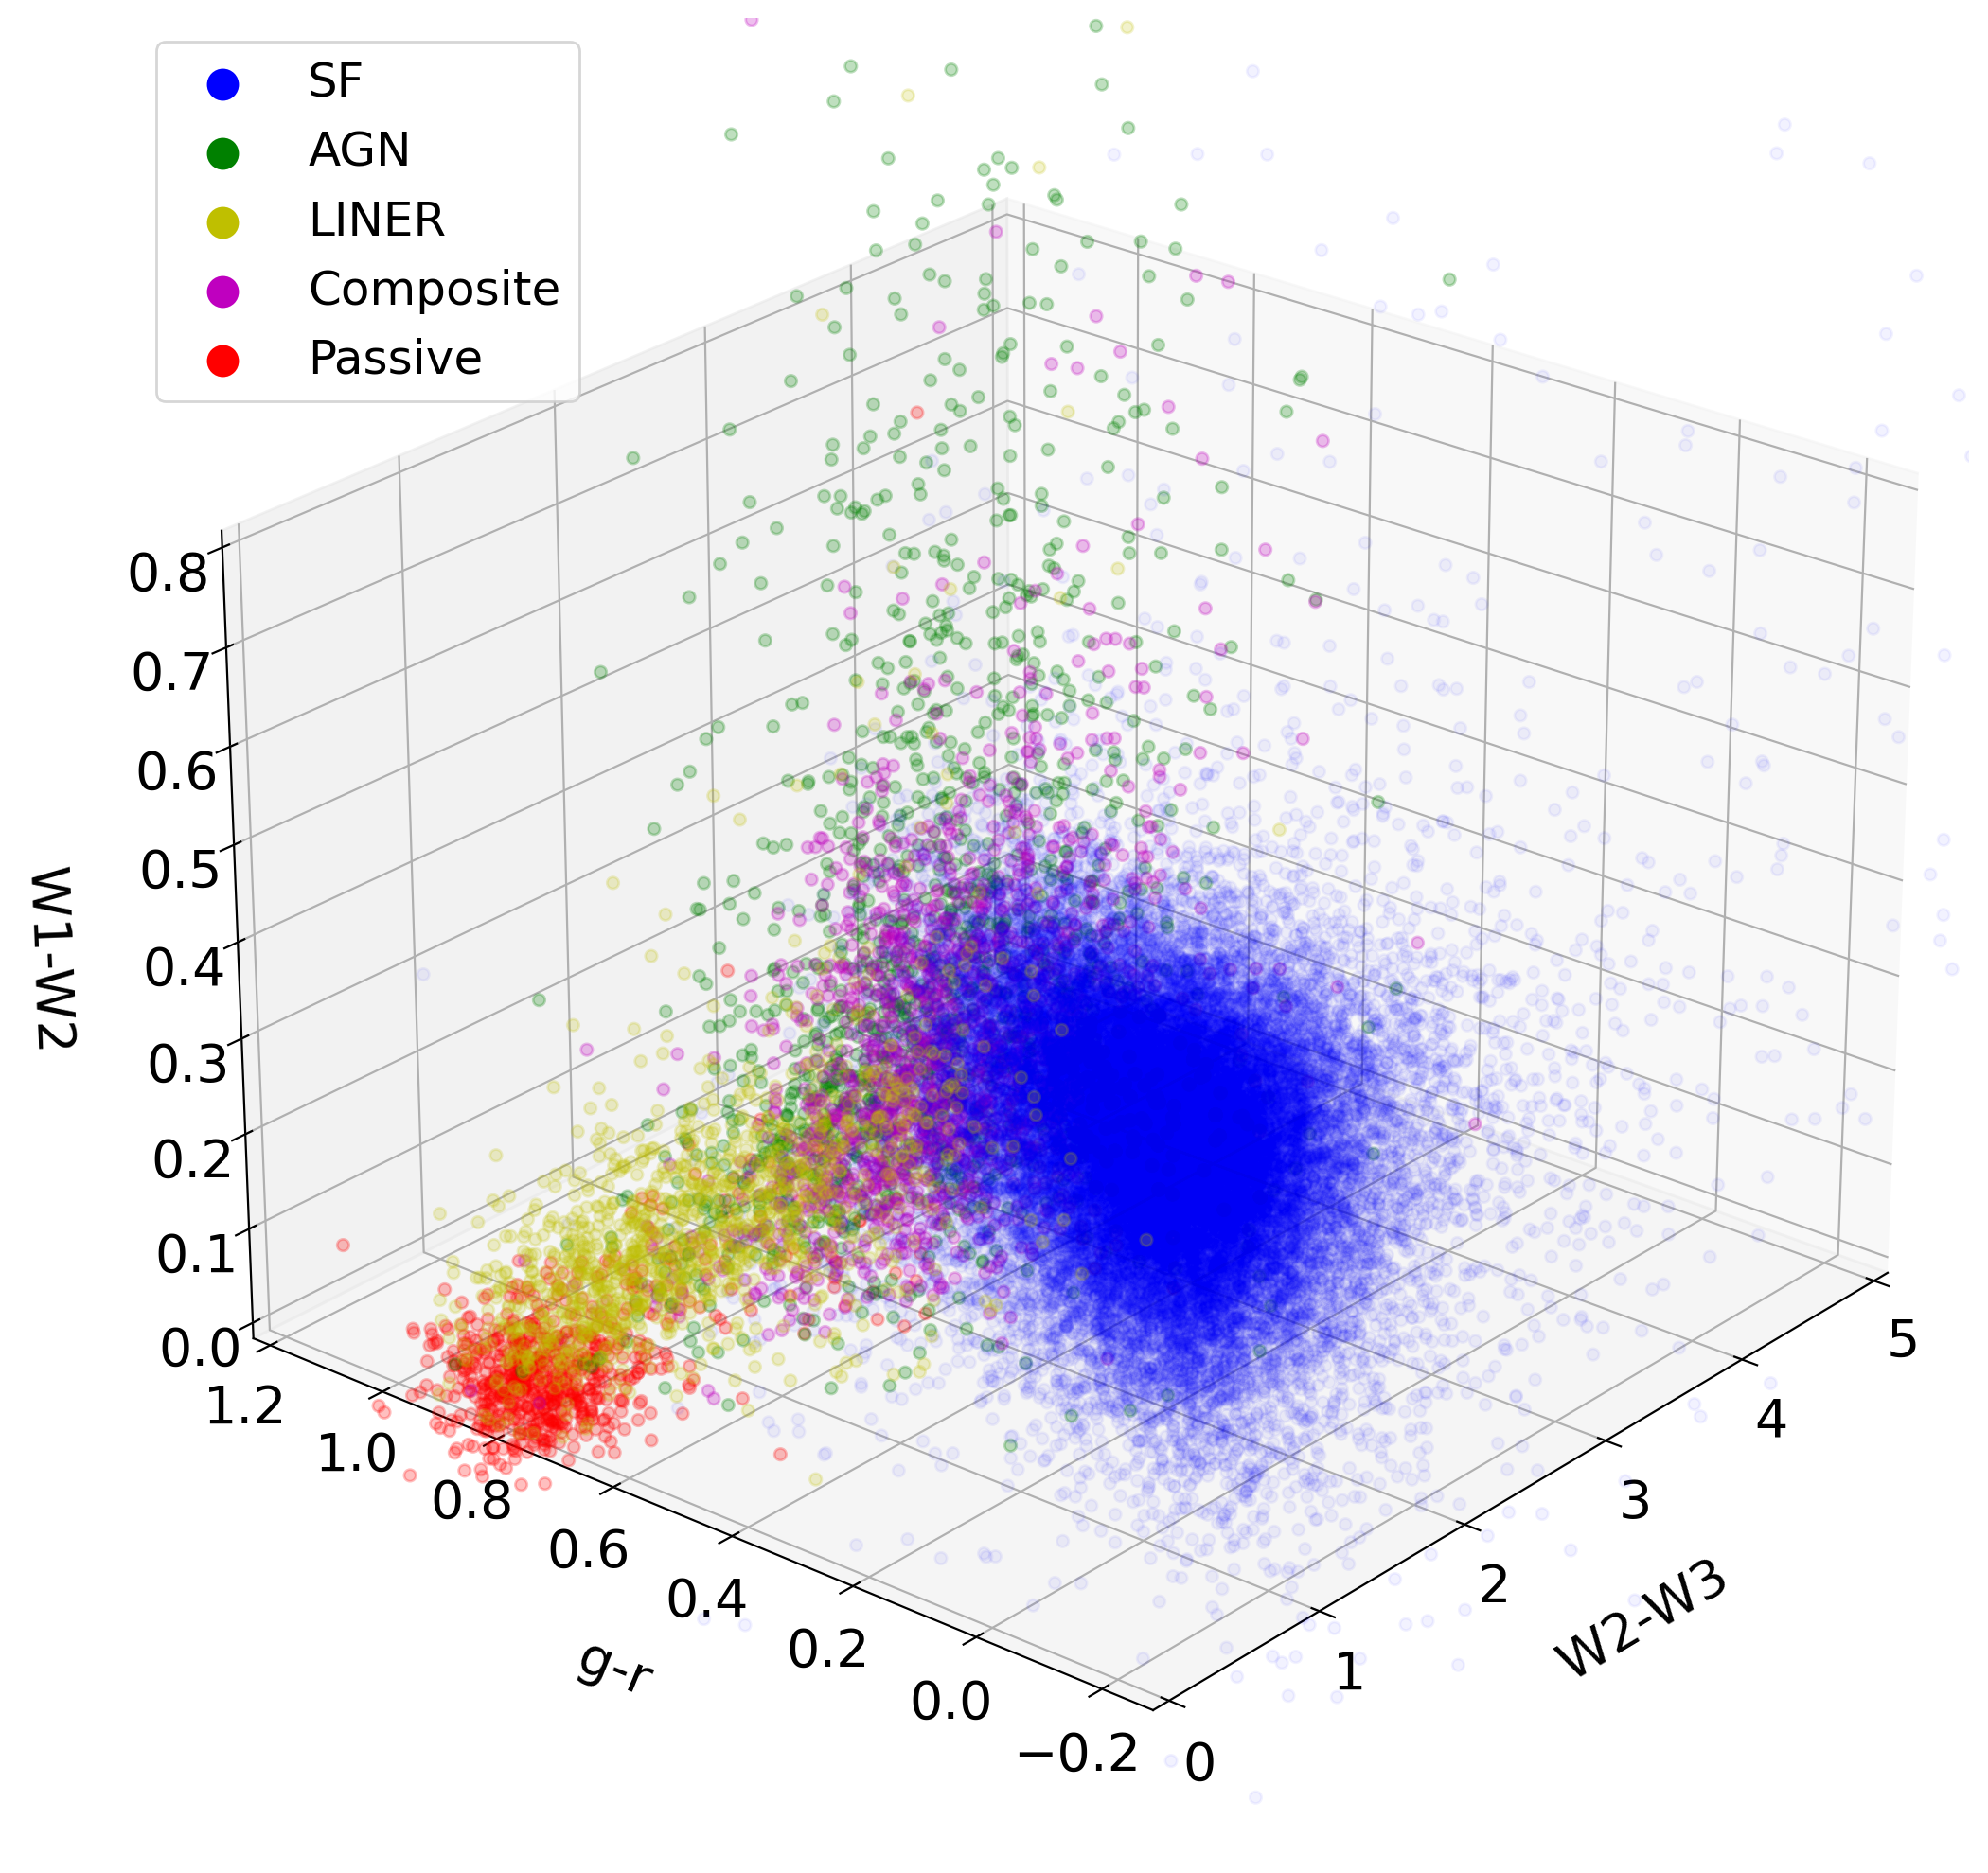
Galaxies have different spectral shapes depending on their source of ionization. Previous works have shown that these differences are stronger in the UV, optical, and mid-IR bands. In order to maximize the available sample, we opted to use for training our algorithm mid-IR and optical photometric data from the AllWISE Source Catalog (Wright et al., 2010) and the SDSS DR16 (Brinchmann et al., 2004), respectively. To avoid the need for redshift measurements, we use colors rather than luminosities. In order to mitigate aperture effects, we use a mid-IR hybrid-photometric scheme that combines custom-aperture photometry for nearby (extended) and fixed aperture photometry for more distant point-like sources. The optical data consist of colors, based on SDSS DR16 fiber-photometry. In order to reduce the noise in our training data set we chose only galaxies with S/N 5 (Signal-to-Noise) for the optical bands g,r and the mid-IR bands W1, W2. For the band W3 we used a S/N 3. Our final optimal feature scheme comprises colors: W1-W2, W2-W3, and and its distribution per activity class is presented in Fig. 1.
2.2 Classifcation scheme
We adopt a 5-class classification scheme that discriminates galaxies into different activity classes: SF, AGN, LINER, Composite, and Passive. In order to construct the training sample, we use spectroscopic information from the SDSS-MPA-JHU (Brinchmann et al., 2004) catalog by selecting only the galaxies that show strong emission lines (S/N 5). The emission-line galaxies are classified based on the 4-dimensional data-driven classification algorithm of Stampoulis et al. (2019). To define a sample of Passive galaxies without emission lines we selected objects with good spectra (continuum S/Ncont 3) and absent emission lines (S/Nline 3). Our final sample includes 40954 galaxies spanning a redshift range of = 0.02 - 0.08. Table 1 shows the composition of our final sample classification scheme. For the training of the RF algorithm we considered 50% of the full set (20477/40954), and for the test the rest 50%. Given the strong imbalance between the different classes in the training sample, we used a stratified split in order to ensure that both training and the test set have the same proportions of each class.
| Class | Number of objects | Percentage (%) |
|---|---|---|
| Star-forming | 35878 | 87.6 |
| Seyfert | 1337 | 3.3 |
| LINER | 1322 | 3.2 |
| Composite | 1673 | 4.1 |
| Passive | 744 | 1.8 |
3 Results
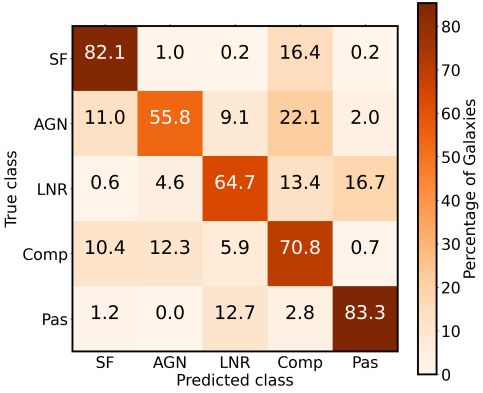
The confusion matrix (Fig. 2) shows that our classifier reaches maximum completeness of 82% for SF and Passive galaxies and 56% for AGN. This performance is expected if we consider the feature distribution of our training sample where the 5 classes are reasonably separated with higher mixing between the composite and AGN galaxies (Fig. 1). Furthermore, these high scores indicate the robustness and reliability of our classifier when it is applied to unseen data (i.e. test set).
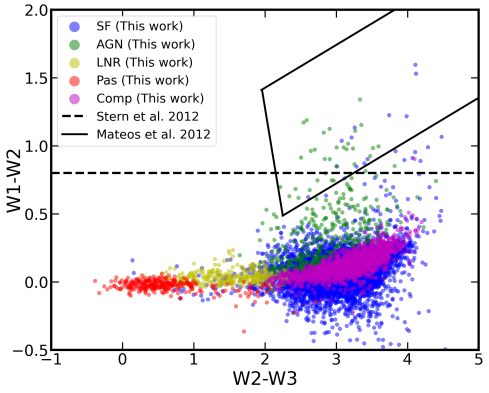
We apply our new diagnostic to the HECATE nearby galaxy catalog (D200 Mpc) (Kovlakas et al., 2021), and we compare our classifications with the mid-IR diagnostics from M13 and A12. Our new classifier reveals a large population of AGN outside their locus as defined in the other mid-IR diagnostics (green points below the dashed line in Fig.3). In particular, in a sample of 1227 spectroscopically classified AGN we find that our method recovers of the initial sample, while the M13, and A12 methods recover and , respectively. Thus our new diagnostic increases the completeness of AGN identified with mid-IR colors since the other methods are more sensitive to luminous AGN, omitting a significant fraction of lower luminosity AGN. The reason for the success of our method is that the inclusion of the optical color allows the classifier to identify more AGN and also cases of starbursts with extreme mid-IR colors that mimic obscured AGN galaxies (blue points at the top right of Fig. 3).
References
- Assef et al. (2013) Assef, R. J., Stern, D., Kochanek, C. S., et al. 2013, ApJ, 772, 26
- Brinchmann et al. (2004) Brinchmann, J., Charlot, S., White, S. D. M., et al. 2004, MNRAS, 351, 1151
- Kewley et al. (2019) Kewley, L. J., Nicholls, D. C., & Sutherland, R. S. 2019, ARA&A, 57, 511
- Kovlakas et al. (2021) Kovlakas, K., Zezas, A., Andrews, J. J., et al. 2021, MNRAS, 506, 1896
- Louppe (2014) Louppe, G. 2014, arXiv e-prints, arXiv:1407.7502
- Mateos et al. (2012) Mateos, S., Alonso-Herrero, A., Carrera, F. J., et al. 2012, MNRAS, 426, 3271
- Stampoulis et al. (2019) Stampoulis, V., van Dyk, D. A., Kashyap, V. L., & Zezas, A. 2019, MNRAS, 485, 1085
- Wright et al. (2010) Wright, E. L., Eisenhardt, P. R. M., Mainzer, A. K., et al. 2010, AJ