Reducing transmission expansion by co-optimizing sizing of wind, solar, storage and grid connection capacity
Abstract
Expanding transmission capacity is likely a bottleneck that will restrict variable renewable energy (VRE) deployment required to achieve ambitious emission reduction goals. Grid interconnection and inter-regional transmission capacity may be reduced by the optimal sizing of VREs to grid connection or co-location of VRE and battery resources behind the grid interconnection, but neither of these capabilities are commonly captured in macro-energy system models. We thus develop these two new functionalities to explore the substitutability of storage for transmission and VRE resource trade-offs through 2030 in the Western Interconnection of the United States. Our findings indicate that not modeling co-location fails to capture the full substitutability of storage and solar photovoltaic (PV) resources for transmission: co-location can reduce long-distance inter-regional transmission expansion by 12-31% and decrease grid connection capacity and shorter-distance transmission interconnection by 20-25%. We also demonstrate that not modeling co-located storage does not accurately reflect competition between wind and solar PV resources and underestimates the value of energy storage: co-location of VREs and storage favors solar PV (4-5% increase) and lithium-ion battery deployment (1.7-6 times increase), while decreasing wind buildout (0.9-1.6% decline).
keywords:
Co-located resources , hybrid , transmission , lithium-ion battery , macro-energy systems , variable renewable energy[inst1]organization=Andlinger Center for Energy and the Environment, addressline=Princeton University, city=Princeton, state=NJ, country=USA
[inst2]organization=Systems Science and Industrial Engineering, addressline=Binghamton University, city=Binghamton, state=NY, country=USA
[inst3]organization=Department of Mechanical and Aerospace Engineering, addressline=Princeton University, city=Princeton, state=NJ, country=USA
![[Uncaptioned image]](/html/2303.11586/assets/images/methods_abstract.png)
Battery deployment is critical and could curb inter-regional transmission expansion.
Grid connection declines when co-optimizing and co-locating VREs and batteries.
Co-optimizing and co-locating VREs and storage yield further oversizing of VREs.
Modeling co-location and optimal sizing reflects competition between wind and solar.
1 Introduction
The most cost-effective scenarios for the deep decarbonization of the electricity sector involve significant expansion of wind and solar photovoltaic (PV) capacity and associated build out of high-voltage electricity transmission to connect renewable energy projects to demand centers concentrated in populated areas [1, 2, 3, 4, 5]. For example, Larson et al. 2021 estimate the need for approximately 400-750 gigawatts (GW) of wind and solar PV capacity deployment and a roughly 60% increase in transmission capacity by 2030 to put the United States on track to reach net-zero greenhouse gas emissions by 2050 [6]. In practice, however, long-distance electricity transmission projects can easily take 5-15 years to site, permit, and build. Many projects face significant delays due to public opposition from the communities they transect or are abandoned after failing to obtain necessary permits from all relevant jurisdictions along their routes [7, 8, 9, 10]. As such, expanding long-distance transmission capacity is likely to constitute a bottleneck that could constrain the rate of decarbonization [11].
Given the practical challenge and economic cost of transmission expansion, it is prudent to design variable renewable energy (VRE) projects to effectively utilize transmission connections. Co-optimizing VRE and grid interconnection sizing (optimally oversizing the solar PV or wind capacity to the amount of transmission interconnection capacity needed) and co-locating VRE and battery resources (siting VRE and battery technologies at the same physical interconnection location) are emerging areas of interest due to lower capital costs, available policy incentives, and enhanced value [12, 13, 14, 15, 16]. Solar PV projects entering the interconnection queue are already seeing the further oversizing of solar panels to inverter capacity, while wind projects are witnessing the decline of specific power [17, 18]. Meanwhile, 42% of solar (285 GW out of 676 GW) and 8% of wind (17 GW out of 247 GW) projects added to U.S. transmission interconnection queues in 2021 were ’hybrid’ projects co-locating solar PV, wind, and/or battery energy storage capacity at the same site behind a common grid interconnection capacity [19]. These changes in the siting of VREs could impact optimal transmission buildout in feasible decarbonization pathways.
Prior studies have investigated the potential and value of co-located resources compared to independently-sited resources [14, 20, 21]. Other studies have demonstrated the potential substitutability of energy storage and transmission capacity [22, 23, 24, 25, 26, 27]. However, most power system capacity expansion models do not optimize VRE to interconnection sizing or allow for the co-location of VREs and batteries, likely biasing the estimation of necessary transmission reinforcements produced by such models [14, 28]. VREs have been traditionally modeled independent from other energy generation resources and by fixing the grid connection and inverter capacity built for the capacity of solar PV or wind technologies. Solar PV capacity is generally modeled as sized 1.3 times the inverter capacity, and wind capacity is sized to have equivalent grid connection capacity [12, 13, 15]. For example, [23, 27, 29, 30] all model solar PV with a fixed inverter loading ratio (ILR) (the ratio of DC solar capacity to AC inverter and grid connection capacity) of 1.3:1 and assume all wind projects have a grid connection equal to their generating capacity. The optimal ratios of VRE to grid connection capacity may vary significantly from these assumed values based on resource quality, distance of site to metro areas, and availability of nearby substations, particularly with the ability to co-locate resources [29, 31, 32, 33]. Without being able to optimally site and size these resources, conventional modeling approaches likely overestimate the requisite transmission expansion, under-value energy storage, and bias estimates of optimal generation and storage portfolios. More detailed modeling can permit us to capture granular trade-offs and trends that co-locating resources and optimizing VRE sizing may have in selecting the location and type of technologies to build in decarbonization pathways.
Thus, the goal of this study is to investigate whether optimized sizing of renewable energy and transmission interconnection capacity and co-location of renewables and storage capacity can decrease transmission reinforcements needed for a low-carbon future and alter the optimal generation and storage capacity portfolio. We improve an existing, Julia-based, open-source electricity capacity expansion model, GenX, to optimize VRE to interconnection sizing and co-locate VRE and battery resources [34]. The comprehensive and granular modeling of VREs enables the exploration of trade-offs between transmission and battery capacity and the optimal locations of VRE siting. We test the model framework with a 6-zone case study of the American West for 2030, analyzing the impacts of co-location and optimizing resource sizing for VRE, transmission, and battery build-out in near-term decarbonization goals. We run three main scenarios (see Table 7): 1) fixed interconnection (fixed ratios of VRE to grid connection capacity), as is common practice in most capacity expansion models today, 2) optimized interconnection (model selects optimal ratios of VRE to grid connection capacity for each wind and solar resource cluster in the VRE supply curve), and 3) co-located storage (model can build co-optimizied and co-located VREs and battery resources) under two policy scenarios (current policies for 2030 and 80% clean energy standard (CES)) and two VRE and battery cost projections (mid-range and low-cost scenarios for solar, wind, and batteries). We additionally downscale the aggregated results, processing the GenX outputs to 1) 4x4 km2 candidate project areas (CPAs) based on the levelized cost of electricity (LCOE) inclusive of interconnection costs, and 2) intra-regional spur line (short distance site-to-substation and intra-regional transmission-to-metro lines) capacity and inter-regional long-distance transmission capacity [5].
Section 2 dives into the methodology of the study, highlighting the model formulation of co-located resources, case study overview, assumptions, cost analysis, and scenarios. Section 3 is structured to analyze two different scenarios. First, we investigate how enabling the model to select how much grid connection capacity to build for each VRE site will alter the optimal sizing of these resources, technology buildout, and transmission expansion. Second, we further examine how adding the model option of co-locating solar PV or wind with batteries changes resource siting decisions, capacity deployment, and transmission buildout. Section 4 synthesizes our main takeaways on the substitutability of storage and transmission assets and resource mix trade-offs between building solar PV and wind energy in various locations with the ability to co-locate resources and optimally size interconnection. Section 4 also discusses the implications of this detailed modeling for electricity system planning and macro-energy systems practices.
2 Methods
2.1 GenX Model Formulation
(a) Fixed Interconnection & Optimized Interconnection Scenario, (b) Co-Located Storage Scenario. Decision variables, colored in purple, are defined in Table LABEL:variables. Overlapping constraints between the three scenarios are colored in green. Modified constraints between the three scenarios are colored in blue. Constraints that only exist in the co-located storage scenario are colored in orange. This figure was adapted from [12].
GenX is an open-source, least-cost optimization, power system capacity expansion model created at MIT and Princeton to analyze low-carbon electricity systems. GenX is configurable to model different resolutions along the dimensions of time, unit commitment constraints, and geospatial and network representation, as suited for different studies. More information about GenX and the implementation can be found in the existing working paper and GitHub [28, 34].
While GenX and other similar capacity expansion models are capable of modeling thermal generators, VREs, hydroelectric generators, energy storage technologies, and many other conventional and advanced resources, most have been unable to model 1) co-located VRE and energy storage technologies, and 2) optimized interconnection grid connection sizing for VREs [14, 28]. A new technology module that enables more detailed modeling of VREs was implemented in GenX using the Julia programming language and JuMP package for mathematical programming [35, 36, 37].
The mathematical formulation of constraints added to this module are listed and described below. All definitions of sets, decision variables, and constants can be found in Tables 1, 2, LABEL:constants, and LABEL:variables. Fig. 1 showcases how the constraints interact in the module between the scenarios that are described in Section 2.
| Notation | Description |
|---|---|
| denotes the indexed time step over the set of time steps | |
| denotes the zone over the set of zones in the model | |
| denotes the indexed generator over the set of available generators |
| Notation | Description |
| denotes the subset of VRE and co-located VRE-storage resources from all of the generators |
| Notation | Description |
| Existing installed capacity of the VRE component of technology y in zone z [MW DC] | |
| Existing installed storage energy capacity of technology y in zone z [MWh] | |
| Existing installed capacity of the grid component of technology y, encompassing the inverter, power electronic, substation, and spur line capacities in zone z [MW AC] | |
| Inverter loading ratio (the VRE capacity sizing to grid capacity built) for technology y in zone z [%] | |
| Single-trip efficiency of storage charging for technology y in zone z [%] | |
| Single-trip efficiency of storage discharging for technology y in zone z [%] | |
| Inverter efficiency representing losses from converting DC to AC power and vice versa for technology y in zone z [%] | |
| Maximum available generation per unit of VRE installed capacity during time step t for the VRE component of technology y in zone z [%] | |
| Minimum VRE capacity requirement for technology y in zone z [MW DC] | |
| Minimum storage energy capacity requirement for technology y in zone z [MWh] | |
| Minimum grid capacity requirement for technology y in zone z [MW AC] | |
| Maximum VRE capacity requirement for technology y in zone z [MW DC] | |
| Maximum storage energy capacity requirement for technology y in zone z [MWh] | |
| Maximum grid capacity requirement for technology y in zone z [MW AC] | |
| The ratio of discharge power capacity to energy capacity for the storage component of technology y in zone z [%] | |
| Investment cost (annual amortization of total construction cost) for the VRE component power capacity of technology y in zone z [$/MW DC-yr] | |
| Investment cost (annual amortization of total construction cost) for the storage component energy capacity of technology y in zone z [$/MWh-yr] | |
| Investment cost (annual amortization of total construction cost) for the grid component power capacity of technology y in zone z [$/MW AC-yr] | |
| Fixed O&M cost of the VRE component of technology y in zone z [$/MW DC-yr] | |
| Fixed O&M cost of the storage energy component of technology y in zone z [$/MWh-yr] | |
| Fixed O&M cost of the grid component of technology y in zone z [$/MW AC-yr] | |
| Variable O&M cost of the VRE component of technology y in zone z [$/MWh] | |
| Variable O&M cost of the storage energy component of technology y in zone z [$/MWh] |
| Notation | Description |
| Installed capacity of the VRE component of technology y in zone z [MW DC] | |
| Installed energy capacity of the storage component of technology y in zone z [MWh] | |
| Installed capacity of the grid component of technology y in zone z [MW AC] | |
| Retired capacity of the VRE component of technology y from existing capacity in zone z [MW DC] | |
| Retired energy capacity of the storage component of technology y from existing capacity in zone z [MWh] | |
| Retired capacity of the grid component of technology y from existing capacity in zone z [MW AC] | |
| Total installed capacity of the VRE component of technology y in zone z [MW DC] | |
| Total installed energy capacity of the storage component of technology y in zone z [MWh] | |
| Total installed capacity of the grid component of technology y in zone z [MW AC] | |
| ”Behind the inverter” energy generated by the VRE component of technology y at time step t in zone z [MWh DC] | |
| ”Behind the inverter” energy generated by the storage component of technology y at time step t in zone z [MWh DC] | |
| Energy injected into the grid by technology y at time step t in zone z [MWh AC] | |
| ”Behind the inverter” energy withdrawn from the VRE and grid to charge the storage component for technology y at time step t in zone z [MWh DC] | |
| Energy withdrawn from the grid for the technology y (the storage component) at time step t in zone z [MWh AC] | |
| Stored energy level of the storage component of technology y at the end of time step t in zone z [MWh] |
Objective Function Addition: The following mathematical formulation was added to the least-cost objective function for the costs of co-located VRE and storage resources:
| (1) |
There are three decision variables related to the capacity of each resource, rather than one or two decision variables used to model other resources. Grid connection decision variables were added to this new formulation to ensure that there is a more-detailed representation and separation of the DC and AC connection. The fixed operational & maintenance (O&M) and investment costs account for power capacity decisions on the VRE technology, energy capacity decisions on the storage technology, and power capacity decisions on the grid connection. The option for variable costs also exists.
Constraints: The following constraints were created for the set of resources within the VRE-STOR module.
-
1.
Total Capacity: The total capacity is the sum of the existing capacity plus the new installed capacity minus any retired capacity for the VRE component, storage component, and grid connection component of each resource.
(2a) (2b) (2c) -
2.
Retired Capacity: The retired capacity cannot exceed existing capacity for each generator.
(3a) (3b) (3c) -
3.
Maximum Capacity: The maximum capacity can be defined for each component of the resource.
(4a) (4b) (4c) -
4.
Minimum Capacity: The minimum capacity can be defined for each component of the resource.
(5a) (5b) (5c) -
5.
Inverter Ratio for VRE & Grid: The inverter ratio between the VRE technology and grid connection capacity can be defined if a fixed ratio exists.
(6) -
6.
Energy Balance: Energy balance ensuring DC power (discharge of battery, PV generation, and charge of battery) produced equals the net AC exports & imports. This equation is essential to convert the ”behind the meter” generation occurring from both the VRE-component and storage component to grid imported/exported generation.
(7) -
7.
Start of Charge (SOC): This constraint calculates the battery component’s state of charge during each time period.
(8) -
8.
Generation Maximum: The maximum power generated per hour by the VRE component must be less than the hourly capacity factor times the total installed capacity.
(9) -
9.
SOC Maximum: The state of charge must be constrained by the maximum energy capacity.
(10) -
10.
Discharge & Charge Maximum: The maximum DC storage charge power and maximum DC storage discharge must be less than the energy storage capacity multiplied by the c-rate of the battery (the maximum charge rate per hour).
(11) -
11.
Grid Export Maximum: The maximum grid exports and imports must be less than the grid capacity.
(12)
This formulation enables any study in any region to utilize these modeling capabilities in GenX. For the scope of the case study, this module was applied to one test system: the Western Interconnection.
2.2 Overview of Case Study
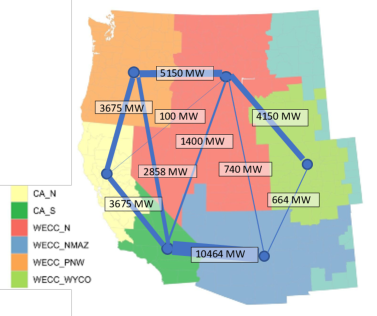
Existing transmission capacities between regions are showcased. The six regions aggregate various subregions from the EPA’s Integrated Planning Model mapping. The region CA_N includes WEC_CALN and WEC_BANC in northern California. The region CA_S is composed of the subregions WECC_SCE, WEC_LADW, WEC_SDGE, and WECC_IID in southern California. The region WECC_NMAZ aggregates WECC_AZ, WECC_NM, and WECC_SNV in Arizona, New Mexico, and southern Nevada. The region WECC_PNW includes Washington, Oregon, some of northern California, and some of northern Idaho. The region WECC_N aggregates WECC_ID, WECC_MT, WECC_NNV, and WECC_UT in Idaho, Montana, northern Nevada, and Utah. The last region WECC_WYCO includes WECC_WY and WECC_CO in Wyoming and Colorado [38].
This case study focused on a six-region model of the Western Interconnection (WECC) in the U.S. for 2030, as showcased in Fig. 2. This model utilizes inter-regional transport power flow constraints, hourly resolution of resource capacity factors and demand, linearized unit commitment decisions for thermal generators, and time domain reduction methods for the number of weeks modeled of a full year [28, 34]. Linearized unit commitment decisions were used to account for thermal generator decisions. This linear relaxation of discrete unit start-up and shut-down decisions enables the use of more computationally efficient linear programming solution algorithms, preserving computational capacity to enable more granular modeling of other dimensions (i.e. resources, space, and time) and entails limited abstraction error [39]. A full year model was ran for some scenarios and was used to compare results of time domain reduction methods for 5, 10, 15, 20, 25, and 30 representative weeks. These experiments were conducted to ensure that time domain reduced methods behaved similarly to a model of full year with hourly resolution. 15 representative weeks were selected for the final scenario runs due to the size, solve time, and accuracy of the problem in comparison to a full year, while enabling faster solver time and more extensive sensitivity analysis (see B.1).
Data and input files were setup via PowerGenome, an open-source scenario generation tool for electricity system capacity expansion models that aggregates data from numerous sources (including the Energy Information Administration (EIA), National Renewable Energy Laboratory (NREL), and Environmental Protection Agency (EPA)) to format GenX input files [40]. More information on PowerGenome can be found in A.1. The follow assumptions about the data were made:
-
1.
Batteries are assumed to have a c-rate equivalent to 0.25 (e.g. approximately four-hour battery charge/discharge duration from an empty/full state of charge) [12].
-
2.
Inverter efficiency is considered to be 90%, and battery charging and discharging efficiencies are assumed to be 95%.
-
3.
The real weighted average cost of capital (WACC) used for calculations was also averaged during the planning period of 2020 to 2030 from NREL’s ATB and calculated to be 2.4% for solar and batteries and 3.3% for wind [41].
-
4.
The following technology resources could not have new capacity built in the model for 2030: geothermal, biomass, or biopower, but there were options to expand natural gas with carbon capture and sequestration (with a 90% CO2 capture rate) and nuclear resources.
-
5.
The following technologies were eligible to meet state RPS standards: onshore wind, offshore wind, solar, biomass, small hydro, and geothermal resources. The following technologies were eligible to meet the 80% CES standards: all technologies listed above, conventional hydro, nuclear, and NG with 90% CCS (with partial credit). Partial crediting for each MWh of NG with 90% CCS was calculated as the ratio of the emission rates between new NG technologies built with and without the 90% CCS component (88% for partial crediting). Alternative policy rules may apply in practice and in different jurisdictions for accounting for NG with 90% CCS in the CES.
-
6.
Demand profiles and projections were from NREL with the assumption of a high electrification scenario for 2030 [42].
-
7.
Data from NREL on flexible demand was available for heating, cooling, and electric vehicles, but only electric vehicle load shifting is assumed to have significant demand to be considered in 2030. Flexible demand data from NREL under the enhanced flexible demand profile was used [43].
-
8.
The hourly AC capacity factors for solar PV resources were outputted by PowerGenome and converted to DC terms by removing the impact of inverter losses (assumed to be 10%) and accounting for the standard DC:AC oversizing ratio of 1.3:1. Maximum capacity additions by candidate project area were also converted from AC to DC capacity limits accordingly.
-
9.
Capacity reserve margins in GenX were implemented by aggregating the six zones into four regions to ensure reliability standards were met. California has a 13.7% reserve margin requirement. Oregon, Washington, Idaho, Montana, northern Nevada, and Utah have a 15.7% reserve margin requirement. Wyoming and Colorado have a 13% reserve margin requirement. New Mexico and Arizona have a 10% reserve margin requirement [44].
2.3 Case Study Setup
Cost Analysis
|
|
|||
| Solar Capital Costs ($/kW) | 654 | 707 | ||
| Grid Connection Capital Costs ($/kW) | 115 | 118 | ||
| Solar Fixed O&M Costs ($/kW/yr) | 8 | 9 | ||
| Grid Connection Fixed O&M Costs ($/kW/yr) | 3 | 4 | ||
| Wind Capital Costs ($/kW) | 1208 | 1391 | ||
| Grid Connection (Standalone) Capital Costs ($/kW) | 77 | 77 | ||
| Grid Connection (Co-located) Capital Costs ($/kW) | 115 | 118 | ||
| Wind Fixed O&M Costs ($/kW/yr) | 34 | 36 | ||
| Grid Connection Fixed O&M Costs ($/kW/yr) | 3 | 4 | ||
| Battery Capital Costs ($/kWh) | 147 | 189 | ||
| Battery Fixed O&M Costs ($/kWh/yr) | 4 | 5 | ||
| Grid Connection (Standalone) Capital Costs ($/kW) | 40-89 | 40-89 | ||
| Grid Connection (Standalone) Fixed O&M Costs ($/kW/yr) | 3 | 4 |
The first grouping of the table showcases the solar DC and grid connection AC overnight capital and fixed O&M costs for standalone and co-located solar and storage resources. The middle grouping of the table includes wind DC, grid connection AC (for standalone wind resources), and grid connection AC (for co-located technologies) overnight capital and fixed O&M costs for standalone and co-located wind and storage resources. There are different grid connection costs between standalone and co-located wind technologies since co-located wind technologies also include a bi-directional inverter that is not built in standalone resources. The bottom grouping of the table showcases the battery (in both standalone and co-located scenarios) and grid connection AC (for standalone storage resources) overnight capital and fixed O&M costs. The variation in grid connection costs for standalone storage is due to the difference in spur line costs between the different zones in the Western Interconnection. The two cost sensitivities are also displayed: 1) low VRE & battery cost projections, and 2) mid VRE & battery cost projections according to NREL’s ATB [41]. These costs do not include regional multipliers, lifespan, or WACC. Additionally, grid connection overnight capital costs displayed in the table only incorporate substation and inverter costs, as additional interconnection costs are site-dependent. Information on parameter assumptions to find annuitized costs for different technologies can be found in Table 6.
Cost breakdowns for co-located (aka ”hybrid”) wind or solar and battery storage projects were calculated using various NREL reports [12, 41, 45]. A recent NREL report showcased a bottom-up analysis of DC-coupled co-located PV and battery resources. This report was used to calculate bottom-up overnight capital and fixed O&M costs for solar PV, battery, and wind resources [12]. The analysis concluded with the following costs inputted into the model: investment and fixed O&M costs for VRE resources ($/MW DC/year), investment and fixed O&M costs for batteries ($/MWh/year), and investment and fixed O&M costs for grid connection ($/MW AC/year). Table 5 showcases the finalized 2030 overnight capital cost and fixed O&M cost breakdown for the two scenarios: low VRE & battery costs and mid VRE & battery costs.
A full description of how all costs for solar PV, wind, storage, and grid connection investment and fixed O&M costs were calculated step-by-step can be found in A.3. With the ability to model standalone solar, co-located solar and storage, and standalone storage resources, investment costs were calculated and split by resource. Utilizing a recent NREL report on the AC cost breakdown of 2018 costs for solar PV, batteries, and grid connection costs, the DC and AC components and costs were split into 1) solar PV module costs, 2) battery module costs, 3) inverter costs, and 4) substation costs [12]. Costs were projected for 2030 based upon NREL’s Annual Technology Baseline (ATB) projections and annuitized with former tax credit policies applied [41]. Costs for standalone storage and co-located storage resources were differentiated based upon previous tax credits and assumed spur line costs. A full summary of the assumptions for these calculations can be found in Table 6. Fixed O&M costs for solar, storage, and grid connection costs were calculated based upon previous NREL reports and NREL ATB [41, 45].
|
|
|
|
|
|
|
|
|
|
|||||||||||||
|---|---|---|---|---|---|---|---|---|---|---|---|---|---|---|---|---|---|---|---|---|---|---|
| WACC (%) | 2.4 | 2.4 | 2.4 | 4.2 | 2.4 | 2.4 | 2.4 | 3.3 | 2.4 | 4.2 | ||||||||||||
| Lifespan (years) | 30 | 15 | 30 | 60 | 15 | 30 | 60 | 30 | 30 | 60 | ||||||||||||
| Regional | PV | Battery | Battery | PV | Battery | Battery | PV | Wind | Battery | PV | ||||||||||||
| Multipliers | ||||||||||||||||||||||
| ITC (%) | 10 | 10 | 10 | 10 | - | - | - | - | - | - |
The left side of the table showcases solar, battery, and grid connection cost breakdown assumptions for standalone solar and co-located solar and storage resources. The center of the table showcases storage and grid connection cost breakdown assumptions for standalone storage resources. The right side of the table showcases wind and grid connection cost breakdown assumptions for standalone wind and co-located wind and storage resources.
For wind costs, grid connection costs from the DC-AC breakdown in the solar PV calculations were utilized and subtracted from wind AC costs to isolate AC and DC cost components of wind technologies. Utilizing NREL ATB assumptions, the 2018 costs for wind resources were projected for 2030 assumptions and annuitized [41]. Fixed O&M costs are from NREL ATB with grid connection O&M costs subtracted out [41].
There are no fuel costs for VRE or battery resources. Nuclear fuel costs were calculated based upon PowerGenome calculations [40]. Monthly natural gas fuel costs were collected by state from 2020 EIA estimates, projected to 2030 costs, and aggregated into two natural gas fuel costs based upon the region: Pacific (California natural gas fuel costs) and Rockies (average of Idaho, Montana, Nevada, New Mexico, and Utah natural gas fuel costs) [46]. For natural gas with 90% CCS resources, a CO2 disposal cost of $23/ton is used [6].
Scenario Description
| Run |
|
|
|
||||
|---|---|---|---|---|---|---|---|
| 1 | Current Policies | Mid | Fixed Interconnection | ||||
| 2 | Current Policies | Low | Fixed Interconnection | ||||
| 3 | Current Policies | Mid | Optimized Interconnection | ||||
| 4 | Current Policies | Low | Optimized Interconnection | ||||
| 5 | Current Policies | Mid | Co-Located Storage | ||||
| 6 | Current Policies | Low | Co-Located Storage | ||||
| 7 | 80% CES | Mid | Fixed Interconnection | ||||
| 8 | 80% CES | Low | Fixed Interconnection | ||||
| 9 | 80% CES | Mid | Optimized Interconnection | ||||
| 10 | 80% CES | Low | Optimized Interconnection | ||||
| 11 | 80% CES | Mid | Co-Located Storage | ||||
| 12 | 80% CES | Low | Co-Located Storage |
This case study has 12 finalized runs, varying the scenario, policy, and cost trajectories of VREs in 2030. We ran three scenarios to compare how modeling VREs with optimized interconnection and co-location of storage impacts the results. The first scenario, the fixed interconnection scenario, assumes that there is 1.3 MW of PV built for every 1 MW of grid connection built and 1 MW of wind built for every 1 MW of grid connection built [12, 13]. Additionally, the fixed interconnection scenario models only standalone options to build batteries, PV, and wind, similar to other capacity expansion models. This scenario represents standard capacity expansion modeling practices. The second scenario, the optimized interconnection scenario, does not constrain the capacity of grid connection built in comparison to the capacity of PV or wind built to enable grid connection capacity co-optimization. This scenario only allows standalone options to build batteries, PV, and wind to compare how co-optimizing grid connection would change capacity expansion of VREs. The third scenario, the new co-located storage model scenario, assumes the optimized interconnection scenario with the ability to co-locate PV and storage or wind and storage resources. Both standalone resources and co-located VRE and storage can be built in this scenario. We run all three of the above scenarios over two different policy options: current policies for State Renewable Portfolio standards (RPS) and an 80% CES for 2030 to showcase decarbonization pathways inclusive of VRE and storage technology options. The current policies scenario follows RPS requirements per region: 60% for CA_N and CA_S, 9.2% for WECC_N, 20.1% for WECC_NMAZ, 16.8% for WECC_PNW, 15.3% for WECC_WYCO. These RPS requirements were calculated by aggregating state RPS requirements over the six zones based upon demand profiles [47]. Using NREL’s ATB scenarios, two different VRE and energy storage cost projections were utilized: moderate and low-cost scenarios [41]. These scenarios assume U.S. tax credit policy prior to passage of the Inflation Reduction Act, which is a 10% investment tax credit (ITC) for solar and co-located solar PV and storage [48]. A list of all of the runs can be found in Table 7.
2.4 Downscaling and Post-Processing Results
For potential solar and wind candidate project areas (CPAs) selected in this project, candidate projects were identified and post-processed to consider population density, human modification index, prime farmland, land cover type, existing and planned facilities, and airspace and military siting factors. To run GenX, numerous sites were aggregated together as a single resource ’cluster’ to decrease the dimensionality of the problem. The levelized cost of electricity (LCOE) was calculated for each site, inclusive of transmission interconnection and spur line costs for each CPA. After GenX was run, the results were downscaled to determine the exact CPAs and transmission pathways used to build new capacity. For transmission, both inter-regional and intra-regional transmission lines were modeled. Similarly, the new wind and solar sites built were downscaled in GenX, assuming the CPAs in each cluster are built out in order from lowest to highest LCOE. For more information, the methodology of the downscaling of resource sites and transmission expansion can be found here [49].
3 Results & Discussion
3.1 Co-optimized Design of Renewable Energy and Transmission Capacity
Most capacity expansion models assume a fixed ratio of solar PV or wind to grid connection capacity (1.3 MW PV: 1 MW grid connection and 1 MW wind: 1 MW grid connection) [23, 27, 29, 30]. However, we are already witnessing the further oversizing of solar PV to inverter capacity and specific power declines for wind projects in the U.S. interconnection queue [17, 18]. We thus enable GenX to determine the capacity of solar PV or wind to grid connection to investigate what the optimal sizing of VREs should be, resource capacity and siting decisions, and intra- and inter-regional transmission trends for the Western Interconnection in 2030.

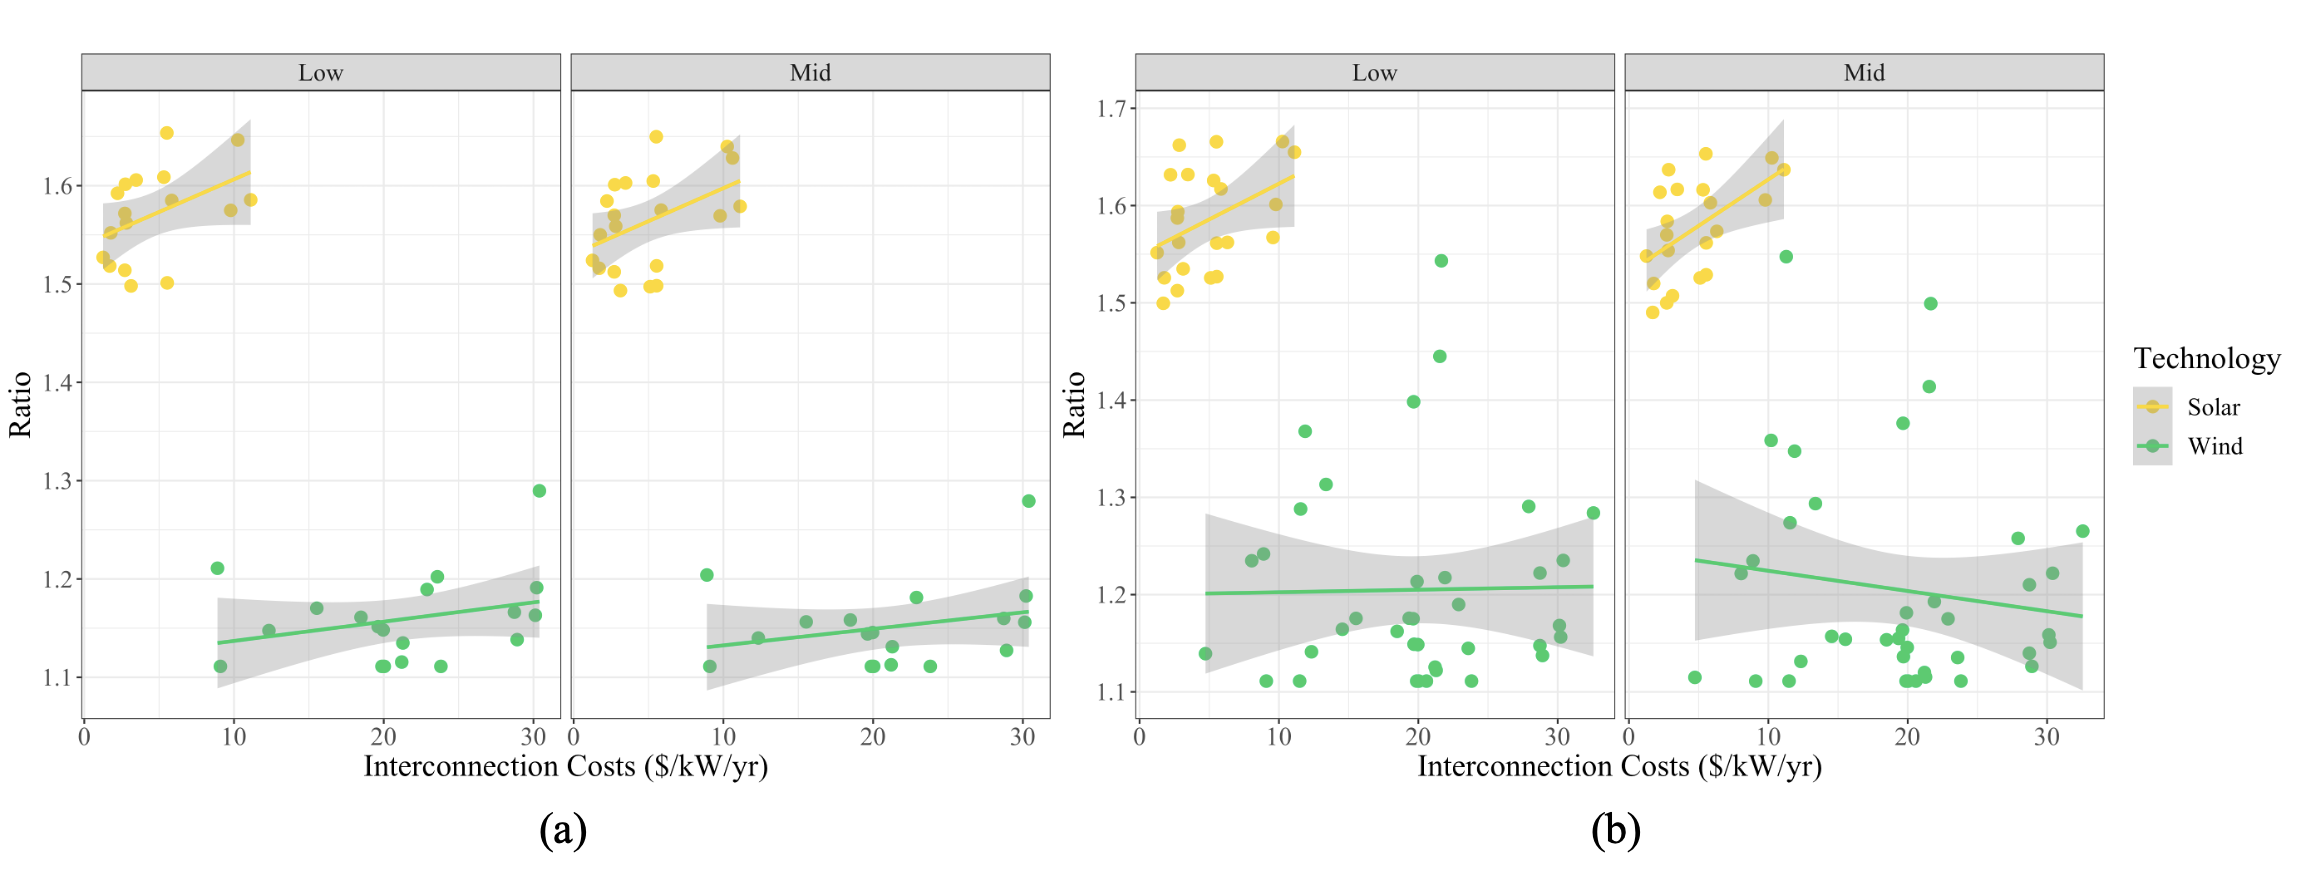
(a) Average Ratio of PV to Grid Connection Capacity, (b) Average Ratio of Wind to Grid Connection Capacity. The red dashed line represents the fixed assumed ratio of solar PV (1.3) or wind (1.0) to grid connection capacity that most capacity expansion models assume.
GenX further oversizes VREs to an average of 1.6 MW PV: 1 MW grid connection and 1.2 MW wind: 1 MW grid connection across all policy and cost sensitivities (Fig. 3). These sites are self-curtailing further to reduce the amount of transmission connection built. This trend occurs because solar PV modules and wind turbines are naturally falling in costs but interconnection costs continue to rise, resulting in the model choosing to build and curtail VREs more rather than expanding the grid connection. As showcased in Fig. 2, the optimized ratio of solar PV or wind to grid connection capacity is positively correlated with the annuitized spur line costs (a sub-component of the total grid connection costs to connect the VRE resource to the nearest substation). The solar PV to grid connection ratio increases as interconnection costs rise in both the state RPS and 80% CES scenarios across cost sensitivities (Fig. 2). Meanwhile, the wind to grid connection ratio is positively correlated in the state RPS scenarios where there are fewer wind sites built, but there is not a strongly correlated relationship in the 80% CES scenarios. This difference occurs due to the higher variation in the underlying wind variability profiles and the number of hours that the wind power generation is greater than the grid connection capacity, which increases the noise that factors into the sizing of wind sites. We conclude that the model economizes on the natural cost declines of VRE technologies relative to the interconnection to determine the optimal buildout of these resources.
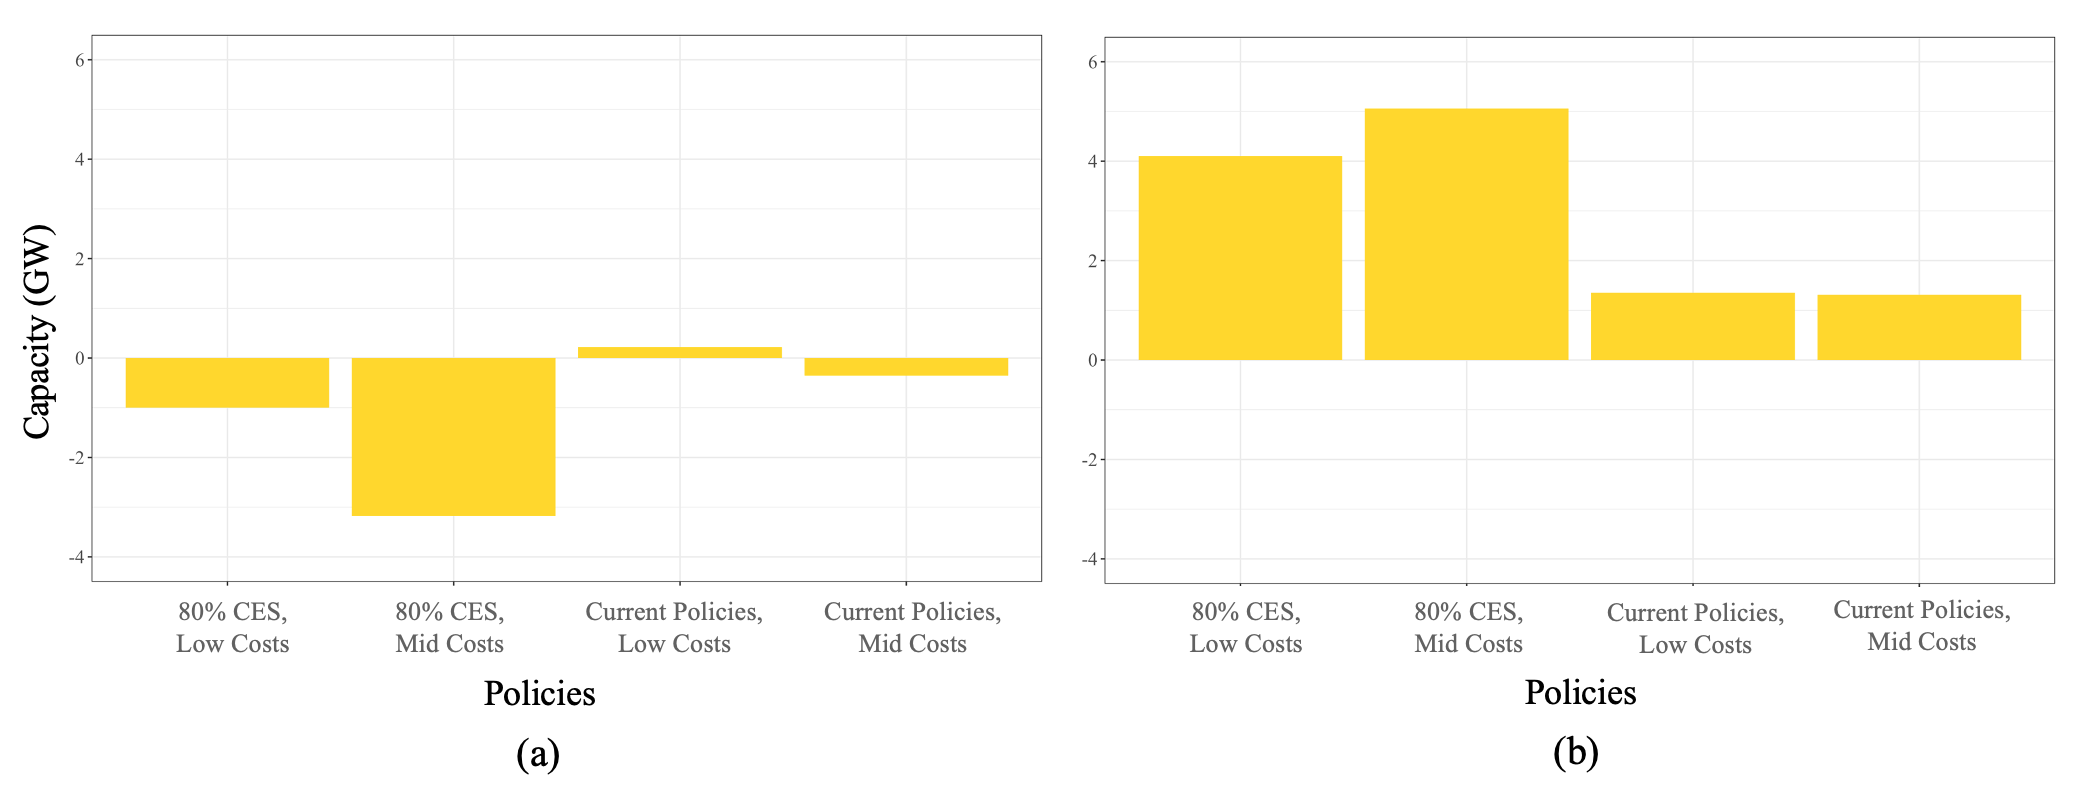
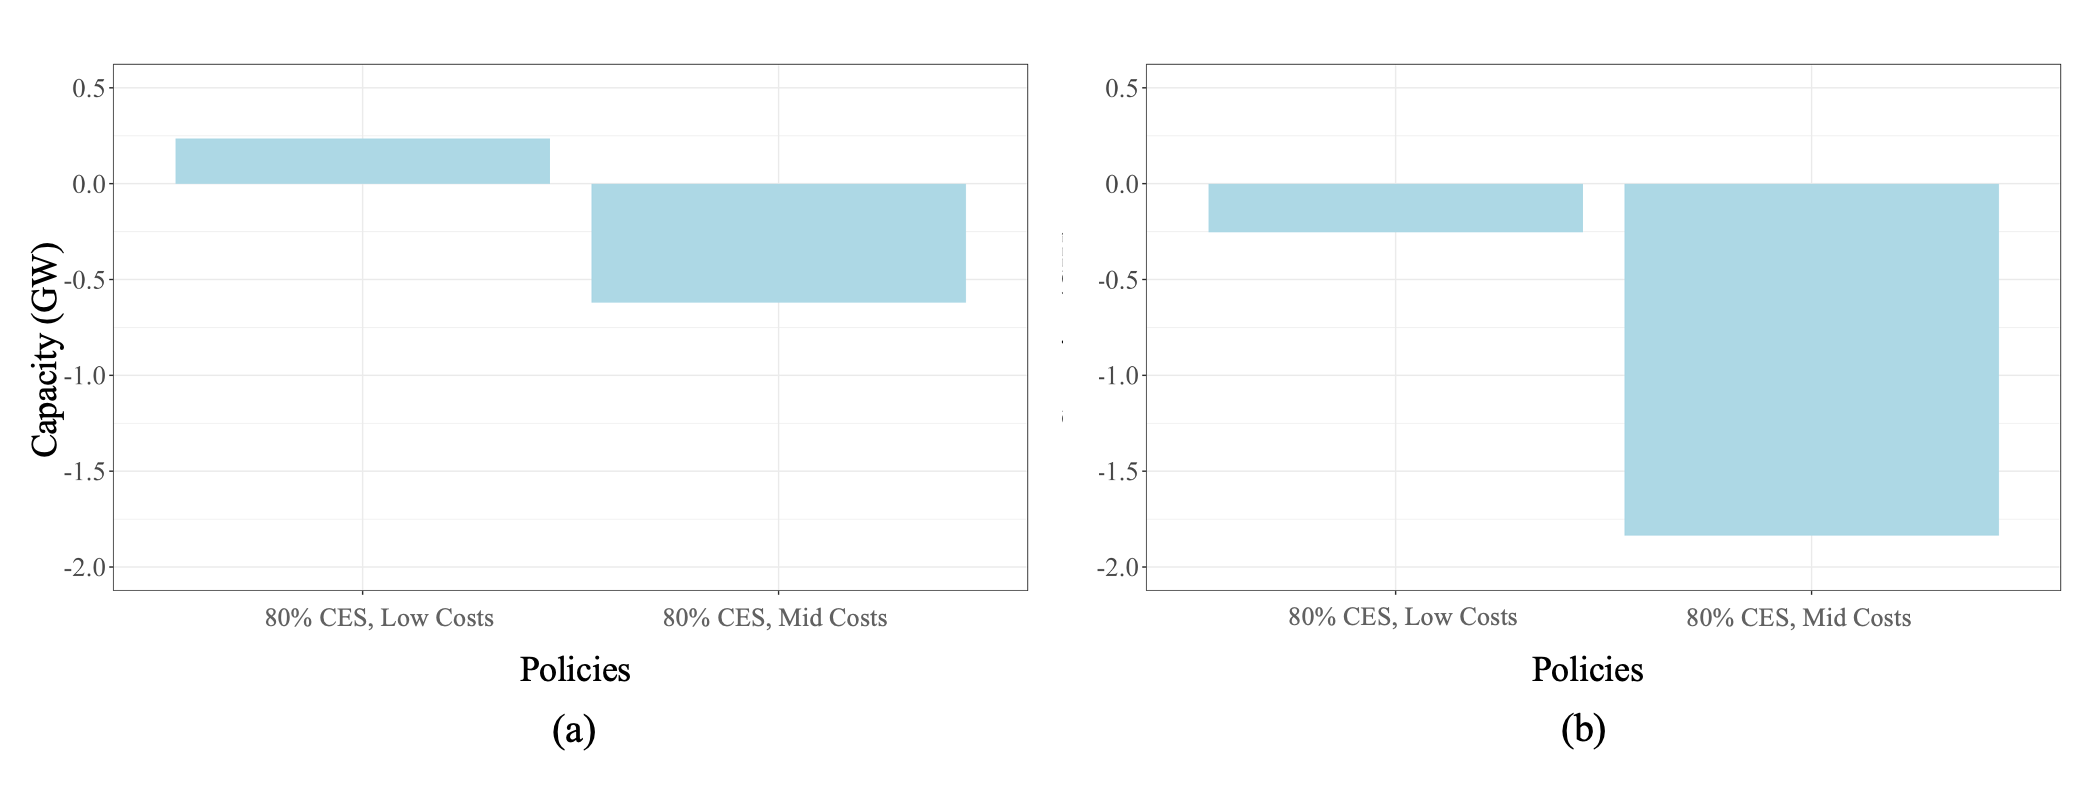
This further oversizing of VREs also affects the resource portfolio. System-wide new solar and battery capacity built does not vary significantly between the fixed interconnection and optimized interconnection scenarios across policies and costs. However, we find the optimized interconnection scenario builds an increased amount of wind resources across cost sensitivities (Fig. 25(b) and Fig. 26(b) showcase a 4.0-5.5% increase in the 80% CES scenarios, mainly in Arizona and New Mexico). We see a preference in resource buildout of wind relative to solar PV because wind sites require longer average transmission distances and higher interconnection costs. Wind deployment thus benefits more from the ability to optimally size intra-regional transmission and grid connection.
We find a 0.4-1.2% ($85-271 million) reduction in total costs and 14-19% decrease in capacity for intra-regional transmission and grid connection across all scenarios when further oversizing VREs (Fig. 8). However, the optimized interconnection scenario has an ambiguous effect on inter-regional transmission (11% increase in the 80% CES, low-cost scenario and 7.5% decrease in the 80% CES, mid-cost scenario). Since the optimized interconnection scenario privileges wind and the wind capacity siting decisions differ between the low- and mid-cost sensitivities, inter-regional transmission trends vary between the scenarios.
3.2 Co-located Renewable Energy and Battery Design and Deployment
Most electricity system planning models do not enable the co-location of VREs and lithium-ion batteries, which contrasts with real-world project development and limits the abilities of storage to substitute for transmission in these models [23, 27, 29, 30]. We expand upon the optimized interconnection capabilities, adding and analyzing the co-location option in GenX where solar PV and wind resources can be sited at the same physical interconnection point as lithium-ion battery packs. We analyze how resource buildout, particularly storage, is affected, the optimal sizing of co-located technologies, trade-offs in how solar PV and wind are sited, and the impacts of co-location on inter-regional transmission buildout.
|
|
|
|
|||||||||||||
|---|---|---|---|---|---|---|---|---|---|---|---|---|---|---|---|---|
| Battery | 13.4 | 22.4 [67%] | 1.2 | 7.1 | ||||||||||||
| Intra-Regional | 111 | 83 [-25%] | 110 | 87 [-20%] | ||||||||||||
| Inter-Regional | 849 | 743 [-12%] | 2430 | 1686 [-31%] |
Lithium-ion battery expansion in the 80% CES co-located storage scenarios causes a 20-25% decrease in intra-regional transmission and 12-31% decline in inter-regional transmission expansion. Only 80% CES scenarios are shown since current policies have negligible changes in transmission expansion. Percentages in brackets indicate percent increase or decrease from the respective low- or mid-cost, fixed interconnection scenario.
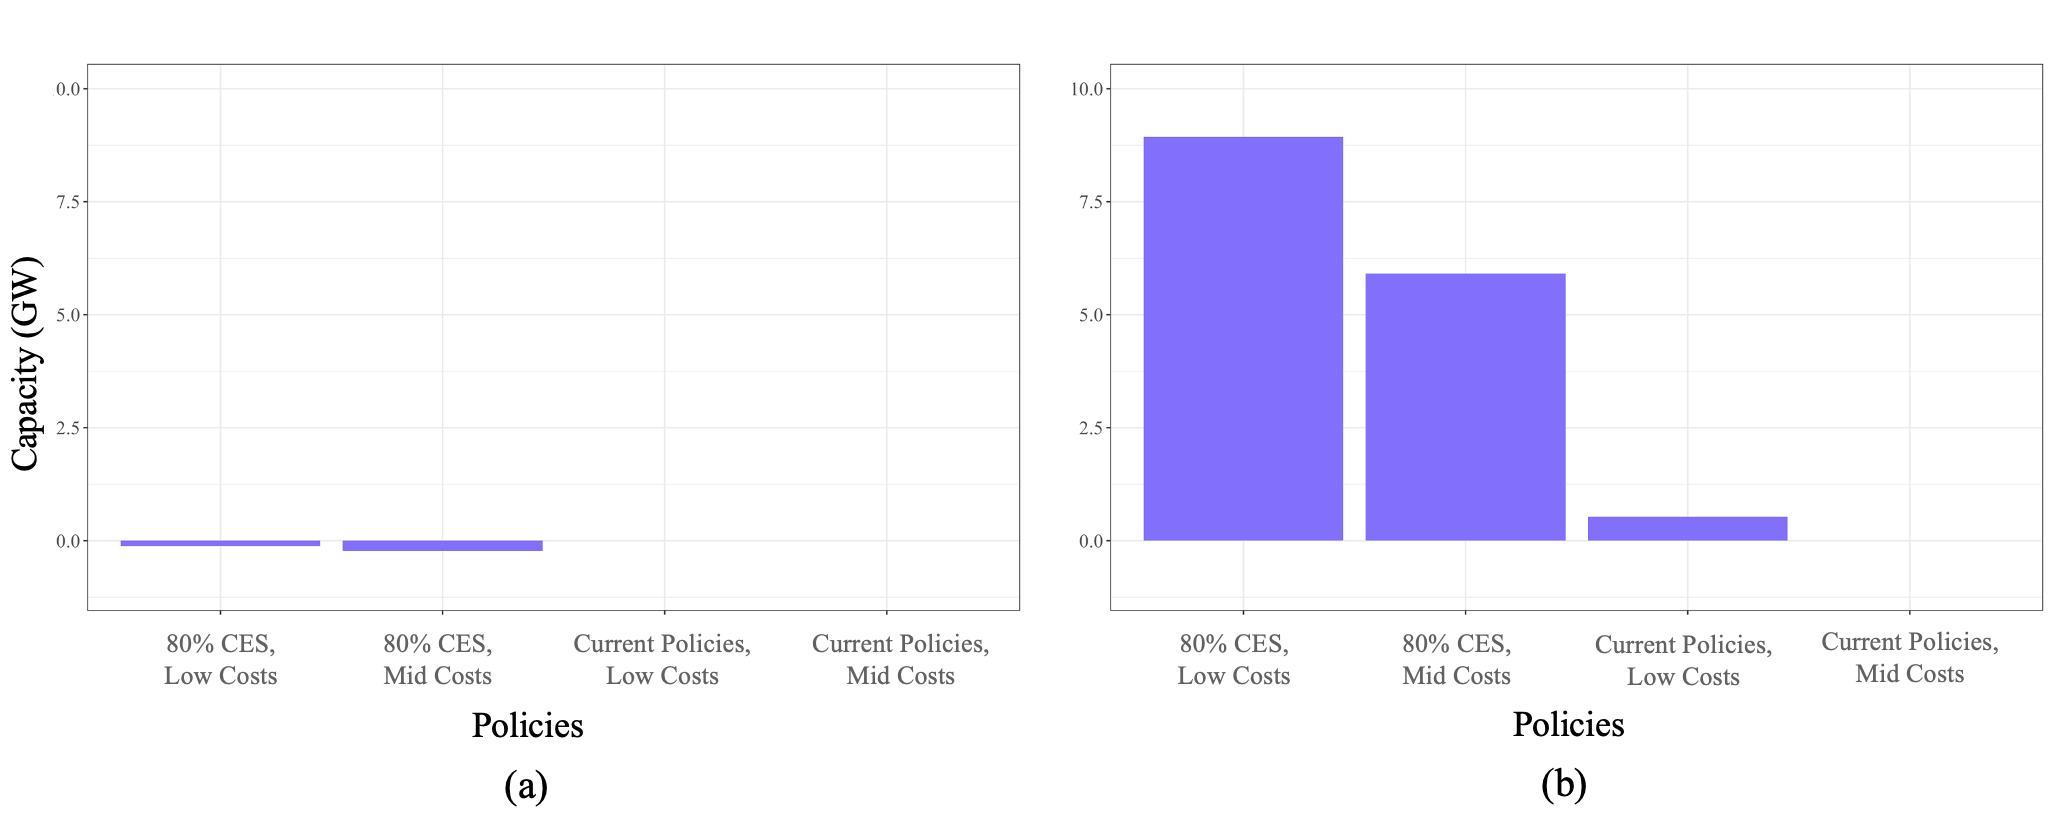
Battery capacity deployment significantly increases (1.7 times in the 80% CES, low-cost scenario, 6 times in the 80% CES, mid-cost scenario) between the fixed and co-located storage scenarios (Table 8). We additionally find that co-locating VRE and storage resources can reduce the intra-regional transmission reinforcements needed (20-25% decrease in capacity) and total system costs (-0.4-2% or -$85-508 million) since the strategic siting of battery resources can offset transmission upgrades. The optimized ratio of solar PV or wind to grid connection capacity is 1.6-1.9 MW PV: 1 MW grid connection and 1.2 MW wind: 1 MW grid connection on average with the option to co-locate resources. With the ability to co-locate storage, the oversizing of solar capacity further increases compared to the optimized interconnection scenarios since the maximum generation of solar PV resources can charge batteries rather than generate electricity that is directly sent to the grid, reducing the needed grid connection capacity. These results clearly demonstrate the strong substitutability of behind-the-meter storage for grid interconnection capacity, an important dynamic that is not captured in models that do not permit co-location of storage and VREs.
We additionally find that all of the battery capacity built in the 80% CES scenarios, regardless of the cost of batteries, is co-located with either solar or wind resources. No standalone battery is built with the co-located storage option available, reflecting the additional value and system cost savings that co-located batteries can provide in near-term decarbonization strategies.
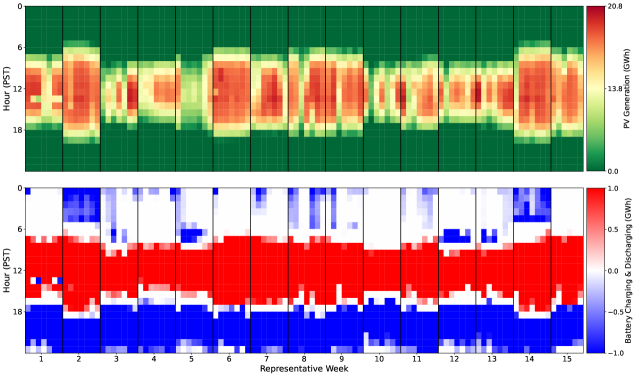
The two plots showcase the heat maps of the 80% CES, low-cost, co-located storage scenario of (a) Solar PV generation of the largest solar PV-battery cluster in the Western Interconnection & CA_N region (GWh), and (b) The co-located battery charging (+1.0) and discharging (-1.0) at the largest solar PV-battery cluster in the CA_N region (GWh). For the CA_N region’s largest cluster of a co-located solar PV-battery resource built, 26.8 GW of PV DC, 27.1 GWh of battery storage DC, and 13.8 GW of grid connection AC are built. The color shifts from green to red in the top plot of solar PV generation to showcase when solar PV generation is exceeding the grid connection capacity and thus charges the battery instead. Meanwhile, the bottom plot of battery charging and discharging is normalized between -1.0 to 1.0, where the blue region showcases the discharging of the battery and the red region showcases the charging of the battery.
The increase in battery capacity (1.7-6 times increase) correlates with the growth in solar PV deployment (+3.5-4.8% in 80% CES scenarios, mainly in California as indicated in Fig. 25(a) and Fig. 26(a)). Virtually all (99-100%) of the battery capacity built across the 80% CES scenarios is co-located with solar PV. The complementarity of solar PV and co-located batteries is explained by observing that PV produces peak power output during a consistent window of time (e.g. mid-day), which tends to reduce the marginal value of electricity production and congest many transmission lines. Fig. 3(a) showcases the inversely correlated relationship between locational marginal prices and grid connection usage for each PV cluster. As indicated by Fig. 4, periods of high solar PV output thus correspond to periods of low electricity prices ideal to charge lithium-ion batteries (in red) which can then be discharged in evening hours (in blue) when prices for electricity are higher and transmission interconnection for solar PV sites are entirely unconstrained. Fig. 4 shows PV generation, battery charging, and battery discharging for the largest co-located PV-battery site in the Western Interconnection under the 80% CES, low-cost, co-located storage scenario. The largest co-located PV-battery site in each of the six zones follows similar trends of PV generation charging the battery during the day and discharging during evening peak and night hours (B.9). We conclude that co-locating solar and batteries thus enjoys lower overall interconnection costs, since the battery can make full use of the solar PV site’s interconnection in evening hours and solar PV can reduce interconnection needed during mid-day by charging the storage instead of exporting peak output. Solar and battery configurations also benefit from a modeled 10% ITC available to storage resources only if co-located with solar PV (consistent with the policy environment prior to passage of the Inflation Reduction Act of 2022), although this is likely secondary to the significant transmission cost savings enjoyed by co-located projects.
Meanwhile, with storage co-location making solar PV projects comparatively more valuable, wind deployment declines (0.9-1.6% in the 80% CES scenarios as indicated by Fig. 25(b) and Fig. 26(b)). As indicated by Fig. 3(b), wind variability is not as negatively correlated with the locational marginal prices because production profiles for wind projects are more irregular than solar PV. Additionally, wind energy often has a non-zero output at times when storage discharge would be required, creating competition between storage and wind resources for transmission interconnection capacity and making battery co-location less desirable than solar PV sites.
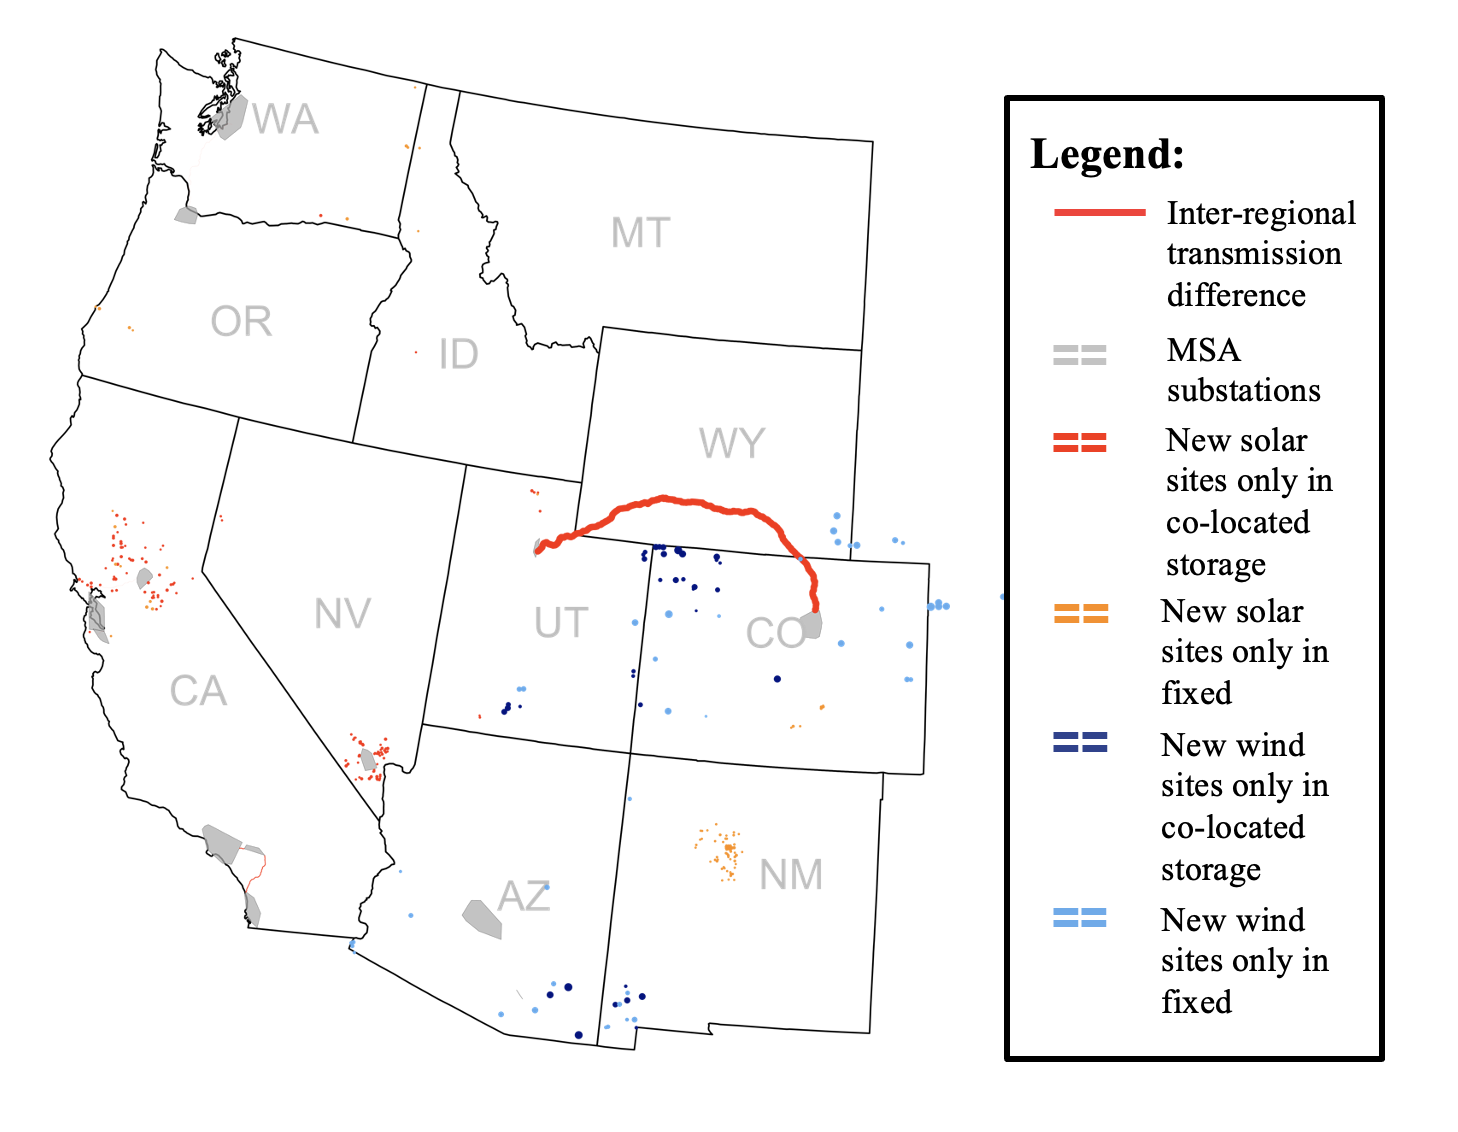
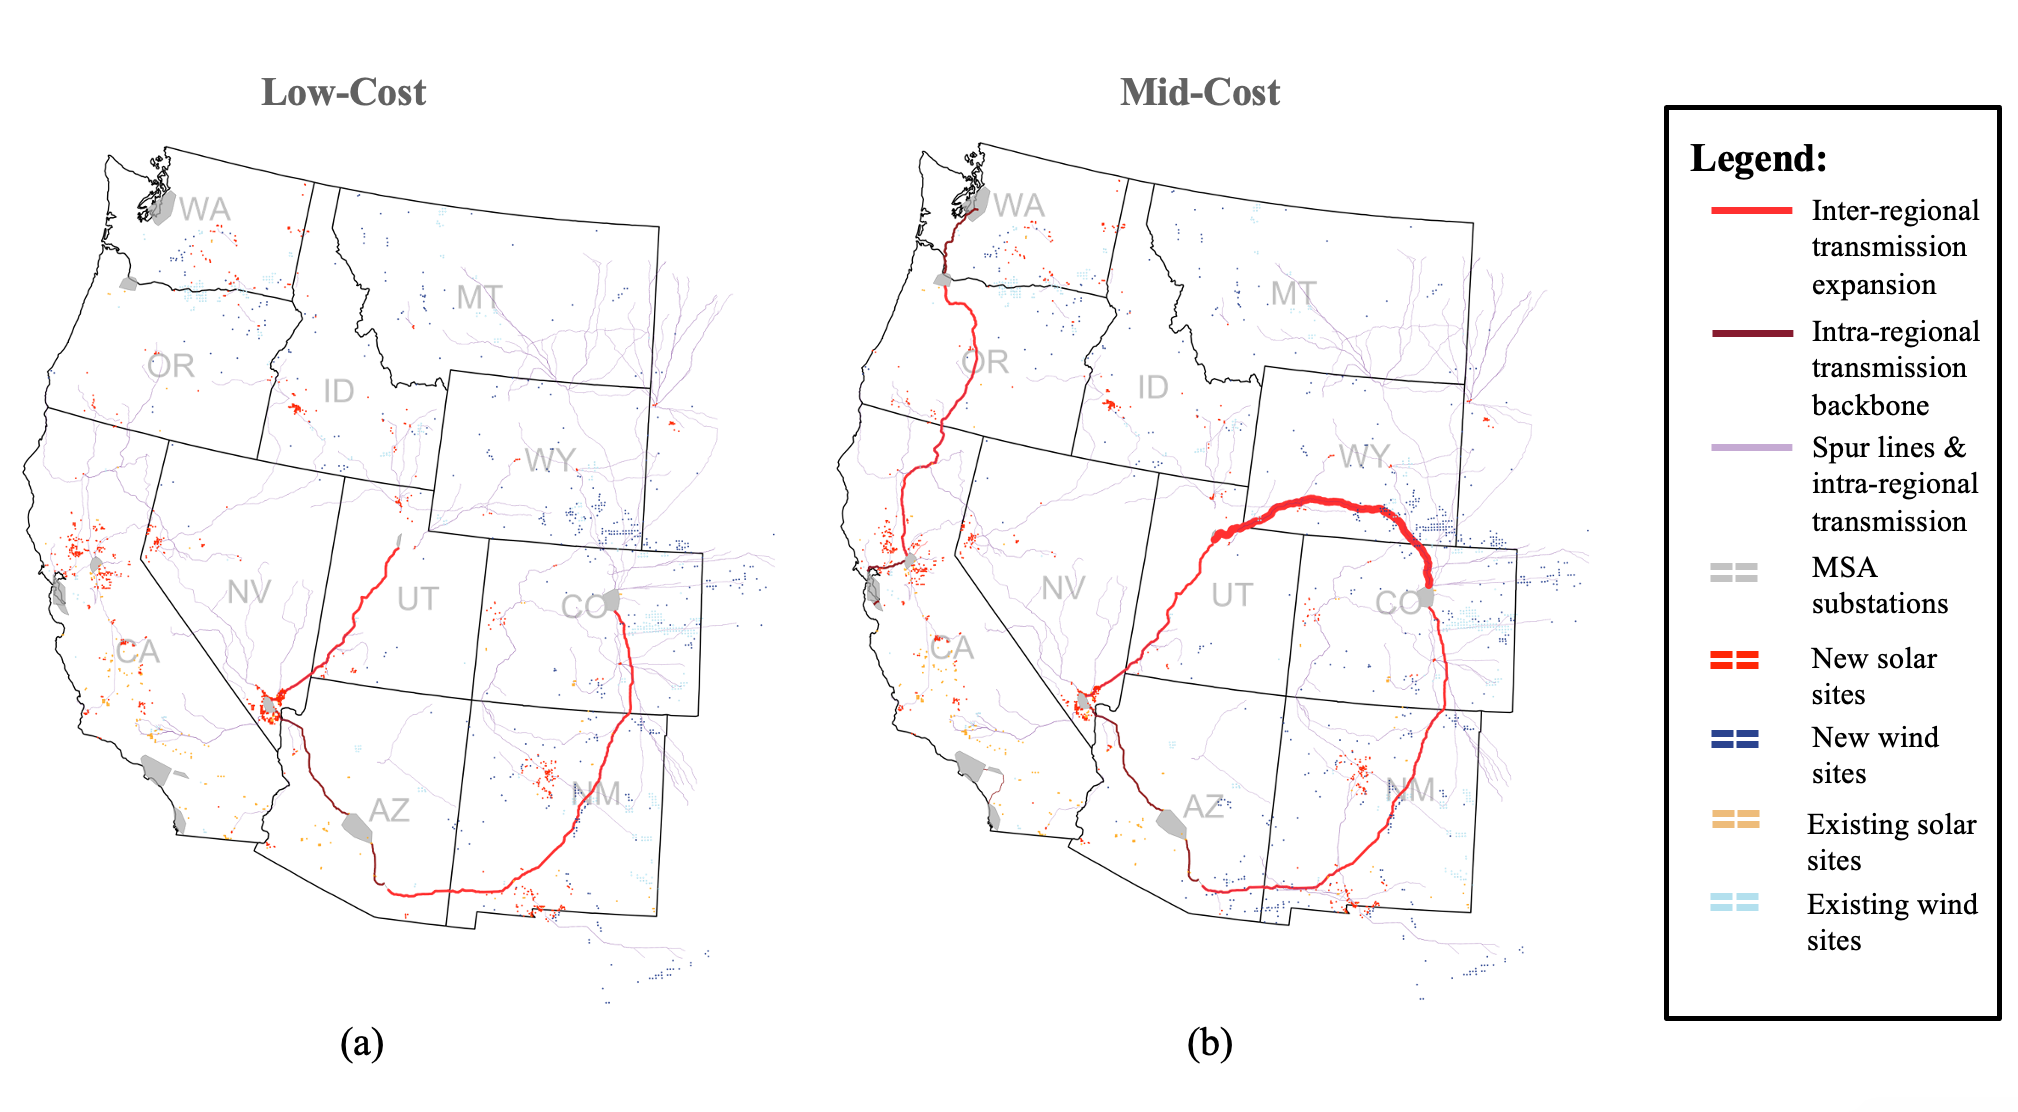
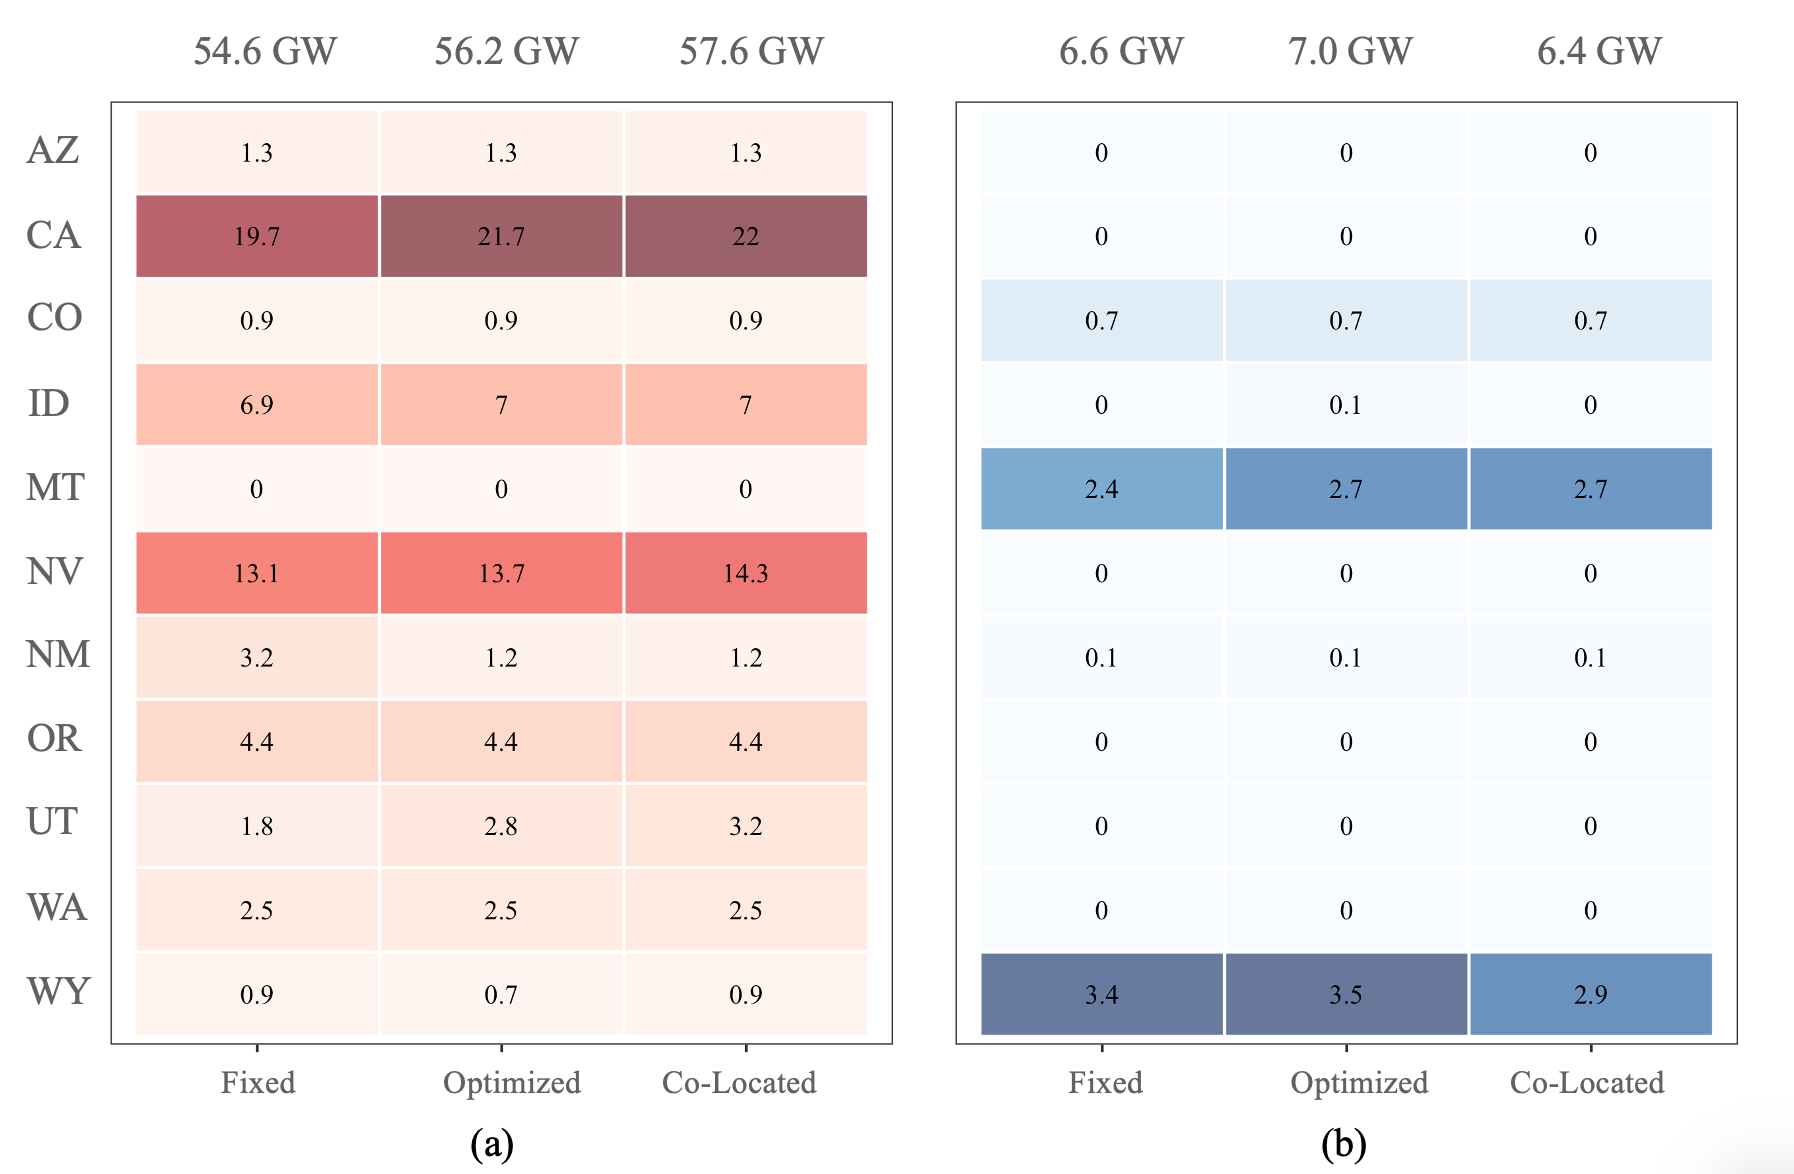
The red inter-regional transmission line represents the decline in inter-regional transmission built in the co-located storage scenario. The darker red and blue points represent the solar PV and wind sites respectively only built in the co-located storage scenario, while the lighter orange and blue points indicate the solar PV and wind sites respectively only built in the fixed interconnection scenario.
As co-location is better suited for solar PV sites than wind sites, modeling co-located storage results in a shift in capacity towards solar PV sites that tend to exist closer to populated areas. As a result, the capacity of inter-regional transmission built declines by 12-31% in the co-located storage scenarios relative to the fixed scenarios (Table 8). As indicated by Fig. 5, GenX sites the additional solar PV capacity in California and Nevada, closer to where population centers are, while reducing the wind buildout in Wyoming and Colorado. This shift results in a decline in the inter-regional transmission expansion between Wyoming and Colorado with the rest of the Western Interconnection. These trends reinforce the ability of strategically sited storage to partially substitute for transmission capacity.
4 Implications & Conclusion
Wind and solar PV are low-cost resources that are likely to provide the cornerstone for power sector decarbonization. However, large-scale wind and solar expansion requires significant increases in transmission capacity, which in practice faces development, permitting, and social license challenges that may constrain wind and solar deployment. We thus investigate how the optimal sizing of wind or solar resources relative to transmission interconnection capacity and the co-location of ”hybrid” VRE and storage capacities can reduce overall transmission expansion and alter resource portfolio decisions in the American West.
Across the Western Interconnection, there are opportunities to reduce intra- and inter-regional transmission buildout through co-location. Capacity expansion models that do not include this capability (e.g. [6, 23, 27, 29]) can overestimate inter-regional transmission expansion on the order of 12-31% and intra-regional transmission reinforcements by 20-25%, as indicated in our 80% CES scenarios. Capturing this ability for storage to substitute for intra-regional transmission capacity (aka transmission interconnection for VRE sites) can result in an up to 6-fold increase in battery deployment relative to cases without the ability to co-locate batteries and renewables. Additionally, modeling co-location and optimized VRE sizing noticeably shifts modeled solar and wind capacity decisions. When only considering the ability to optimize transmission interconnection to VRE capacity sizing, wind buildout increases (4.0-5.5%) and solar PV capacity decreases, as wind has greater transmission line distances and higher grid connection costs than solar PV and thus benefits more from optimized interconnection sizing. Meanwhile, modeling co-location of VRE and storage results in greater deployment of solar PV (3.5-4.8%) and exclusively sites battery capacity as ”hybrid” projects with solar due to the consistent daily pattern of PV generation, which permits storage to reduce interconnection by charging from peak solar production during low-price mid-day periods and making full use of the solar PV site’s interconnection to discharge in higher price evening hours.
Given the substantial differences in modeled capacity decisions and system costs observed in this study, we recommend that the capacity expansion modeling community more broadly implements methods to represent co-location of storage and VRE resources in order to capture critical trade-offs relevant to policymakers and market designers. We note, however, that by increasing the dimensionality of the capacity expansion model, capturing optimized interconnection sizing for each modeled VRE cluster can result in an up to 40% increase in computational runtime, while modeling co-located storage can increase runtime 10-90% vs. modeling fixed interconnection sizing and standalone storage options only. Researchers should thus continue developing best practices for modeling these resources. We also note that the wide variation in optimal interconnection sizing observed across modeled sites indicates that VRE developers should carefully optimize the sizing of each site. The methods developed in this paper can also provide decision support for such planning decisions.
While our model captures the value of storage at a bulk transmission system level with zonal resolution, no standalone storage assets are built when co-location with VRE is modeled. This result is due to the high locational value captured by siting storage at VRE sites and reducing required grid interconnection capacity. However, GenX does not capture optimal power flow and the full suite of intra-zonal transmission constraints, nor does it consider distribution network constraints, which could create other opportunities for storage to capture locational value aside from co-location with renewables. Future modeling could improve the resolution of the model to capture these opportunities and more accurately capture the optimal siting of storage across the system. Furthermore, future work can focus on implementing other manners of modeling co-located VREs and batteries, such as AC-coupled systems and tightly DC-coupled systems. Currently, the GenX module provides the modeling of co-located loosely DC-coupled systems, where there is a single inverter connecting the VRE and battery resource to the grid. Future models could enable the modeling of the batteries and VREs to have separate inverters when connected to the grid (AC-coupled systems) or the modeling of the co-located battery to only be charged by the VRE and not by the grid (tightly DC-coupled system) [12, 13]. Additionally, future capacity expansion modeling could enable modeling the co-location of long-duration energy storage solutions with VREs, as various emerging long-duration energy storage technologies have distinct cost and performance parameters from lithium-ion batteries and may demonstrate different substitution and behavioral dynamics [50]. This case study was ran for the American West in 2030, but these results and trade-offs may also vary depending upon long-term decarbonization strategy and geographic context.
Despite these caveats, our modeling clearly illustrates the ability for batteries to significantly reduce required transmission expansion and demonstrates the importance of modeling the optimal sizing of grid interconnection and co-location of storage and VRE resources to accurately capture competition between wind and solar PV resources and estimate the value of energy storage.
5 Data Availability
6 Acknowledgements
Funding for this manuscript was provided by Princeton University’s Carbon Mitigation Initiative (funded by BP), Princeton University’s High Meadows Environmental Institute (HMEI) and the associated HMEI Environmental Scholars Program, and the Princeton Zero-carbon Technology Consortium (funded by gifts from GE, Google, ClearPath, and Breakthrough Energy).
Appendix A Model Information
A.1 PowerGenome Overview
PowerGenome is an open-source scenario generator for GenX that creates inputs for power system optimization models. We used PowerGenome to gather and synthesize the necessary inputs for the case study on existing generating units and clustering these units, inter-regional transmission between regions, hourly load profiles, vehicle electrification and flexible demand profiles, hourly capacity factors for wind and solar sites, cost projections for the planning period, and time domain reduction methods to aggregate data. Data for PowerGenome was compiled from a few different resources that were compiled in the PUDL database: EIA (for regional cost multipliers), EPA (for IPM regions), NREL (projected costs of technologies) [40, 52].
A.2 GenX Overview

GenX is an open-source electricity capacity expansion model that was developed at MIT and Princeton. This linear or mixed-integer linear least-cost optimization model has the ability to determine investment and operational decisions and electricity generation portfolios in a future planning year, while subject to various engineering, policy, and market constraints. The highly-configurable model was written in Julia and JuMP [36, 37]. To see all of the notation associated with the GenX model, see the open source model and working paper [28, 34].
While GenX has been able to model various resources, including VREs, thermal generators, nondispatchable resources, and hydropower, GenX was previously unable to model co-located (particularly DC-coupled (loosely-coupled)) or optimized interconnection VRE resources. We thus add the two functionalities.
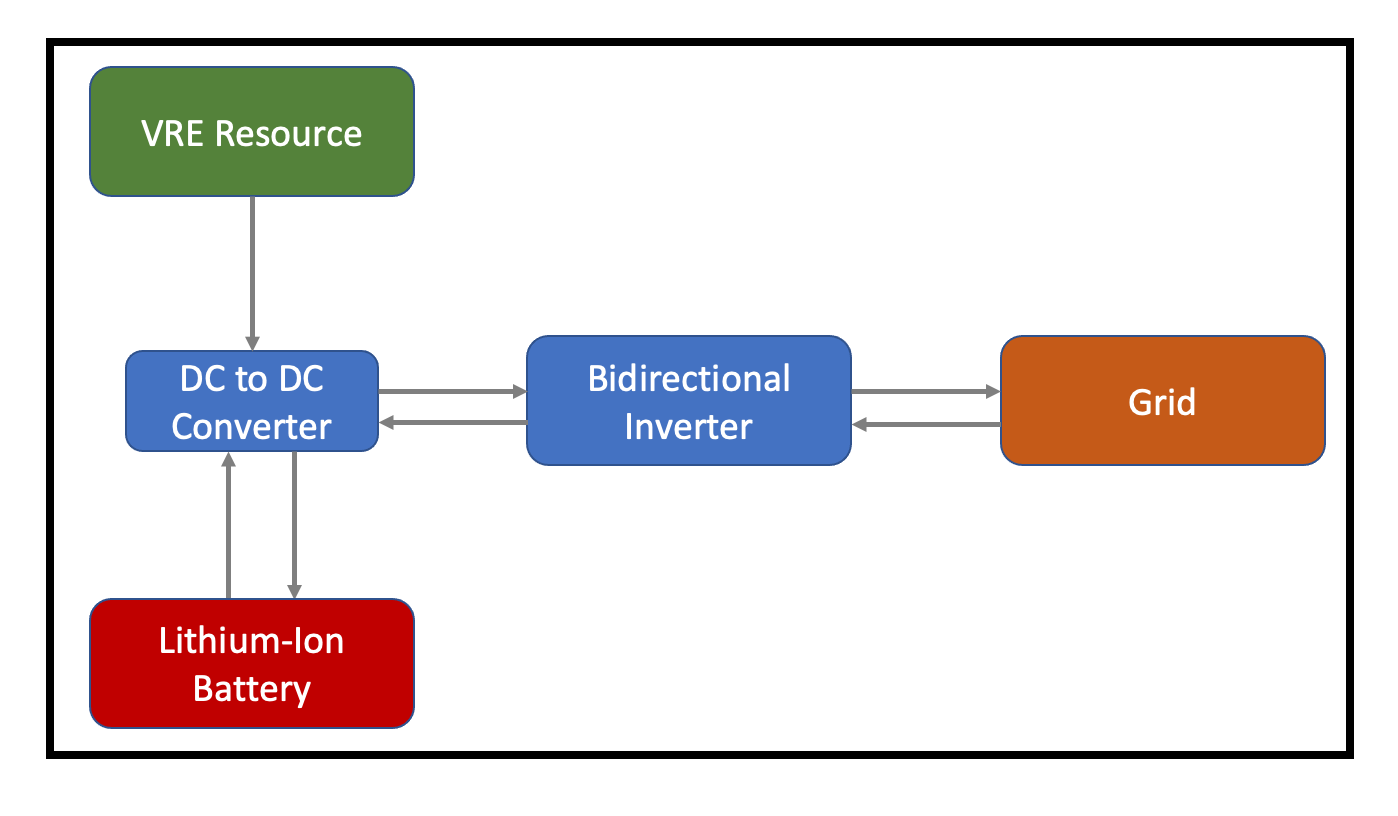
As shown in Fig 1, VRE resources (DC) are usually oversized with grid and inverter connection (AC). The typical sizing of DC:AC connection in models is 1.3:1 for PV to grid connection and 1:1 for wind to grid connection [12, 13, 15]. However, it may be optimal for the hourly generation profiles and the locations of the VREs to further oversize the resources. Thus, GenX is given the ability to further co-optimize the sizing of VREs to grid connection built in a cost optimal manner.
Additionally, the siting of batteries is a question of interest. With declining battery costs, the question of standalone storage vs. co-located storage has been investigated more extensively. For co-located storage, there are two types of coupling that can occur between VRE and battery systems: 1) AC-coupled systems (the VRE and battery systems are both connected to the same grid connection but exist with separate inverters), and 2) DC-coupled systems (a single inverter exists for the VRE and battery resources) [12, 13]. DC-coupled systems have numerous cost advantages, such as shared infrastructure costs (particularly with the inverter), balance of system costs, grid connection costs, O&M costs, and soft costs. DC-coupled systems can either be tightly-coupled or loosely-coupled. Tightly-coupled systems require the battery to only be charged from the co-located VRE resource, but loosely-coupled systems enable the bidirectional inverter to charge the battery from the grid. The module added to GenX enables the modeling of DC, loosely-coupled systems (Fig. 2) [12].
A.3 Cost Analysis Description
Solar PV, Storage, and Grid Investment Costs: The model enables standalone solar, co-located solar and storage, and standalone storage resources to be built.
|
|
|
|||||||
|---|---|---|---|---|---|---|---|---|---|
| PV Module | 35 | 0 | 35 | ||||||
| Lithium-Ion Battery | 0 | 50 | 50 | ||||||
| Solar Inverter | 6 | 0 | 0 | ||||||
| Bidirectional Inverter | 0 | 4.2 | 4.2 | ||||||
| Structural BOS | 15.2 | 3.1 | 18.3 | ||||||
| Electrical BOS | 10 | 8.6 | 13 | ||||||
| Installation Labor/Equip | 14 | 5.5 | 18.9 | ||||||
| EPC Overhead | 9 | 2.8 | 9.9 | ||||||
| Sales Tax | 5 | 5.3 | 9.2 | ||||||
| Land Acquisition | 2.75 | 0.25 | 3 | ||||||
| Permitting Fee | 0 | 0.3 | 0.3 | ||||||
| Interconnection Fee | 2 | 1.8 | 2.9 | ||||||
| Contingency | 2.5 | 2.5 | 5 | ||||||
| Developer Overhead | 2.5 | 2.5 | 5 | ||||||
| EPC/Developer Net Profit | 5 | 4.3 | 8.8 | ||||||
| Sum | 108.95 | 91.15 | 183.5 |
|
|
|
|
|||||||||
|---|---|---|---|---|---|---|---|---|---|---|---|---|
| PV Module | 35 | 0 | 0 | 0 | ||||||||
| Lithium-Ion Battery | 0 | 50 | 0 | 0 | ||||||||
| Solar Inverter | 0 | 0 | 0 | 0 | ||||||||
| Bidirectional Inverter | 0 | 0 | 0 | 4.2 | ||||||||
| Structural BOS | 15.1 | 3.2 | 0 | 0 | ||||||||
| Electrical BOS | 7.0 | 6.0 | 0 | 0 | ||||||||
| Installation Labor/Equip | 13.3 | 5.4 | 0.19 | 0 | ||||||||
| EPC Overhead | 7.1 | 2.7 | 0.10 | 0 | ||||||||
| Sales Tax | 4.0 | 4.4 | 0.78 | 0 | ||||||||
| Land Acquisition | 2.6 | 0.21 | 0.23 | 0 | ||||||||
| Permitting Fee | 0.07 | 0.07 | 0.15 | 0 | ||||||||
| Interconnection Fee | 0 | 0 | 2.9 | 0 | ||||||||
| Contingency | 2.5 | 2.1 | 0.42 | 0 | ||||||||
| Developer Overhead | 2.1 | 2.1 | 0.42 | 0 | ||||||||
| EPC/Developer Net Profit | 4.4 | 3.7 | 0.72 | 0 | ||||||||
| Sum | 93.5 | 80.0 | 5.9 | 4.2 |
-
1.
Use NREL’s AC cost breakdown to find 2018 costs ($ millions) for solar PV, battery, and grid connection (inverter and substation): NREL’s bottom-up cost analysis on building a DC-coupled co-located solar and battery system splits each cost contributor as a line item as indicated by Table 1 to differentiate the breakdown of costs for standalone solar PV (77 MW AC/100 MW DC), standalone battery (46 MW AC/60 MW DC/240 MWh), and co-located solar and battery resources [12]. However, the cost breakdown from NREL does not isolate the costs spent on grid connection. Since the goal of our study relies on modeling grid connection capacity separately from VRE capacity, it is critical to find and differentiate DC and AC components and costs, particularly AC grid connection from solar and storage DC resources. Utilizing NREL’s current cost and line items from Table 1, a further splitting of the costs occurred to separate costs into four categories as indicated in Table 2 based upon the cost savings that occur from co-locating resources: 1) PV modules (DC costs), 2) battery modules (DC costs), 3) other grid substation costs (AC costs), and 4) inverter costs (AC costs). Grid connection costs are represented as a summation of inverter, spur line, and other grid substation costs, but since these components have different costs and projections, they are calculated separately and summed.
-
2.
Calculate 2018 $/MW costs for each of the four components: $/MW costs were calculated for the four AC- and DC-components for 2018 costs by dividing the costs for each category by the total capacity (100 MW PV DC, 60 MW battery DC/240 MWh battery, and 77 MW AC of grid connection).
-
3.
Calculate 2030 projected costs for each of the four components based upon 2030 solar and storage cost projections: 2030 solar and storage AC costs were calculated based upon NREL’s Annual Technology Baseline (ATB) projections for both low-cost and mid-cost scenarios and averaged over the planning period 2020 to 2030. The percent cost reductions for the 2018 solar PV AC to 2030 solar PV AC and 2018 storage AC to 2030 storage AC were calculated and applied to the 2018 costs of the four AC- and DC-components (PV DC, storage DC, inverter, and substation and grid connection). While the solar and storage costs followed their respective percent cost reductions, no 2030 inverter or grid connection costs were calculated explicitly, so it is assumed that inverter costs follow the same percent decrease as solar PV technologies and substation costs remain constant from 2020 to 2030. At this step, capital cost breakdowns for solar PV DC (MW DC), storage (MWh), the inverter (MW AC), and the substation (MW AC) costs were calculated for 2030, matching the decision variables of GenX (see Table 5).
-
4.
Annuitize costs: The capital costs of the solar PV DC resource, inverter, and substation were multiplied by solar PV regional multipliers and battery resources were multiplied by battery regional multipliers from NREL since the costs of technologies may vary based upon the physical location [53]. Based upon former tax credit policy, solar energy has a 10% ITC when built after 2023, and co-located storage that is charged 75% from solar also receives a permanent 10% ITC. These tax credits are applied to the capital costs prior to annuitizing the costs [48]. No credits were allocated toward wind, standalone storage, or co-located storage with wind resources. Regional capital costs were annuitized assuming a 30-year lifespan for PV and the inverter, a 60-year lifespan for the substation, and a 15-year lifespan for batteries with spur line costs added to the grid connection costs [41]. From NREL, the solar PV DC assumed a 2.4% WACC, the battery DC assumed a 2.4% WACC, the inverter assumed a 2.4% WACC, and the substation assumed a 4.2% WACC [41, 54]. See Table 6 for a breakdown of the assumptions made on the WACC, lifespan, regional multipliers, and ITC policy for co-located solar and storage systems, standalone solar resources, standalone battery systems, co-located wind and storage systems, and standalone wind resources.
-
5.
Summing grid connection costs: Inverter and substation costs follow different projections for WACC, lifespan, and regional multipliers in numerous cases and were thus calculated separately. Additionally, each VRE site has a separate, predetermined interconnection/spur line cost to connect VRE sites to metro centers from PowerGenome. To find the total grid connection costs, the inverter, grid connection, and pre-calculated spur line costs are summed.
-
6.
Differentiating standalone storage and co-located storage costs: While standalone and co-located storage costs are calculated in the same manner, there are two cost differentiators that need to be considered between co-located solar/storage systems and standalone storage systems: 1) standalone storage systems have no tax credit (which affects the investment $/MWh DC costs), and 2) standalone storage systems have separate grid connection and spur line costs with varying regional multipliers and lifespans (which affect the investment $/MW AC costs). These assumptions are noted in Table 6 for how the inverter and substation costs for standalone storage were annuitized differently than co-located storage resources. While standalone batteries have inverter and substation costs, explicit standalone storage spur line/interconnection costs are not calculated in PowerGenome. It is assumed that standalone storage sites have roughly 10 miles of spur line costs, which are calculated and added to grid connection costs [55].
PV, Storage, and Grid Fixed O&M Costs: PV fixed O&M costs were averaged from NREL’s ATB over the planning period. Based upon a recent NREL report, grid connection fixed O&M costs were calculated as 30% of PV fixed costs [45]. PV DC fixed O&M costs are assumed to be 70% of the amount assumed when modeling PV AC and the remaining 30% of fixed O&M costs were assumed as grid connection fixed O&M costs. For storage, we assume fixed O&M costs are 2.5% of capital costs [41]. Table 5 showcases the finalized fixed O&M costs for solar PV technologies.
Wind Investment Costs: The model enables standalone wind, co-located wind and storage, and standalone storage resources to be built, following these steps.
-
1.
Update grid connection costs from solar calculations: Standalone wind resources exclude the inverter costs that exist for standalone battery, standalone PV, and co-located PV and battery systems. Thus, the wind grid connection costs were isolated directly from previous solar grid connection calculations by subtracting inverter costs.
-
2.
Calculated wind DC costs by subtracting substation/grid connection AC costs for 2018: 2018 wind DC and grid connection AC costs were calculated by subtracting 2018 grid connection AC costs from 2018 wind AC costs, which incorporate both the wind and grid connection costs.
-
3.
Calculated projected 2030 wind DC costs: The 2018 $/MW-AC to 2030 $/MW-AC percent drop was calculated and applied to 2018 $/MW-DC to find 2030 $/MW-DC. Grid connection investment costs for wind resources varied depending upon the standalone and co-located resource type, since the standalone wind resource does not include inverter costs, but co-located wind resources add inverter costs to the grid connection costs because of the co-located battery (see Table 5).
-
4.
Annuitize wind costs and calculate grid connection costs for standalone wind resources: For standalone costs of wind, capital costs were annuitized utilizing a WACC of 3.3%, 30 year lifespan, regional multipliers for wind, and no ITC policy. Grid connection costs were annuitized with a WACC of 4.2%, 60 year lifespan, regional multipliers for wind, and no ITC policy (similar to substation costs when annuitizing solar substation costs without inverter costs). Following the annuitizing of substation costs, total grid connection costs were calculated by summing the predetermined spur line/interconnection costs of each wind site and substation cost.
-
5.
Annuitize wind costs and calculate grid connection costs for co-located wind resources: For co-located wind and battery resources, capital costs of wind resources were annuitized in the same manner as standalone costs for wind. Grid connection costs were calculated with inverter costs included since the addition of the battery requires an inverter. See Table 6 for assumptions on cost calculations for wind resources.
Wind Fixed O&M Costs: Wind AC fixed O&M costs were calculated from NREL’s projections during the planning period [41]. The fixed O&M costs of grid connection, calculated during the solar fixed O&M cost calculations, were subtracted from the NREL projections to calculate wind DC fixed O&M costs. Table 5 showcases the finalized fixed O&M costs for wind resources.
Appendix B Supplemental Results & Analysis
B.1 Time Domain Reduction Analysis

For the full year analysis, we have the following total absolute capacities for reference: battery (29.1 GW), biomass (0.35 GW), coal (11.3 GW), geothermal (1.7 GW), grid connection (85.1 GW), hydro (48.1 GW), natural gas (74.8 GW), NG/CCS 100 (0 GW), NG/CCS 90 (0 GW), nuclear (5.2 GW), pumped hydro (4.5 GW), PV (113.0 GW), small hydro (0.37 GW), and wind (34.0 GW).
In this model, our goal was to model the entire Western Interconnection with as much granular detail as possible. However, due to the size of the problem, some of the dimensions needed to be reduced. These dimensions included temporal resolution, unit commitment, resource siting, and transmission representation. Due to the dimensionality concerns, we conducted a time domain reduction analysis to determine how using fewer representative weeks to model a full year (2030) would impact the capacity deployment built. In 1, we analyze the capacity differences by region. By each region and in the total capacity built in the entire system, 15 representative weeks minimize capacity losses. We thus ran 15 representative week TDR scenarios due to similarities in capacity build-out compared to a full year.
B.2 Renewable Energy to Grid Connection Optimized Ratio vs. Interconnection Costs
(a) State RPS, (b) 80% CES.
B.3 Locational Marginal Price ($) vs. % of Grid Connection Used
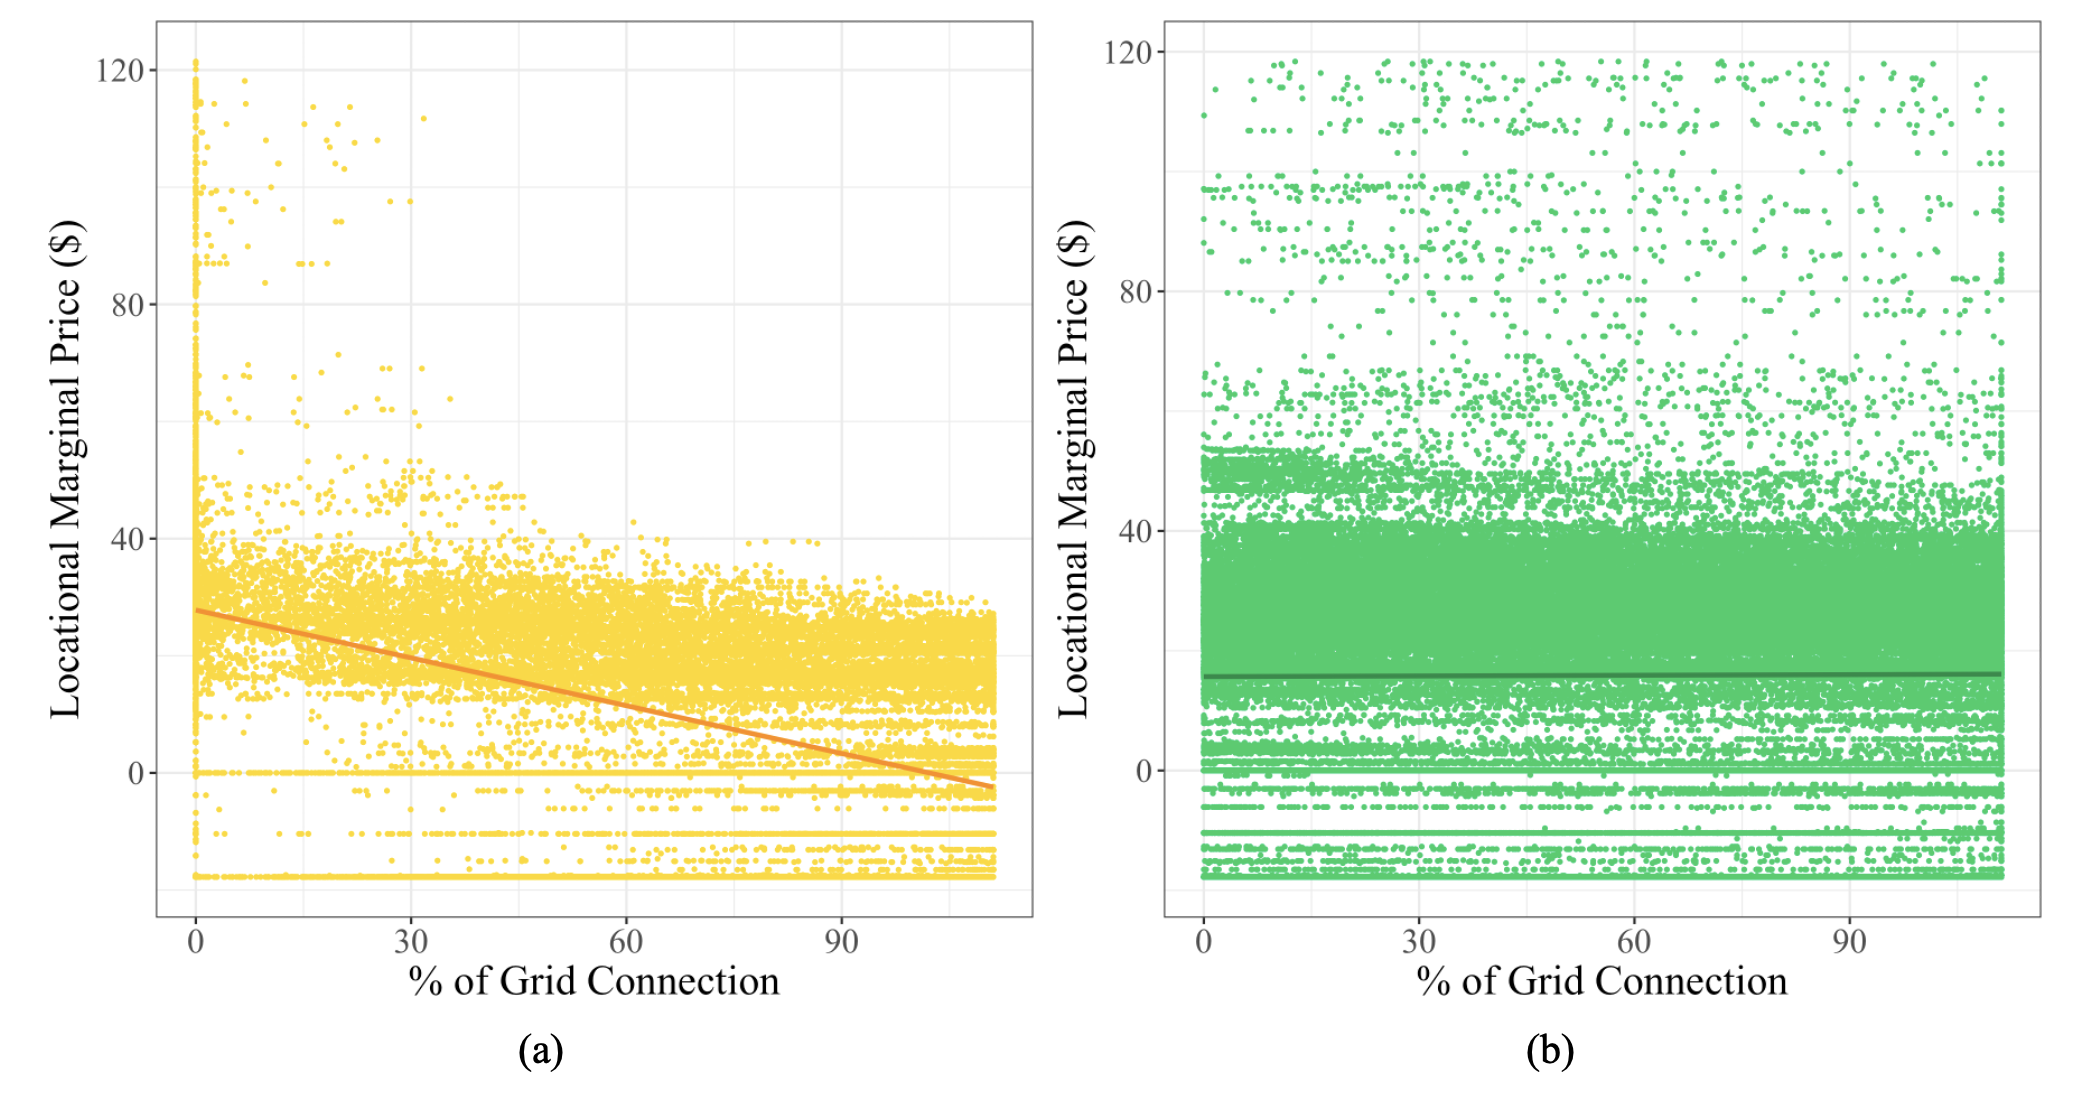
(a) Solar PV, (b) Wind.
B.4 Grid Connection Variation Amongst Scenarios
We additionally calculated the GW-miles of spur lines and grid connection that are built in every scenario. As indicated by Table 1, spur line miles increase in the optimized interconnection from the fixed interconnection scenario. Similarly, the grid connection built in the co-located storage scenario is greater than in the fixed interconnection scenario but is less than the optimized interconnection scenario due to the trade-offs of building batteries at the same locations. The capacity decreases in the optimized interconnection and co-located storage scenarios but the GW-miles increase. This likely occurs because there are greater cost savings on longer routes relative to shorter routes in the optimized interconnection and co-located storage scenario, so there are larger relative savings for sites further from demand centers.
|
|
|
|
|
|
|||||||||||||||||||
|---|---|---|---|---|---|---|---|---|---|---|---|---|---|---|---|---|---|---|---|---|---|---|---|---|
| GW | 122.6 | 102.8 | 83.2 | 110.8 | 90.1 | 87.4 | ||||||||||||||||||
| GW-miles | 12303 | 12883 [4.7%] | 12538 [1.9%] | 13567 | 15077 [11.1%] | 14251 [5.0%] |
B.5 Total Capacity, Power Generation, Costs Plots
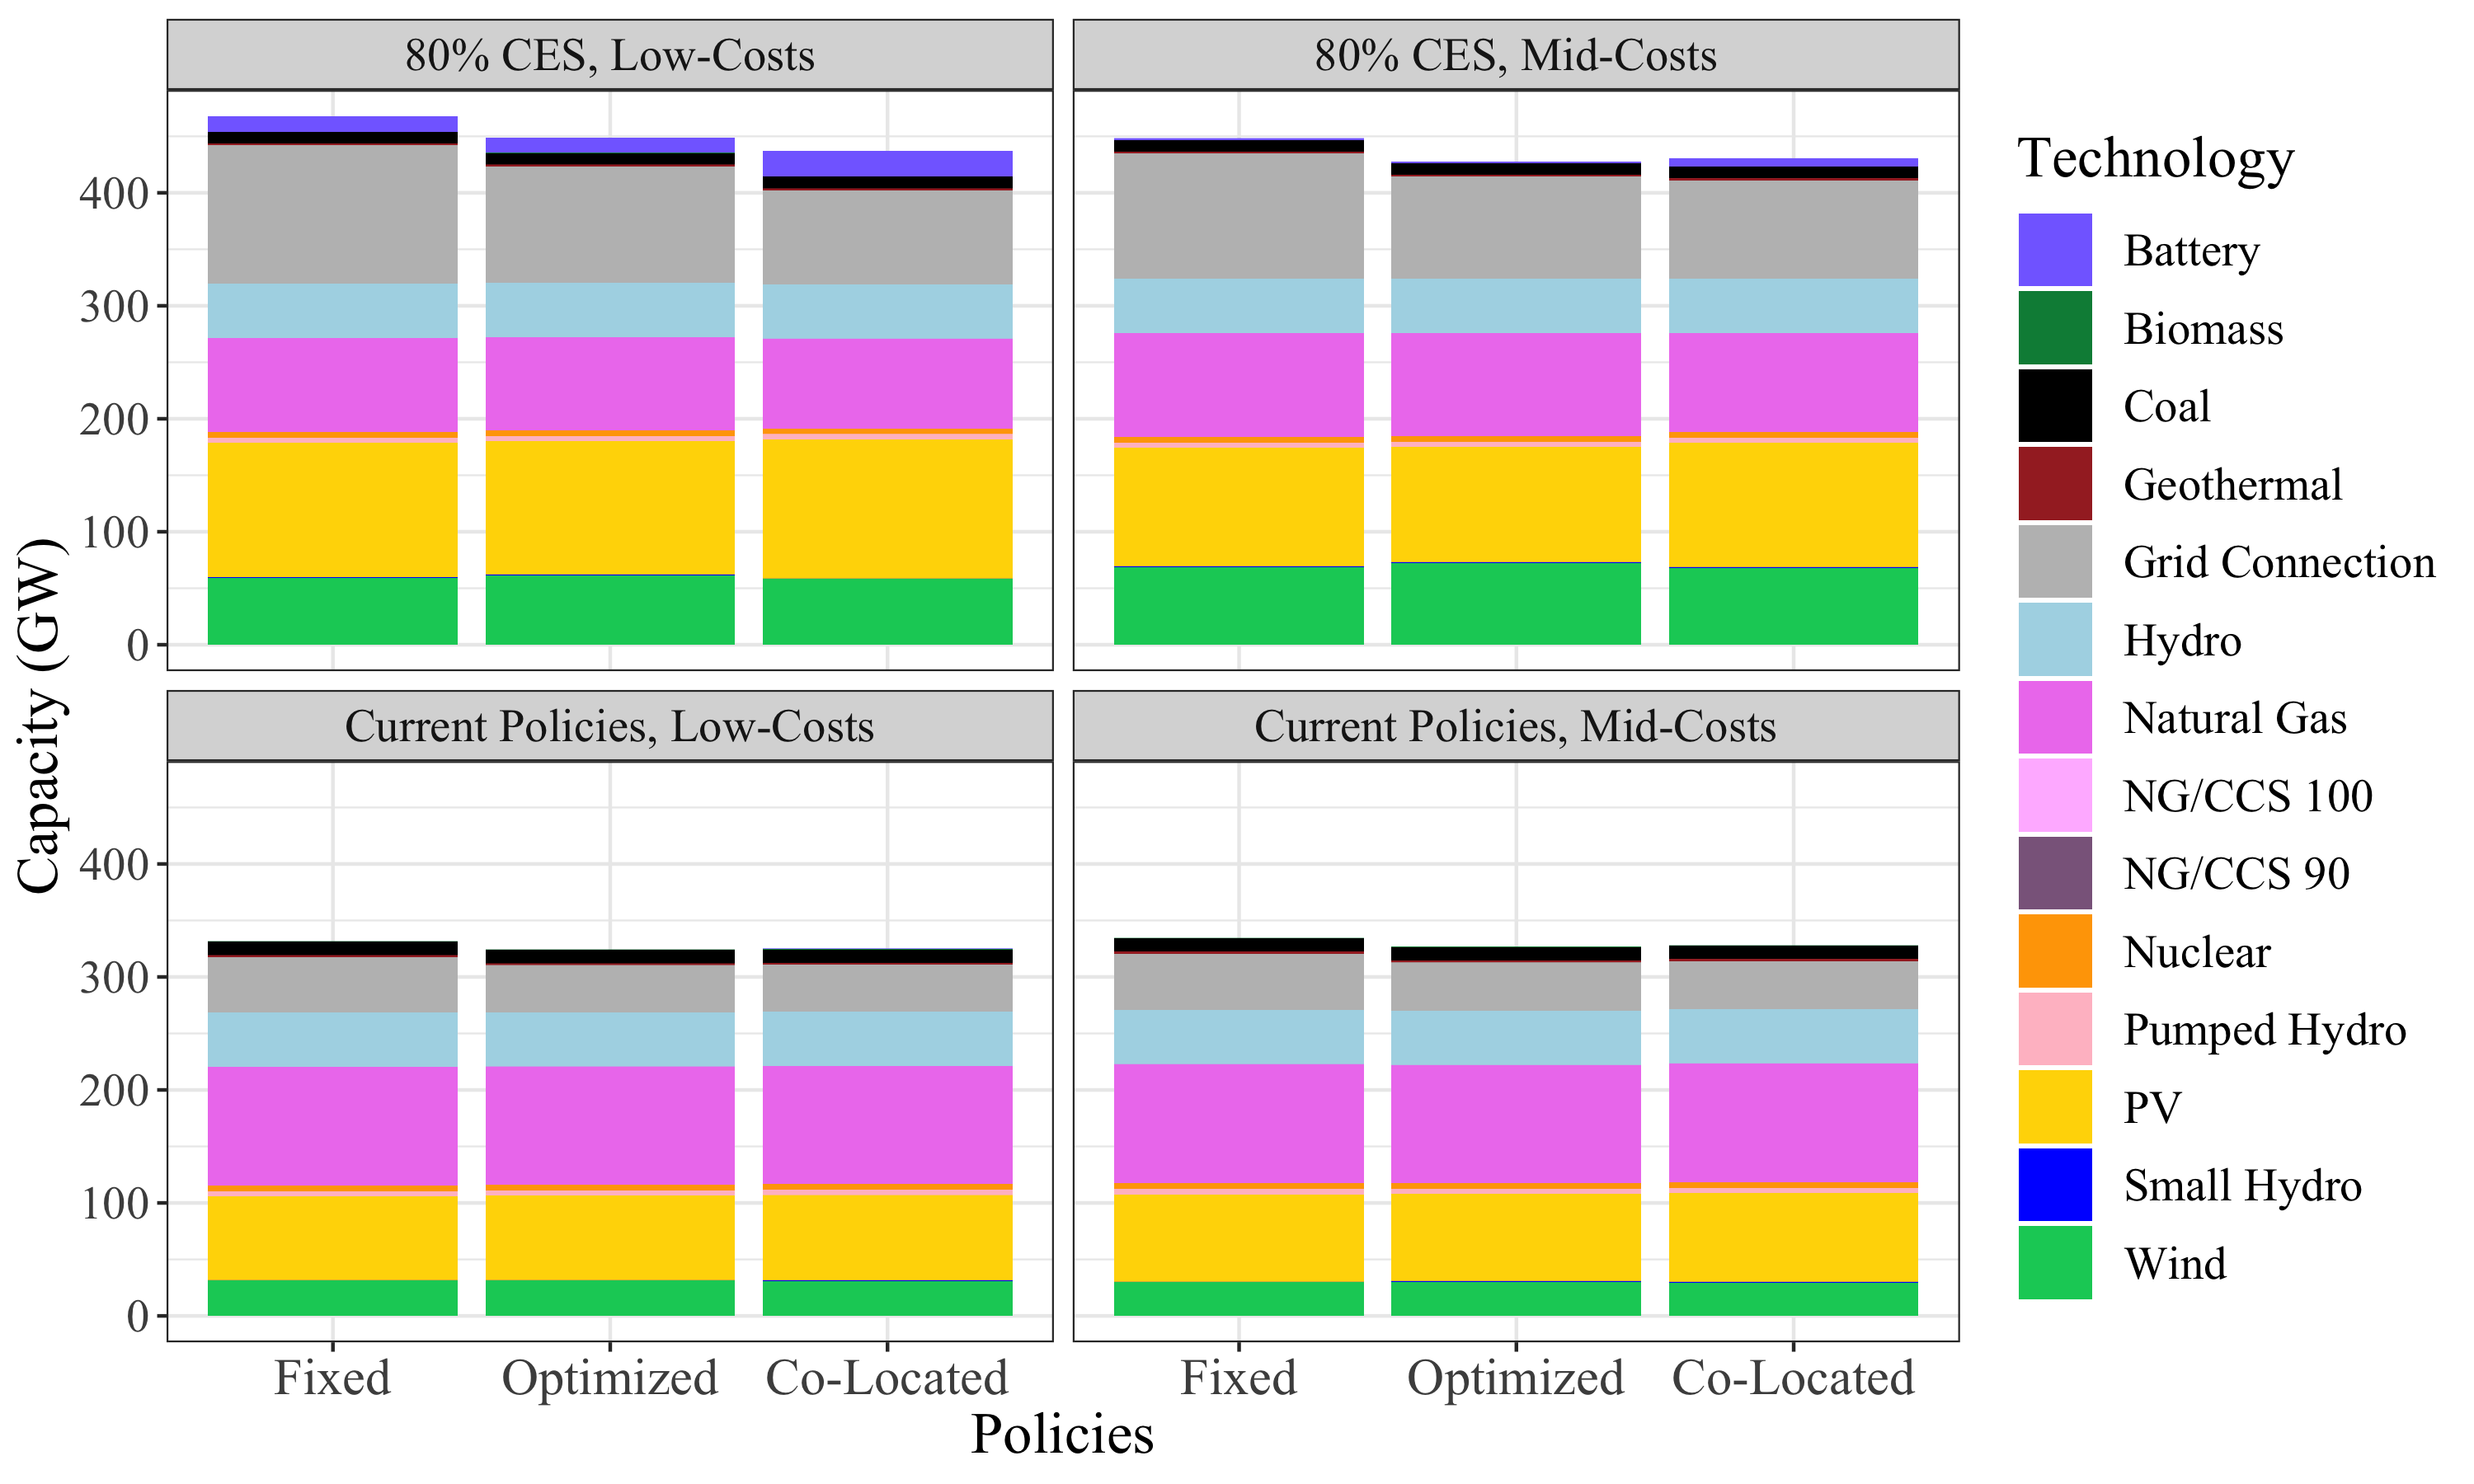
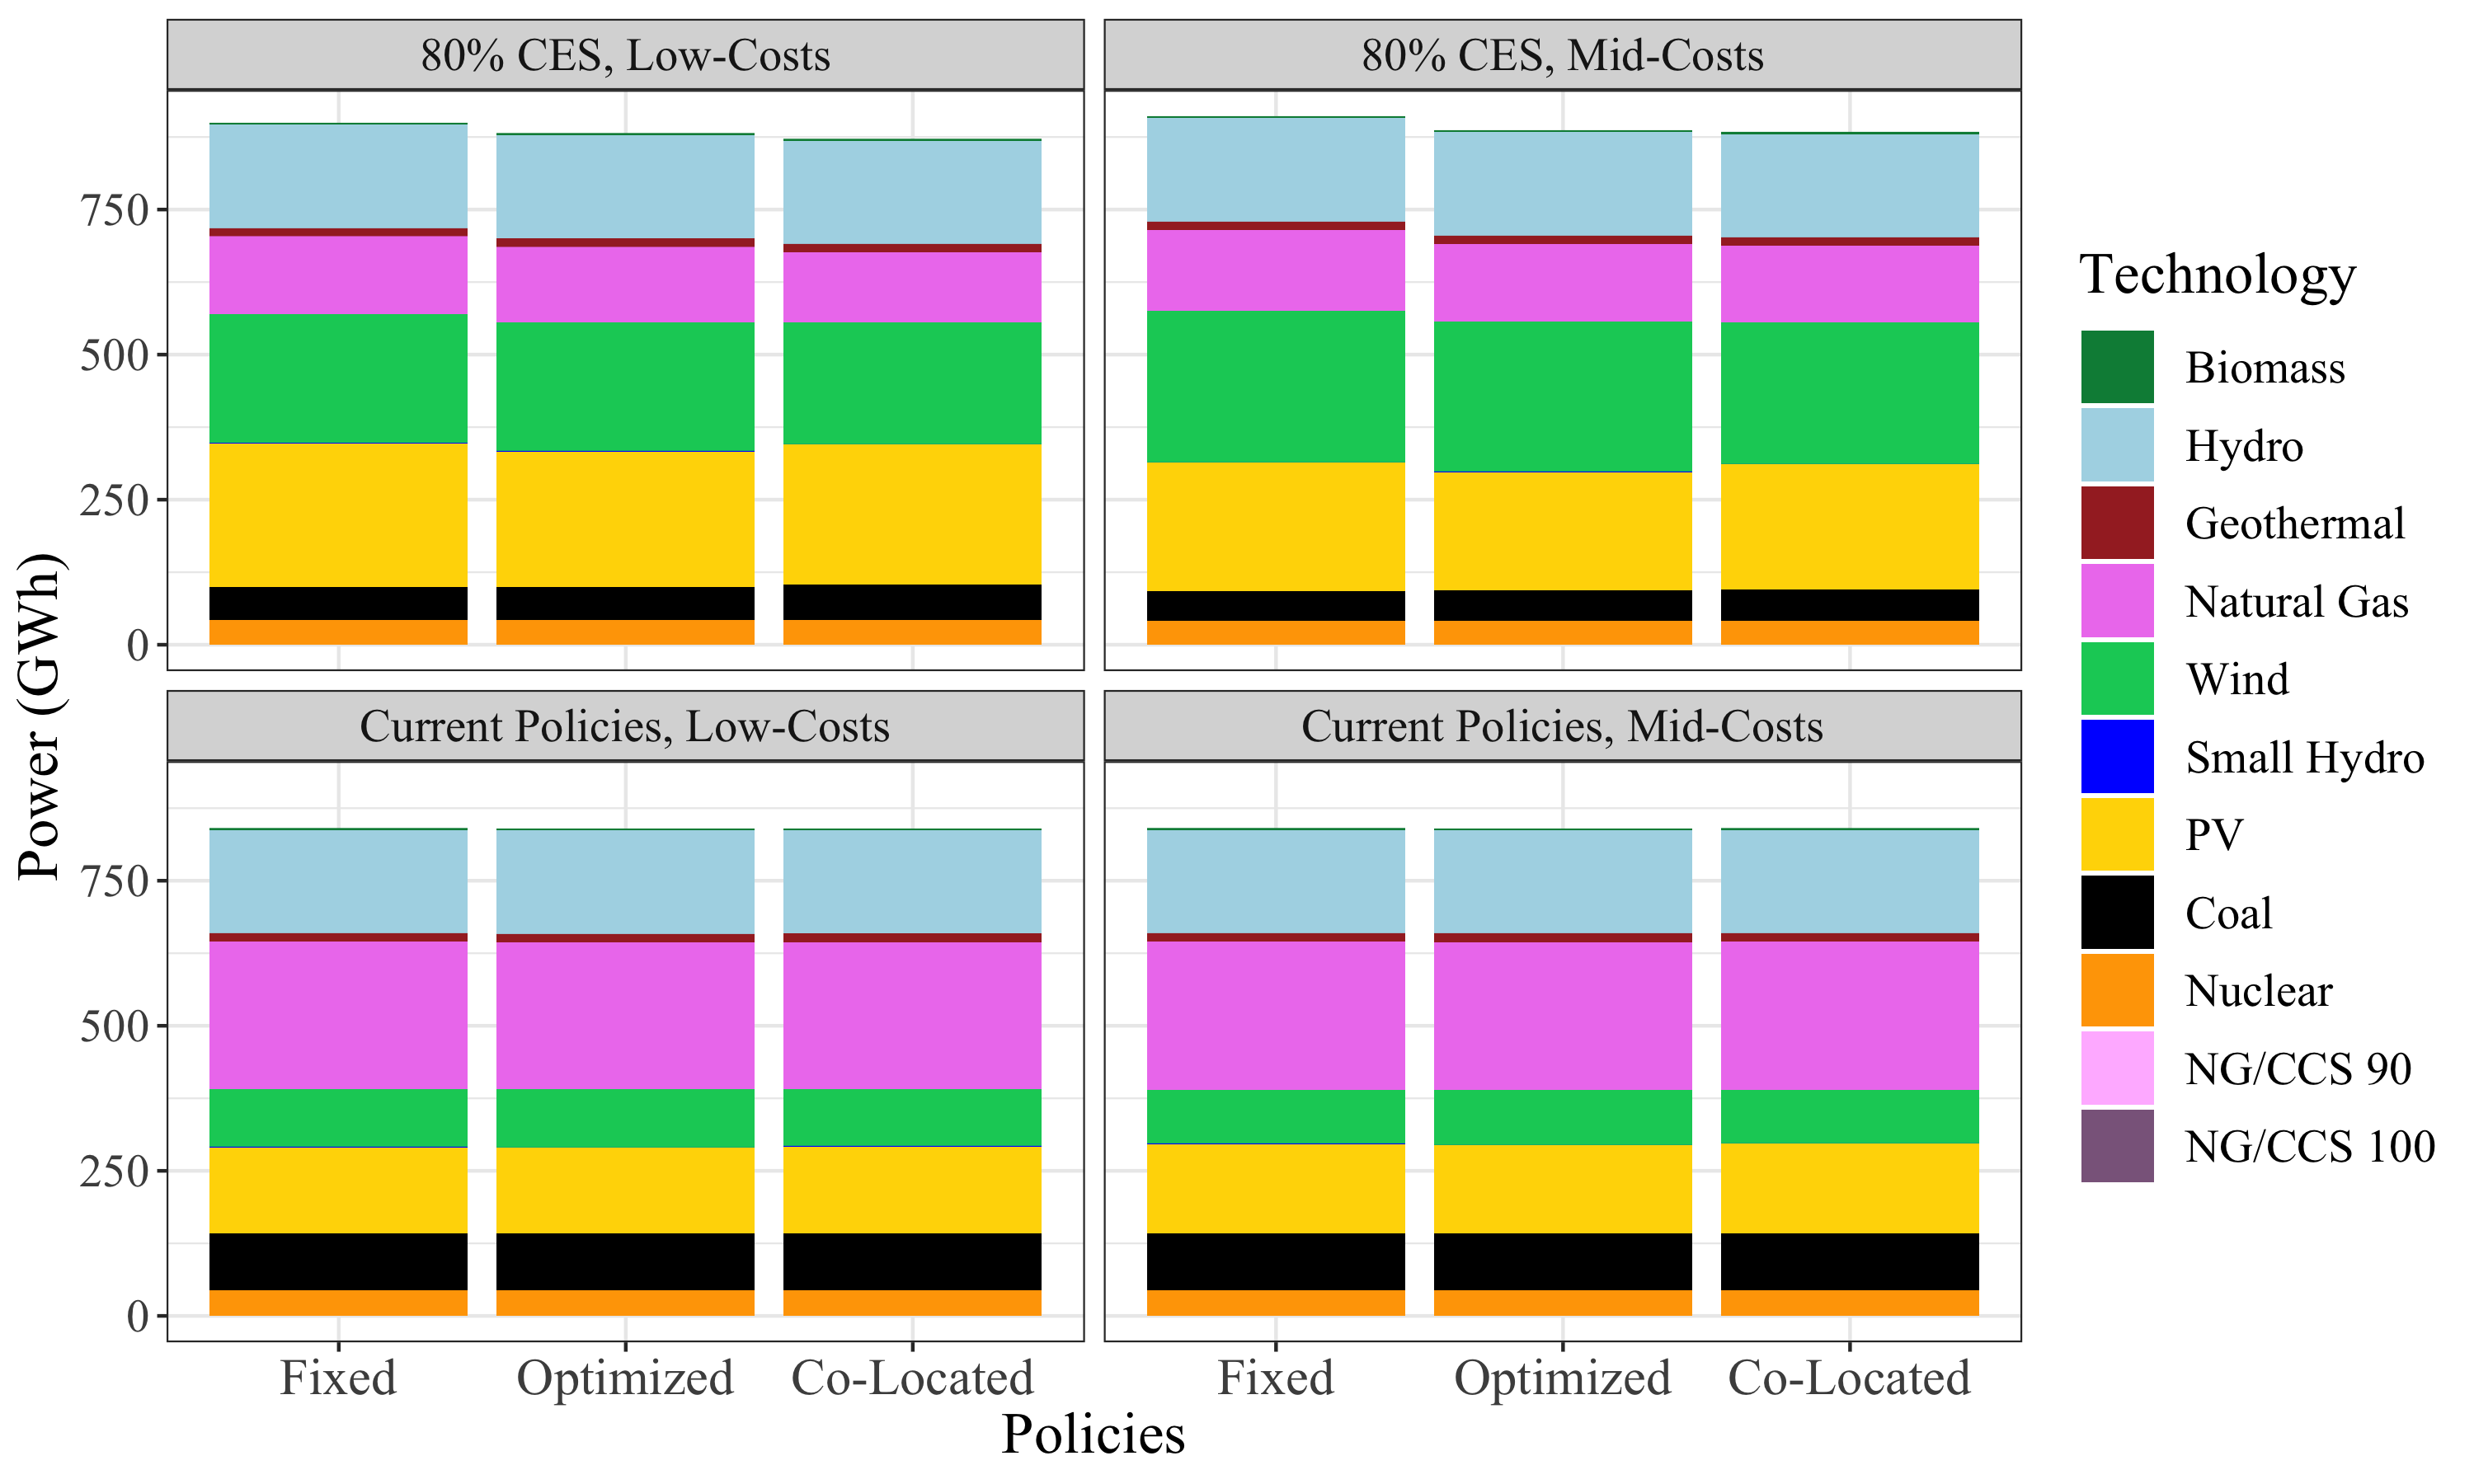

Other costs incorporate non-served energy costs, start-up costs for thermal plants, and costs of not meeting reserve requirements.
B.6 Capacity Difference Plots
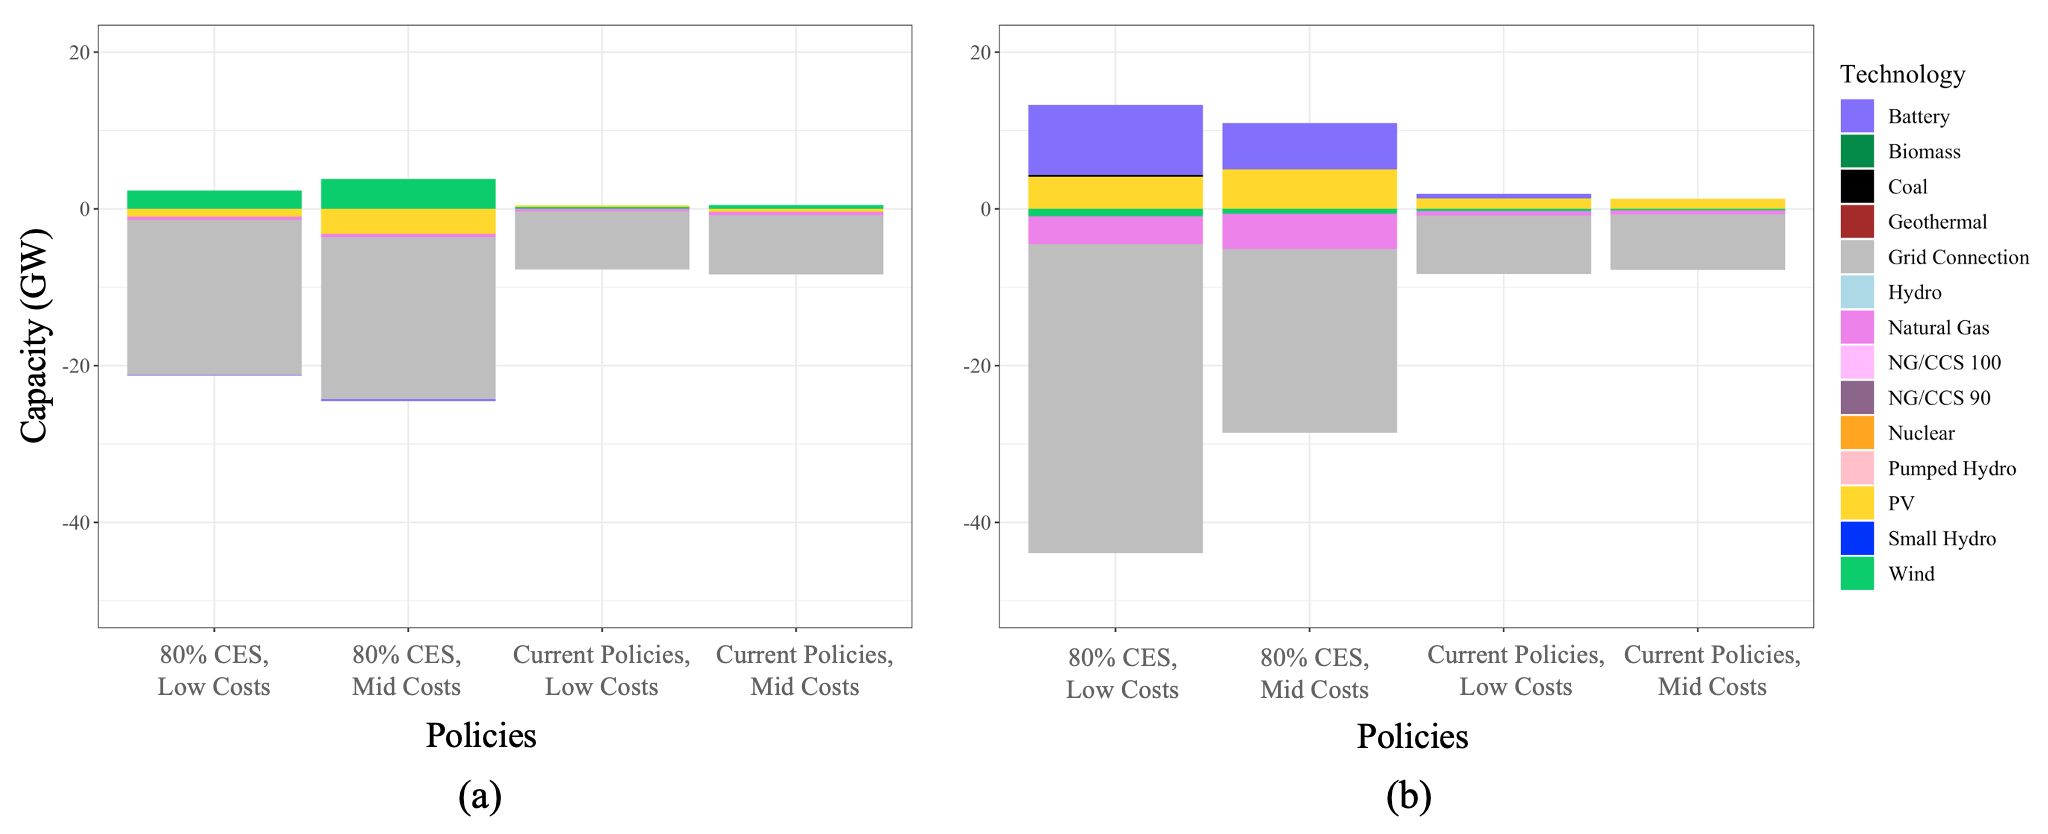
(a) Optimized Interconnection, (b) Co-Located Storage.

(a) Optimized Interconnection, (b) Co-Located Storage.
(a) Optimized Interconnection, (b) Co-Located Storage.
(a) Optimized Interconnection, (b) Co-Located Storage.

(a) Optimized Interconnection, (b) Co-Located Storage.

(a) Optimized Interconnection, (b) Co-Located Storage.
(a) Optimized Interconnection, (b) Co-Located Storage.
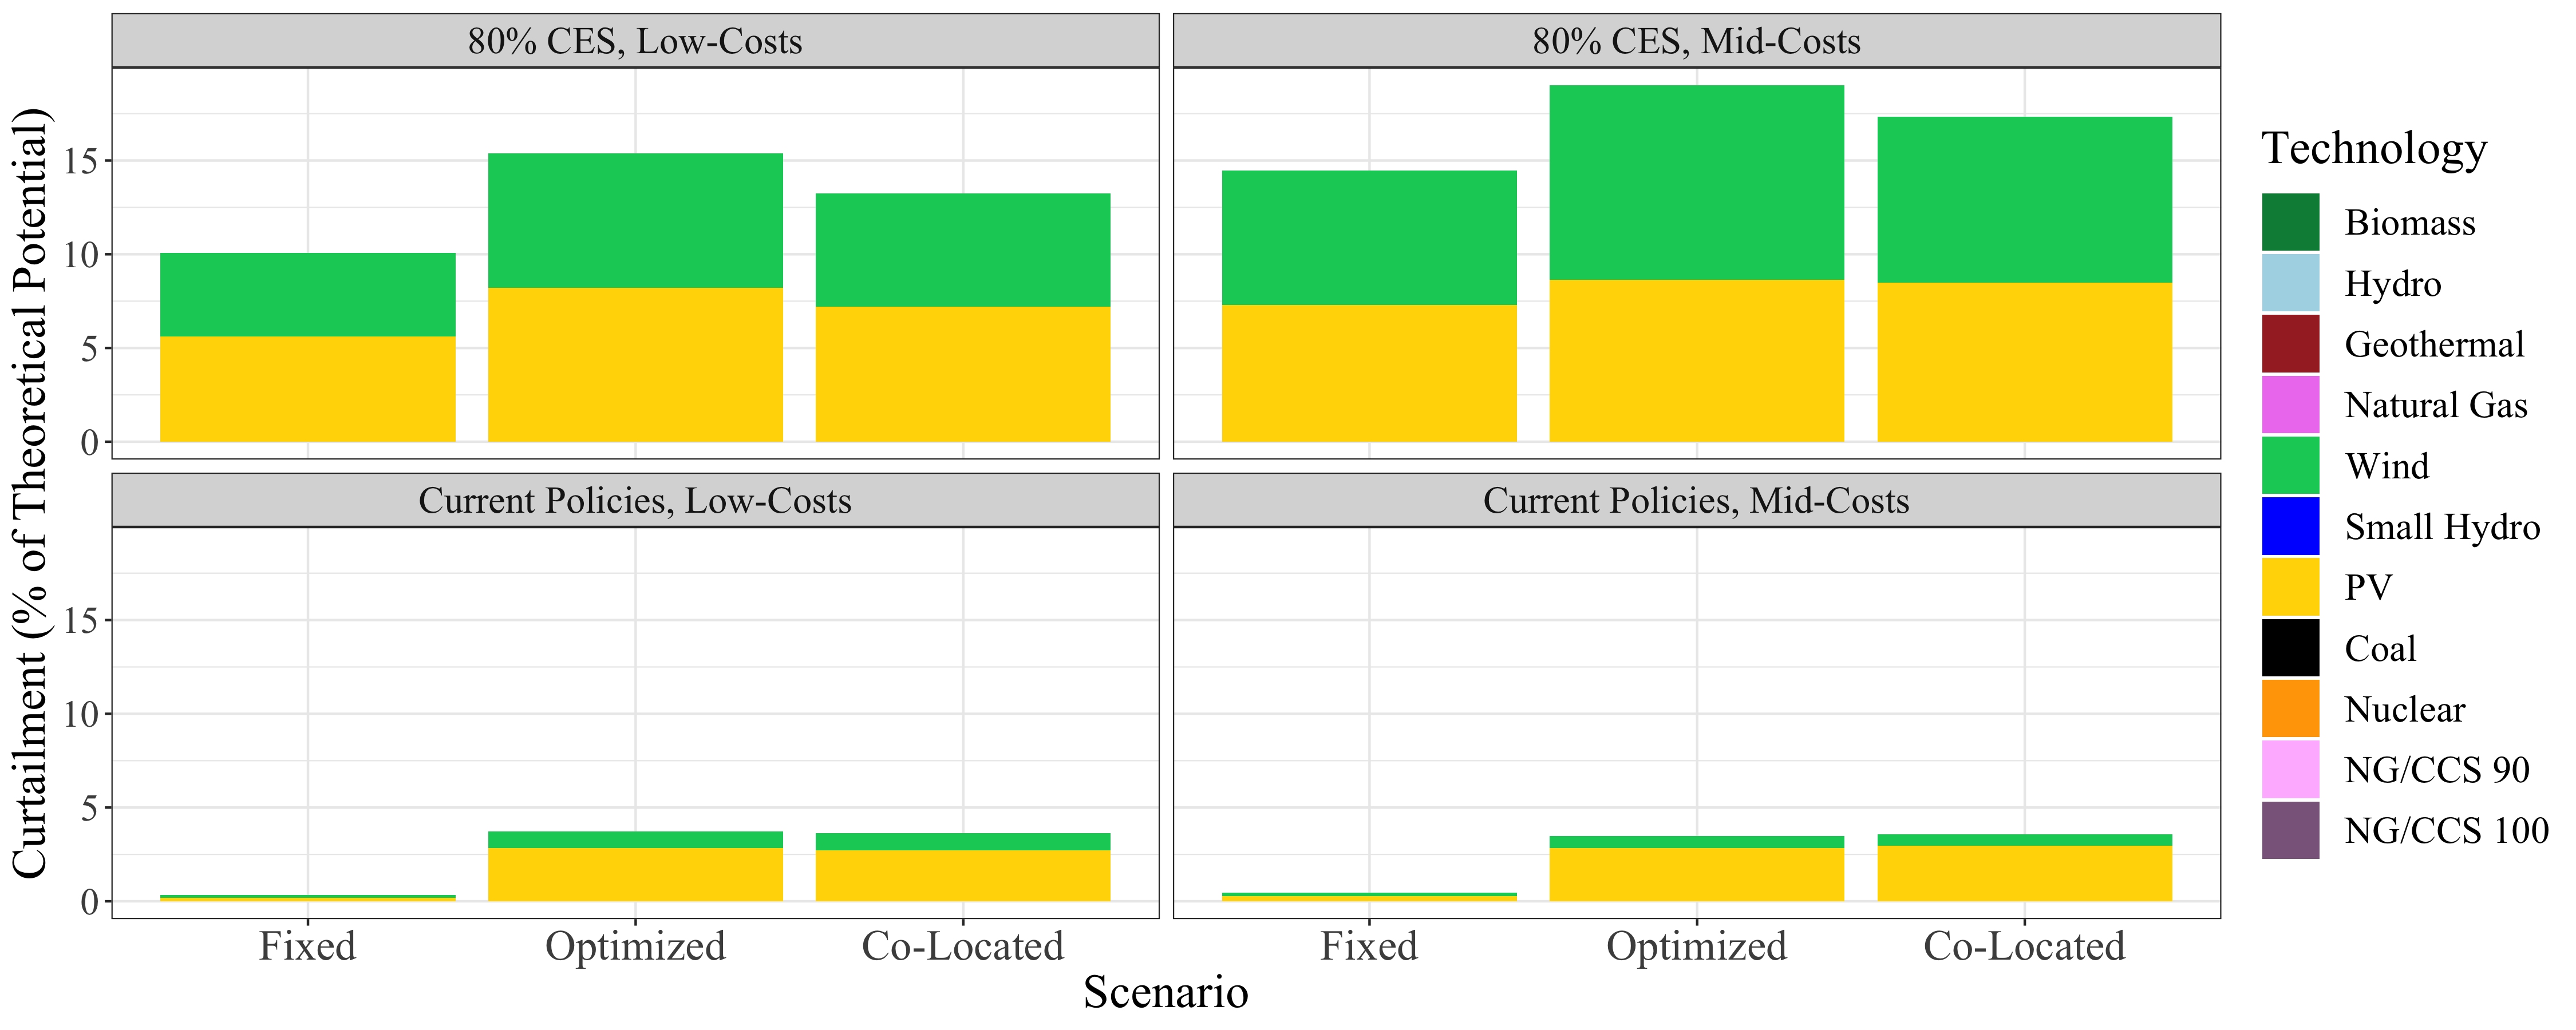
B.7 Curtailment Plots
B.8 Downscaling Plots
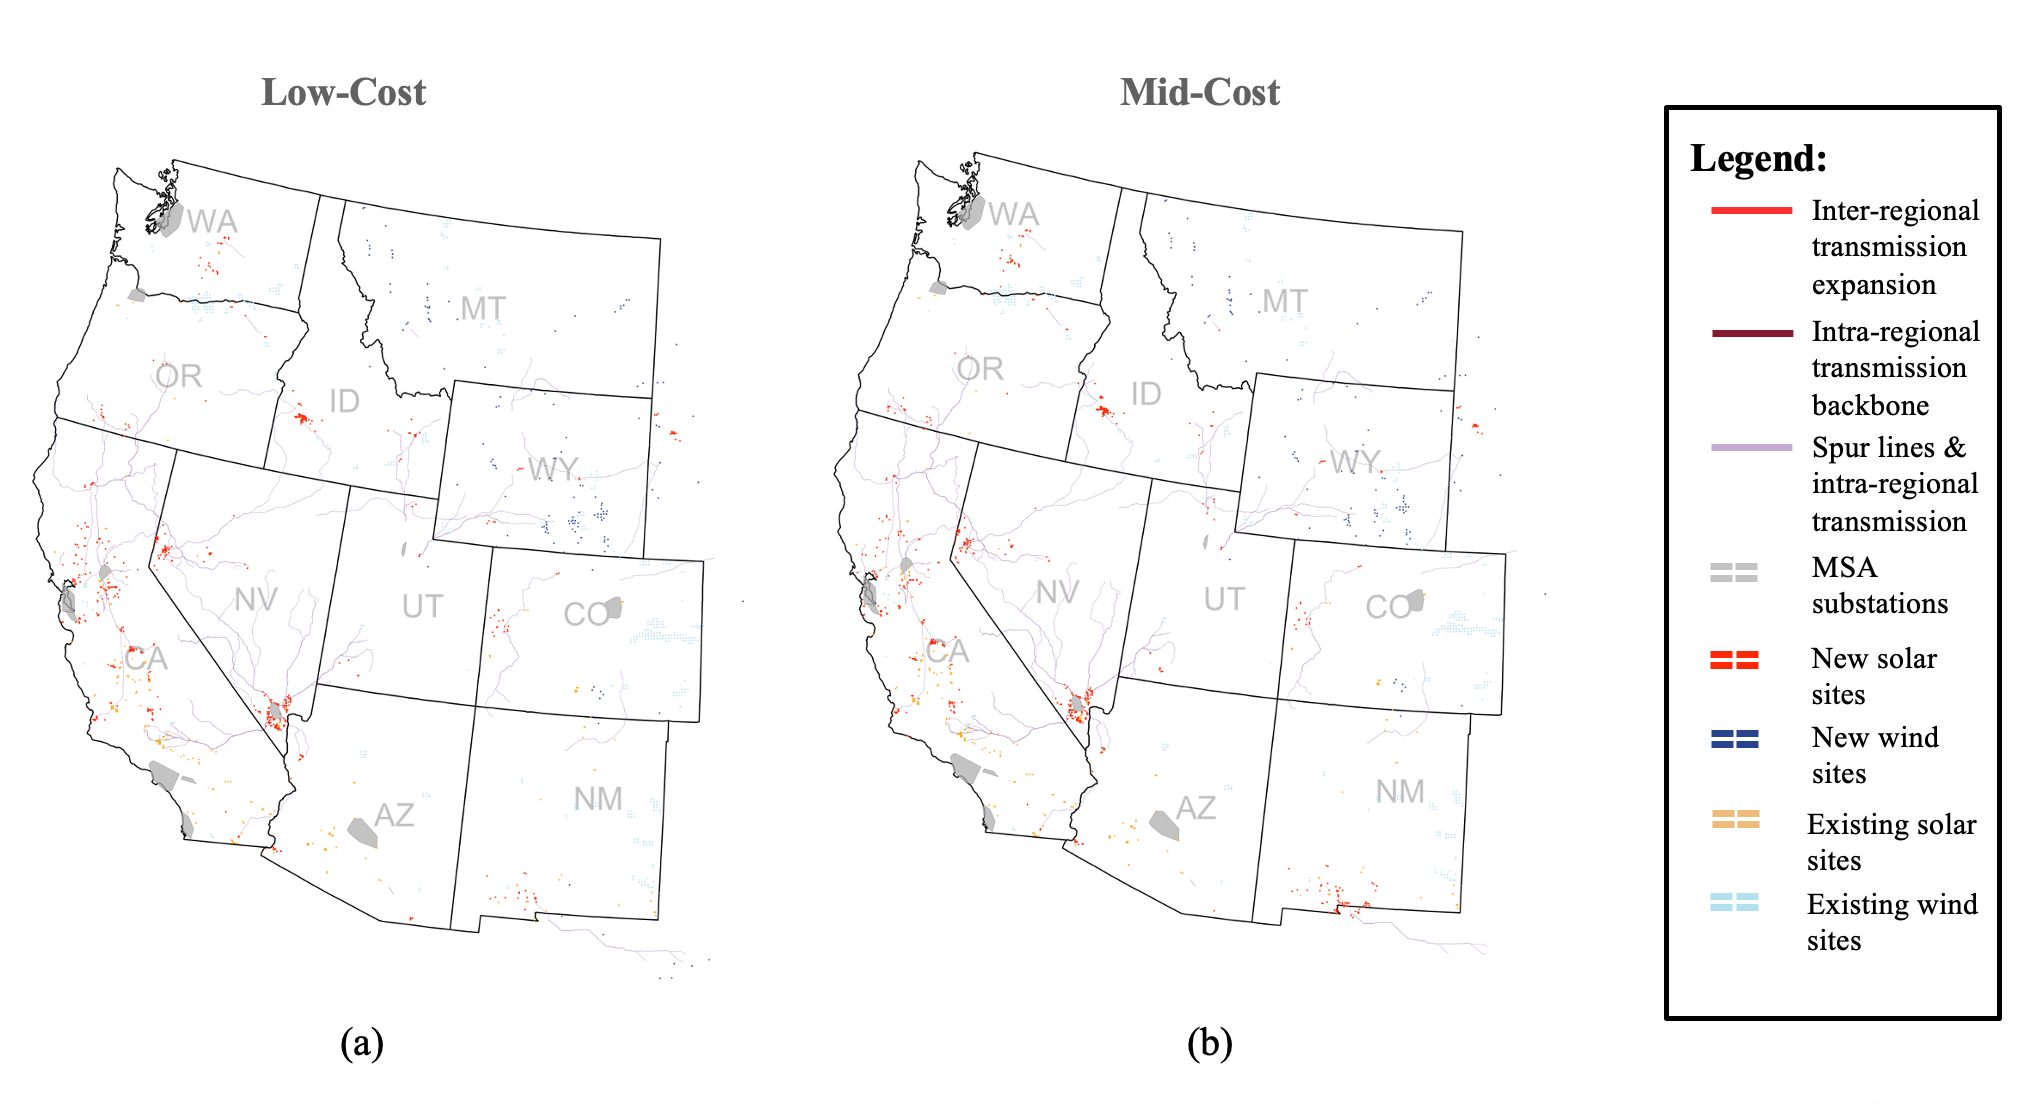
(a) Downscaled Results in Low-Cost Scenarios, (b) Downscaled Results in Mid-Cost Scenarios.
(a) Downscaled Results in Low-Cost Scenarios, (b) Downscaled Results in Mid-Cost Scenarios.
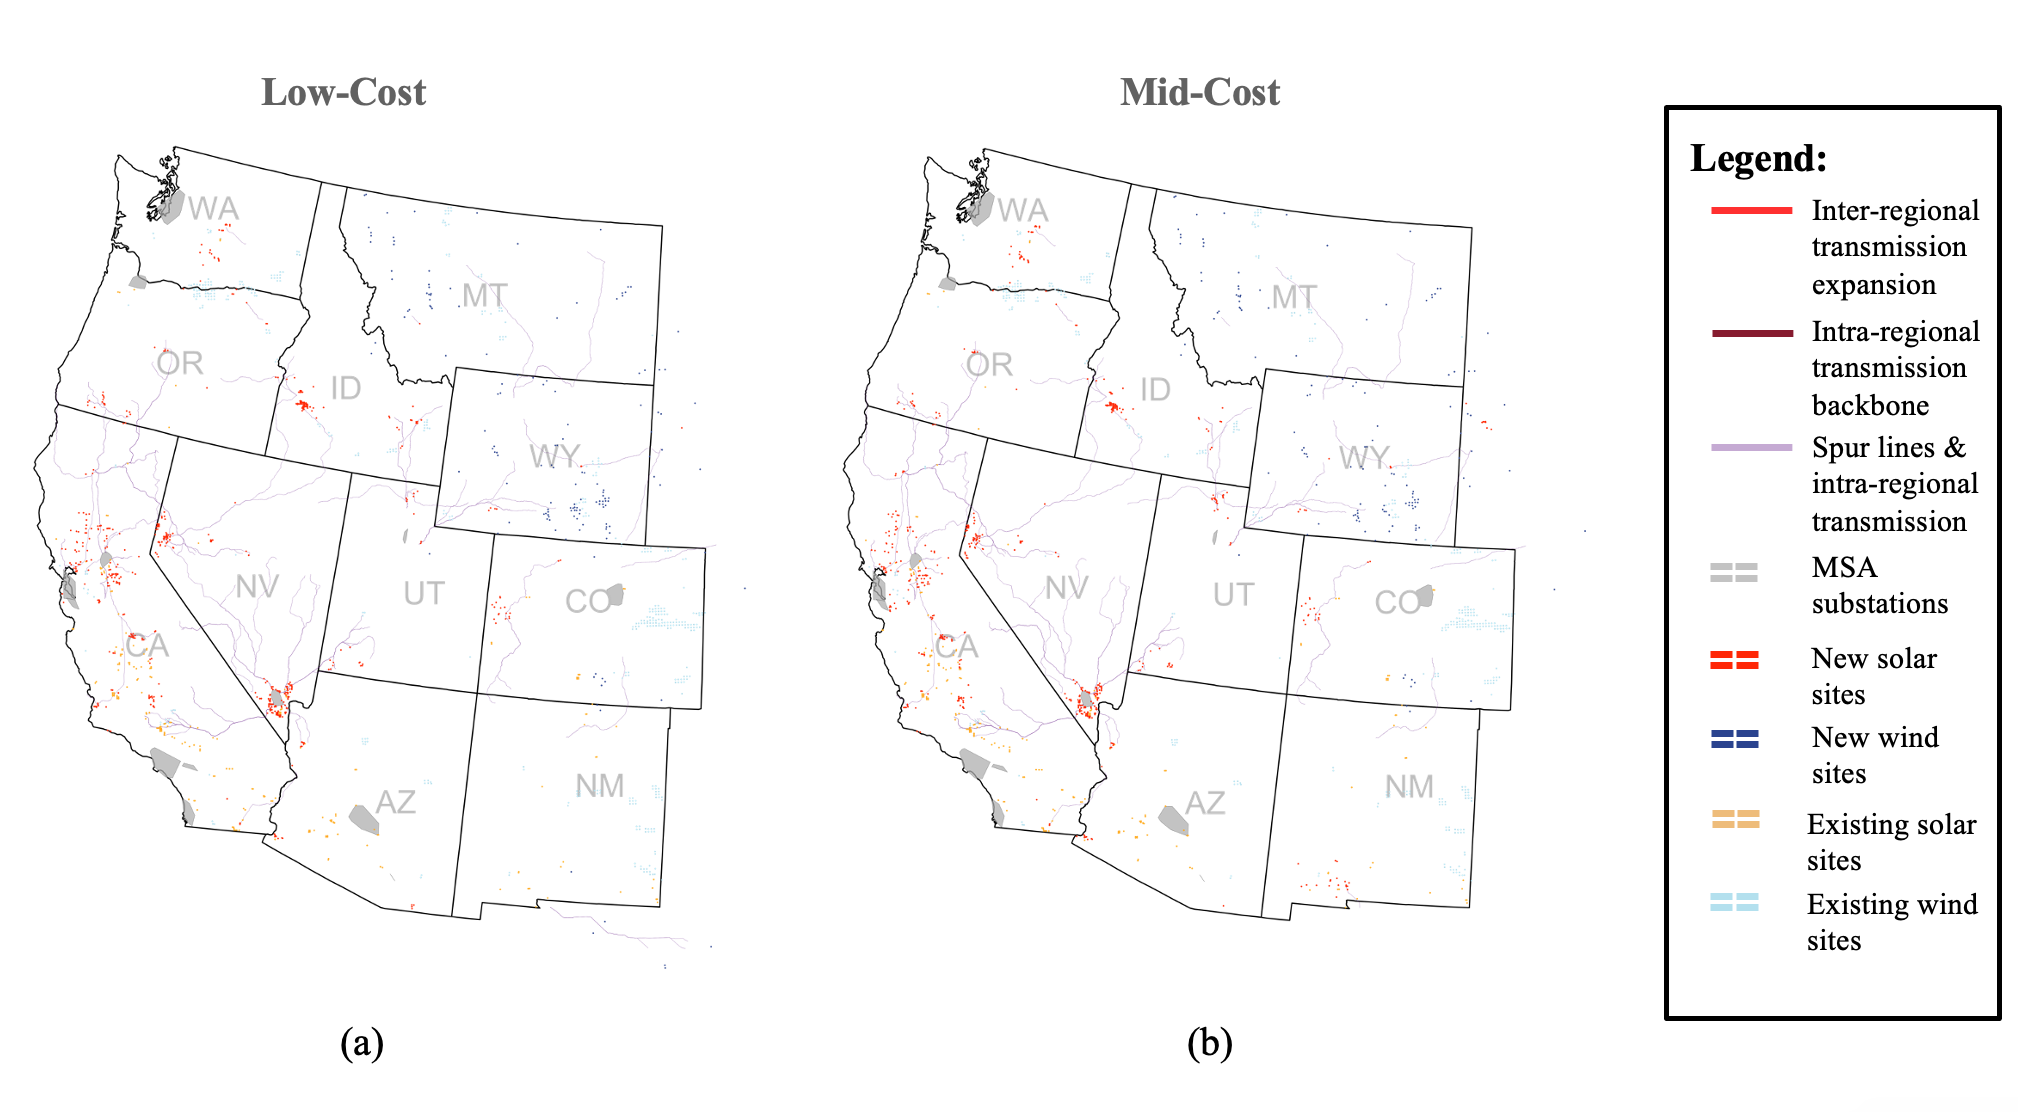
(a) Downscaled Results in Low-Cost Scenarios, (b) Downscaled Results in Mid-Cost Scenarios.
(a) Downscaled Results in Low-Cost Scenarios, (b) Downscaled Results in Mid-Cost Scenarios.
(a) Downscaled Results in Low-Cost Scenarios, (b) Downscaled Results in Mid-Cost Scenarios.

(a) Downscaled Results in Low-Cost Scenarios, (b) Downscaled Results in Mid-Cost Scenarios.
B.9 Site-Specific PV Generation and Battery Charging & Discharging
The following plots showcase the heat maps of (a) Solar PV generation of the largest solar PV-battery cluster in the region where the color gradient shifts when it exceeds the grid connection capacity and is thus charging the battery instead (GWh), and (b) the co-located battery charging (+1.0) and discharging (-1.0) for the 80% CES, low-cost scenario. No plot is shown for the WECC_PNW region since negligible battery capacity is built in the region, but all regions and their respective plots are shown below for the largest solar-PV battery site.
B.10 State-Level PV and Wind Plots

(a) PV Capacity Breakdown, (b) Wind Capacity Breakdown.
(a) PV Capacity Breakdown, (b) Wind Capacity Breakdown.
(a) PV Capacity Breakdown, (b) Wind Capacity Breakdown.
(a) PV Capacity Breakdown, (b) Wind Capacity Breakdown.
References
- Williams et al. [2021] J. H. Williams, R. A. Jones, B. Haley, G. Kwok, J. Hargreaves, J. Farbes, M. S. Torn, Carbon-neutral pathways for the united states, AGU Advances 2 (2021) e2020AV000284. URL: https://agupubs.onlinelibrary.wiley.com/doi/abs/10.1029/2020AV000284. doi:https://doi.org/10.1029/2020AV000284. arXiv:https://agupubs.onlinelibrary.wiley.com/doi/pdf/10.1029/2020AV000284, e2020AV000284 2020AV000284.
- Brown and Botterud [2021] P. R. Brown, A. Botterud, The value of inter-regional coordination and transmission in decarbonizing the us electricity system, Joule 5 (2021) 115–134. URL: https://www.sciencedirect.com/science/article/pii/S2542435120305572. doi:https://doi.org/10.1016/j.joule.2020.11.013.
- Rodríguez-Sarasty et al. [2021] J. A. Rodríguez-Sarasty, S. Debia, P.-O. Pineau, Deep decarbonization in northeastern north america: The value of electricity market integration and hydropower, Energy Policy 152 (2021) 112210. URL: https://www.sciencedirect.com/science/article/pii/S0301421521000793. doi:https://doi.org/10.1016/j.enpol.2021.112210.
- Frew et al. [2016] B. A. Frew, S. Becker, M. J. Dvorak, G. B. Andresen, M. Z. Jacobson, Flexibility mechanisms and pathways to a highly renewable us electricity future, Energy 101 (2016) 65–78. URL: https://www.sciencedirect.com/science/article/pii/S0360544216300032. doi:https://doi.org/10.1016/j.energy.2016.01.079.
- Princeton ZERO Lab et al. [2021] Princeton ZERO Lab, Evolved Energy Research, Carbon Impact Consulting, Montara Mountain Energy, Hyperobjekt, Preliminary Report: The Climate Impact of Congressional Infrastructure and Budget Bills, Technical Report, The REPEAT Team, 2021. URL: https://repeatproject.org/docs/REPEAT_Preliminary_Report_102021.pdf.
- Larson, E. et al. [2020] Larson, E., Greig, C., Jenkins, J.D., Mayfield, E., Pascale, A., Zhang, C., …, Swan, A., Williams, R., Net-Zero America by 2050: Potential Pathways, Infrastructure, and Impacts, Technical Report, Princeton University, 2020. URL: https://netzeroamerica.princeton.edu/.
- Klass and Wilson [2012] A. Klass, E. Wilson, Interstate transmission challenges for renewable energy: A federalism mismatch, Vanderbilt Law Review 65 (2012).
- Buijs et al. [2011] P. Buijs, D. Bekaert, S. Cole, D. Van Hertem, R. Belmans, Transmission investment problems in europe: Going beyond standard solutions, Energy Policy 39 (2011) 1794–1801. URL: https://www.sciencedirect.com/science/article/pii/S030142151100022X. doi:https://doi.org/10.1016/j.enpol.2011.01.012.
- Kassakian, J. G. et al. [2011] Kassakian, J. G., Schmalensee, R., Desgroseilliers, G., Heidel, T. D., Afridi, K., Farid, A. M., Grochow, J. M., Hogan, W. W., Jacoby, H. D., Kirtley, J. L., Michaels, H. G., Perez-Arriaga, I., Perreault, D. J., Rose, N. L., Wilson, G. L., The Future of the Electric Grid: An Interdisciplinary MIT Study, Technical Report, Massachusetts Institute of Technology, MIT Energy Initiative, 2011. URL: http://energy.mit.edu/wp-content/uploads/2011/12/MITEI-The-Future-of-the-Electric-Grid.pdf.
- Cohen et al. [2016] J. Cohen, K. Moeltner, J. Reichl, M. Schmidthaler, An Empirical Analysis of Local Opposition to New Transmission Lines Across the EU-27, The Energy Journal 0 (2016). URL: https://ideas.repec.org/a/aen/journl/ej37-3-cohen.html.
- Jenkins et al. [2021] J. D. Jenkins, E. N. Mayfield, E. D. Larson, S. W. Pacala, C. Greig, Mission net-zero america: The nation-building path to a prosperous, net-zero emissions economy, Joule 5 (2021) 2755–2761. URL: https://doi.org/10.1016/j.joule.2021.10.016. doi:10.1016/j.joule.2021.10.016.
- Fu, R. et al. [2018] Fu, R., Remo, T., Margolis, R., 2018 U.S. Utility-Scale Photovoltaics Plus-Energy Storage System Costs Benchmark, Technical Report NREL/TP-6A20-71714, National Renewable Energy Laboratory, Golden, CO, 2018. URL: https://www.nrel.gov/docs/fy19osti/71714.pdf.
- Eurek, K. et al. [2021] Eurek, K., Murphy, C., Cole, W., Frazier, W., Brown, P., Schleifer, A., Representing DC-Coupled PV+Battery Hybrids in a Capacity Expansion Model, Technical Report NREL/TP-5C00-77917, National Renewable Energy Laboratory, Golden, CO, 2021. URL: https://www.nrel.gov/docs/fy21osti/77917.pdf.
- Gorman et al. [2020] W. Gorman, A. Mills, M. Bolinger, R. Wiser, N. G. Singhal, E. Ela, E. O’Shaughnessy, Motivations and options for deploying hybrid generator-plus-battery projects within the bulk power system, The Electricity Journal 33 (2020) 106739. URL: https://www.sciencedirect.com/science/article/pii/S1040619020300312. doi:https://doi.org/10.1016/j.tej.2020.106739.
- Feldman et al. [2021] D. Feldman, K. Wu, R. Margolis, H1 2021 Solar Industry Update, Technical Report NREL/PR-7A40-80427, National Renewable Energy Laboratory, Golden, CO, 2021. URL: https://www.osti.gov/biblio/1808491. doi:10.2172/1808491.
- Denholm et al. [2017] P. L. Denholm, R. M. Margolis, J. D. Eichman, Evaluating the Technical and Economic Performance of PV Plus Storage Power Plants: Report Summary, Technical Report NREL/PR-6A20-69061, National Renewable Energy Laboratory, Golden, CO, 2017. URL: https://www.osti.gov/biblio/1378439. doi:10.2172/1378439.
- Wiser et al. [2021] R. H. Wiser, M. Bolinger, B. Hoen, D. Millstein, J. Rand, G. L. Barbose, N. R. Darghouth, W. Gorman, S. Jeong, A. D. Mills, B. Paulos, Land-based wind market report: 2021 edition (2021). URL: https://www.osti.gov/biblio/1818277. doi:10.2172/1818277.
- Bolinger et al. [2022] M. Bolinger, J. Seel, C. Warner, D. Robson, Utility-scale solar, 2022 edition: Empirical trends in deployment, technology, cost, performance, ppa pricing, and value in the united states (2022). URL: https://www.osti.gov/biblio/1888246. doi:10.2172/1888246.
- Rand, J. et al. [2022] Rand, J., Wiser, R., Gorman, W., Millstein, D., Seel, J., Jeong, S., Robson, D., Queued Up: Characteristics of Power Plants Seeking Transmission Interconnection As of the End of 2021, Technical Report, Lawrence Berkeley National Laboratory, 2022. URL: https://emp.lbl.gov/sites/default/files/queued_up_2021_04-13-2022.pdf.
- Gorman et al. [2022] W. Gorman, C. C. Montañés, A. Mills, J. H. Kim, D. Millstein, R. Wiser, Are coupled renewable-battery power plants more valuable than independently sited installations?, Energy Economics 107 (2022) 105832. URL: https://www.sciencedirect.com/science/article/pii/S0140988322000226. doi:https://doi.org/10.1016/j.eneco.2022.105832.
- Virguez et al. [2021] E. Virguez, X. Wang, D. Patiño-Echeverri, Utility-scale photovoltaics and storage: Decarbonizing and reducing greenhouse gases abatement costs, Applied Energy 282 (2021) 116120. URL: https://www.sciencedirect.com/science/article/pii/S0306261920315385. doi:https://doi.org/10.1016/j.apenergy.2020.116120.
- Levi et al. [2019] P. J. Levi, S. D. Kurland, M. Carbajales-Dale, J. P. Weyant, A. R. Brandt, S. M. Benson, Macro-energy systems: Toward a new discipline, Joule 3 (2019) 2282–2286. URL: https://www.sciencedirect.com/science/article/pii/S2542435119303617. doi:https://doi.org/10.1016/j.joule.2019.07.017.
- Brown et al. [2018] T. Brown, D. Schlachtberger, A. Kies, S. Schramm, M. Greiner, Synergies of sector coupling and transmission reinforcement in a cost-optimised, highly renewable european energy system, Energy 160 (2018) 720–739. URL: https://www.sciencedirect.com/science/article/pii/S036054421831288X. doi:https://doi.org/10.1016/j.energy.2018.06.222.
- Victoria et al. [2019] M. Victoria, K. Zhu, T. Brown, G. B. Andresen, M. Greiner, The role of storage technologies throughout the decarbonisation of the sector-coupled european energy system, Energy Conversion and Management 201 (2019) 111977. URL: https://www.sciencedirect.com/science/article/pii/S0196890419309835. doi:https://doi.org/10.1016/j.enconman.2019.111977.
- Liu et al. [2019] H. Liu, T. Brown, G. B. Andresen, D. P. Schlachtberger, M. Greiner, The role of hydro power, storage and transmission in the decarbonization of the chinese power system, Applied Energy 239 (2019) 1308–1321. URL: https://www.sciencedirect.com/science/article/pii/S0306261919302995. doi:https://doi.org/10.1016/j.apenergy.2019.02.009.
- Conlon et al. [2019] T. Conlon, M. Waite, V. Modi, Assessing new transmission and energy storage in achieving increasing renewable generation targets in a regional grid, Applied Energy 250 (2019) 1085–1098. URL: https://www.sciencedirect.com/science/article/pii/S0306261919309213. doi:https://doi.org/10.1016/j.apenergy.2019.05.066.
- Mallapragada et al. [2020] D. S. Mallapragada, N. A. Sepulveda, J. D. Jenkins, Long-run system value of battery energy storage in future grids with increasing wind and solar generation, Applied Energy 275 (2020) 115390. URL: https://www.sciencedirect.com/science/article/pii/S0306261920309028. doi:https://doi.org/10.1016/j.apenergy.2020.115390.
- Jenkins and Sepulveda [2017] J. D. Jenkins, N. A. Sepulveda, Enhanced Decision Support for a Changing Electricity Landscape : The GenX Configurable Electricity Resource Capacity Expansion Model Revision 1.0, Working Paper, MIT Energy Initiative, 2017.
- Sepulveda et al. [2018] N. A. Sepulveda, J. D. Jenkins, F. J. de Sisternes, R. K. Lester, The Role of Firm Low-Carbon Electricity Resources in Deep Decarbonization of Power Generation, Joule 2 (2018) 2403–2420. URL: http://www.sciencedirect.com/science/article/pii/S2542435118303866. doi:10.1016/j.joule.2018.08.006.
- Child et al. [2019] M. Child, C. Kemfert, D. Bogdanov, C. Breyer, Flexible electricity generation, grid exchange and storage for the transition to a 100% renewable energy system in europe, Renewable Energy 139 (2019) 80–101. URL: https://www.sciencedirect.com/science/article/pii/S0960148119302319. doi:https://doi.org/10.1016/j.renene.2019.02.077.
- Syranidou et al. [2020] C. Syranidou, J. Linssen, D. Stolten, M. Robinius, Integration of large-scale variable renewable energy sources into the future european power system: On the curtailment challenge, Energies 13 (2020). URL: https://www.mdpi.com/1996-1073/13/20/5490. doi:10.3390/en13205490.
- Martins Deschamps and Rüther [2019] E. Martins Deschamps, R. Rüther, Optimization of inverter loading ratio for grid connected photovoltaic systems, Solar Energy 179 (2019) 106–118. URL: https://www.sciencedirect.com/science/article/pii/S0038092X1831226X. doi:https://doi.org/10.1016/j.solener.2018.12.051.
- Schleifer et al. [2021] A. H. Schleifer, C. A. Murphy, W. J. Cole, P. L. Denholm, The evolving energy and capacity values of utility-scale pv-plus-battery hybrid system architectures, Advances in Applied Energy 2 (2021) 100015. URL: https://www.sciencedirect.com/science/article/pii/S2666792421000081. doi:https://doi.org/10.1016/j.adapen.2021.100015.
- Sepulveda et al. [2021] N. Sepulveda, J. D. Jenkins, D. S. Mallapragada, A. M. Schwartz, N. S. Patankar, Q. Xu, J. Morris, S. Chakrabarti, GenXProject/GenX, 2021. URL: https://github.com/GenXProject/GenX.
- Sepulveda et al. [2022] N. Sepulveda, J. D. Jenkins, D. S. Mallapragada, A. M. Schwartz, N. S. Patankar, Q. Xu, J. Morris, S. Chakrabarti, A. Manocha, aneeshaManocha/GenX, 2022. URL: https://github.com/aneeshamanocha/GenX/tree/vre-stor.
- Bezanson et al. [2017] J. Bezanson, A. Edelman, S. Karpinski, V. B. Shah, Julia: A fresh approach to numerical computing, SIAM Review 59 (2017) 65–98. URL: https://epubs.siam.org/doi/10.1137/141000671. doi:10.1137/141000671.
- Dunning et al. [2017] I. Dunning, J. Huchette, M. Lubin, Jump: A modeling language for mathematical optimization, SIAM Review 59 (2017) 295–320. doi:10.1137/15M1020575.
- U.S. EPA’s Clean Air Markets Division, Office of Air and Radiation [2018] U.S. EPA’s Clean Air Markets Division, Office of Air and Radiation, Documentation for EPA’s Power Sector Modeling Platform v6 Using the Integrated Planning Model, Technical Report, United States Environmental Protection Agency, 2018. URL: https://www.epa.gov/sites/default/files/2018-06/documents/epa_platform_v6_documentation_-_all_chapters_june_7_2018.pdf.
- Palmintier, Bryan S. [2013] Palmintier, Bryan S., Incorporating Operational Flexibility Into Electric Generation Planning: Impacts and Methods for System Design and Policy Analysis, PhD Dissertation, Massachusetts Institute of Technology, 2013. URL: https://dspace.mit.edu/handle/1721.1/79147.
- Schivley et al. [2021] G. Schivley, E. Welty, N. Patankar, PowerGenome/PowerGenome: v0.4.0, 2021. URL: https://doi.org/10.5281/zenodo.4426097. doi:10.5281/zenodo.4426097.
- NREL [2020] NREL, 2020 annual technology baseline, 2020. https://atb.nrel.gov/, Accessed: 11-28-2021.
- Mai et al. [2018] T. Mai, P. Jadun, J. Logan, C. McMillan, M. Muratori, D. Steinberg, L. Vimmerstedt, R. Jones, B. Haley, B. Nelson, C. Murphy, Y. Sun, Electrification futures study load profiles, 2018. https://data.nrel.gov/submissions/126, Accessed: 11-28-2021.
- Jadun et al. [2018] P. Jadun, T. Mai, C. Murphy, Y. Sun, M. Muratori, B. Nelson, R. Jones, J. Logan, Electrification futures study flexible load profiles, 2018. https://data.nrel.gov/submissions/127, Accessed: 11-28-2021.
- Corporation [2020] N. A. E. R. Corporation, 2020 Summer Reliability Assessment, 2020. https://www.nerc.com/pa/RAPA/ra/Reliability%20Assessments%20DL/NERC_SRA_2020.pdf, Accessed: 11-28-2021.
- Walker et al. [2020] A. Walker, E. Lockhart, J. Desai, K. Ardani, G. Klise, O. Lavrova, T. Tansy, J. Deot, B. Fox, A. Pochiraju, Model of Operation-and-Maintenance Costs for Photovoltaic Systems, Technical Report NREL/TP-5C00-74840, National Renewable Energy Laboratory, Golden, CO, 2020. URL: https://www.nrel.gov/docs/fy20osti/74840.pdf.
- EIA [2021] EIA, Natural Gas Prices, 2021. https://www.eia.gov/dnav/ng/ng_pri_sum_a_EPG0_PEU_DMcf_m.htm, Accessed: 11-28-2021.
- National Conference of State Legislators [2021] National Conference of State Legislators, State Renewable Portfolio Standards and Goals, 2021. https://www.ncsl.org/research/energy/renewable-portfolio-standards.aspx.
- Department of Energy [2016] Department of Energy, Leveraging Federal Renewable Energy Tax Credits, Technical Report DOE/EE-1509, U.S. Department of Energy Energy Efficiency and Renewable Energy, 2016. URL: https://www.energy.gov/sites/prod/files/2016/12/f34/Leveraging_Federal_Renewable_Energy_Tax_Credits_Final.pdf.
- Patankar et al. [2022] N. Patankar, X. Sarkela-Basset, G. Schivley, E. Leslie, J. Jenkins, Land use trade-offs in decarbonization of electricity generation in the american west, 2022. URL: https://arxiv.org/abs/2211.05062. doi:10.48550/ARXIV.2211.05062.
- Jenkins and Sepulveda [2021] J. D. Jenkins, N. A. Sepulveda, Long-duration energy storage: A blueprint for research and innovation, Joule 5 (2021) 2241–2246. URL: https://www.sciencedirect.com/science/article/pii/S2542435121003585. doi:https://doi.org/10.1016/j.joule.2021.08.002.
- Manocha et al. [2023] A. Manocha, N. Patankar, J. D. Jenkins, Reducing transmission expansion by co-optimizing sizing of wind, solar, storage, and grid connection capacity: Raw data, 2023. doi:10.5281/zenodo.7719103.
- Catalyst-Cooperative [2020] Catalyst-Cooperative, Public Utility Data Liberation (PUDL), 2020. doi:10.5281/zenodo.3672068, https://doi.org/10.5281/zenodo.3404014.
- NREL [2019] NREL, NREL: Regional multipliers, 2019. https://atb-archive.nrel.gov/electricity/2019/regional-capex.html, Accessed: 6-25-2020.
- Larsen [2016] P. H. Larsen, A method to estimate the costs and benefits of undergrounding electricity transmission and distribution lines, Energy Economics 60 (2016) 47–61. URL: https://www.sciencedirect.com/science/article/pii/S0140988316302493. doi:https://doi.org/10.1016/j.eneco.2016.09.011.
- Gorman et al. [2019] W. Gorman, A. Mills, R. Wiser, Improving estimates of transmission capital costs for utility-scale wind and solar projects to inform renewable energy policy, Energy Policy 135 (2019) 110994. URL: https://www.sciencedirect.com/science/article/pii/S0301421519305816. doi:https://doi.org/10.1016/j.enpol.2019.110994.