\pkgwaywiser: Ergonomic Methods for Assessing Spatial Models
Michael J Mahoney
\Plaintitlewaywiser: Ergonomic Methods for Assessing Spatial Models
\Abstract
Assessing predictive models can be challenging. Modelers must navigate a wide array of evaluation methodologies implemented with incompatible interfaces across multiple packages which may give different or even contradictory results, while ensuring that their chosen approach properly estimates the performance of their model when generalizing to new observations. Assessing models fit to spatial data can be particularly difficult, given that model errors may exhibit spatial autocorrelation, model predictions are often aggregated to multiple spatial scales by end users, and models are often tasked with generalizing into spatial regions outside the boundaries of their initial training data.
The \pkgwaywiser package for the \proglangR language attempts to make assessing spatial models easier by providing an ergonomic toolkit for model evaluation tasks, with functions for multiple assessment methodologies sharing a unified interface. Functions from \pkgwaywiser share standardized argument names and default values, making the user-facing interface simple and easy to learn. These functions are additionally designed to be easy to integrate into a wide variety of modeling workflows, accepting standard classes as inputs and returning size- and type-stable outputs, ensuring that their results are of consistent and predictable data types and dimensions. Additional features make it particularly easy to use \pkgwaywiser along packages and workflows in the tidymodels ecosystem.
\Keywordsspatial modeling, model assessment, applicability domains, \proglangR
\Plainkeywordsspatial modeling, model assessment, applicability domains, R
\Address
Michael J Mahoney
State University of New York College of Environmental Science and Forestry
Graduate Program in Environmental Science
1 Forestry Drive
Syracuse, NY, USA
E-mail:
URL: https://mm218.dev/
\makesavenoteenvlongtable
1 Introduction
Assessing predictive models can be challenging. Modelers must pick from a wide variety of evaluation approaches, each of which may give different and even contradictory results (reich1999), and ensure that their chosen approach will properly estimate their model’s performance when generalizing to observations not used to train the model. Even more complicated is assessing models fit to spatial data, where errors may not be randomly distributed across the study area (legendre1989), predictions are often aggregated into larger units which may compound existing spatial error patterns, requiring model accuracy assessments at multiple spatial scales (riemann2010), and models are often used to predict areas outside of the spatial boundary of the initial study area (meyer2021).
Statistical software can help mitigate some of the complexity created by the array of considerations and approaches for evaluating models fit to spatial data. By providing a common user interface for multiple well-established evaluation procedures, software can make it easier for users to switch between evaluation approaches as appropriate for their current task, helping reduce some of the cognitive load associated with switching between different tasks (roehm2012). User interfaces should also make it easy to follow scientific and statistical best practices, and similarly make it difficult to commit methodological errors (tidymodels).
Many excellent \proglangR packages aim to help reduce this complexity and promote best practices by addressing individual aspects of model evaluation. Among many others, packages like \pkgyardstick (yardstick), \pkgmetrica (metrica), and \pkghydroGOF (hydroGOF) provide suites of metrics for model assessment, providing standard interfaces for calculating model accuracy and agreement given vectors of observed and predicted values. Packages like \pkgspdep (spdep) and \pkgrgeoda (rgeoda), meanwhile, provide measures of spatial autocorrelation, helping modelers assess the spatial distribution of model errors. Finally, several packages implement additional evaluation approaches beyond standard error assessments; for instance, \pkgCAST (CAST) and \pkgapplicable (applicable) implement approaches for calculating model applicability domains.
The new \pkgwaywiser package implements elements of each of these approaches, while providing a consistent, ergonomic user interface for each aspect of model assessment. Functions in \pkgwaywiser provide new implementations of several popular assessment metrics from the spatial modeling literature, and provide a wrapper around functions for calculating spatial autocorrelation metrics. Additional functions provide an approach for assessing model predictions aggregated to multiple spatial scales, and a new implementation of the dissimilarity index and area of applicability from meyer2021. These functions share a consistent interface, with standardized argument names and definitions, making it easy for users to learn how to use the package, and to switch between evaluation approaches as desired.
Outputs from \pkgwaywiser are both type-stable and size-stable, making \pkgwaywiser functions both predictable and easy to program with. Functions in \pkgwaywiser additionally accept inputs and return outputs using standard classes, using objects from the popular \pkgsf (sf) package for spatial data and simple data frames and vectors otherwise. This predictability and reliance on well-established classes makes it easy to use \pkgwaywiser with the majority of modeling tools in \proglangR. Additional features make it particularly easy to combine \pkgwaywiser with packages in the tidymodels modeling framework (tidymodels). For instance, while \pkgwaywiser does not itself provide any functions for performing cross-validation or hyperparameter selection, functions from waywiser integrate naturally with the \pkgtune package (tune), allowing for cross-validated model assessment using data splits from \pkgrsample (rsample) and \pkgspatialsample (spatialsample) and automated hyperparameter selection using \pkgdials (dials).
The rest of this article walks through features in \pkgwaywiser, starting with functions implementing (or wrapping implementations of) model assessment metrics (Section LABEL:sec-assessment-metrics), followed by methods for assessing model performance when aggregating predictions across multiple spatial scales (Section 3), then by functions for calculating the applicability domain of a model (Section LABEL:sec-aoa). An additional section discusses how \pkgwaywiser integrates with the tidymodels modeling framework (Section LABEL:sec-interop).
2 Example data
For demonstration purposes, this paper will assess a linear model fit to the worldclim_simulation data included in \pkgwaywiser, containing a random sample of 10,000 points from the WorldClim Bioclimatic variables data set (worldclim). Variable “bio2” records the mean monthly diurnal temperature range, “bio10” the mean temperature of the warmest 3 months of the year, “bio13” the precipitation of the wettest month of the year, and “bio19” the precipitation of the coldest 3 months of the year. A final variable, “response”, was simulated using the \pkgvirtualspecies package following examples in \pkgCAST (virtualspecies; CAST).
To create this model, we will first split our data into training and test sets, resembling a standard predictive modeling workflow. For simplicity, we will assign observations to these sets at random; in actual practice, it would be best to use spatial cross-validation approaches in order to address any spatial autocorrelation in the response variable (spatialsample).
R> set.seed(1107) R> data("worldclim_simulation", package = "waywiser") R> worldclim_training <- sample(nrow(worldclim_simulation), + nrow(worldclim_simulation) * 0.8) R> worldclim_testing <- worldclim_simulation[-worldclim_training, ] R> worldclim_training <- worldclim_simulation[worldclim_training, ]
We then fit a linear model using base \proglangR’s lm() function, and use the resulting model to generate predictions for our test set:
R> worldclim_model <- lm(response bio2 + bio10 + bio13 + bio19, + data = worldclim_training) R> worldclim_testing
2.1 Agreement metrics
Several functions in \pkgwaywiser revolve around calculating model agreement metrics: numeric indices of how closely model predictions (which we refer to as ) align with another data set (), with typically (but not necessarily) representing “true” measured values. This set of metrics generally originated within the spatial modeling literature and are most popular for assessing models fit to spatial data, but do not incorporate any geographic information into their calculation.
For instance, in a series of papers, Willmott willmott1980; willmott1981; willmott1982 introduced a index of agreement, . This metric represents the agreement of model predictions () with observed values () as the ratio of the sum of squared differences to the sum of the absolute values of differences in predicted and observed values from the observed mean (); that is:
| (1) |
This formulation means that is bounded , with higher values of indicating greater agreement between and . As a dimensionless metric, is a useful tool for comparing models; however, the use of summed differences in the numerator means that is oversensitive to outliers in (legates1999). To address this concern, Willmott et al. (willmott1985) introduced a revised metric named , using the sum of the absolute values of differences in the place of the sum of squared differences and no longer squaring the denominator:
| (2) |
As with , is bounded with higher values indicating improved agreement; Willmott (willmott2011) notes that approaches 1 more slowly than , allowing for finer-grained comparisons between well-performing models.
Willmott et al. revisited these indices twenty-five years later (willmott2011), noting that interpretation of and was made difficult both by the limited range of the metric and by the inclusion of in the denominator, which made the scaling factor of the agreement metric dependent upon the model itself. To address this, they introduce a new metric , such that:
| (3) |
Where is a scaling constant set to 2. A full derivation is provided in willmott2011.
Compared to and , provides a larger metric range (being bounded , with 1 indicating perfect agreement) and is more directly interpretable; is proportional to the mean absolute error divided by times the mean absolute deviation.
These agreement metrics are all asymmetric, assuming that values are more accurate than . This makes this set of metrics useful when comparing model predictions against measured values, as measured values used to train models are generally assumed to be more trustworthy than model predictions. However, in some model assessment scenarios it can be desirable to treat both and as capable of containing error. For instance, when comparing two distinct sets of model predictions, it is typically desirable to not treat whichever set of predictions is labeled as as being inherently more accurate.
For this reason, ji2006 introduce an agreement coefficient, , which is symmetrical and allows for errors in both and :
| (4) |
Unlike and related metrics, is symmetrical, producing identical values if and are reversed. This makes a preferable metric for comparing predictions from models, as it does not assume either set of predictions to be more accurate than the other. ji2006 describe as bounded , as when and (as would occur under a null model) the fractional term simplifies to 1 and thus is 0. In practice however, the null model is not the true lower bound for how poorly two data sets can agree with one another; it is entirely possible for poor models with large differences between and to produce negative estimates, with true bounds of . Worse agreement between and produces smaller values.
In addition to these dimensionless agreement metrics, these authors also suggest a host of metrics for model assessment in units of , which may then be decomposed into systematic and unsystematic components. For instance, willmott1981 walks through the decomposition of the familiar mean squared error ():
| (5) |
Into its systematic and unsystematic components, with the systematic component of given by:
| (6) |
And the unsystematic component of given by:
| (7) |
Where is the predicted value of from the linear regression model . These two components sum to :
| (8) |
As is in squared units of , it is typically more useful to use the root mean squared error () and its systematic and unsystematic components, calculated by taking the square root of and its components.
ji2006 present a similar decomposition for their metric, using a geometric mean functional relationship (GMFR) model in place of the linear regression to allow for errors in both and (draper1997). The GMFR is estimated such that:
| (9) | ||||
Where the sign of is the same sign as the correlation coefficient between and . This regression equation can be reversed to predict , represented by , as a function of :
| (10) |
ji2006 use these quantities to decompose the sum of squared differences into systematic and unsystematic components, which they refer to as the systematic and unsystematic sum of product differences (). The unsystematic component of is defined as:
| (11) |
While the systematic component is found by subtracting from the sum of squared differences:
| (12) |
Taking the arithmetic mean of these terms produces the unsystematic and systematic mean product difference ( and , respectively):
| (13) |
| (14) |
These quantities can be expressed as a ratio of MSE to represent the proportion of systematic and unsystematic disagreement between and . The square roots of and ( and , respectively) are in units of and may be useful ways to describe systematic and unsystematic disagreement in absolute units.
As and sum to the sum of squared differences, the numerator of (Equation (4)) can then be decomposed into systematic and unsystematic components by replacing the numerator with the appropriate component of :
| (15) |
| (16) |
These metrics are all implemented in \pkgwaywiser using the infrastructure provided by \pkgyardstick (yardstick). Functions are prefixed with ww_, to help with autocompletion inside of code editors, and all share identical user interfaces. The main version of each metric function takes three primary arguments, namely data (an object inheriting the data.frame S3 class), truth (the name of the column containing ), and estimate (the name of the column containing ). Both truth and estimate follow tidy evaluation rules, with the main user-noticeable effect being that these arguments accept either quoted or unquoted column identifiers. These functions return a “tibble” (tibble) with a single row and three columns, .metric (containing the name of the metric), .estimator (containing the string “standard”, for compatibility with \pkgyardstick and the broader tidymodels ecosystem), and .estimate (containing the metric estimate).
R> waywiser::ww_willmott_d(data = worldclim_testing, + truth = response, + estimate = predictions) {CodeOutput} # A tibble: 1 x 3 .metric .estimator .estimate <chr> <chr> <dbl> 1 willmott_d standard 0.919
When data is a grouped data frame, as produced by the group_by() function in \pkgdplyr (dplyr), \pkgwaywiser will calculate metrics independently for each group. In these cases, the resulting tibble will have one row per group and include the columns used to group the data alongside the standard .metric, .estimator, and .estimate columns:
R> worldclim_testing
In addition to its set of agreement metrics, \pkgwaywiser provides a set of functions for measuring spatial autocorrelation in model residuals. These functions provide a thin wrapper over functions provided by the \pkgspdep package (spdep; bivand2022; applied2008), meaning that (unlike the agreement metrics) metric calculations are not implemented directly in \pkgwaywiser. Equations in this section are largely derived from spdep.
Spatial autocorrelation metrics are designed to detect if values among neighboring observations are more related to each other than to a randomly selected observation; that is, if similar values are more clustered together or more dispersed than would be expected at random. In order to assess variable relationships between neighboring observations, it is necessary to first define which observations neighbor one another. A utility function in \pkgwaywiser, ww_build_neighbors(), can be used to do so automatically for classes from the \pkgsf package, though it is often preferable for users to more thoughtfully calculate neighbors and provide the resulting object to functions instead. When working with polygon geometries, ww_build_neighbors() uses the default behavior of the poly2nb() function from \pkgspdep, defining neighbors as any polygons sharing at least one boundary point. We can visualize this using the standard “moral statistics” data set from guerry:
R> data("guerry", package = "waywiser") R> plot(sf::st_geometry(guerry)) R> plot(waywiser::ww_build_neighbors(guerry), + sf::st_geometry(guerry), add = TRUE)

When working with point geometries, \pkgwaywiser instead uses the knearneigh() and knn2nb() functions from \pkgspdep with k = 1, returning a list of each point’s nearest neighbor.
R> plot(waywiser::ww_build_neighbors(worldclim_testing), + sf::st_geometry(worldclim_testing)) R> plot(sf::st_geometry(worldclim_testing), add = TRUE)

For calculations, this neighbor list object must be transformed into a matrix of spatial weights, . Another utility function in \pkgwaywiser, ww_build_weights(), provides a thin wrapper around the nb2listw() function from \pkgspdep, by default producing a row-standardized spatial weights matrix.
R> waywiser::ww_build_weights(guerry) {CodeOutput} Characteristics of weights list object: Neighbour list object: Number of regions: 85 Number of nonzero links: 420 Percentage nonzero weights: 5.813149 Average number of links: 4.941176
Weights style: W Weights constants summary: n nn S0 S1 S2 W 85 7225 85 37.2761 347.6683
Measures of spatial autocorrelation use this matrix in computations to estimate the relationship between variables at neighboring locations. For \pkgwaywiser, this variable is typically assumed to be the model residual, which we will refer to as , so that for a given observation , . By far the most popular spatial autocorrelation metric is Moran’s I (moran1950), defined as:
| (17) |
Where is the number of observations, the sum of all , and . is generally bounded when using row-standardized weights matrices, with positive values significantly greater than the expected value indicating positive autocorrelation.
anselin1995 later expanded upon , presenting a method to estimate “local” values at each observation rather than relying upon a single autocorrelation statistic to represent the entire study area:
| (18) |
Where (spdep).
A less frequently used alternative to is Geary’s (geary1954), defined as:
| (19) |
As with Moran’s , stated this way provides a single index of spatial autocorrelation across the entire study area. Values of are greater than or equal to 0, with low values relative to the expected value of 1 reflecting positive autocorrelation. anselin1995 extended in a similar manner to , providing a method to estimate local values for each observation in a data set, with further elaboration provided in anselin2018:
| (20) |
A final metric of local spatial autocorrelation provided in \pkgwaywiser is Getis-Ord’s (getis2010; ord2010). As with the other spatial autocorrelation metrics provided, the function implementing in \pkgwaywiser is a thin wrapper over a function from \pkgspdep, which calculates as a standard deviate (spdep; getis1996local):
| (21) |
Where and . An extension of this metric, removes the requirement that by including as a neighbor of itself, resulting in the formula (spdep; getis1996local):
| (22) |
Where and . In practice, both and generally provide similar information (getis2010).
Much as with the model agreement metrics, spatial autocorrelation metrics are implemented in \pkgwaywiser using the infrastructure provided by \pkgyardstick (yardstick), with functions prefixed with ww_ for autocompletion. As before, these functions take data, truth, and estimate as arguments, and return a tibble with .metric, .estimator, and .estimate for columns:
R> waywiser::ww_global_moran_i(worldclim_testing, + truth = response, + estimate = predictions) {CodeOutput} # A tibble: 1 x 3 .metric .estimator .estimate <chr> <chr> <dbl> 1 global_moran_i standard 0.809
As discussed above, by default \pkgwaywiser will automatically create the spatial weights matrix for calculations using ww_build_weights(). To let users alter this behavior, functions for estimating spatial autocorrelation also accept an argument, wt, containing either the spatial weights matrix to use in calculations or a function to create the matrix from data:
R> waywiser::ww_global_geary_c(worldclim_testing, + truth = response, + estimate = predictions, + wt = waywiser::ww_build_weights) {CodeOutput} # A tibble: 1 x 3 .metric .estimator .estimate <chr> <chr> <dbl> 1 global_geary_c standard 0.159
As the _vec variants of these functions do not take an argument for data, \pkgwaywiser cannot automatically create a spatial weights matrix, and one must be provided to the wt argument:
R> waywiser::ww_global_geary_c_vec( + truth = worldclim_testingpredictions, + wt = waywiser::ww_build_weights(worldclim_testing)) {CodeOutput} [1] 0.1593391
As previously mentioned, functions from \pkgwaywiser are both type- and size-stable, guaranteeing that the outputs from a function will always be of a known data type and of known dimensions. For model agreement metrics and global autocorrelation statistics, this means that the output from \pkgwaywiser will always be a tibble with one row (or, for grouped data frames, one row per group). This behavior changes for local autocorrelation metrics, however: rather than returning a single row, local autocorrelation functions return a tibble with as many rows as there are observations in data (or values in truth and estimate, for the _vec variants). These estimates are ordered in the same order as the input data frame, meaning that the outputs from these functions can be used with cbind() to associate an autocorrelation estimate with its corresponding observation.
R> waywiser::ww_local_moran_i(worldclim_testing, + truth = response, + estimate = predictions) |> head(2) {CodeOutput} # A tibble: 2 x 3 .metric .estimator .estimate <chr> <chr> <dbl> 1 local_moran_i standard 0.290 2 local_moran_i standard 4.00
Autocorrelation metrics are useful for informing qualitative assessments of model performance, with local statistics in particular being more useful for data exploration tasks than inference (anselin2018). For instance, when evaluating our linear model fit to simulation data, visually inspecting local statistics (plotted in Figure 3 using \pkgggplot2 (ggplot2) and \pkgpatchwork (patchwork)) indicate notable clustering of residuals in southern India. Local statistics meanwhile highlight the same location as an area of concern, but also highlight several other regions in southeastern Asia, as well as areas in western Africa and South America.
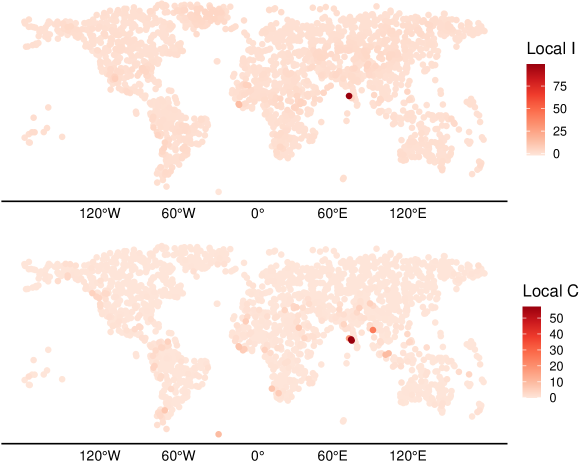
The presence of spatial autocorrelation in model residuals suggests a misspecification in the underlying model. Similarities between regions exhibiting residual autocorrelation may help to identify missing predictors, or to explain model weaknesses.
3 Multi-scale assessment
Spatial models are often used to predict the most fine-grain scale of interest, with predictions then aggregated to broader scales as necessary. For instance, models of forest aboveground biomass are often used to predict biomass at individual measurement plots, and then aggregated to provide biomass estimates at regional or landscape scales (johnson2022; blackard2008). Similarly, models of nematode biomass are used to estimate biomass at fine-grained resolutions, with predictions then aggregated to produce global estimates (vandenhoogen2019). Unfortunately, model performance estimates cannot be assumed to be consistent across spatial scales (nelson2009). As a result, separate performance metrics must be calculated for each relevant scale of interest.
To this end, riemann2010 introduced an assessment protocol for evaluating model performance across multiple scales of aggregation. This method requires calculating multiple performance estimates from model predictions and measured values aggregated to multiple grids of regular polygons, in order to assess how model performance varies spatially and across multiple scales. This approach is implemented in \pkgwaywiser as the function ww_multi_scale(). As with the model assessment functions already described, this function accepts the arguments data, truth, and estimate, as well as a new argument metrics which accepts lists of metric functions (or outputs from yardstick::metric_set()) to calculate at each scale of aggregation. Additional arguments can be passed via ... to sf::st_make_grid() in order to assess predictions aggregated to a grid of evenly spaced regular polygons. For example, the following code evaluates the RMSE and Willmott’s values for the WorldClim model aggregated using a 2-by-2, 5-by-5, and 10-by-10 grid:
R> (multi_scale_output <- waywiser::ww_multi_scale( + worldclim_testing, + truth = response, + estimate = predictions, + metrics = list(yardstick::rmse, waywiser::ww_willmott_d1), + n = c(2, 5, 10)))