On excess entropy and latent heat in crystallizing white dwarfs
Abstract
Based on the linear mixing approach, we calculate the latent heat for crystallizing fully-ionized 12C/16O and 16O/20Ne mixtures in white dwarf (WD) cores for two different parametrizations of the corrections to the linear-mixing energies and with account of ion quantum effects. We report noticeable composition-dependent deviations of the excess entropy in both directions from the standard value of 0.77 per ion. Within the same framework, we evaluate the excess entropy and released or absorbed heat accompanying the exsolution process in solidified WD layers. The inclusion of this effect is shown to be important for reliable interpretation of WD cooling data. We also analyze the latent heat of crystallizing eutectic 12C/22Ne mixture, where we find a qualitative dependence of both the phase diagram and the latent heat behaviour on ion quantum effects. This may be important for the model with 22Ne distillation in cooling C/O/22Ne WD proposed as a solution for the ultramassive WD multi-Gyr cooling anomaly. Astrophysical implications of our findings for crystallizing WD are discussed.
keywords:
dense matter – equation of state – white dwarfs – stars: neutron.1 Introduction
Recent progress in white dwarf (WD) observations, made possible by the European Space Agency Gaia mission (Gaia Collaboration et al., 2018), have revealed certain deficienies in our understanding of evolution of these seemingly simple objects. In particular, Cheng, Cummings & Ménard (Cheng et al.2019) have shown that a fraction of massive WD experiences a gigantic cooling delay of Gyr unaccounted for by standard models. Discoveries like this have tremendous impact on astrophysics, in which WD serve as cosmic chronometers, allowing one to gauge the age of various stellar populations (e.g. Fontaine, Brassard & Bergeron, Fontaine et al.2001; Tremblay et al., 2014), and on strongly-coupled plasma physics. The latter is ultimately responsible for the multitude of processes in dense WD interiors, which manifest themselves in such spectacular ways, but cannot be emulated in terrestrial laboratories.
The experimental advance has been accompanied by and has motivated new theoretical work on various aspects of WD physics (see e.g. Saumon, Blouin & Tremblay, Saumon et al.2022, for a recent review). This includes, the ingenious distillation model proposed as a solution for the ultramassive WD cooling anomaly (Blouin, Daligault & Saumon, Blouin et al.2021), recent work on diffusion in strongly-coupled plasma (e.g. Hughto et al., 2010; Beznogov & Yakovlev, 2013; Stanton & Murillo, 2016; Bauer et al., 2020; Caplan, Bauer & Freeman, Caplan et al.2022), on classic binary and ternary phase diagrams (e.g. Blouin et al., 2020; Caplan, Horowitz & Cumming, Caplan et al.2020; Blouin & Daligault, 2021), on thermodynamics of fully ionized strongly-coupled quantum one-component plasma (OCP) of ions (e.g. Baiko & Yakovlev, 2019; Baiko & Chugunov, 2022). Based on the latter work, phase diagrams of quantum binary ionic mixtures have been analyzed using the linear mixing formalism by Baiko (2022) (hereafter Paper I).
In this letter, we aim to contribute to the WD cooling theory by calculating the excess entropy and heat release or absorption accompanying crystallization and exsolution111Exsolution is a process, by which a single solid solution, stable at higher temperatures, at lower temperatures, unmixes into two separate solid phases. The process is well-known on Earth, where it can result in a formation of megascopic lamellar structures, e.g. \urlhttps://en.wikipedia.org/wiki/Perthite processes in 12C/16O and 16O/20Ne mixtures. In particular, we apply the same formalism as in Paper I to analyze the dependence of the excess entropy of crystallization and exsolution on energy parametrization and on mixture type and composition as well as to estimate the importance of ion quantum effects. We also study the phase diagram and the latent heat of crystallization for the eutectic 12C/22Ne mixture at classic and quantum densities.
2 Methods and results
In Fig. 1a, we remind a few results of Paper I. Shown are phase diagrams of 12C/16O and 16O/20Ne fully-ionized binary ionic mixtures under various assumptions. -axis is the temperature in units of classic melting temperature of the lighter component, [, , is the electron density, and ]. -axis is the number fraction of the heavier component, . Upper and lower portions of the plot display crystallization curves and miscibility gaps, respectively. Solid (red) lines correspond to 12C/16O mixture at (essentially classic) electron density of pure carbon at g cm-3, assuming correction to the linear-mixing energy given by the fit of Ogata et al. (1993) and residual entropy of the solid equal to (see Paper I for details). Dashed (blue) curves use the fit of DeWitt & Slattery (2003) and thus demonstrate sensitivity to a different energy correction parametrization. Short-dashed (magenta) curves assume a higher electron density corresponding to pure carbon at g cm-3 and illustrate ion quantum effects222Mass densities g cm-3 are typically not used in contemporary WD models but can be easily encountered in outer neutron star crust, where physics is very similar to that of WD interior. We use such an extreme density to illustrate maximum theoretically achievable strength of ion quantum effects in compact stars. Another possibility would be to consider helium at g cm-3. for 12C/16O mixture. Finally, the dot-dashed (green) curves are the same as the solid ones but for 16O/20Ne mixture.
Our first goal is to calculate the excess entropy between phases shown in Fig. 1a and any calorific effect associated with it. In order to obtain the excess entropy, one needs to find the entropies of two phases at their phase boundaries, i.e. at fraction values, for which the phases are in equilibrium with each other at a given temperature. Then take a difference between them. The entropies in question can be written as , where is the system energy and is its Helmholtz free energy. Linear mixing expressions for in the liquid and solid phases are given e.g. in Paper I. Analagous formulae for can be derived from them in a straightforward manner.
In Fig. 1b, by curves of the same type, we show respective excess entropy per ion at crystallization as a function of in the liquid phase, . Upon multiplication by melting temperature, corresponding to this , it yields the respective latent heat of crystallization. For pure matter ( or 1), the excess entropy approaches its OCP value, which is a smooth function of density due to ion quantum effects (cf. Baiko & Chugunov, 2022). However, for intermediate fractions, can noticeably deviate from this value. The amplitude of the deviation depends on mixture type, being larger for 12C/16O mixture than for 16O/20Ne. It is also sensitive to the assumed parametrization of the correction to the solid-state linear-mixing energy. For instance, in the classic situation, for the Ogata et al. (1993) fit, the minimum excess entropy is at and melting temperature . The maximum excess entropy is at and . For the DeWitt & Slattery (2003) fit, the minimum excess entropy occurs at and , whereas the maximum excess entropy takes place at and .
In Fig. 1c, we show the excess entropy accompanying the exsolution process. In this case, , where indices ‘orig’ and ‘new’ refer to, respectively, the parent solid solution and the one nucleating from it upon cooling to the miscibility gap. The -axis shows the heavier element fraction in the parent solution, . The curve type has the same meaning as above. Note, that ion quantum effects cancel out when one determines the miscibility gap shape (see Paper I) but not the associated excess entropy. Thus, solid and short-dashed curves coincide in the lower portion of Fig. 1a but not in Fig. 1c. All curves cross zero at , which corresponds to maxima of their respective miscibility gaps. If in the original solution is to the left of the gap maximum, the exsolution results in a heat release of per each exsolved ion, where is the miscibility gap temperature at the parent . In the opposite case, the exsolution will act as a heatsink absorbing as lighter solid nucleates. As the system cools down the solvus, the relative quantities of the original and new solids will be determined by the lever rule, and the heat release (or absorption) will continue with a decreasing and appropriately varying . In spite of the fact that in Fig. 1c is similar for different models, the released or absorbed heat will be different due to dependence of at a given on ion sorts and on multicomponent plasma physics (i.e. on corrections to linear mixing).
Note, that in calculations of and , the temperature-independent linear-mixing energy corrections in the solid state obviously cancel out. Yet, there is a difference between solid and dashed curves in Figs. 1b and 1c. This difference is due to different locations of the respective phase transitions and miscibility gaps in Fig. 1a.

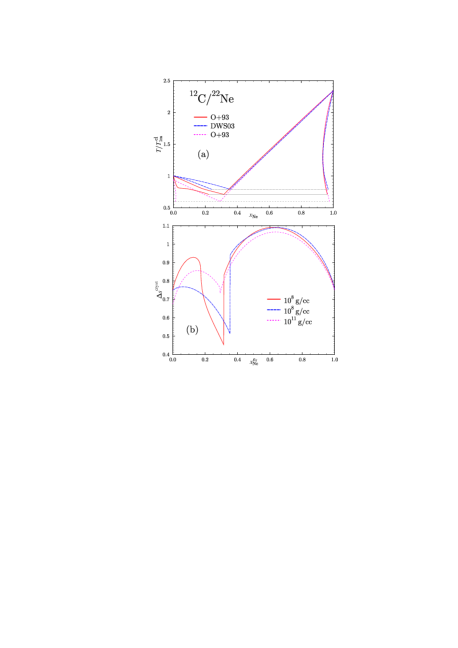
In Fig. 2, we turn to 12C/22Ne mixture, which is very similar to 12C/20Ne mixture studied in Paper I. The liquid-solid coexistence curve under various assumptions is shown in Fig. 2a. The low- region of this diagram is somewhat representative of the low- and low- corner of the ternary C/O/22Ne phase diagram, which is crucial for the distillation process proposed by (Blouin et al.2021). We see a eutectic type phase diagram with solid (red) and short-dashed (magenta) curves corresponding to the correction fit of Ogata et al. (1993) at the classic and quantum densities, respectively. Note, that, due to ion quantum effects, there is a qualitative change of the phase diagram structure at low and, in particular, of neon depletion of the solid. The dashed (blue) curve is obtained using the correction fit of DeWitt & Slattery (2003) at the same classic density, and it varies only weakly under the action of quantum effects (cf. Paper I).
In Fig. 2b, by curves of the same type, we plot the excess entropy accompanying crystallization in this system. For pure systems, the excess entropy approaches its OCP value (reduced to for quantum carbon). All curves have discontinuities at their eutectic points, which are very strong for classic ions [e.g. from to for the Ogata et al. (1993) fit]. Quantum effects reverse the jump sign and reduce its magnitude substantially for the Ogata et al. (1993) fit but not for the DeWitt & Slattery (2003) fit, for which quantum latent heat is qualitatively similar to the classic one. At 0.62–0.65, all curves reach maxima in the range of 1.07–1.09. Interestingly, the solid curve has another strong maximum of at a low .
2.1 Fit expressions
To facilitate practical application of these results, we propose several analytic fits. For crystallizing classic 12C/16O mixture, assuming the energy correction of Ogata et al. (1993), the phase diagram is described by functions and at the liquidus. Functions and , respectively, represent the same quantities for crystallizing classic 16O/20Ne mixture. For exsolving 12C/16O mixture, assuming the energy correction of Ogata et al. (1993), function describes the rising segment of the solvus, i.e. for . Function yields the respective phase separation with the range of validity of and limited by the condition . Using and , the whole solvus can be easily constructed. The respective functions for the 16O/20Ne mixture are and .
In the fitting formulae below, for brevity, the argument is denoted simply as :
| (1) |
The coefficients are summarized in table 1.
Once the phase boundaries are constructed, the excess entropies can be found as , where the energy and the free energy at the boundaries are given by the standard linear mixing formulae (e.g. Paper I). The accuracy of the fits (1) is sufficient to calculate relatively small entropies by subtracting from , both dominated by relatively large electrostatic terms, and then, to subtract from each other entropies of the liquid and solid or of the parent and new solids. Data generated using the fits are shown by symbols in Figs. 1a–c.
| -0.45 | 0.557326 | -0.287904 | 6.79381 | -0.773978 | 4.49124 | |
| 0.55 | 1.41757 | -0.640228 | 53.8103 | |||
| 0.359282 | -0.133598 | 0.164269 | -0.318343 | |||
| 0.8 | 0.747837 | -4.98464 | 70.7369 | |||
| 0.519262 | -2.94837 | 8.01079 | -7.18285 | 5.90273 | 4.02099 | |
| 1.80963 | 8.80669 | 107.8 | 155.816 | |||
| 0.300237 | -0.772378 | 3.05972 | -7.99819 | 4.81564 | -23.856 | |
| 1.52336 | 11.3999 | 84.2213 | 120.859 |
3 Discussion
Let us now discuss possible astrophysical implications of these findings. Since the work of Salaris et al. (2000), it has been typically assumed that the latent heat in crystallizing white dwarfs (WD) is equal to (e.g. Camisassa et al., 2019). According to Salaris et al. (2000), earlier works used value of the latent heat , and an introduction of the 23% smaller value resulted in a noticeable decrease of WD cooling age (by up to 0.4 Gyr). Depending on particular composition, a fraction of this effect may be reversed, if the larger values of the latent heat from Fig. 1b are used.
In a recent work of Jermyn et al. (2021), although specific value of the latent heat in an ionic mixture is not discussed explicitly (except a statement that it is similar to the standard OCP value), their Fig. 13 indicates that, depending on the numerical procedure, in the same object, the latent heat can be equal to or . It is stated, that the higher value is compensated, for cooling purposes, by a lower specific heat . It follows, that in the approach of Jermyn et al. (2021), a further cooling acceleration is predicted, compared with the standard latent heat case (). Per their Fig. 15, , for which the solid (red) line in our Fig. 1b predicts the latent heat of and thus, by contrast, a cooling delay.
Conclusive study of the miscibility gap effects requires a separate work. Here, we shall limit ourselves to simplified estimates. Taking as an example , we see (per solid lines in Fig. 1a) that the onset of crystallization corresponds to and . The miscibility gap temperature at in the parent solution is , and the respective (Fig. 1c).
From cooling models333 \urlhttps://www.astro.umontreal.ca/bergeron/CoolingModels of Bédard et al. (2020) (in what follows, we shall use thin hydrogen envelope models, thick hydrogen envelope models yield very similar results), one can estimate a change of the effective surface temperature, corresponding to a change of the internal temperature for WD of different masses. The exsolution onset occurs at the internal temperature times lower than the crystallization onset temperature. Accordingly, one can deduce that the effective temperature at the exsolution onset is , 1.5, and 1.75 times lower than the effective temperature, at which of WD mass is crystallized for 0.6 , 0.8 , and 1 WD, respectively. This translates into a reduction of brightness by , 1.8, and 2.45 stellar magnitudes, respectively. Comparing with Fig. 2 of Tremblay et al. (2019), also cf. Gaia Collaboration et al. (2018), we see that the exsolution begins in a reasonably well populated area of the WD H-R diagram.
A useful measure of the process energetics is its effect on the cooling age, which can be estimated as the ratio (denoted below) of the total process energy to the stellar luminosity (e.g. Isern et al., 1997). We shall compare these quantities for crystallization and exsolution under simplifying assumptions of constant temperature, constant fractions of constituents in the mixture, constant heat release/absorption per ion, 100% of ions crystallizing, and 100% of carbon exsolving. Utilizing the same models as above, we deduce that the star at crystallization onset is , 7.75, and 15.3 times brighter than at the exsolution onset for 0.6 , 0.8 , and 1 WD, respectively. Then, , , and . Therefore, if crystallization (with the latent heat value of ) delays cooling by 1 Gyr, the exsolution will accelerate it (at a later stage) by about 50, 100, or 200 Myr depending on the stellar mass.
Let us also consider an example of exsolution having the opposite effect. Suppose , so that , parent , , , and . The star at exsolution is , 6.2, and 8.9 times less luminous than at crystallization (for the same masses as above), and , 0.5, and 0.8 (assuming all oxygen exsolving). Thus, if due to the latent heat, crystallization delays cooling by 1 Gyr, the exsolution will add another 200, 500, or 800 Myr for 0.6 , 0.8 , or 1 WD, respectively.
In view of these estimates, we tend to conclude that the exsolution process should be taken into account quantitatively to improve interpretation of WD cooling data. Note also, that these thermal effects may be augmented by gravitational energy release associated with separation of lighter and heavier solids and lamellar structure formation in a stellar gravitational field (Paper I).
The phase diagram in Fig. 2a predicts that if is to the left of the eutectic point (the V-type feature at 0.3–0.35), the crystal that forms will be depleted of 22Ne and therefore will be buoyant in the surrounding neon-enriched fluid. This is the basis of the distillation model proposed by (Blouin et al.2021). Clearly, the depletion becomes stronger and buoyancy is enhanced, as the solid (red) curve transitions into the short-dashed (magenta) one444Since g cm-3 is too high a density for WD, a complete transition to the magenta curve does not happen. with increase of the mass density (and WD mass), i.e. with amplification of ion quantum effect. A possible caveat may be related to the latent heat release, which warms up the surrounding fluid and reduces crystal buoyancy in it. If real, it is expected to be more pronounced for classic ions, for which there is a strong maximum of the latent heat at low (solid line in Fig. 2b).
Acknowledgments
The author is grateful to the anonymous referee for useful suggestions. This work was supported by RSF grant 19-12-00133-P.
Data Availability
The data underlying this article will be shared on reasonable request to the author.
References
- Baiko & Yakovlev (2019) Baiko D. A., Yakovlev D. G., 2019, MNRAS, 490, 5839
- Baiko & Chugunov (2022) Baiko D. A., Chugunov A. I., 2022, MNRAS, 510, 2628
- Baiko (2022) Baiko D. A., 2022, MNRAS, 517, 3962 (Paper I)
- Bauer et al. (2020) Bauer E. B., Schwab J., Bildsten L., Cheng S., 2020, ApJ, 902, 93
- Bédard et al. (2020) Bédard A., Bergeron P., Brassard P., Fontaine G., 2020, ApJ, 901, 93
- Beznogov & Yakovlev (2013) Beznogov M. V., Yakovlev D. G., 2013, Phys. Rev. Lett., 111, 161101
- Blouin et al. (2020) Blouin S., Daligault J., Saumon D., Bédard A., Brassard P., 2020, A&A, 640, L11
- (8) Blouin S., Daligault J., Saumon D., 2021, ApJL, 911, L5
- Blouin & Daligault (2021) Blouin S., Daligault J., 2021, ApJ, 919, 87
- Camisassa et al. (2019) Camisassa M. E., Althaus L. G., Córsico A. H., De Gerónimo F. C., Miller Bertolami M. M., Novarino M. L., Rohrmann R. D., Wachlin F. C., García-Berro E., 2019, A&A, 625, A87
- (11) Caplan M. E., Horowitz C. J., Cumming A., 2020, ApJL, 902, L44
- (12) Caplan M. E., Bauer E. B., Freeman I. F., 2022, MNRAS, 513, L52
- (13) Cheng S., Cummings J. D., Ménard B., 2019, ApJ, 886, 100
- DeWitt & Slattery (2003) DeWitt H., Slattery W., 2003, Contrib. Plasma Phys., 43, 279
- (15) Fontaine G., Brassard P., Bergeron P., 2001, PASP, 113, 409
- Gaia Collaboration et al. (2018) Gaia Collaboration et al., 2018, A&A, 616, A10
- Hughto et al. (2010) Hughto J., Schneider A. S., Horowitz C. J., Berry D. K., 2010, Phys. Rev. E, 82, 066401
- Isern et al. (1997) Isern J., Mochkovitch R., García-Berro E., Hernanz M., 1997, ApJ, 485, 308
- Jermyn et al. (2021) Jermyn A. S., Schwab J., Bauer E., Timmes F. X., Potekhin A. Y., 2021, ApJ, 913, 72
- Ogata et al. (1993) Ogata S., Iyetomi H., Ichimaru S., Van Horn H. M., 1993, Phys. Rev. E, 48, 1344
- Salaris et al. (2000) Salaris M., García-Berro E., Hernanz M., Isern J., Saumon D., 2000, ApJ, 544, 1036
- (22) Saumon D., Blouin S., Tremblay P.-E., 2022, Phys. Rep., 988, 1
- Stanton & Murillo (2016) Stanton L. G., Murillo M. S., 2016, Phys. Rev. E, 93, 043203
- Tremblay et al. (2014) Tremblay P.-E., Kalirai J. S., Soderblom D. R., Cignoni M., Cummings J., 2014, ApJ, 791, 92
- Tremblay et al. (2019) Tremblay P.-E. et al., 2019, Nature, 565, 202