The GLASS-JWST Early Release Science Program. III. Strong lensing model of Abell 2744 and its infalling regions
Abstract
We present a new high-precision, JWST-based, strong lensing model for the galaxy cluster Abell 2744 at . By combining the deep, high-resolution JWST imaging from the GLASS-JWST and UNCOVER programs and a Director’s Discretionary Time program, with newly obtained VLT/MUSE data, we identify 32 multiple images from 11 background sources lensed by two external sub-clusters at distances of from the main cluster. The new MUSE observations enable the first spectroscopic confirmation of a multiple image system in the external clumps. Moreover, the re-analysis of the spectro-photometric archival and JWST data yields 27 additional multiple images in the main cluster. The new lens model is constrained by 149 multiple images ( more than in our previous Bergamini et al. 2023a model) covering an extended redshift range between 1.03 and 9.76. The subhalo mass component of the cluster includes 177 member galaxies down to , 163 of which are spectroscopically confirmed. Internal velocity dispersions are measured for 85 members. The new lens model is characterized by a remarkably low scatter between predicted and observed positions of the multiple images (). This precision is unprecedented given the large multiple image sample, the complexity of the cluster mass distribution, and the large modeled area. The improved accuracy and resolution of the cluster total mass distribution provides a robust magnification map over a arcmin2 area, which is critical for inferring the intrinsic physical properties of the highly magnified, high- sources. The lens model and the new MUSE redshift catalog are released with this publication.
1 Introduction
The first JWST observations of massive galaxy clusters have revealed exceptionally rich background patterns of strongly lensed galaxies, thanks to a revolutionary combination of angular resolution, depth and near-and mid-infrared coverage (e.g., Mahler et al., 2022; Pascale et al., 2022; Caminha et al., 2022). Several JWST survey programs have targeted cluster fields to exploit the gravitational lensing magnification, in the effort to unveil primordial star-forming systems and study their physical properties (e.g., Treu et al., 2022; Bezanson et al., 2022; Willott et al., 2022; Windhorst et al., 2023). While current studies are identifying an increasing number of strongly lensed sources at based on JWST/NIRCam photometry (Hsiao et al., 2022; Adams et al., 2023; Bradley et al., 2022), some have already obtained spectroscopic confirmations in the range (Roberts-Borsani et al., 2022a; Williams et al., 2022).
Compared to blank field surveys, observations of highly magnified regions of clusters have the advantage of extending to low luminosities and stellar masses our knowledge of the galaxy populations in the first billion years of cosmic history, providing unique insights on their inner structure down to parsec resolutions (e.g., Bouwens et al., 2021; Vanzella et al., 2022; Meštrić et al., 2022; Vanzella et al., 2023; Welch et al., 2023). This progress, however, comes with significant challenges. High-precision strong lensing models are needed to produce reliable magnification maps which are, in turn, critical to infer the intrinsic physical properties of the lensed sources (luminosities, stellar masses, star formation rates, sizes), as well as the effective survey volume at varying redshifts and therefore their space densities (Castellano et al., 2022). The accuracy and precision of lens models in predicting accurate magnification () values depend essentially on the number of bona-fide multiple images with spectroscopic redshifts, spanning a wide -range, and a complete knowledge of the member galaxies contributing to the cluster mass distribution. While independent models based on high-quality spectro-photometric data tend to be robust in the low-magnification regime (, see e.g., Meneghetti et al., 2017), such a requirement becomes progressively more important near the critical lines, at . In the most extreme cases, for sources found within a fraction of arcseconds of a critical line (e.g., Chen et al., 2022; Diego et al., 2022; Welch et al., 2022; Meena et al., 2023), including caustic crossing events (Kelly et al., 2018), magnification values can be of the order of hundreds or more, implying that the interpretation on the nature of the source relies heavily on the lens model accuracy.
JWST observations of galaxy clusters with exceptional lensing cross sections offer an unprecedented opportunity to zoom into primordial star-forming regions. On the one hand, they also provide a high number density of multiple image systems, a factor of 2-3 higher than HST based studies, which improves the accuracy of the lens models. On the other hand, spectroscopic redshifts of a significant fraction of these lensed sources, that were beyond the reach of previous technology, have now become attainable with JWST.
In this context, the massive galaxy cluster Abell 2744 (A2744 hereafer), at , has been the target of several observational campaigns with the Hubble Space Telescope (HST) obtaining deep, high-resolution and wide-field coverage (Lotz et al., 2017; Steinhardt et al., 2020). Its combination with extensive ground and space based spectroscopic follow-up observations (Braglia et al., 2009; Owers et al., 2011; Treu et al., 2015; Richard et al., 2021) has enabled a new generation of strong lensing models including a large number of secure multiple images (Wang et al., 2015; Richard et al., 2021; Bergamini et al., 2023a, B23 hereafter). In particular, the lens model presented by B23 prior to the JWST observations included 90 spectroscopically confirmed multiple images (from 30 background sources), achieving an accuracy in reproducing the observed positions of the multiple images a factor of better than previous lens models (see e.g., Wang et al., 2015; Mahler et al., 2018; Richard et al., 2021). These pre-JWST lens models found that several massive structures residing at large distances from the main cluster core had a non-negligible impact in the total mass reconstruction of the cluster inner regions. B23 found magnification to be significantly different from one well beyond the innermost 500 kpc from the cluster center, suggesting that these specific regions cannot effectively be considered as blank fields.
More recently, A2744 has been among the first targets of JWST (Treu et al., 2022; Bezanson et al., 2022). By exploiting the deep JWST/NIRCam observations gathered from both programs, Furtak et al. 2022a (F22 hereafter) have presented a lens model, identifying, for the first time, a large number of photometric multiple images around the external clumps. The F22 lens model (optimized on the source plane) is constrained by the observed positions of 138 multiple images (from 48 background sources) and it is characterized by an r.m.s residual scatter on the lens plane of in the multiple image positions, compared to for the model by B23.
In this work, we exploit the new JWST/NIRCam imaging and Multi Unit Spectroscopic Explorer (MUSE) spectroscopic observations, together with archival spectro-photometric data including recent JWST/NIRISS and JWST/NIRSpec redshifts, to build an improved lens model of A2744, that includes the largest sample of multiple images used to date. In addition, the new identification of several multiple image systems in the cluster core and around the external clumps enables a more accurate and precise reconstruction of the total mass distribution of the cluster. The lens model presented in this work plays a fundamental role in studying the intrinsic properties of the lensed high-redshift sources from current and future JWST observations of A2744.
The paper is organized as follows. Section 2 describes the archival imaging and spectroscopic data sets, as well as the new JWST and MUSE observations, that are used to develop the lens model of A2744. In Section 3, we detail the selection of the multiple images and cluster members, and the adopted methodology for the extended strong lensing modeling of the cluster. Our results are discussed in Section 4 and our main conclusions are summarized in Section 5.
Throughout this work, we adopt a flat Lambda cold dark matter (CDM) cosmology with and . Using this cosmology, a projected distance of corresponds to a physical scale of 4.528 kpc at the A2744 redshift of . All magnitudes are given in the AB system.
2 Data
This section presents the datasets used to build the extended strong lensing model of A2744, focusing in particular on the new spectro-photometric data compared to those exploited by B23. In Section 2.1, we describe the archival HST and Magellan imaging as well as the new JWST NIRCam imaging of this cluster field. Section 2.2 summarizes the spectroscopic coverage of the cluster field and the new MUSE DDT observations.
2.1 Imaging data
We use deep, ancillary Magellan g, r, i imaging of A2744 obtained with MegaCam on the Magellan 2 Clay Telescope on 2018 September 7-8 (see Treu et al., 2022, for an overview). The Magellan -band imaging was used to anchor the NIRCam images to the Gaia-DR3 astrometric solution (see Paris et al., 2023). All the coordinates in our new lens model are therefore also aligned to this World Coordinate System (WCS)111This corresponds to a difference of .. The uniform Magellan multi-band photometry over the entire field can also be used to check the color consistency of a few cluster members lying outside the HST coverage.
In addition, A2744 is one of the cluster fields with the deepest high-resolution observations obtained with HST thanks to the Hubble Frontier Fields program222https://archive.stsci.edu/prepds/frontier/ (HFF, Proposal ID: 13495, Lotz et al., 2017) and other ancillary data from previous HST observational campaigns. The BUFFALO survey (Beyond Ultra-deep Frontier Fields And Legacy Observations, Steinhardt et al., 2020) has since provided an extended but shallower coverage of the cluster field. In this work, we make use of the HFF and BUFFALO HST mosaics that are described by B23.
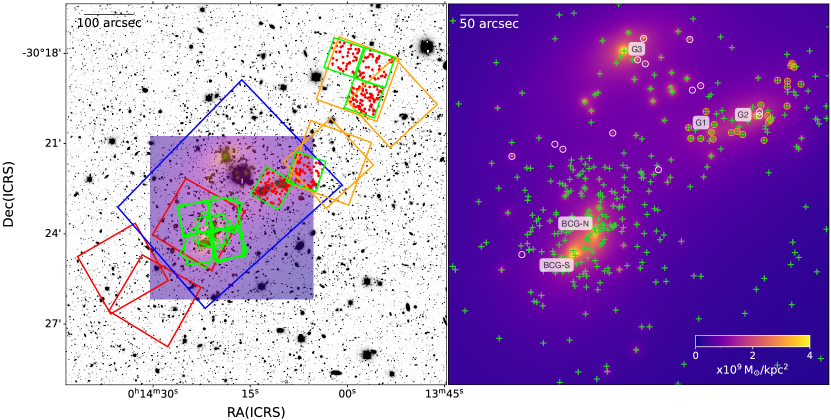
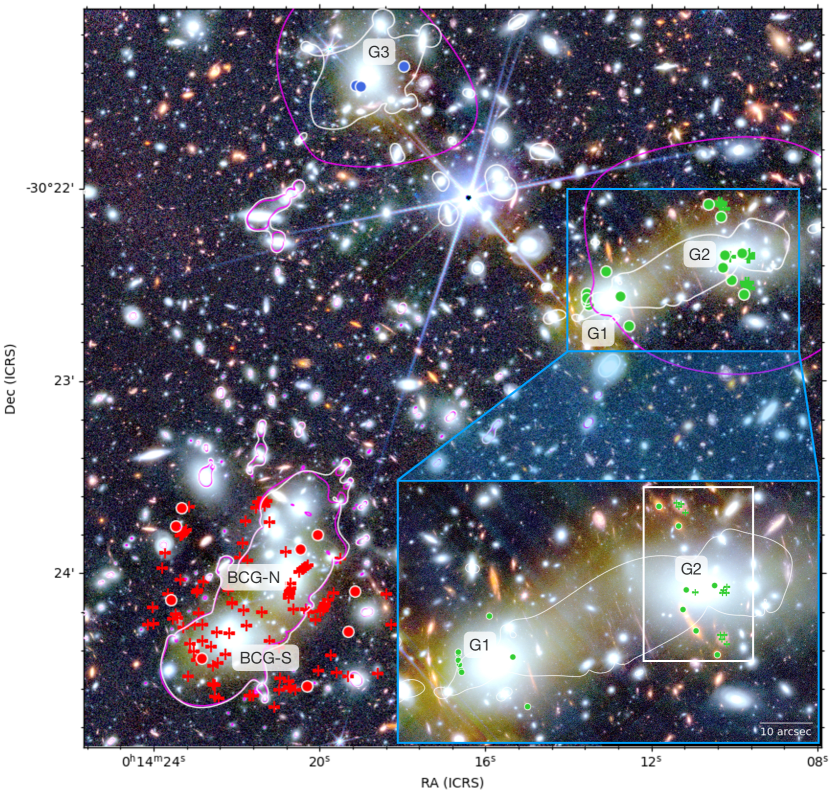
Finally, we exploit the new JWST NIRCam imaging of A2744 obtained within the GLASS-JWST program ERS-1324 (P.I.: Treu, Treu et al., 2022), the UNCOVER (Ultradeep NIRSpec and NIRCam ObserVations before the Epoch of Reionization) Cycle 1 Treasury program (GO-2561, co-P.I.s: Labbé and Bezanson, Bezanson et al., 2022), and the DDT program 2756 (P.I.: Chen). The footprints from these three observational programs are shown in Figure 1 in orange, blue, and red, respectively. The fields of view, the filters, and the data reduction are detailed in Merlin et al. (2022) and Paris et al. (2023). Briefly, the resulting JWST/NIRCam coverage of the cluster from the three programs includes observations with eight different filters (F090W, F115W, F150W, F200W, F277W, F356W, F410M, F444W), over an area of with a pixel scale. The final magnitude limit of the images ranges from AB to AB, depending on the location and filters. The reduced NIRCam images and the associated multi-wavelength catalogs are made publicly available333https://glass.astro.ucla.edu/ers/external_data.html,444https://archive.stsci.edu/doi/resolve/resolve.html?doi=10.17909/kw3c-n857. The photometric redshifts are computed by means of the Spectral Energy Distribution (SED) fitting code zphot.exe (Fontana et al., 2000). Using the same method and assumptions as in Merlin et al. (2021) and Santini et al. (2023), we have built the stellar library by adopting the Bruzual & Charlot (2003) models and including nebular emission lines according to Castellano et al. (2014) and Schaerer & de Barros (2009).
2.2 Spectroscopic data
The A2744 cluster field counts with an extensive spectroscopic coverage obtained with several ground and space-based facilities, see B23 for a detailed overview. Briefly, A2744 was observed with the wide-field VIsible Multi-Object Spectrograph (VIMOS) as part of the ESO Large Program 169.A-0595 (P.I.: Böhringer, Braglia et al., 2009), the AAOmega multi-object spectrograph on the 3.9m Anglo-Australian Telescope (Owers et al., 2011), and the HST WFC3/IR grism through the HST GO program GLASS555archive.stsci.edu/prepds/glass/ (Treu et al., 2015; Schmidt et al., 2014). The central region of the galaxy cluster (green footprints in Figure 1) was then targeted with the MUSE integral field spectrograph, mounted on the Very Large Telescope (VLT, Bacon et al., 2012), within the GTO Program 094.A-0115 (P.I.: Richard). The data consists of five MUSE pointings, each with total exposure times raging from 2 to 5 hours (Mahler et al., 2018; Richard et al., 2021, B23), allowing for the spectroscopic confirmation of a large number of multiple image systems and cluster members.
Besides these archival data, additional VLT/MUSE spectroscopy within the GLASS-JWST NIRCam fields was recently acquired through the ESO DDT program 109.24EZ.001 (co-P.I.s: Mason, Vanzella) on the nights of July 28 and August 20 2022 (see also Prieto-Lyon et al., 2022, for further details). The new data comprise 5 pointings of each with a total exposure time of 1 hour per pointing (see the green footprints in Figure 1). Four of the MUSE pointings overlap with the NIRCam fields from the GLASS-JWST ERS program while the fifth targets a prominent cluster sub-structure at a distance between from the core of A2744 (B23). The extended HST imaging from the BUFFALO program revealed several strong lensing features around two bright cluster members, subsequently confirmed by the new JWST imaging (F22).
The MUSE data cubes have been reduced and analyzed following Caminha et al. (2017a, b, 2019), using the standard reduction pipeline (version 2.8.5, Weilbacher et al., 2020). The “autocalibration” method and the Zurich Atmosphere Purge (ZAP, Soto et al., 2016) are then applied to improve the overall data reduction. The five pointings have a mean full width at half maximum (FWHM) value of , and the pointing covering the cluster sub-structure has a value of FWHM.
The one-dimensional spectra of all the HST detected objects are extracted within a radius circular aperture, whereas custom apertures are considered for faint sources, based on their estimated morphology from the HST imaging (see Section 2.1). For sources with no HST detection (i.e., HST-dark objects) we visually inspect the continuum subtracted data-cubes to identify emission lines. We exploit spectral templates, as well as the identification of emission lines, to construct the new redshift catalogs. The reliability of each redshift measurement is then quantified with the following quality flag (QF) assignments (see also Balestra et al., 2016; Caminha et al., 2019): “tentative” (QF = 1), “likely” (QF = 2), “secure” (QF = 3), and “based on a single emission line” (QF = 9).
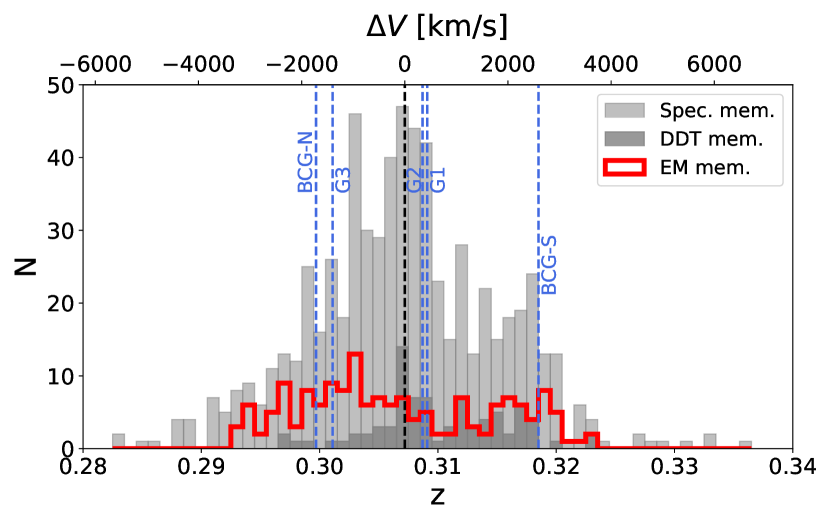
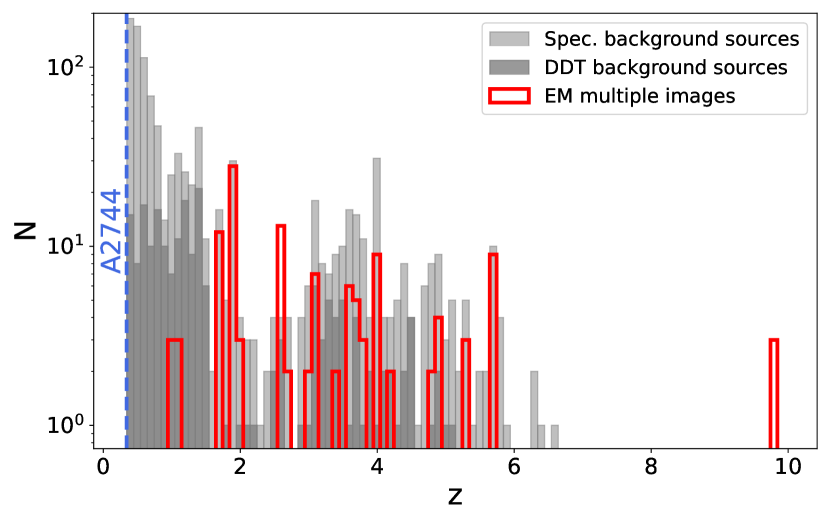
The full spectroscopic sample from the MUSE DDT program contains 313 reliable (i.e., QF 2) redshift measurements, of which 12 are stars, 12 are foreground galaxies (), 82 are cluster members () and 207 are background objects (). The redshift distributions of the spectroscopic cluster members and background galaxies from the MUSE DDT observations are shown in Figures 2 and 3, respectively. We note that 42 UV-faint galaxies have been published by Prieto-Lyon et al. (2022). The full catalog is presented in Table LABEL:tab:ddtcatalog.
3 Extended strong lensing model
In this section we describe the new strong lensing model of A2744 making use of the new imaging and spectroscopic datasets presented in Section 2. In particular, thanks to the deep JWST imaging and the MUSE DDT follow-up observations, we are able to expand the samples of multiple images and spectroscopic cluster members compared to the model presented by B23. We use the publicly available strong lensing modeling pipeline LensTool666https://projets.lam.fr/projects/lenstool/wiki (Kneib et al., 1996; Jullo & Kneib, 2009) that reconstructs the total mass distribution of a galaxy cluster implementing a Bayesian technique. We note that the lens model adopts the new JWST astrometric grid, tied to Gaia DR3 (see Section 2.1).
3.1 Parameterization of the cluster total mass
Thanks to the identification of a large number of multiple images in the external clumps (see Section 3.2), we are able to improve the characterization of the total mass distribution of A2744 compared to our previous, HST-based strong lensing model by B23. The total mass parameterization of the cluster core is the same as the one adopted by B23. We thus refer the reader to that publication for a detailed description and provide hereafter a brief summary. Within the parametric LensTool software (Jullo et al., 2007), the total mass of the lens is separated into several components, where the following mass contributions are considered in this analysis:
| (1) |
The cluster and subhalo mass components (, and ) are parameterized using dual pseudo-isothermal elliptical mass distributions (dPIEs, Limousin et al., 2005; Elíasdóttir et al., 2007; Bergamini et al., 2019). The dPIE profile is defined by seven free parameters: the position (, ); the ellipticity (defined as , where and are the values of the major and minor semiaxes, respectively); the position angle , computed counterclockwise from the west direction; the central velocity dispersion 777LensTool adopts a scaled version of this quantity, identified as , such that ; the core radius ; and the truncation radius .
The large-scale dark matter component, , consists of two non-truncated elliptical dPIEs, which are initially centered on the two Brightest Cluster Galaxies (BCGs; labeled BCG-N and BCG-S) but are free to move within a small range around their positions (corresponding to square regions of sizes of about and for the BCG-N and BCG-S, respectively; see Table 1). As pointed out by B23, the observed positions of several multiple image systems with small angular separation from the BCG-N and BCG-S are better reproduced when the parameters describing their mass contribution – and ellipticity – are optimized outside the scaling relations adopted for the other cluster members, as discussed below. BCGs are known to be uncommon galaxies and their independent modeling highlights the importance of the two BCGs for an accurate lensing analysis.
Of the 177 cluster member galaxies (see Section 3.3), 172 are modeled using circular dPIEs with a vanishing core radius and scaled with total mass-to-light ratios increasing with their HST F160W luminosities, i.e., a relation that is compatible with the so-called tilt of the Fundamental Plane (e.g., Faber et al., 1987; Bender et al., 1992), as done by B23 (see their Eq. 4). The two free parameters in the lens model are then the values of the velocity dispersion and truncation radius of a reference galaxy, corresponding to the BCG-N. We report in Table 1 the values of the relevant parameters of the scaling relations. B23 further exploited the MUSE datacube to measure the line-of-sight stellar velocity dispersion for 85 member galaxies, down to , allowing for an independent calibration of the slopes of the velocity dispersion and truncation radius scaling relations (see B23 for details).
As previously mentioned, the main difference with respect to the strong lensing analysis presented by B23 is the modeling of the cluster infalling regions, . Due to the lack of secure multiple image systems around the massive structures in the northwestern region of the cluster prior to the JWST/NIRCam imaging, the B23 reference LM-model included a simple description of the mass contribution from three external clumps, associated with the three brightest galaxies (G1, G2, and G3), as singular isothermal sphere (SIS) profiles. The identification of 29 (3) multiple images around the galaxies G1-G2 (G3) allows now for a more accurate total mass reconstruction of these infalling structures, , which is decomposed into the following mass contributions:
| (2) |
The first two terms correspond to the cluster component that is modeled as two cluster-scale non-truncated elliptical dPIEs: one associated with the galaxies G1 and G2 and allowed to move within a large square region containing the two galaxies (see Table 1, corresponding to a region of about ), and a second one centered on the position of the galaxy G3. The parameters describing the mass contribution (i.e., the velocity dispersion and cut radius) of the three galaxies G1, G2 and G3 are individually optimized, within large flat priors. In addition, the ellipticity parameters of G1 and G2 are left free to vary (see Table 1). As mentioned in Section 3.3, the parametric description of the cluster outskirsts is further enhanced by the inclusion of a sample of spectroscopic cluster members from the new MUSE/DDT observations (see Figure 1 and Section 3.3).
Finally, the redshifts of the 8 photometric multiple image systems are also optimized in the lens model within uninformative flat priors. We note that the redshift value of all the images of Sys-200 (i.e., A200.1a,b, B200.2a,b, and C200.3a,b) is imposed to be equal in the optimization of the lens model (and therefore corresponding to a single free parameter).
The priors assumed for the values of the parameters of the mass profiles included in our reference lens model are reported in the upper part of Table 1, while the optimized values are provided in the bottom panel. The best-fitting values of the model parameters that describe the total mass distribution of the lens are obtained by minimizing on the image plane the distance between the observed and the model-predicted point-like positions of the multiple images through a function (see Eq. 1 in B23). Following B23, we assign an initial positional uncertainty to each image depending on the value of the Positional Quality Flag (QP), that are given in Table LABEL:tab:multiple_images. These values are then rescaled, prior to the sampling of the posterior distributions, in order to obtain a value close to the number of degrees of freedom (dof) in the model, defined as: , where and refer, respectively, to the total number of multiple images and families included in the lens model. and are the number of model constraints and free parameters, respectively. The total mass model of A2744 has free parameters, including the 8 optimized redshifts of the non-spectroscopic systems, leading to 148 dof. This model represents an extension of that presented by B23, and thus is labeled as such in the following (Extended Model or EM).
| Input parameter values and assumed priors | ||||||||
| Cluster-scale halos | Cluster Halo | |||||||
| Cluster Halo | ||||||||
| G1,G2 Halo | ||||||||
| G3 Halo | ||||||||
| Subhalos | BCG-N | |||||||
| BCG-S | ||||||||
| G1 | ||||||||
| G2 | ||||||||
| G3 | ||||||||
| Scaling relations | ||||||||
| Optimized output parameters | ||||||||
| Cluster-scale halos | Cluster Halo | |||||||
| Cluster Halo | ||||||||
| G1,G2 Halo | ||||||||
| G3 Halo | ||||||||
| Subhalos | BCG-N | |||||||
| BCG-S | ||||||||
| G1 | ||||||||
| G2 | ||||||||
| G3 | ||||||||
| Scaling relations | ||||||||
3.2 Multiple image catalog
This work extends the multiple image catalog presented by B23, which was based on the deep HST imaging and MUSE observations of the cluster core. The B23 sample consisted of 90 multiple images from 30 background sources, spanning a redshift range between and . For further details, we refer the reader to Table A.1 of B23. By exploiting the ancillary and the recently obtained JWST/NIRCam imaging and new VLT/MUSE data, we identify additional multiple images both in the cluster core and in the external clumps.
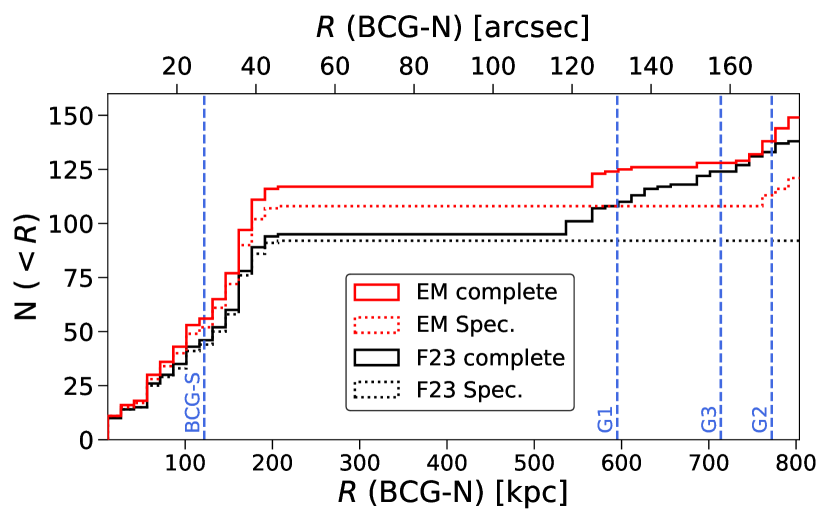
Our new strong lensing model includes 149 multiple images from 50 background sources, of which 121 are spectroscopically confirmed and span an extended redshift range between and (see Figure 3). This represents an increase of compared to the B23 sample. The cumulative distribution of the distances of both the spectroscopic and photometric multiple images included in the lens model from the BCG-N is shown in Figure 4 (red solid line), and compared to the one used by F22 (black solid line). The complete sample presented in this work includes 11 more multiple images than that from F22, and thus represents the largest set of constraints included in a lens model of A2744 to date. The set of spectroscopic images is especially noteworthy. In more general terms, A2744 is the second cluster with the largest sample of secure multiple images after the lens cluster MACS J0416.12403, that currently counts 237 (Bergamini et al., 2023b). For consistency, we present in Table LABEL:tab:multiple_images the properties (in the JWST-based astrometry) of the complete sample of multiple images used as constraints in this work, included those presented by B23. The multiple image positions are shown in Figure 5, where the crosses (circles) denote the spectroscopic (photometric) images. We briefly describe below the identification of the new multiple images with respect to those from B23.
- Cluster core: Following B23, we re-analyze the MUSE datacube, extracting the spectra of sources predicted by the lens model and measuring the redshift of several multiple images using faint emission lines and the cross-correlation with different templates. We thus include 14 additional spectroscopically confirmed multiple images in the cluster core, from 5 systems. These new images are flagged by a star symbol in Table LABEL:tab:multiple_images.
Recent JWST observations have allowed for the spectroscopic confirmation of two additional multiple images in the cluster core as part of the GLASS-JWST ERS program (identified by an asterisk in Table LABEL:tab:multiple_images). While image 3c is too faint for a secure redshift measurement with VLT/MUSE, JWST/NIRISS spectroscopy enables the detection of [OII]3727,3729 at the expected wavelength position of 1.856 , and consistent with the counterimages 3a and 3b (Vanzella et al., 2022; Lin et al., 2023). The triply lensed candidate system reported by Zitrin et al. (2014) was observed with NIRSpec prism spectroscopy (DDT 2756; P.I.: Chen) resulting in a spectroscopic redshift measurement of of the image JD1B (Roberts-Borsani et al., 2022b). The other two images, JD1A and JD1C, which are not yet spectroscopically confirmed, are considered at the same redshift as JD1B, consistent with their photometric redshifts.
The list of multiple images is further enhanced in the cluster core by including 3 photometric strongly lensed sources, with a total of 9 multiple images, securely identified in the JWST/NIRISS and JWST/NIRCam imaging from the GLASS-JWST-ERS program. In particular, Sys-53 consists of a triply imaged active galactic nucleus (AGN) candidate analyzed in Furtak et al. (2022b). The very peculiar color and compactness of the source make the association of the three multiple images of the system particularly secure.
The final sample in the main cluster core includes 117 multiple images from 39 background sources, of which 108 are spectroscopically confirmed.
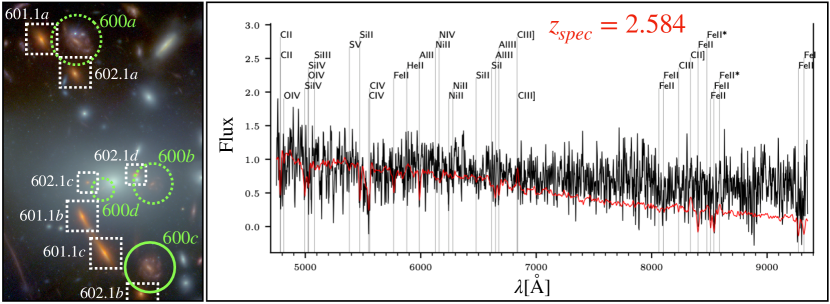
- External clumps: The main improvement with respect to B23 is the identification of a large number of multiple images around the galaxies G1 and G2 in the northwestern external clump. While the ancillary shallow HST imaging of the cluster outskirts hinted at the presence of strong lensing features, the recent deep, high-resolution JWST/NIRCam data clinched the identification of several photometric systems. We identify 29 multiple images from 10 background sources around the galaxies G1 and G2, and 3 multiple images from a single background source around the galaxy G3. We also include multiply lensed clumps within resolved extended sources which have shown to be particularly efficient at constraining the position of the critical curves (e.g. Grillo et al., 2016, B23). In particular, thanks to the MUSE DDT observations we are able to measure the redshift of the lensed face-on spiral galaxy (ID 600) around G2. Due to the light contamination by a star and by G2 of the images 600a and 600b, respectively, a secure spectroscopic confirmation is not currently possible for those images. The MUSE spectrum of image 600c, extracted within a circular aperture of diameter, is shown in Figure 6, yielding a redshift measurement of . This secure redshift is based on the cross-correlation of the MUSE spectrum with several spectral templates of star-forming galaxies with appropriate rest frame UV coverage, which consistently shows a significant peak at the quoted redshift with a variation of . This is, to date, the only multiple image system spectroscopically confirmed in the northwestern external clump.
The observed image positions of the 149 multiple images are used as constraints in the new lens model, providing in total constraints.
3.3 Selection of cluster galaxies
For the selection of the cluster galaxies used in the lens model to describe the subhalo mass component, we follow the procedure of B23 taking advantage of the enhanced spectroscopic coverage in the northwestern clump. Initially, cluster members are selected as the galaxies with a spectroscopic redshift in the range , corresponding approximately to an interval of km/s rest-frame velocities around the median cluster redshift , and magnitudes brighter than (a dedicated work on the properties of cluster members is presented by Vulcani et al. 2023). The larger range in redshift is motivated by the complexity of the total mass distribution of A2744, a multi-component merger (see e.g., Merten et al., 2011; Owers et al., 2011). This is clearly shown in Figure 2, where the velocity difference between the BCG-N and BCG-S is of about 4000 km/s. The new MUSE DDT data add 82 members to the full spectroscopic sample (see Section 2.2) which now includes 669 cluster galaxies, mostly based on the MUSE observations (Richard et al., 2021, B23). When compiling this catalog, we only consider secure or probable/likely redshift measurements from different sources (see Section 2.2). The redshift distribution of the cluster members over the cluster area is shown in Figure 2, while their spatial distribution is shown in the right panel of Figure 1. The spectroscopic sample is then completed down to by adding the photometric members identified with the convolution neural network (CNN) technique described by Angora et al. (2020). Performance tests generally show a cluster member identification rate (completeness) of with a purity of , superior to those from traditional color selection methods (Angora et al., 2020).
The large number of cluster galaxies makes the extended lens model presented here computationally very expensive, owing to the calculation of the deflection angle induced by each individual cluster member. With the aim of limiting the computational time increase, we reduce the number of faint cluster galaxies in the lens model and study how the positional rms value, , varies when considering different magnitude threshold values for the cluster members in the F160W band. We find no significant variation in when only including in the model the galaxies with magnitudes and thus, we limit the number of cluster galaxies to those brighter than . A similar finding is presented by Raney et al. (2021), which shows that considering different magnitude limits for the selection of member galaxies in the lens models of two HFF clusters, between 21 and 26 in the F814W band, results in little variations in the values of or other metrics (see their Figure 4).
With the new magnitude cut, , 163 spectroscopic members are included in the lens model (see the red histogram in Figure 2), in addition to 14 non-spectroscopic galaxies, over an area of arcmin2. The new spectroscopic cluster members are concentrated in the NW mass clumps, around G1, G2, and G3 (see Figure 1). As a comparison, the B23 strong lensing model included 225 members with a limit 3 magnitudes fainter.
4 Results
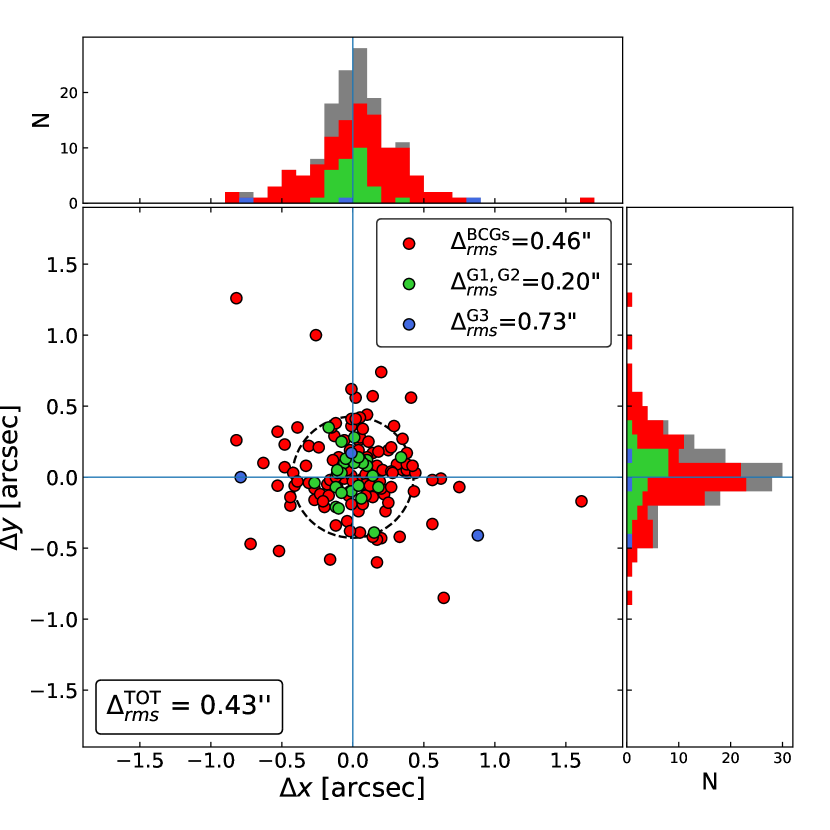
The best-fit Extended Model is characterized by a precision of in reproducing the observed positions of the 149 multiple images used as constraints in the lens model (see Section 3.1). In Figure 7, we show for each multiple image the displacement between its observed and model predicted positions. To quantify the precision of the lens model around the three main massive structures within the considered area (see Figure 1), we adopt different colors to distinguish the multiple images forming around the main cluster BCGs (red), the two bright galaxies G1 and G2 (green), and the cluster galaxy G3 (blue). We note that the same color scheme is adopted in Figure 5 to indicate the observed positions of the multiple images. The positions of the 117 multiple images forming around the main cluster BCGs are reproduced with a precision of . This is a remarkable result considering that this value is just larger than that obtained using the previous model by B23, which included 27 fewer multiple images in the same region. An even higher precision of is found in reproducing the observed positions of the 29 multiple images forming around G1 and G2. In contrast, the precision decreases to around galaxy G3. Here, only three non-spectroscopic images (700.a, 700.b, and 700.c) of a single background galaxy are included in the lens model. We notice that the deflecting contribution of the massive clump surrounding G3 is mainly driven by its influence on the many multiple images observed relatively far from its center, i.e. in the cluster core. For this reason, the optimized values of the parameters of this clump might not be able to reproduce as well as for the other sources the three multiple images appearing close to its center.
A further confirmation of our previous results comes from the cumulative projected total mass profiles, presented in Figure 8. These profiles and the associated statistical errors are computed considering 500 realizations obtained by randomly extracting parameter samples from the MCMC chains. The black and red solid lines correspond to the median mass profiles, while the colored shaded bands are limited by the 16th and 84th percentiles. Thanks to the large number of spectroscopically confirmed multiple images observed around the main cluster core, the total mass distribution of the cluster is reconstructed robustly in this region (top-left panel of the figure). This results in a cumulative projected total mass profile measured with very small statistical errors (black band in the figure). By comparing the results from this with those by B23, we find a remarkably good agreement. In particular, the cumulative projected total mass profiles of the two models differ by less than 3% close to the BCG-N core and less than 1% at distances between 20 kpc and 310 kpc. Unsurprisingly, larger differences are found in the regions surrounding the three external clumps. On the top-right and bottom-left panels of Figure 8, we plot the cumulative projected total mass profiles as a function of the distance from the G1 and G2 galaxies, respectively. These profiles demonstrate that the inclusion in the of the multiple images identified with JWST/NIRCam imaging around G1 and G2 reduces significantly the statistical uncertainty in the total mass estimates. This is evidenced by the smaller extension of the black bands with respect to the red ones. While the total mass profile around G1 is compatible with the previous result by B23, a clear difference between the total mass profiles is found in the vicinity of G2. The newly identified multiple images around G1 and G2 – especially the 13 lensed substructures of the spectroscopically confirmed spiral galaxy at (see Figure 6) – are thus key to precisely reconstructing the total mass distribution in this region. Similarly, we remark a large discrepancy between the total mass profiles obtained from the and the B23 model, as displayed in the bottom-right panel of Figure 8. In this case, the three non-spectroscopic multiple images, from a single background source, lying close to the galaxy G3 can only poorly constrain the total mass distribution of the G3 halo. This is reflected into the black error band which is more extended than those in the other panels. We remark that the new subhalo scaling relation is consistent over more than 5 magnitudes with that measured by B23 with MUSE spectroscopy, within the statistical uncertainties (see Table 1 and their Figure 4). This highlights the importance of an independent determination of the scaling relation in reducing inherent model degeneracies between the cluster- and subhalo mass components.
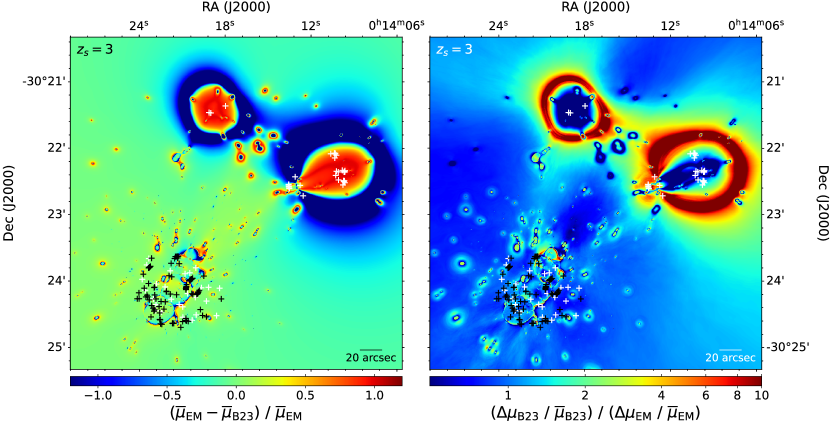
On the left panel of Figure 9, we show the relative difference between the median magnification values derived from the () and B23 model (). The median magnification maps are obtained by considering 500 random realizations of the lens models and computing the median magnification value in each pixel. The right panel of Figure 9 shows instead the ratio of the relative errors on the predicted magnification values for the two models. In this case, the absolute errors and are computed from the 16th and 84th percentiles of the magnification distributions in each pixel.
In the region surrounding the main cluster, the and B23 models predict very similar magnification values and associated errors (see the bottom-left region in the maps). This result is corroborated by the similarity of the B23 (magenta) and (white) critical lines displayed in Figure 5 for a source at . Within the main cluster, non-negligible differences between the predicted magnification are observed only at distances beyond North-West from the BCG-N, a region deprived of observed multiple images. The main cluster critical line predicted by the best-fit becomes resonant with the secondary critical lines produced by two bright galaxies. The consistency between the B23 and the models in the main cluster region demonstrates that the modeling parameterization from B23 is well suited to robustly characterize its total mass distribution. As expected, closer to the external clumps surrounding galaxies G1, G2, and G3 (in the top and top-right regions of Figure 9) the differences between the and B23 models are significant. In particular, the magnification maps reach relative differences of more than in addition to the significant discrepancy on the shape of the critical lines. In fact, the critical lines obtained by the new are significantly more centrally concentrated with respect to the large critical lines produced by the simplistic SIS mass distributions used by B23 to parameterize the external clumps, illustrating the importance of adding strong lensing constraints in those regions. The right panel of Figure 9 demonstrates that the model is characterized by similar relative errors to B23 in the main cluster region in predicting the magnification values, whereas significantly smaller relative errors are found around the external clumps compared to B23. Particular attention has to be paid to the red ring-like and dark blue areas centered on the external clumps. These regions wrap the critical lines of the B23 model and computed for a source at (corresponding to the redshift of the magnification maps). We note that the magnification values presented by Castellano et al. (2022) for the galaxies, based on B23, all in the low regime (), are well in agreement with the values computed with the new lens model.
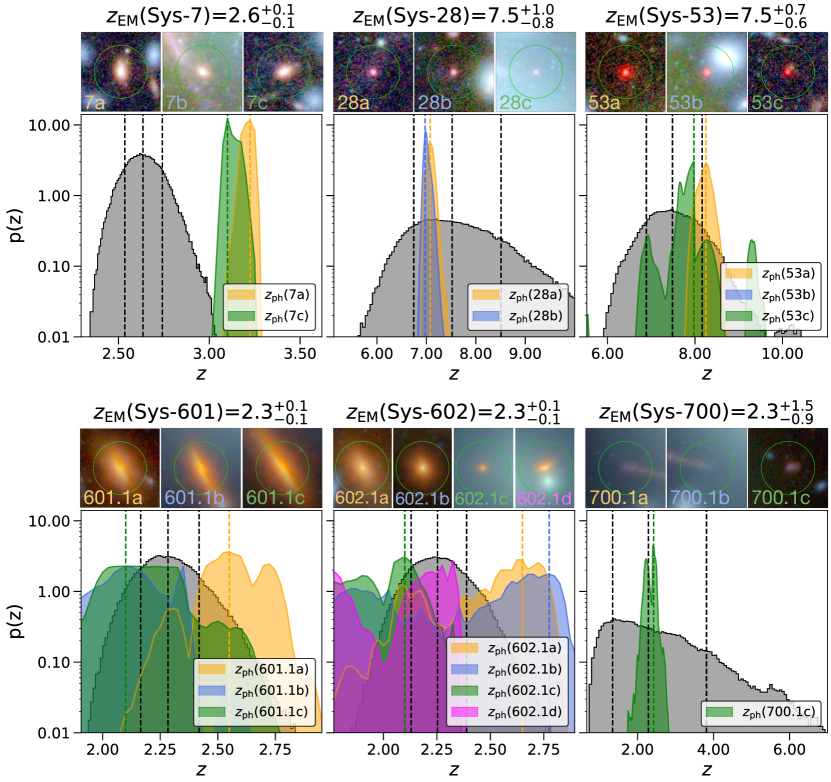
An additional way to demonstrate the robustness of the lens model is to compare the model-predicted redshift values of the non-spectroscopic systems with the photometric redshift estimates for their multiple images. In Figure 10, we show a comparison between the probability density distributions of the redshift values obtained from the lens model (gray histogram) and the photometric redshift estimated by exploiting the JWST and HST multi-band data (see Section 2.1) as the colored histograms, for the six non-spectroscopic multiple image systems included in the lens model. The remaining two non-spectroscopic systems (i.e., Sys-301 and Sys-200) used in the model do not have reliable photometric redshift measurements for any of their images, due to their faintness and to light contamination from nearby objects and, for that reason, are not included in the figure. The photometric Sys-7, Sys-28, and Sys-53 are located in the main cluster field (around the cluster BCGs) and have three multiple images each, corresponding to the nine red circles in Figure 5. From the JWST and HST multi-band observations, we obtain consistent photometric redshift estimates for two out of the three multiple images of Sys-7 and Sys-28 (i.e., 7a, 7c, 28a, and 28b). While for Sys-28 the photometric redshifts are in very good agreement with the predicted redshift, we find that the model-predicted redshift of Sys-7 is slightly underestimated compared to the photometric estimates. Regarding Sys-53, the photometric redshift probability distribution for image 53b peaks at , that is well below the photometric redshift values inferred for the other two multiple images, 53a and 53c (yellow and green histograms in the plot, respectively) and the model-predicted redshift. The likely reason for this discrepancy is the light contamination produced by a cluster galaxy (with ) residing at a projected distance of just from the image 53b. Moreover, Furtak et al. (2022b) have measured a photometric redshift of , in very good agreement with our model-predicted redshift and with the photometric redshifts of the images 53a and 53c from this work. Sys-601 and Sys-602 both reside around the bright galaxy G2 and count three and four multiple images, respectively (these correspond to the seven green circles around the galaxy G2 in Figure 5, see also the dashed white squares in Figure 6). The multi-band photometric data allow for the estimate of the photometric redshifts for all the multiple images of the systems. These are found to be compatible among each other and with the lens model-predicted redshift probability density distributions. We note that we obtain identical redshift values for the two systems. Considering that the Sys-601 and Sys-602 sources are just apart (corresponding to 17.5 kpc at ), we can argue that these are likely two galaxies belonging to the same gravitationally bound system. We also note that the positions of the images of the Sys-601 and Sys-602 are extremely well reproduced by the with values of and . Finally, Sys-700 consists of three multiple images forming around the galaxy G3 (blue circles in Figure 5). Also in this case, the lens model-predicted redshift is in very good agreement with the photometric redshift estimated for the single image 700.1c.
5 Conclusions
We have presented a new high-precision strong lensing model of the galaxy cluster Abell 2744 () based on the deep, wide-field JWST/NIRCam imaging (Treu et al., 2022; Bezanson et al., 2022; Paris et al., 2023) and new MUSE DDT observations, together with extensive archival spectro-photometric datasets including two recent spectroscopic redshifts with JWST/NIRISS and JWST/NIRSpec (Vanzella et al., 2022; Lin et al., 2023; Roberts-Borsani et al., 2022b). The model is constrained by 149 multiple images (121 of which are spectroscopically confirmed) from 50 background sources, spanning a very wide redshift range between and . The multiple image catalog compiled for this cluster is the largest to date (see Figure 4), and represents an increase of about with respect to our previous, HST-based lens model (B23). Specifically, we have included 27 additional multiple images in the main cluster core (18 of which are spectroscopically confirmed) thanks to a re-analysis of faint multiple images in the archival MUSE and the JWST/NIRISS data. In addition, the deep, high-resolution JWST/NIRCam observations have proved to be key in the identification of a large number of multiple image systems around the external clumps, in particular those associated with the bright galaxies G1 and G2 (see also F22), where we have considered 29 multiple images from 10 background sources. By analyzing the new data from the MUSE DDT program, we have presented the first spectroscopic redshift of a multiple image system in the G1-G2 external clump, a face-on spiral galaxy at .
The model includes 177 cluster member galaxies, 163 of which are spectroscopically confirmed (24 of them are newly confirmed with the new MUSE data), and 14 are securely identified as cluster members with a CNN deep-learning technique (Angora et al., 2020). The new subhalo scaling relation is consistent, within the statistical uncertainties, with the measured one shown by B23, demonstrating the accurate total mass modeling of the lens cluster.
The total root-mean-square separation between the observed and model-predicted positions of the 149 multiple images is on the image plane (see Figure 7). The achieved precision is similar to that obtained by B23 (), despite the significantly larger number of multiple images considered in this work. We note that the precision of our model is significantly better than that of the JWST-based lens model presented by F22, who quote a on the lens plane. The newly included multiple image systems around the external clumps represent a leap forward in the lens modeling of Abell 2744 in terms of precision and accuracy. While the cumulative projected total mass profiles and the magnification maps obtained from our new model are highly consistent with those obtained by B23 in the main cluster core, these quantities are robustly reconstructed at larger radii with significantly smaller statistical uncertainties (see Figures 8 and 9) thanks to the newly included constraints. The robustness of the lens model is further demonstrated by the consistency between the model-predicted and photometric redshift estimates of 6 non-spectroscopic multiple image systems included in the model (see Figure 10).
Our new lens model holds a fundamental role in the study of the lensed high-redshift sources that are being observed by the JWST in this cluster field (e.g., Castellano et al., 2022; Prieto-Lyon et al., 2022; Morishita et al., 2022), in particular in the high-magnification regime (e.g., Roberts-Borsani et al., 2022b; Vanzella et al., 2022). Further improvements will be possible when additional multiple image systems will be spectroscopically confirmed with on-going JWST spectroscopic observations.
The lens model presented in this work will be made publicly available with the publication of this paper through our recently developed Strong Lensing Online Tool, SLOT (B23), allowing researchers to take full advantage of the predictive and statistical results of our lens model through a user-friendly graphical interface. The complete catalog of secure redshift measurements (i.e., QF 2) from the new VLT/MUSE DDT observations (see Section 2.2) will also be released upon publication.
Appendix A Catalog of multiple images in Abell 2744
We present here the complete catalog of multiple images included in the new lens model in the JWST WCS (see Section 2.1). For consistency, we also list the multiple images presented in the B23 HST-based lens model (marked with a dagger symbol, ) that were anchored to the HFF WCS. The multiple images identified with a star symbol, , indicate those newly spectrocopically confirmed with the central MUSE datacube, while those with an asterisk, , have been spectroscopically confirmed with JWST/NIRISS (Vanzella et al., 2022; Lin et al., 2023) and JWST/NIRSpec (Roberts-Borsani et al., 2022b). Further details can be found in B23 and in Section 3.2.
| ID | R.A. | Dec. | QP | z | QF | Location |
| [deg.] | [deg.] | |||||
| 1.1a | 1 | 1.688 | 3 | BGCs | ||
| 1.1b | 1 | 1.688 | 2 | BGCs | ||
| 1.1c | 1 | 1.688 | 3 | BGCs | ||
| 1.2a | 1 | 1.688 | 2 | BGCs | ||
| 1.2b | 1 | 1.688 | 3 | BGCs | ||
| 1.2c | 1 | 1.688 | 3 | BGCs | ||
| 1.3a | 2 | 1.688 | 3 | BGCs | ||
| 1.3b | 2 | 1.688 | 3 | BGCs | ||
| 1.3c | 2 | 1.688 | 3 | BGCs | ||
| 1.4a | 1 | 1.688 | 1 | BGCs | ||
| 1.4b | 1 | 1.688 | 1 | BGCs | ||
| 1.4c | 1 | 1.688 | 1 | BGCs | ||
| 2.1a | 1 | 1.887 | 3 | BGCs | ||
| 2.1b | 1 | 1.887 | 3 | BGCs | ||
| 2.1c | 1 | 1.887 | 3 | BGCs | ||
| 2.1d | 1 | 1.887 | 3 | BGCs | ||
| 2.2a | 1 | 1.887 | 3 | BGCs | ||
| 2.2b | 1 | 1.887 | 3 | BGCs | ||
| 2.2c | 1 | 1.887 | 3 | BGCs | ||
| 2.2d | 1 | 1.887 | 3 | BGCs | ||
| 2.3a | 1 | 1.887 | 3 | BGCs | ||
| 2.3b | 1 | 1.887 | 3 | BGCs | ||
| 2.3c | 1 | 1.887 | 3 | BGCs | ||
| 2.3d | 1 | 1.887 | 3 | BGCs | ||
| 2.4a | 1 | 1.887 | 3 | BGCs | ||
| 2.4b | 1 | 1.887 | 3 | BGCs | ||
| 2.4c | 1 | 1.887 | 3 | BGCs | ||
| 2.4d | 1 | 1.887 | 3 | BGCs | ||
| 2.5a | 2 | 1.887 | 3 | BGCs | ||
| 2.5b | 2 | 1.887 | 3 | BGCs | ||
| 2.5c | 2 | 1.887 | 3 | BGCs | ||
| 2.5d | 1 | 1.887 | 3 | BGCs | ||
| 2.6a | 2 | 1.887 | 3 | BGCs | ||
| 2.6b | 2 | 1.887 | 3 | BGCs | ||
| 2.6c | 2 | 1.887 | 3 | BGCs | ||
| 2.6d | 2 | 1.887 | 3 | BGCs | ||
| 2.7a | 2 | 1.887 | 3 | BGCs | ||
| 2.7b | 2 | 1.887 | 3 | BGCs | ||
| 2.7c | 2 | 1.887 | 3 | BGCs | ||
| 2.7d | 2 | 1.887 | 3 | BGCs | ||
| 3.1a | 1 | 3.98 | 3 | BGCs | ||
| 3.1b | 1 | 3.98 | 3 | BGCs | ||
| 3.1c | 3 | 3.98 | 1 | BGCs | ||
| 3.2a | 1 | 3.98 | 3 | BGCs | ||
| 3.2b | 1 | 3.98 | 3 | BGCs | ||
| 3.3a | 1 | 3.98 | 3 | BGCs | ||
| 3.3b | 1 | 3.98 | 3 | BGCs | ||
| 4.1a | 1 | 3.577 | 3 | BGCs | ||
| 4.1b | 1 | 3.577 | 3 | BGCs | ||
| 4.1c | 2 | 3.577 | 3 | BGCs | ||
| 4.1e | 3 | 3.577 | 3 | BGCs | ||
| 4.2a | 1 | 3.577 | 3 | BGCs | ||
| 4.2b | 1 | 3.577 | 3 | BGCs | ||
| 6.1a | 1 | 2.017 | 3 | BGCs | ||
| 6.1b | 1 | 2.017 | 3 | BGCs | ||
| 6.1c | 1 | 2.017 | 3 | BGCs | ||
| 8.1a | 2 | 3.977 | 2 | BGCs | ||
| 8.1b | 2 | 3.977 | 2 | BGCs | ||
| 10a | 1 | 2.657 | 2 | BGCs | ||
| 10b | 1 | 2.657 | 3 | BGCs | ||
| 18.1a | 1 | 5.662 | 3 | BGCs | ||
| 18.1b | 1 | 5.662 | 3 | BGCs | ||
| 18.1c | 1 | 5.662 | 3 | BGCs | ||
| 22.1a | 2 | 5.284 | 3 | BGCs | ||
| 22.1b | 2 | 5.284 | 3 | BGCs | ||
| 22.1c | 2 | 5.284 | 3 | BGCs | ||
| 24a | 1 | 1.044 | 3 | BGCs | ||
| 24b | 1 | 1.044 | 9 | BGCs | ||
| 24c | 1 | 1.044 | 1 | BGCs | ||
| 26.1a | 1 | 3.054 | 3 | BGCs | ||
| 26.1b | 1 | 3.054 | 3 | BGCs | ||
| 26.1c | 2 | 3.054 | 9 | BGCs | ||
| 26.2a | 1 | 3.054 | 3 | BGCs | ||
| 26.2b | 1 | 3.054 | 3 | BGCs | ||
| 26.3a | 3 | 3.054 | 2 | BGCs | ||
| 26.3b | 3 | 3.054 | 2 | BGCs | ||
| 30a | 1 | 1.026 | 2 | BGCs | ||
| 30b | 1 | 1.026 | 9 | BGCs | ||
| 30c | 1 | 1.026 | 1 | BGCs | ||
| 31a | 1 | 4.757 | 3 | BGCs | ||
| 31b | 1 | 4.757 | 3 | BGCs | ||
| 33.1a | 1 | 5.726 | 3 | BGCs | ||
| 33.1b | 1 | 5.726 | 3 | BGCs | ||
| 34.1a | 1 | 3.784 | 2 | BGCs | ||
| 34.1b | 1 | 3.784 | 3 | BGCs | ||
| 34.1c | 1 | 3.784 | 2 | BGCs | ||
| 41a | 1 | 4.91 | 9 | BGCs | ||
| 41b | 1 | 4.91 | 9 | BGCs | ||
| 41c | 1 | 4.91 | 9 | BGCs | ||
| 41d | 3 | 4.91 | 2 | BGCs | ||
| 42.1a | 1 | 3.692 | 3 | BGCs | ||
| 42.1b | 1 | 3.692 | 3 | BGCs | ||
| 42.1c | 1 | 3.692 | 3 | BGCs | ||
| 42.1d | 1 | 3.692 | 3 | BGCs | ||
| 42.1e | 3 | 3.692 | 1 | BGCs | ||
| 61.1a | 1 | 2.951 | 1 | BGCs | ||
| 61.1b | 1 | 2.951 | 3 | BGCs | ||
| 62.1a | 3 | 4.194 | 3 | BGCs | ||
| 62.1b | 3 | 4.194 | 3 | BGCs | ||
| 63.1a | 1 | 5.662 | 3 | BGCs | ||
| 63.1b | 2 | 5.662 | 3 | BGCs | ||
| 63.1c | 2 | 5.662 | 3 | BGCs | ||
| 63.1d | 2 | 5.662 | 3 | BGCs | ||
| 64.1a | 2 | 3.409 | 3 | BGCs | ||
| 64.1c | 2 | 3.409 | 3 | BGCs | ||
| JD1A | 1 | 9.756 | 2 | BGCs | ||
| JD1B | 1 | 9.756 | 2 | BGCs | ||
| JD1C | 1 | 9.756 | 2 | BGCs | ||
| 600.1a | 1 | 2.58 | 2 | G1-G2 | ||
| 600.1b | 1 | 2.58 | 2 | G1-G2 | ||
| 600.1c | 1 | 2.58 | 2 | G1-G2 | ||
| 600.1d | 1 | 2.58 | 2 | G1-G2 | ||
| 600.3a | 1 | 2.58 | 2 | G1-G2 | ||
| 600.3b | 1 | 2.58 | 2 | G1-G2 | ||
| 600.3c | 1 | 2.58 | 2 | G1-G2 | ||
| 600.4a | 1 | 2.58 | 2 | G1-G2 | ||
| 600.4b | 1 | 2.58 | 2 | G1-G2 | ||
| 600.4c | 1 | 2.58 | 2 | G1-G2 | ||
| 600.5a | 1 | 2.58 | 2 | G1-G2 | ||
| 600.5b | 1 | 2.58 | 2 | G1-G2 | ||
| 600.5c | 1 | 2.58 | 2 | G1-G2 | ||
| 7a | 1 | - | - | BGCs | ||
| 7b | 1 | - | - | BGCs | ||
| 7c | 1 | - | - | BGCs | ||
| 28a | 1 | - | - | BGCs | ||
| 28b | 1 | - | - | BGCs | ||
| 28c | 1 | - | - | BGCs | ||
| 53a | 1 | - | - | BGCs | ||
| 53b | 1 | - | - | BGCs | ||
| 53c | 1 | - | - | BGCs | ||
| A200.1a | 1 | - | - | G1-G2 | ||
| A200.1b | 1 | - | - | G1-G2 | ||
| B200.2a | 1 | - | - | G1-G2 | ||
| B200.2b | 1 | - | - | G1-G2 | ||
| C200.3a | 1 | - | - | G1-G2 | ||
| C200.3b | 1 | - | - | G1-G2 | ||
| 301.1a | 1 | - | - | G1-G2 | ||
| 301.1b | 1 | - | - | G1-G2 | ||
| 301.1c | 1 | - | - | G1-G2 | ||
| 601.1a | 1 | - | - | G1-G2 | ||
| 601.1b | 1 | - | - | G1-G2 | ||
| 601.1c | 1 | - | - | G1-G2 | ||
| 602.1a | 1 | - | - | G1-G2 | ||
| 602.1b | 1 | - | - | G1-G2 | ||
| 602.1c | 1 | - | - | G1-G2 | ||
| 602.1d | 1 | - | - | G1-G2 | ||
| 700.1a | 1 | - | - | G3 | ||
| 700.1b | 1 | - | - | G3 | ||
| 700.1c | 1 | - | - | G3 |
Appendix B Redshift catalog
In this section, we present an extract of the catalog of all the sources for which we measure a secure redshift value (QF 2) from the new MUSE data obtained during the ESO DDT program 109.24EZ.001 (see Section 2.2 and Figure 1). The full catalog will be released upon publication.
| ID | R.A. | Dec. | z | QF |
| [deg.] | [deg.] | |||
| 70000123 | 0.000 | 3 | ||
| 70004495 | 0.000 | 3 | ||
| 70005368 | 0.000 | 3 | ||
| 70001070 | 0.000 | 3 | ||
| 70006188 | 0.000 | 3 | ||
| … | … | … | … | … |
References
- Adams et al. (2023) Adams, N. J., Conselice, C. J., Ferreira, L., et al. 2023, MNRAS, 518, 4755, doi: 10.1093/mnras/stac3347
- Angora et al. (2020) Angora, G., Rosati, P., Brescia, M., et al. 2020, A&A, 643, A177, doi: 10.1051/0004-6361/202039083
- Bacon et al. (2012) Bacon, R., Accardo, M., Adjali, L., et al. 2012, The Messenger, 147, 4
- Balestra et al. (2016) Balestra, I., Mercurio, A., Sartoris, B., et al. 2016, ApJS, 224, 33, doi: 10.3847/0067-0049/224/2/33
- Bender et al. (1992) Bender, R., Burstein, D., & Faber, S. M. 1992, ApJ, 399, 462, doi: 10.1086/171940
- Bergamini et al. (2019) Bergamini, P., Rosati, P., Mercurio, A., et al. 2019, A&A, 631, A130, doi: 10.1051/0004-6361/201935974
- Bergamini et al. (2023a) Bergamini, P., Acebron, A., Grillo, C., et al. 2023a, A&A, 670, A60, doi: 10.1051/0004-6361/202244575
- Bergamini et al. (2023b) Bergamini, P., Grillo, C., Rosati, P., et al. 2023b, arXiv e-prints, arXiv:2208.14020, doi: 10.48550/arXiv.2208.14020
- Bezanson et al. (2022) Bezanson, R., Labbe, I., Whitaker, K. E., et al. 2022, arXiv e-prints, arXiv:2212.04026, doi: 10.48550/arXiv.2212.04026
- Bouwens et al. (2021) Bouwens, R. J., Illingworth, G. D., van Dokkum, P. G., et al. 2021, AJ, 162, 255, doi: 10.3847/1538-3881/abfda6
- Bradley et al. (2022) Bradley, L. D., Coe, D., Brammer, G., et al. 2022, arXiv e-prints, arXiv:2210.01777, doi: 10.48550/arXiv.2210.01777
- Braglia et al. (2009) Braglia, F. G., Pierini, D., Biviano, A., & Boehringer, H. 2009, VizieR Online Data Catalog, J/A+A/500/947
- Bruzual & Charlot (2003) Bruzual, G., & Charlot, S. 2003, MNRAS, 344, 1000, doi: 10.1046/j.1365-8711.2003.06897.x
- Caminha et al. (2022) Caminha, G. B., Suyu, S. H., Mercurio, A., et al. 2022, A&A, 666, L9, doi: 10.1051/0004-6361/202244517
- Caminha et al. (2017a) Caminha, G. B., Grillo, C., Rosati, P., et al. 2017a, A&A, 600, A90, doi: 10.1051/0004-6361/201629297
- Caminha et al. (2017b) —. 2017b, A&A, 607, A93, doi: 10.1051/0004-6361/201731498
- Caminha et al. (2019) Caminha, G. B., Rosati, P., Grillo, C., et al. 2019, A&A, 632, A36, doi: 10.1051/0004-6361/201935454
- Castellano et al. (2014) Castellano, M., Sommariva, V., Fontana, A., et al. 2014, A&A, 566, A19, doi: 10.1051/0004-6361/201322704
- Castellano et al. (2022) Castellano, M., Fontana, A., Treu, T., et al. 2022, ApJ, 938, L15, doi: 10.3847/2041-8213/ac94d0
- Chen et al. (2022) Chen, W., Kelly, P. L., Treu, T., et al. 2022, ApJ, 940, L54, doi: 10.3847/2041-8213/ac9585
- Diego et al. (2022) Diego, J. M., Pascale, M., Kavanagh, B. J., et al. 2022, A&A, 665, A134, doi: 10.1051/0004-6361/202243605
- Elíasdóttir et al. (2007) Elíasdóttir, Á., Limousin, M., Richard, J., et al. 2007, ArXiv e-prints. https://arxiv.org/abs/0710.5636
- Faber et al. (1987) Faber, S. M., Dressler, A., Davies, R. L., et al. 1987, in Nearly Normal Galaxies. From the Planck Time to the Present, ed. S. M. Faber, 175
- Fontana et al. (2000) Fontana, A., D’Odorico, S., Poli, F., et al. 2000, AJ, 120, 2206, doi: 10.1086/316803
- Furtak et al. (2022a) Furtak, L. J., Zitrin, A., Weaver, J. R., et al. 2022a, arXiv e-prints, arXiv:2212.04381, doi: 10.48550/arXiv.2212.04381
- Furtak et al. (2022b) Furtak, L. J., Zitrin, A., Plat, A., et al. 2022b, arXiv e-prints, arXiv:2212.10531, doi: 10.48550/arXiv.2212.10531
- Grillo et al. (2016) Grillo, C., Karman, W., Suyu, S. H., et al. 2016, ApJ, 822, 78, doi: 10.3847/0004-637X/822/2/78
- Hsiao et al. (2022) Hsiao, T. Y.-Y., Coe, D., Abdurro’uf, et al. 2022, arXiv e-prints, arXiv:2210.14123, doi: 10.48550/arXiv.2210.14123
- Jullo & Kneib (2009) Jullo, E., & Kneib, J.-P. 2009, MNRAS, 395, 1319, doi: 10.1111/j.1365-2966.2009.14654.x
- Jullo et al. (2007) Jullo, E., Kneib, J.-P., Limousin, M., et al. 2007, New Journal of Physics, 9, 447, doi: 10.1088/1367-2630/9/12/447
- Kelly et al. (2018) Kelly, P. L., Diego, J. M., Rodney, S., et al. 2018, Nature Astronomy, 2, 334, doi: 10.1038/s41550-018-0430-3
- Kneib et al. (1996) Kneib, J.-P., Ellis, R. S., Smail, I., Couch, W. J., & Sharples, R. M. 1996, ApJ, 471, 643, doi: 10.1086/177995
- Limousin et al. (2005) Limousin, M., Kneib, J.-P., & Natarajan, P. 2005, MNRAS, 356, 309, doi: 10.1111/j.1365-2966.2004.08449.x
- Lin et al. (2023) Lin, X., Cai, Z., Zou, S., et al. 2023, ApJ, 944, L59, doi: 10.3847/2041-8213/aca1c4
- Lotz et al. (2017) Lotz, J. M., Koekemoer, A., Coe, D., et al. 2017, ApJ, 837, 97, doi: 10.3847/1538-4357/837/1/97
- Mahler et al. (2018) Mahler, G., Richard, J., Clément, B., et al. 2018, MNRAS, 473, 663, doi: 10.1093/mnras/stx1971
- Mahler et al. (2022) Mahler, G., Jauzac, M., Richard, J., et al. 2022, arXiv e-prints, arXiv:2207.07101, doi: 10.48550/arXiv.2207.07101
- Meena et al. (2023) Meena, A. K., Zitrin, A., Jiménez-Teja, Y., et al. 2023, ApJ, 944, L6, doi: 10.3847/2041-8213/acb645
- Meneghetti et al. (2017) Meneghetti, M., Natarajan, P., Coe, D., et al. 2017, MNRAS, 472, 3177, doi: 10.1093/mnras/stx2064
- Merlin et al. (2021) Merlin, E., Castellano, M., Santini, P., et al. 2021, A&A, 649, A22, doi: 10.1051/0004-6361/202140310
- Merlin et al. (2022) Merlin, E., Bonchi, A., Paris, D., et al. 2022, ApJ, 938, L14, doi: 10.3847/2041-8213/ac8f93
- Merten et al. (2011) Merten, J., Coe, D., Dupke, R., et al. 2011, MNRAS, 417, 333, doi: 10.1111/j.1365-2966.2011.19266.x
- Meštrić et al. (2022) Meštrić, U., Vanzella, E., Zanella, A., et al. 2022, MNRAS, 516, 3532, doi: 10.1093/mnras/stac230910.48550/arXiv.2202.09377
- Morishita et al. (2022) Morishita, T., Roberts-Borsani, G., Treu, T., et al. 2022, arXiv e-prints, arXiv:2211.09097, doi: 10.48550/arXiv.2211.09097
- Owers et al. (2011) Owers, M. S., Randall, S. W., Nulsen, P. E. J., et al. 2011, ApJ, 728, 27, doi: 10.1088/0004-637X/728/1/27
- Paris et al. (2023) Paris, D., Merlin, E., Fontana, A., et al. 2023, arXiv e-prints, arXiv:2301.02179, doi: 10.48550/arXiv.2301.02179
- Pascale et al. (2022) Pascale, M., Frye, B. L., Diego, J., et al. 2022, ApJ, 938, L6, doi: 10.3847/2041-8213/ac9316
- Prieto-Lyon et al. (2022) Prieto-Lyon, G., Strait, V., Mason, C. A., et al. 2022, arXiv e-prints, arXiv:2211.12548, doi: 10.48550/arXiv.2211.12548
- Raney et al. (2021) Raney, C. A., Keeton, C. R., & Zimmerman, D. T. 2021, MNRAS, 508, 5587, doi: 10.1093/mnras/stab2857
- Richard et al. (2021) Richard, J., Claeyssens, A., Lagattuta, D., et al. 2021, A&A, 646, A83, doi: 10.1051/0004-6361/202039462
- Roberts-Borsani et al. (2022a) Roberts-Borsani, G., Morishita, T., Treu, T., et al. 2022a, ApJ, 938, L13, doi: 10.3847/2041-8213/ac8e6e
- Roberts-Borsani et al. (2022b) Roberts-Borsani, G., Treu, T., Chen, W., et al. 2022b, arXiv e-prints, arXiv:2210.15639, doi: 10.48550/arXiv.2210.15639
- Santini et al. (2023) Santini, P., Fontana, A., Castellano, M., et al. 2023, ApJ, 942, L27, doi: 10.3847/2041-8213/ac9586
- Schaerer & de Barros (2009) Schaerer, D., & de Barros, S. 2009, A&A, 502, 423, doi: 10.1051/0004-6361/200911781
- Schmidt et al. (2014) Schmidt, K. B., Treu, T., Brammer, G. B., et al. 2014, ApJ, 782, L36, doi: 10.1088/2041-8205/782/2/L36
- Soto et al. (2016) Soto, K. T., Lilly, S. J., Bacon, R., Richard, J., & Conseil, S. 2016, MNRAS, 458, 3210, doi: 10.1093/mnras/stw474
- Steinhardt et al. (2020) Steinhardt, C. L., Jauzac, M., Acebron, A., et al. 2020, ApJS, 247, 64, doi: 10.3847/1538-4365/ab75ed
- Talia et al. (2012) Talia, M., Mignoli, M., Cimatti, A., et al. 2012, A&A, 539, A61, doi: 10.1051/0004-6361/201117683
- Treu et al. (2015) Treu, T., Schmidt, K. B., Brammer, G. B., et al. 2015, ApJ, 812, 114, doi: 10.1088/0004-637X/812/2/114
- Treu et al. (2022) Treu, T., Roberts-Borsani, G., Bradac, M., et al. 2022, The Astrophysical Journal, 935, 110, doi: 10.3847/1538-4357/ac8158
- Vanzella et al. (2022) Vanzella, E., Castellano, M., Bergamini, P., et al. 2022, A&A, 659, A2, doi: 10.1051/0004-6361/202141590
- Vanzella et al. (2023) Vanzella, E., Claeyssens, A., Welch, B., et al. 2023, ApJ, 945, 53, doi: 10.3847/1538-4357/acb59a
- Vulcani et al. (2023) Vulcani, B., Treu, T., Calabro, A., et al. 2023, arXiv e-prints, arXiv:2303.01115, doi: 10.48550/arXiv.2303.01115
- Wang et al. (2015) Wang, X., Hoag, A. T., Huang, K.-H., et al. 2015, ApJ, 811, 29, doi: 10.1088/0004-637x/811/1/29
- Weilbacher et al. (2020) Weilbacher, P. M., Palsa, R., Streicher, O., et al. 2020, A&A, 641, A28, doi: 10.1051/0004-6361/202037855
- Welch et al. (2022) Welch, B., Coe, D., Zackrisson, E., et al. 2022, ApJ, 940, L1, doi: 10.3847/2041-8213/ac9d39
- Welch et al. (2023) Welch, B., Coe, D., Zitrin, A., et al. 2023, ApJ, 943, 2, doi: 10.3847/1538-4357/aca8a8
- Williams et al. (2022) Williams, H., Kelly, P. L., Chen, W., et al. 2022, arXiv e-prints, arXiv:2210.15699, doi: 10.48550/arXiv.2210.15699
- Willott et al. (2022) Willott, C. J., Doyon, R., Albert, L., et al. 2022, PASP, 134, 025002, doi: 10.1088/1538-3873/ac5158
- Windhorst et al. (2023) Windhorst, R. A., Cohen, S. H., Jansen, R. A., et al. 2023, AJ, 165, 13, doi: 10.3847/1538-3881/aca163
- Zitrin et al. (2014) Zitrin, A., Zheng, W., Broadhurst, T., et al. 2014, ApJ, 793, L12, doi: 10.1088/2041-8205/793/1/L12