Why is EXAFS analysis for multicomponent metals so hard? Challenges and opportunities for measuring ordering in complex concentrated alloys using x-ray absorption spectroscopy.
Abstract
Short range order is a critical driver of properties (e.g. corrosion resistance and tensile strength) in multicomponent alloys such as complex concentrated alloys (CCAs). Extended x-ray absorption fine structure (EXAFS) is a powerful technique well suited for quantifying this short range order.Here, we described in detail the characteristics of CCAs that make the already challenging task of analyzing EXAFS data even more difficult. We then illustrate novel paths towards robust and scalable quantitative SRO analysis which will accelerate the scientific understanding and development of CCAs.
I Introduction
Complex concentrated alloys (CCAs), including multi principal element alloys (MPEAs) and high entropy alloys (HEAs), have attracted significant interest in recent years for their large design space and unique properties[1, 2]. Many of these desirable properties observed in CCAs have been attributed to local variations in atomic order, which is commonly called short-range order (SRO, technically, SRO includes topological disorder, but here we refer more specifically to chemical short range order). SRO has been found to be critical for tailoring many functional properties, including oxidation resistance [3], mechanical properties [4, 5, 6], aqueous corrosion resistance [7, 8], catalytic efficiency [9], magnetic properties [4], and thermodynamic properties [10]. For example, local ordering of the first coordination shell can delay the passivation process during corrosion by reducing the nominal concentration of passivating species required to reach the percolation threshold [3]. Magnetic properties are similarly affected by SRO: Feng et al. [4] report a reduction in the atomic magnetic moments of magnetic elements in \ceFeCoNi(AlSi)_x when Ni-Al, Co-Si, Fe-Co, Ni-Si, and Fe-Si bonding is increased and Al-Al, Al-Si, and Si-Si pairs are decreased.
SRO is generally characterized using a set of Warren-Cowley (WC) parameters, , that normalize the number of neighboring atom pairs to the bulk composition in a pairwise fraction[11]. Specifically
| (1) |
where the conditional probability is the average fractional occupancy of atoms in the rth nearest neighbor (NN) shell around atoms and is the fractional concentration of in the alloy. Negative WC values indicate a greater number of pairs than expected in a random solid solution, while positive values indicate fewer pairs than random.
There are multiple methods for experimentally measuring SRO, reviewed in Ref. 12. Diffraction based approaches to measuring WC parameters – by single crystal x-ray, neutron, or TEM diffraction or by x-ray or neutron powder diffraction (including total scattering methods such as pair distribution function (PDF) – are possible. For complex systems, analysis and extraction of SRO parameters is generally accomplished through reverse Monte Carlo (RMC) modeling [13, 14, 15] followed by analysis of the simulated volume. More direct analysis is possible for binary solutions, but this becomes intractable for higher order solutions [16]. Atom probe tomography can also directly generate the 3D spatial distribution of atoms needed for SRO analysis [5]. One of the strengths of RMC is the joint modeling of EXAFS and PDF observation [14, 15], which can be particularly useful for constraining the model based on long range information not accessible to EXAFS. In practice, RMC analysis for EXAFS may be sensitive to initial estimates of non-structural parameters, and systems with complex multiphase structure may require non-trivial post-analysis to summarize the SRO.
Extended x-ray absorption fine structure (EXAFS) and its TEM counterpart extended energy loss fine structure (EXELFS, described in § III.1.1)[17] are spectroscopic techniques that use the scattering of a photoelectron to infer local chemical information in the Å about an absorbing atom. EXAFS analysis, as described in §II.1, extracts the pairs of NN occupancies that, along with sample composition, can be used to directly calculate WC parameters. EXAFS has several advantages over other techniques. First, the probed volume is very large (mm2 area with m scale depth sensitivity) compared to TEM and atom probe, providing ensemble averaged values. Second, the way EXAFS is measured inherently speciates the absorbing atom, producing signals that are sensitive to a set partial pair-distribution functions rather than a single PDF generated by x-ray total scattering. This is particularly advantageous for minority species which are common and play key roles in CCAs. Third, EXAFS analysis directly parameterizes the values needed for calculating the WC parameters, particularly in cases where multiple phases or partial long range order need to be explicitly modeled. Finally, the sample preparation requirements for EXAFS are relatively modest and non-invasive, requiring thinning to microns instead of nanometers, enabling this technique to be readily scalable for a large number of samples or conditions, with minimal risk for artifacts induced by sample preparation. These minimal requirements also make EXAFS ideal for in situ experiments, such as heating.
While EXAFS analysis is a powerful tool for characterization of SRO, quantitative analysis is notoriously difficult [18, 19, 20].
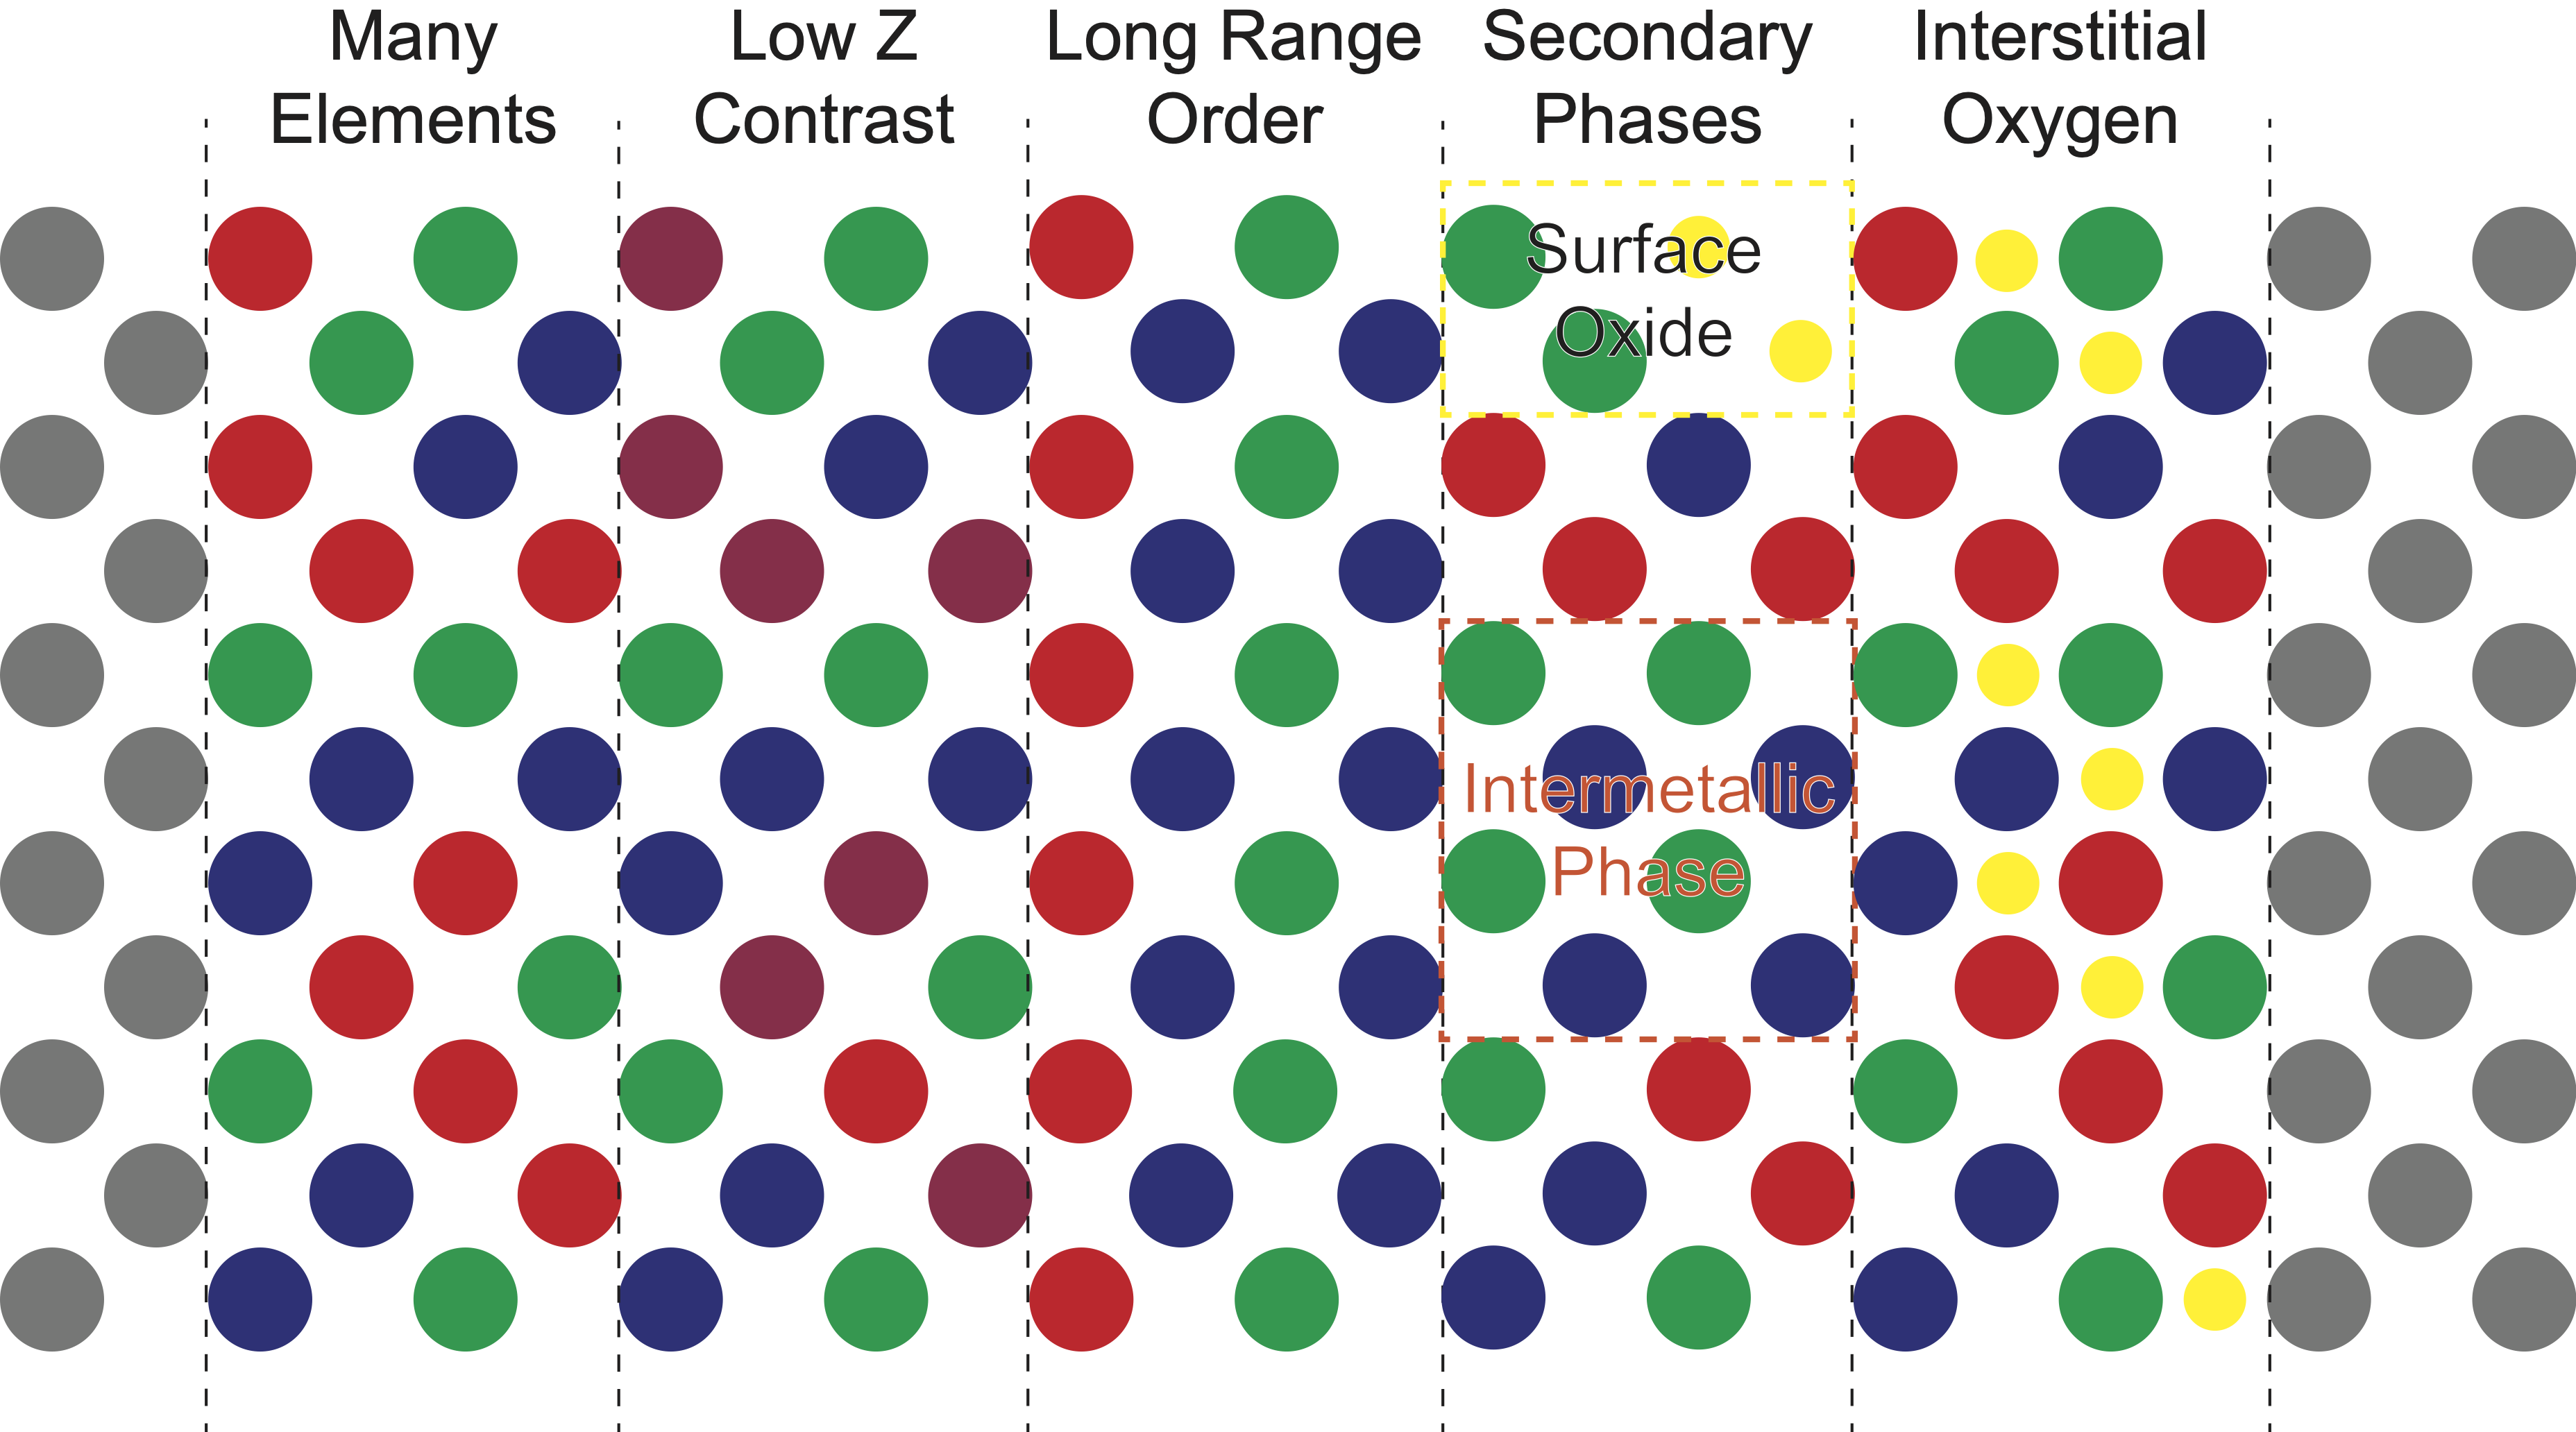
For CCAs there are many compounding effects that make this particularly challenging. In this perspective we outline five aspects of CCA systems, illustrated in Fig. 1, that make them uniquely challenging for quantitative SRO analysis via EXAFS:
-
1.
Multicomponent solid solutions introduce a large number of parameters
-
2.
CCAs often have many elements with similar atomic number (Z), leading to poor elemental contrast (§II.3)
-
3.
Potential long range order (§II.4) dramatically increases the complexity of the structural models
-
4.
Secondary phases, both metallic and oxide, contribute the to EXAFS signal and must be included in the model (§II.5).
-
5.
Interstitial oxygen is present at significant concentrations in many alloys, particularly refractory CCAs, contributing to the scattering signal below the first metal-metal NN distance (§II.5).
We discuss these challenges in detail and identify paths towards robust and scalable quantitative SRO analysis to accelerate scientific understanding and development of complex, technologically relevant CCA systems.
II Current limitations of EXAFS analysis for multicomponent alloys
II.1 The EXAFS equation and its complexity
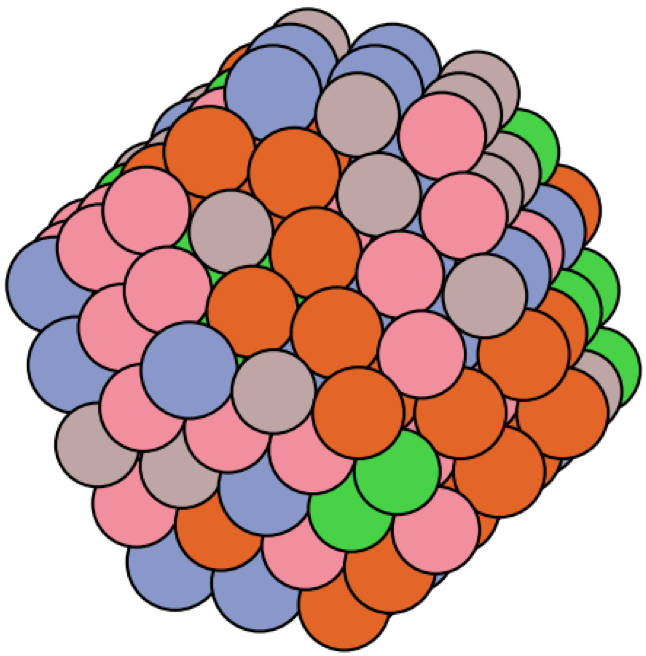
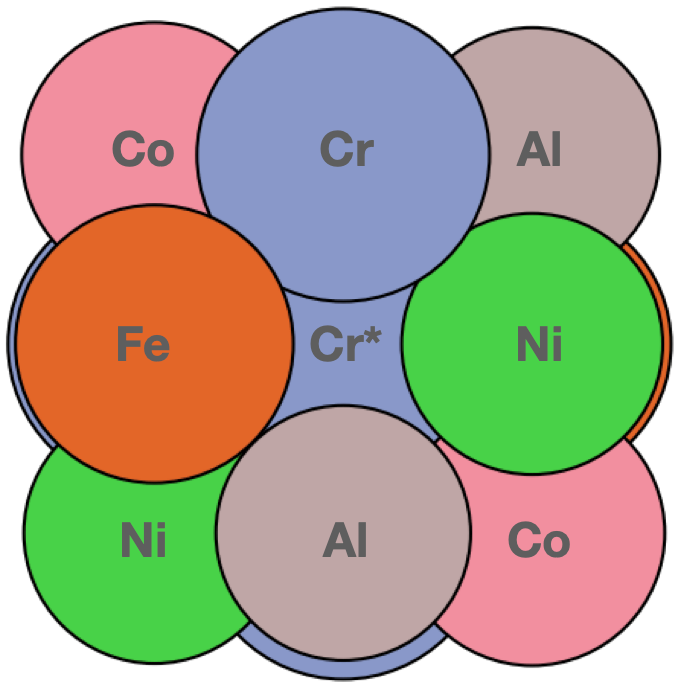
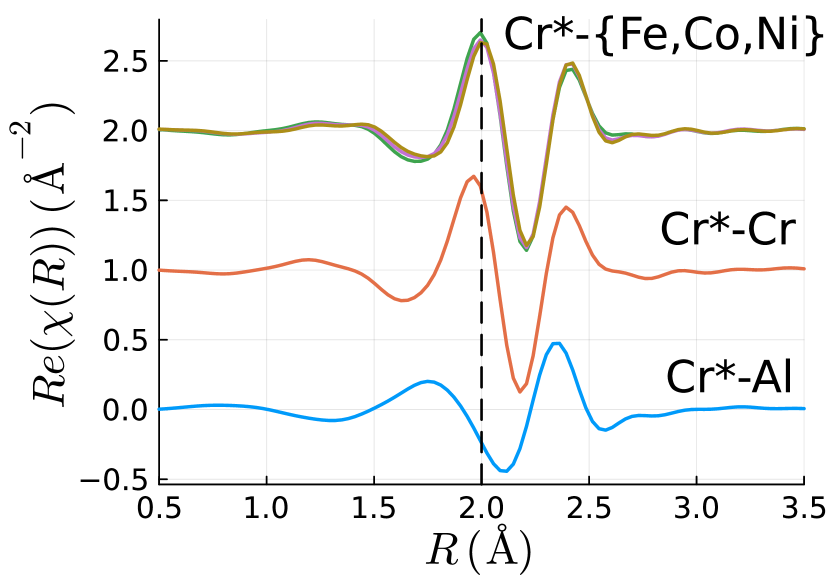
The EXAFS path expansion equation models the EXAFS signal, , of the average absorbing atom as the sum of the contribution from a set of photoelectron scattering paths, corresponding to each neighboring species or sets of species. The structural model for even simple CCAs without secondary phases or long range order contains a large diversity of scattering paths, resulting in unfavorable model size scaling with the number of species. Figure 2 shows a quinary FeCoNiCrAl FCC (Face Centered Cubic) nanocluster (a), along with (b) the first coordination shell surrounding a single symmetrically distinct absorbing Cr atom in the FCC solid solution. This highlights two intrinsic difficulties of EXAFS analysis for CCAs. First, even a simple first neighbor shell model has high complexity from the many distinct scattering paths. Consideration of higher order NN shells requires explicit modeling of multiple scattering paths, which scale combinatorially with the number of scattering elements. This limits almost all practical analysis of SRO CCAs to the first or first and second shell (with exceptions, e.g., Ref. [22]). We discuss the trade-offs of this approach in §III.4, but otherwise limit our discussion to first shell analysis. The second issue is the low contrast between the scattering factors of neighboring elements as shown in 2c and discussed in §II.3.
Consider the functional form of the EXAFS path expansion equation,
| (2) |
where is a function of wavenumber of the generated photoelectron 111 where is the energy of the photoelectron ( , parameterized by — for each scattering path in the model — at least five empirical parameters typically estimated by nonlinear least squares and three functions of obtained through first principles multiple scattering calculations, e.g., FEFF[23]. The three theory-derived values are , and , the theoretical effective scattering amplitude, photoelectron mean free path (in FEFF this is interpolated from tabulated values), and the phase shift for each scattering path respectively.
The five empirical parameters per scattering path are
-
1.
: the amplitude reduction factor that compensates for the sudden, single-electron assumption made by FEFF;
-
2.
: change in the expected edge energy (i.e., the zero-point for );
-
3.
: the multiplicity222In the EXAFS literature is often called the degeneracy of the scattering path; in this manuscript we use the term multiplicity to avoid confusion during discussion of degenerate least squares optimization problems. of the scattering path;
-
4.
: half the photoelectron path length, interpreted for single scattering paths as an average bond length. The first principles modeling by FEFF requires a starting path length, and fitting is performed on such that ;
-
5.
: the variance of the half-path length, often called the mean square relative displacement (MSRD) and sometimes conflated with the Debye-Waller factor, which is a portion thereof;
In practice, accommodates the physical as well as any other factors that might affect the amplitude of the signal compared to the calculation, for example experimental geometry, sample inhomogeneity, detector non-linearity, and beam harmonic content.
For the case of crystalline solid solutions, we can rewrite Eq. 2 as a double sum, explicitly organizing the paths into sets of neighbor shells each with scattering elements :
| (3) |
Strictly speaking, considering multiple scattering this is a set of geometrically identical paths. Crystalline materials without vacancies follow the constraint that is equal to the total coordination number of the shell. Division by this coordination number yields the conditional probability for the shell needed to derive the WC parameter: when measured about a absorber (). As we will be focusing on first shell analysis, notationally we will assume and or drop the indexes entirely.
Fig. 3 illustrates the relationship between model parameters under various assumptions. These plate diagrams are a convenient graphical tool for concretely and concisely representing conditional dependence relationships between variables in complex graphical models [24].
Fig. 3(a) illustrates a standard single-edge EXAFS model with no simplifying assumptions. The rectangular “plates” show collections of variables that are conditionally independent given their ancestors in the graph. Circular nodes represent independent parameters in the model, directed edges (arrows) represent conditional dependence relationships, and diamond nodes represent variables that are deterministic given the values of their ancestors in the graph. Filled nodes represent observed variables, for example the measured EXAFS values for values of (or in the case of the Fourier transformed signal), which is dependent on the underlying noiseless EXAFS signal, , and detector noise, .
The upper plate in the single-edge first shell model of Fig. 3(a) concisely illustrates the EXAFS path expansion model for the first shell scattering paths included in the model. Each scattering path has independent MSRD and bond length parameters, and . The coordination variables are shown as deterministic variables because they are coupled by sampling independent parameters that form a simplex variable . The absorption edge is drawn outside the path expansion plate indicating the common assumption that is constant for all scattering paths. Similarly, the amplitude reduction factor is drawn without a node marker, indicating the assumption of a fixed value transferred from analysis of an elemental standard.
In addition to the parameters described above, in some cases, additional path parameters can be introduced, for example the higher order cumulant expansion method for asymmetric path length distributions [25]. Structures with extreme structural disorder may be require modeling the path length distribution with a histogram expansion method [26]. With such a large array of structural parameters, most structural models are heavily overparameterized with respect to the limited amount of information contained in EXAFS data [27].
The information theoretic Nyquist criterion [27] gives a heuristic bound on the number of independent parameters supported by the data: . is the range of k space that is Fourier transformed, generally varying from 6 Å-1 for a quick scan and up to 12 Å-1 for the highest quality data. is the fitting range in real space, typically spanning 1 Å to 2 Å for the first shell in CCA solid solutions. This leads to a range of from 4 to 15 per spectrum.
We compare the amount of information based on this criterion with the number of model parameters as a function of alloy components in the first three columns of Table 1 (In this table we use per edge, as this is a reasonably conservative value and is consistent with the data we generally collect). is roughly multiplicative with the number of edges collected and analyzed. In the independent FCC model described above, there are independent parameters (assuming a fixed ) if we independently model all edges; alloys with more than two species are overparameterized. We also show in the \nth4 column parameter counts for body centered cubic (BCC) materials, where it is not feasible to isolate the first shell with Fourier filtering because of the close overlap of the first and second NN bond lengths. Consequently, the number of independent parameters is substantially higher (). The overparameterization of these multicomponent solid solution models leads to particularly challenging EXAFS analysis problems if we must accurately measure chemical SRO. A minimally constrained first-shell model for an FCC quinary alloy has 15 parameters for a single edge, nearly double what a typical EXAFS spectrum supports.
| M | Independent | Symmetric | SRO | Symmetric & metal radii | SRO & metal radii | ||||
|---|---|---|---|---|---|---|---|---|---|
| FCC | BCC | FCC | BCC | FCC | BCC | FCC | FCC | ||
| 1 | 8 | 3 | 5 | ||||||
| 2 | 16 | 12 | 22 | 10 | 18 | 9 | 16 | 9 | 8 |
| 3 | 24 | 27 | 51 | 21 | 39 | 17 | 31 | 18 | 14 |
| 4 | 32 | 48 | 92 | 36 | 68 | 27 | 50 | 30 | 21 |
| 5 | 40 | 75 | 145 | 55 | 105 | 39 | 73 | 45 | 29 |
| 6 | 48 | 108 | 210 | 78 | 150 | 53 | 100 | 63 | 38 |
Whenever EXAFS for multiple absorption edges is available, the precision and accuracy of the analysis can be improved through joint multi-edge analysis by coupling the structural models for each absorbing species with physical self-consistency constraints [28] as shown schematically in Fig. 3(b). Calvin et al. [29] demonstrate an impressive suite of such assumptions for analysis of manganese zinc ferrite nanoparticles. If we apply this approach in a self-consistent solid solution model, the bond length and MSRD parameters can be modeled as symmetric matrices, and respectively. Because the bond lengths and MSRDs between pairs of species must match, only the upper triangular part of this matrix represents free parameters. For instance, if atoms of scattering species A have some average distance from NN atoms of absorbing species B, by construction absorbing species A atoms must have the same average distance from NN atoms of species B. This symmetry assumption reduces the bond lengths in an independent model to pairwise bond lengths. The number of MSRD parameters scales similarly. The affect of this assumption is illustrated in the “symmetric” column of Table 1, where the FCC model has independent parameters.
Unfortunately, for higher order alloys this assumption is insufficient to eliminate the overparameterization. This is often address through simplifying assumptions, for example path length and MSRD equality constraints within neighbor shells. For disordered solid solutions, which commonly exhibit high degrees of static lattice distortion, these assumptions may introduce unacceptable levels of unphysical bias that makes accurate SRO quantification impossible. We discuss these parameterization issues and potential mitigation strategies in detail in Section III.
II.2 Parameter degeneracy
It is well known in EXAFS analysis that there is a high degree of parameter degeneracy. That is, often multiple sets of fitting parameters provide equally optimal goodness of fit[18]. In particular and are known to have a high degree of correlations because both parameters affect the phase term of the complex scattering factor in the EXAFS equation [30, 31]. While element-specific bond lengths are important parameters in these alloys, even more important is the occupancy of elements in the shell. Unfortunately is also highly correlated with other values, all of which affect the amplitude of . For a single shell, single edge fit, is completely degenerate with . The MSRD parameter is also highly correlated, but is more separable based on its dependence.
Fig. 4 shows some BCC CoCrAl Cr-edge EXAFS data that illustrate this issue. There are two distinct solutions (illustrated in red and blue) that fit the data equally well despite having substantially different coordination and bonding parameters. The R factors, , for the two solutions are 0.00362 and 0.00238, indicating excellent consistency with the data. The edge energy shifts (not shown) are similar at eV and eV, ruling out unphysical compensation of phase shift induced by changing bond lengths and coordination variables [30].
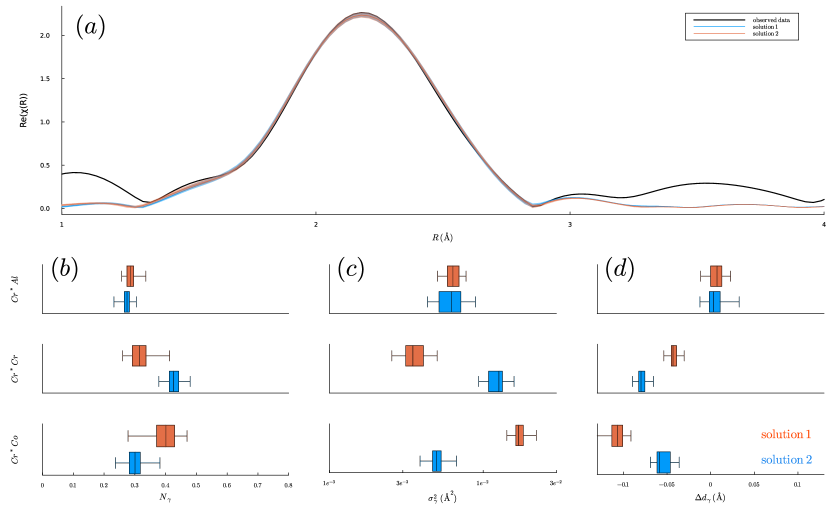
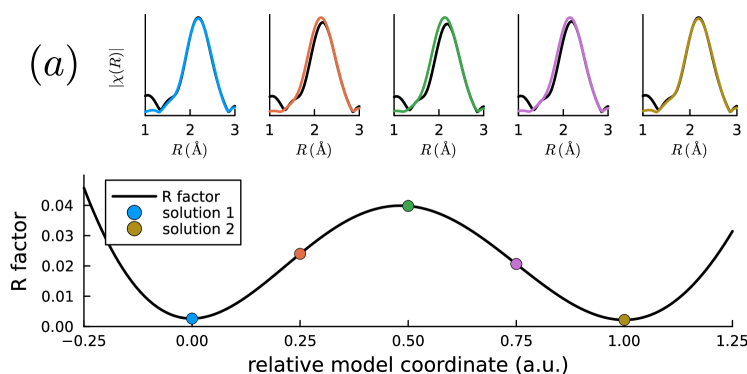
We further interrogate this example by interpolating in parameter space between the two solutions. Fig. 5 (a) plots the R factor along this model interpolation trajectory with 5 selected model illustrations. This shows that solutions 1 and 2 are distinct local minima and the fitting quality is degraded along the model interpolation coordinate. The source of degradation is the exchange of first shell Cr and Co: The Cr-Cr bonds shift to longer distances with lower MSRD and lower occupancy, and the Cr-Co bonds trend in the opposite direction. The EXAFS signals for these scattering paths phase shift in opposite directions along the interpolation trajectory, resulting in the positive amplitude deviation in the first shell when they contribute exactly in phase near the maximum of the R factor curve. The change in other model parameters is negligible.
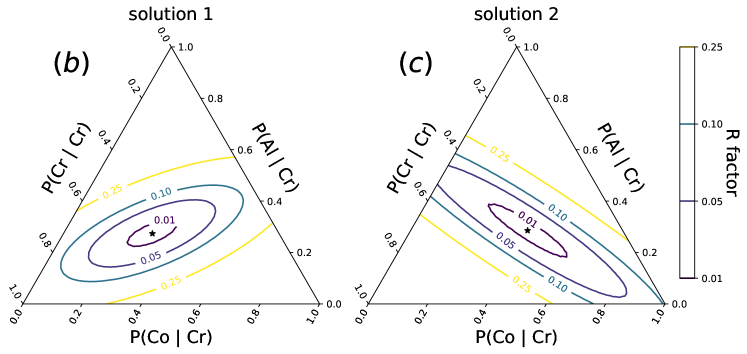
Fig. 5 (b) and (c) show the sensitivity of the model to the first shell coordination variables around the two solutions, holding all other parameters fixed. While Fig. 4 shows that these are distinct minima, it is notable that the two solutions show quite different correlations between coordination variables. Low Z contrast between scattering species could explain the high correlation between the Cr-Cr and Cr-Co coordination variables in solution 1, while solution 2 counterintuitively shows high correlation between Cr-Al and Cr-Co scatterers that should be easily distinguishable.
II.3 Unfavorable elemental contrast
While technically the design space of CCAs can include almost any element, frequently these elements are adjacent on the periodic table. For example, the quintessential light-weight CCA FeCoNiCrAl contains four first row transition metals plus Al[32, 1, 33]. Similarly, many refractory alloys come from a 3x3 block of elements in the periodic table, so any combination of more than three refractories must contain at least one set of neighboring elements[34, 1]. These neighboring elements make EXAFS analysis much more difficult for two reasons.
First, directly neighboring elements in some cases have absorption edges that are very close. It is generally not possible to continue collecting EXAFS signal from one element above the absorption edge of another element that is contained in the sample contains. These cases limit the range of the data that can be collected and thus the information content of the data.
The second issues with adjacent elements is the minimal difference in their photoelectron scattering cross-section. For this reason , the scattering amplitude, will show minimal contrast between neighboring elements. Because of their similar electronic configurations , the phase shift, will also show minimal variation between neighboring elements. This is the principal reason for the extreme similarity between the scattering signal of the Fe, Co, and Ni species in Figure 2(c).
While there are various “rule-of-thumb” heuristics, most suggest that elements within 5 to 7 atomic numbers of each other cannot be distinguished in EXAFS[18]. However, distinguishing between scattering species of similar atomic number is not impossible. Though they are highly similar, there is some contrast in and that can be leveraged for fitting, particularly in near but not adjacent species. More useful for speciation is the fact that different species have different bonding which changes both the associated MSRD and the bond length. Unfortunately, the high degree of parameter degeneracy discussed in Section II.2 makes isolating these effects difficult.
One approach commonly used to mitigate this effect is to create a hybrid species of two or more elements[35, 33], which are in turn represented by either one of the elements directly or an average species. The advantage of this approach is that it greatly reduces the number of free parameters in the model. However, there are drawbacks. First, although neighboring elements may have similar electron scattering cross sections, the atomic radii of the elements may vary dramatically making the hybrid species non-representative. Zr and Nb, for example, are neighboring elements commonly used in refractory alloys that have greatly differing metallic radii. A second drawback is that this approach reduces the scientific knowledge that can be gained from the fit and increases the difficulty of multi-edge fitting. For instance in a FeCrAl alloy, if a fit is performed with a hybrid Fe-Cr species, then the specific occupancy of Cr in a shell about any of the scatters cannot be directly extracted from the model. That being said, since there are only independent WC parameters for a single phase material, application of the formulae in de Fontaine [36] with a sufficient number of WC parameters from various edges and element combinations can yield these missing WC parameters. If there is an insufficient number of values to fully determine the system of SRO parameters, these constraints can still provide bounds on the undetermined SRO parameters.
II.4 Structural complexity and long-range order
While CCAs are often idealized as chemically disordered solid solutions, the broader category of CCAs that we discuss here include alloys that more resemble traditional intermetallics, including alloys such as Heusler, half-Heusler, and Laves compounds. In these alloys with long range order, there are distinct Wyckoff sites in the unit cell, multiplying the number of scattering paths required in the EXAFS path expansion model. Consider a hypothetical non-stoichiometric ternary alloy \ceA_xB_yC_z with a B2 (CsCl) crystal structure, which has two distinct sites: an site at and a site at . In this alloy the \ceA atoms predominantly reside on the site, the \ceB atoms predominantly reside on the site, and the \ceC atoms are distributed between the two sites. There are two crystallographically distinct local environments for \ceC atoms: those on the site, will mostly have \ceB atoms in their first neighbor shell, along with their associated bonding characteristics, while \ceC atoms on the site will mostly be surrounded by \ceA atoms. Standard EXAFS analysis, as described above, has an underlying assumption that bond length distributions are Gaussian. When averaging the environments of the \ceC atoms across the two sites this assumption may be violated, particularly if the different sites have different neighbor distances. Proper analysis requires separate \ceC absorption contributions for the two sites, doubling the number of fitting parameters associated with that element.
It seems unlikely that EXAFS analysis of alloys with partial LRO will be tractable without a good method for simultaneously quantifying the degree of long range order, especially if only a subset of species participate in the superlattice structure. For example, the authors of reference [37] use HAADF-STEM to examine which elements participate in the sublattice ordering in an octonary alloy with both short and long range order.
II.5 Compositional heterogeneity, second phase formation, and oxidation
While many CCA studies focus on or make simplifying assumptions limiting analysis to single phase and homogeneous material, in practice local heterogeneity and structural diversity is an important feature of these alloy systems. These inhomogeneities can take many forms, including secondary phase formation [38] , continuous composition gradients near grain boundaries and other microstructure features [39] , and surface oxide formation [34] . Similarly SRO may vary spatially, with or without the presence of nominal composition variation. Each of these types of spatial inhomogeneities pose challenges for quantitative EXAFS analysis of SRO.
When there are discrete secondary phases, EXAFS measures the ensemble average of the environments of the absorbing atoms in the parent and any secondary phases. While the EXAFS decomposes into a simple sum of the contribution from each phase, in practice separating the contributions through explicit multiphase modeling is challenging and is not often attempted; the additional structural phase dramatically increases the number of parameters without increasing the available information. For attempting such a fit, reliable estimation of the phase fractions and compositions of the constituent phases is critical. However, supplementary measurement of these quantities presents yet another challenging measurement, analysis, and modeling problem. This may present substantial difficulty if there are nanoscale precipitates that may require transmission electron microscopy techniques over more scalable probes like X-ray diffraction and scanning electron microscopy techniques.
In the case of localized compositional inhomogeneity, standard EXAFS at best can provide an ensemble average of the entire probed volume, which may be much larger than the length scale of the composition or structural fluctuations. However, as mentioned above standard EXAFS analysis assumes that bond lengths will have a Gaussian distribution. For such a continually varying system, it is not possible to know a priori if these distributions will remain Gaussian. Even in the case they are Gaussian, they are likely to be much broader than a homogeneous material. Without the ability to rely on modeling the MSRD as a narrow Gaussian, the analysis problem becomes much more complex.
In some CCAs, particularly refractory alloys, avoiding oxygen inclusion in the sample is nearly impossible. Interstitial oxygen (or nitrogen) may be present and secondary oxide or nitride phases can form, typically leading to compositional inhomogeneity. Typical metal-oxygen bonds are shorter than metal-metal bonds, so the first metal-oxygen scattering paths contribute to the R-space EXAFS as a peak at somewhat shorter distance than the typical first metal-metal shell. While these peaks are often separable from the first metal shell through Fourier windowing, caution is warranted when neglecting the multiple scattering paths involving the first metal neighbor and an oxygen atom. Furthermore, the nearest metal-oxygen scattering contribution is concentrated in a portion of the EXAFS that is critical for robust background estimation [40]. This increases the difficulty of selecting good (and transferable) background estimation settings and can potentially bias estimates of coordination number variables.
At low levels, oxygen will typically cluster to the interstitial sites surrounding the most gettering species, and the oxygen-metal multiple scattering paths can likely be safely ignored. However, at higher levels this can begin to interfere with the fitting. If discrete oxides form, the second phase must be explicitly modeled to account for the contribution of metal absorbing sites in the oxide to the EXAFS signal, as discussed above in the context of intermetallic compounds.
III Possible ways forward
We will need innovation on multiple fronts in order to mitigate the challenging aspects of EXAFS analysis of scientifically and technologically interesting CCA systems. We must think carefully about how to improve the quality of the data we collect, increase the amount of information we bring to the quantitative analysis table, and develop more powerful spatially-resolved and multimodal analytical microscopy techniques.
III.1 Improved data quality
Proper data collection and its resultant quality is important for producing usable EXAFS analysis. Best practices in this area are generally well known [29], but there are opportunities for improvement. For tasks such as extracting WC parameters, where coordination number is critical, getting proper peak intensities is necessary. These peaks can be weakened by self absorption in thick, concentrated samples measured in fluorescence mode. While this is readily avoidable in CCAs synthesized as thin films, bulk samples must be thinned to a level that can be a challenge for conventional metallurgical sample preparation over areas larger than beam size for standard bulk EXAFS analysis. Collection of standards can also help in this regard [40].
While the Nyquist criterion tells us that spectra with larger measured range of space contain more information, the range of the scan is not the only parameter that affects data quality. EXAFS data are commonly collected with non-uniform energy discretization, typically using a much finer energy resolution and integration time in the absorption edge than in the extended EXAFS region, with intermediate energy resolution in the pre-edge part of the scan. Both the density and collection time can be adjusted, not just for these common scan segments, but potentially dynamically adjusted based on the characteristics of the data as it is being collected [41]. Given a fixed measurement budget, optimal allocation of measurement time across the full absorption spectrum for robust and efficient quantitative analysis is an open question.
III.1.1 Spatial mapping
In multiphase or inhomogeneous systems, robust quantification of SRO would likely require localized EXAFS data that captures a single structure and composition regions of the sample, often on the nano-scale. There are two approaches to collecting these data along with accompanying compositional data (and potentially structural data from diffraction), both still largely in development.
The first approach is to use hard x-ray nanoprobe [42]. Beams on the order of 100 nm can be readily generated using reflective, and thus achromatic, optics such as KB (Kirkpatrick–Baez) mirror pairs and have been demonstrated for measuring EXAFS [43]. However, the zone plates and other Fresnel optics and multilayer Laue optics that rely on refraction or diffraction typically used to generate beams smaller than this are inherently chromatic optics, which changes the focal length as a function of energy. The chromatic effects on beam size along with monochromator induced beam movement and flux limitations make extended EXAFS measurements at this sample size largely intractable with current technology [44, 42]. To the extent that these measurements are tractable, one advantage is that they are amenable to fluorescence mode XAS with relatively thick samples.
The other option is to use a scanning transmission electron microscope (STEM) equivalent to EXAFS, known as extended energy loss fine structure (EXELFS) to provide a dramatic improvement in spatial resolution[17]. EXELFS, like EXAFS, provides the same information regarding the local atomic environment, but with nanometer spatial resolution and an energy resolution down to eV. Until recently, application of EXELFS to study SRO has been limited due to low energy resolution and limited energy range to access relevant absorption edges. Hart et al. [45] resolve these issues through state of the art direct detection EELS to enable spatial SRO mapping with nanometer resolution. They demonstrate by locally measuring the SRO in a Cu-Zr-Ni-Al bulk metallic glass (BMG), as a function of distance from the interface of the BMG film to a Ni layer. They found a positive Warren-Cowley parameter Ni-Zr (Eq. 1) across the entire BMG width, indicating a preference for Ni and Cu clustering. An additional advantage of EXELFS is that the sample can be further analyzed by other high resolution TEM technique to fully understand the related properties.
One drawback of these high spatial resolution measurements is that they require large measurement time and only provide information for a localized area. For a single sample the measured area may not be representative and the substantial sample preparation investment makes systematic high-throughput EXELFS studies intractable. One possible path forward is to use preliminary detailed EXELFS spatial mapping to characterize local structural and chemical distributions. This characterization can inform the model specification and optimization for quantitative or semi-quantitative analysis of high throughput “bulk” EXAFS measurements. Finally, the high throughput bulk EXAFS analysis may identify selected areas for subsequent spatially-resolved EXELFS analysis. In principle, the spatially-resolved EXELFS data and the bulk EXAFS measurements can be modeled jointly as well.
III.2 Increasing information with larger datasets and multimodal characterization
Because of the complications described above, the likely path to robust extraction of useful SRO knowledge from EXAFS almost certainly involves the injection of additional information to reduce, or at least constrain, the dimensionality of the fit. Potential information sources include (justifiable) simplifying assumptions, joint modeling of related EXAFS data, information fusion through multimodal characterization and analysis, and incorporation of data and knowledge from supplementary information streams such as computational thermodynamics and atomistic simulation.
III.2.1 Joint analysis of multiple edges
As discussed in § II.1, the degree of overparameterization can be reduced by coupling bond length and MSRD parameters across pairs of absorption edges through a symmmetry assumption. However, imposing similar pairwise constraints on the coordination number variables in solid solutions is not so straightforward. As discussed by de Fontaine [36] the coordination numbers of pairs of species are related by the definition of conditional probability as well as simplex constraints, reducing coordination parameters to . However, naive application of these coordination symmetry constraints in non-equiatomic solid solutions can result in invalid SRO matrices that imply negative coordination numbers. Application of the quadratic constraints identified by de Fontaine can resolve this issue, but these constraints couple across pairs of components, complicating straightforward application of these constraints in nonlinear least squares model optimization, as outlined in our forthcoming paper [46].
III.2.2 Joint analysis of multiple samples
There are also cases where data on related samples are collected simultaneously. This may include samples with neighboring compositions, like combinatorial libraries [47, 48], or the same sample over multiple temperatures. In these cases, at least within a single phase, we can assume the fitting parameters will vary smoothly. For instance, we would expect parameters to increase monotonically with temperature, which is routinely modeled with the correlated Debye model for joint analysis of EXAFS collected over a temperature series [49]. To constrain the fit and exchange information between them, we can perform a global fit on all the samples using a model of the type illustrated in Fig. 3. In this hierarchical model the EXAFS parameters for each sample are drawn deterministically from a smooth function, e.g., a spline or Gaussian Process [50]. The fit in this case is performed by optimizing the parameters of those functions rather than the individual parameters.
III.2.3 Data fusion and multimodal analysis
Above, in §III.1.1, we describe an approach to deal with inhomogeneous samples by combining EXELFS and EXAFS data. Beyond the problem of sample inhomogeneity, data augmentation can be useful to inform and bias EXAFS modeling. It is possible to augment EXAFS data with both computational and experimentally obtained values. For instance, data obtained from pair distribution measurements (PDF) can be added to constrain the fit[47]. In the example shown in Fig. 4, PDF may be able to provide a set of bond lengths, identifying one of the two models as more likely. We note however that x-ray scattering cross sections and electron scattering cross sections are similar so only a small amount of additional information is available from x-ray PDF when there is low Z contrast. Neutron cross-sections, conversely, are very different as a function of Z so that neutron based PDF can provide information complementary to EXAFS. Unfortunately, the sample preparation required for these two techniques is quite different, and is not amenable to current high throughput material synthesis capabilities.
Computational methods, especially atomistic simulation such as density functional theory (DFT) calculations and molecular dynamics (MD) simulations, can also provide valuable data to aid in fitting the EXAFS data, particularly in helping define starting parameters or identifying plausible physical constraints. For example, MD simulations can be used to parameterize bond length parameters in highly disordered systems, particularly those that require the bond length histogram method [26]. For high throughput experimental studies, it may be helpful to base model specification and initial parameter guesses on average bond lengths, MSRDs, and coordination numbers obtained from hybrid Monte Carlo / Molecular Dynamics calculations, as in [51]. A variation of this approach has been the focus of recent efforts in ML-driven characterization [52, 53]. This approach uses large sets of Molecular Dynamics calculations (often enabled for complex alloy systems by machine learning interatomic potentials) to directly predict the parameters of the structural model from simulated EXAFS data. One drawback of this general approach is that it introduces yet another machine learning research problem: rapid development of robust multi-component interatomic potentials [54].
Similarly DFT, potentially coupled with statistical thermodynamics methods, can directly provide strong prior knowledge on the relative stability of compounds and alloys [55]. This could both accelerate and improve the accuracy of model search and specification for complicated multiphase alloys, particularly when multiple potential intermetallic phases could form. Furthermore, DFT estimates of the interaction energies between different atomic species can inform theoretical predictions of the relative ordering preferences between elemental species [56, 57, 58], which can either constrain or help initialize coordination number estimates in EXAFS analysis.
III.3 What simplifying assumptions are defensible?
Commonly, overparameterization of EXAFS models is further mitigated by introduction of physically defensible constraints between parameters; Chapter 14 of XAFS for Everyone [18] discusses in detail a variety of physical (e.g., known long range crystal structure) or simplifying (e.g., arbitrary constraints on bond lengths) constraints [18]. Given the complexity of CCAs and the importance of local lattice distortion, it is unclear to what extent many of the commonly used assumptions are safe to apply.
For example, a simplifying assumption that is frequently employed is that all atomic pairs have the same MSRD. However, in alloys with large degrees of static lattice distortion, care must be taken in how MSRDs and bond lengths are parameterized in a fit. The effects of static and thermal disorder are quite difficult to disentangle in EXAFS analysis. Doing so requires high data quality over an extended energy range and benefits from measurement at multiple temperatures. Alternatively, it may be appropriate in some cases to fit metallic radii instead of an symmetric matrix of first shell bond lengths. This gets more complicated for high level NN shells, including the \nth2 NN shell in BCC. We tabulate the total number of free parameters when applying this constraint in addition to the symmetry and SRO constraints to fits of FCC materials in the \nth9 and \nth10 columns of Table 1, respectively. Another approach is to constrain the model to a fully random SRO distribution and qualitatively infer the ordering tendencies based on the fitted bond length distributions [35]. It is also common to fit to elemental standards and assume the values transfer to the crystal structures and sample morphologies being measured, which may differ substantially from those of the elemental standards. This simple approach to the amplitude reduction factor can be improved by consideration of many-body effects. [59] Considering the extreme overparameterization of BCC and multiphase CCA structural models, analysis may not be tractable without some kinds of simplifying assumptions. The CCA community would benefit from a systematic benchmark study to firmly establish criteria for when different assumptions may be acceptable given the scientific goals.
III.4 Multiple scattering and higher shell paths
To this point we have predominately focused on fitting of first NN shell (or in the case of BCC first and second NN shells) as including additional shells greatly increases the complexity of the model. Further, EXAFS in these alloys tends to have minimal spectral weight at higher R values. To the extent it is possible to include these multiple scattering paths, however, there may be benefits. First, higher shell fits have greater ability to decorrelate and . Using higher R ranges also increases the number of parameters according to the Nyquist criteria. Finally, the multiple scattering and higher shell parameters can further constrain the fit by adding beneficial bias through structural assumptions.
III.5 Other computational approaches
In addition to data fusion methods combining physics-based computational modeling with x-ray absorption spectroscopy (XAS) described above, ML has the potential to be a powerful tool for EXAFS analysis. There are various examples of such frameworks in microscopy and spectroscopy, providing inference from computationally generated structures [52, 60]. Many studies approach the EXAFS fitting problem from a black box optimization perspective using methods such as genetic algorithms to perform quantitative analysis [61, 62, 19]. While these methods can more efficiently search high-dimensional parameter spaces, they do not alleviate the extreme degeneracy of the structural models needed for robust and complete analysis of solid solutions and multiphase CCAs. In addition to directly improving quantitative analyses, ML offers powerful non-linear inference capabilities for accelerated acquisition and model selection for spectral data. Autoencoders have been demonstrated in EELS and XAS analysis in extracting a structurally relevant latent feature space [63, 64, 65], enabling rapid classification and reduced-order modeling of properties influenced by material structure. For EXAFS, this approach could be used to rapidly identify which structural models and corresponding assumptions may be appropriate for a given observation. Beyond unsupervised autoencoder approaches, physics informed ML frameworks add a further level of information extraction since models are trained using computationally generated data. Optimizing further to incorporate multiple modalities will build out highly correlated analysis capabilities beyond what is present in the EXAFS signal alone, and improve ML inference beyond the scope of a single characterization method [66].
IV Summary
Robust and efficient quantitative EXAFS analysis can enable the SRO measurements that are required to elucidate the mechanistic underpinnings of the exciting properties that CCAs offer. There are many challenges described here in achieving this. Fortunately there are still many underexplored avenues that may lead to improved measurement power. While we hope that this work serves both as a guide and a call-to-action for the CCA research community to improve the quality and information content of EXAFS fits, we also point out that currently most of the approaches described here are not simple or tractable to implement using common analysis tools such as Artemis[67], and broad scale adoption will also require efforts by the EXAFS community to adapt software to this complex but impactful challenge.
Acknowledgements
This research used resources at the 6-BM beamline of the National Synchrotron Light Source II, a U.S. Department of Energy (DOE) Office of Science User Facility operated for the DOE Office of Science by Brookhaven National Laboratory under Contract No. DE-SC0012704. The authors gratefully acknowledge partial funding from the Office of Naval Research (ONR) through the Multidisciplinary University Research Initiative (MURI) program (award #: N00014-20-1-2368) with program manager Dave Shifler.
Declarations
The authors declare no competing interests.
The opinions, recommendations, findings, and conclusions of this work do not necessarily reflect the views or policies of NIST or the United States Government.
References
- Gorsse et al. [2018] S. Gorsse, J.-P. Couzinié, and D. B. Miracle, From high-entropy alloys to complex concentrated alloys, Comptes Rendus Physique 19, 721 (2018).
- Miracle and Senkov [2017] D. B. Miracle and O. N. Senkov, A critical review of high entropy alloys and related concepts, Acta Materialia 122, 448 (2017).
- Liu et al. [2018] M. Liu, A. Aiello, Y. Xie, and K. Sieradzki, The effect of short-range order on passivation of fe-cr alloys, Journal of The Electrochemical Society 165, C830 (2018).
- Feng et al. [2017] W. Feng, Y. Qi, and S. Wang, Effects of short-range order on the magnetic and mechanical properties of feconi (alsi) x high entropy alloys, Metals 7, 482 (2017).
- Inoue et al. [2021] K. Inoue, S. Yoshida, and N. Tsuji, Direct observation of local chemical ordering in a few nanometer range in cocrni medium-entropy alloy by atom probe tomography and its impact on mechanical properties, Physical Review Materials 5, 085007 (2021).
- Ding et al. [2018] J. Ding, Q. Yu, M. Asta, and R. O. Ritchie, Tunable stacking fault energies by tailoring local chemical order in crconi medium-entropy alloys, Proceedings of the National Academy of Sciences 115, 8919 (2018).
- Xie et al. [2021] Y. Xie, D. M. Artymowicz, P. P. Lopes, A. Aiello, D. Wang, J. L. Hart, E. Anber, M. L. Taheri, H. Zhuang, R. C. Newman, et al., A percolation theory for designing corrosion-resistant alloys, Nature materials 20, 789 (2021).
- Tailleart et al. [2012] N. Tailleart, R. Huang, T. Aburada, D. Horton, and J. Scully, Effect of thermally induced relaxation on passivity and corrosion of an amorphous al–co–ce alloy, Corrosion science 59, 238 (2012).
- Xiong et al. [2019] Y. Xiong, Y. Yang, H. Joress, E. Padgett, U. Gupta, V. Yarlagadda, D. N. Agyeman-Budu, X. Huang, T. E. Moylan, R. Zeng, et al., Revealing the atomic ordering of binary intermetallics using in situ heating techniques at multilength scales, Proceedings of the National Academy of Sciences 116, 1974 (2019).
- Chen et al. [2022] S. Chen, T. Wang, X. Li, Y. Cheng, G. Zhang, and H. Gao, Short-range ordering and its impact on thermodynamic property of high-entropy alloys, Acta Materialia 238, 118201 (2022).
- Cowley [1965] J. Cowley, Short-range order and long-range order parameters, Physical Review 138, A1384 (1965).
- Zhang et al. [2022] R. Zhang, Y. Chen, Y. Fang, and Q. Yu, Characterization of chemical local ordering and heterogeneity in high-entropy alloys, MRS Bulletin , 1 (2022).
- McGreevy [2001] R. L. McGreevy, Reverse monte carlo modelling, Journal of Physics: Condensed Matter 13, R877 (2001).
- Krayzman et al. [2009] V. Krayzman, I. Levin, J. C. Woicik, T. Proffen, T. A. Vanderah, and M. G. Tucker, A combined fit of total scattering and extended x-ray absorption fine structure data for local-structure determination in crystalline materials, Journal of Applied Crystallography 42, 867 (2009).
- Cicco and Iesari [2022] A. D. Cicco and F. Iesari, Advances in modelling x-ray absorption spectroscopy data using reverse monte carlo, Physical Chemistry Chemical Physics 24, 6988 (2022).
- Warren [2014] B. E. Warren, X-ray studies of order-disorder, in X-ray diffraction (Dover Publications, 2014) p. 206–250.
- Hart et al. [2023] J. Hart, A. Lang, Y. Li, S. Shahrezaei, D. Alix-Williams, M. Falk, S. Mathaudhu, A. Frenkel, and M. Taheri, Revealing local order via high energy eels, Materials Today Nano 21, 100298 (2023).
- Calvin [2013] S. Calvin, XAFS for Everyone (CRC Press, 2013).
- Kido and Asakura [2020] D. Kido and K. Asakura, Problems in EXAFS analysis and its future prospects, Acc. Mater. Surf. Res. 5, 148 (2020).
- Ravel and Kelly [2007] B. Ravel and S. D. Kelly, The difficult chore of measuring coordination by EXAFS, in AIP Conference Proceedings (AIP, 2007).
- Newville [2014] M. Newville, Fundamentals of xafs, Reviews in Mineralogy and Geochemistry 78, 33 (2014).
- Ravel et al. [2002] B. Ravel, M. Raphael, V. Harris, and Q. Huang, EXAFS and neutron diffraction study of the Heusler alloy Co2MnSi, Physical Review B 65, 184431 (2002).
- Zabinsky et al. [1995] S. I. Zabinsky, J. J. Rehr, A. Ankudinov, R. C. Albers, and M. J. Eller, Multiple-scattering calculations of x-ray-absorption spectra, Physical Review B 52, 2995 (1995).
- Buntine [1994] W. L. Buntine, Operations for learning with graphical models, Journal of artificial intelligence research 2, 159 (1994).
- Fornasini et al. [2001] P. Fornasini, F. Monti, and A. Sanson, On the cumulant analysis of exafs in crystalline solids, Journal of Synchrotron Radiation 8, 1214 (2001).
- Price et al. [2012] S. W. T. Price, N. Zonias, C.-K. Skylaris, T. I. Hyde, B. Ravel, and A. E. Russell, Fitting EXAFS data using molecular dynamics outputs and a histogram approach, Physical Review B 85, 10.1103/physrevb.85.075439 (2012).
- Stern [1993] E. A. Stern, Number of relevant independent points in x-ray-absorption fine-structure spectra, Physical Review B 48, 9825 (1993).
- Ravel et al. [1999] B. Ravel, E. Cockayne, M. Newville, and K. Rabe, Combined exafs and first-principles theory study of \cePb_1- xGe_xTe, Physical Review B 60, 14632 (1999).
- Calvin et al. [2002] S. Calvin, E. E. Carpenter, B. Ravel, V. G. Harris, and S. A. Morrison, Multiedge refinement of extended x-ray-absorption fine structure of manganese zinc ferrite nanoparticles, Physical Review B 66, 10.1103/physrevb.66.224405 (2002).
- Kelly and Ravel [2007] S. D. Kelly and B. Ravel, EXAFS energy shift and structural parameters, in AIP Conference Proceedings (AIP, 2007).
- Michalowicz and Vlaic [1998] A. Michalowicz and G. Vlaic, Multiple solutions in data fitting: a trap in exafs structural analysis and some ideas to avoid it, Journal of Synchrotron Radiation 5, 1317 (1998).
- Sreeramagiri et al. [2021] P. Sreeramagiri, A. Roy, and G. Balasubramanian, Effect of cooling rate on the phase formation of alcocrfeni high-entropy alloy, Journal of Phase Equilibria and Diffusion 42, 772 (2021).
- Sur et al. [2023] D. Sur, E. F. Holcombe, W. H. Blades, E. A. Anber, D. L. Foley, B. L. DeCost, J. Liu, J. Hattrick-Simpers, K. Sieradzki, H. Joress, et al., High throughput discovery of lightweight corrosion-resistant compositionally complex alloys, arXiv preprint arXiv:2302.07988 (2023).
- Lo et al. [2022] K.-C. Lo, H. Murakami, U. Glatzel, J.-W. Yeh, S. Gorsse, and A.-C. Yeh, Elemental effects on the oxidation of refractory compositionally complex alloys, International Journal of Refractory Metals and Hard Materials 108, 105918 (2022).
- Zhang et al. [2017] F. Zhang, S. Zhao, K. Jin, H. Xue, G. Velisa, H. Bei, R. Huang, J. Ko, D. Pagan, J. Neuefeind, et al., Local structure and short-range order in a nicocr solid solution alloy, Physical review letters 118, 205501 (2017).
- de Fontaine [1971] D. de Fontaine, The number of independent pair-correlation functions in multicomponent systems, Journal of Applied Crystallography 4, 15 (1971).
- Cui et al. [2022] M. Cui, C. Yang, S. Hwang, M. Yang, S. Overa, Q. Dong, Y. Yao, A. H. Brozena, D. A. Cullen, M. Chi, T. F. Blum, D. Morris, Z. Finfrock, X. Wang, P. Zhang, V. G. Goncharov, X. Guo, J. Luo, Y. Mo, F. Jiao, and L. Hu, Multi-principal elemental intermetallic nanoparticles synthesized via a disorder-to-order transition, Science Advances 8, 10.1126/sciadv.abm4322 (2022).
- Jensen et al. [2016] J. Jensen, B. Welk, R. Williams, J. Sosa, D. Huber, O. Senkov, G. Viswanathan, and H. Fraser, Characterization of the microstructure of the compositionally complex alloy al1mo0.5nb1ta0.5ti1zr1, Scripta Materialia 121, 1 (2016).
- Mantha et al. [2021] L. S. Mantha, B. MacDonald, X. Mu, A. Mazilkin, J. Ivanisenko, H. Hahn, E. Lavernia, S. Katnagallu, and C. Kübel, Grain boundary segregation induced precipitation in a non equiatomic nanocrystalline CoCuFeMnNi compositionally complex alloy, Acta Materialia 220, 117281 (2021).
- Newville et al. [1995] M. Newville, B. Ravel, D. Haskel, J. Rehr, E. Stern, and Y. Yacoby, Analysis of multiple-scattering xafs data using theoretical standards, Physica B: Condensed Matter 208, 154 (1995).
- Leshchev et al. [2022] D. Leshchev, M. Rakitin, B. Luvizotto, R. Kadyrov, B. Ravel, K. Attenkofer, and E. Stavitski, The inner shell spectroscopy beamline at nsls-ii: a facility for in situ and operando x-ray absorption spectroscopy for materials research, Journal of Synchrotron Radiation 29 (2022).
- Mino et al. [2018] L. Mino, E. Borfecchia, J. Segura-Ruiz, C. Giannini, G. Martinez-Criado, and C. Lamberti, Materials characterization by synchrotron x-ray microprobes and nanoprobes, Reviews of Modern Physics 90, 025007 (2018).
- Martínez-Criado et al. [2014] G. Martínez-Criado, J. Segura-Ruiz, B. Alén, J. Eymery, A. Rogalev, R. Tucoulou, and A. Homs, Exploring single semiconductor nanowires with a multimodal hard x-ray nanoprobe, Advanced Materials 26, 7873 (2014).
- Pattammattel et al. [2020] A. Pattammattel, R. Tappero, M. Ge, Y. S. Chu, X. Huang, Y. Gao, and H. Yan, High-sensitivity nanoscale chemical imaging with hard x-ray nano-xanes, Science Advances 6, eabb3615 (2020).
- Hart et al. [2019] J. L. Hart, A. C. Lang, Y. Li, K. Hantanasirisakul, A. I. Frenkel, and M. L. Taheri, A synchrotron in the tem: spatially resolved fine structure spectra at high energies, arXiv preprint arXiv:1909.06323 (2019).
- DeCost et al. [2022] B. DeCost, H. Joress, M. Taheri, and T. McQueen, What are the limits of chemical short range order in multicomponent solid solutions?, in preparation (2022).
- Maffettone et al. [2022] P. Maffettone, D. Allan, S. I. Campbell, M. R. Carbone, T. Caswell, B. L. DeCost, D. Gavrilov, M. Hanwell, H. Joress, J. Lynch, B. Ravel, S. Wilkins, J. Wlodek, and D. Olds, Self-driving multimodal studies at user facilities, in AI for Accelerated Materials Design NeurIPS 2022 Workshop (2022).
- Joress et al. [2022] H. Joress, M. L. Green, I. Takeuchi, and J. R. Hattrick-Simpers, Applications of high throughput (combinatorial) methodologies to electronic, magnetic, structural, and energy-related materials, in Encyclopedia of Materials: Metals and Alloys (Elsevier, 2022) pp. 353–371.
- Dalba and Fornasini [1997] G. Dalba and P. Fornasini, EXAFS debye–waller factor and thermal vibrations of crystals, Journal of Synchrotron Radiation 4, 243 (1997).
- Williams and Rasmussen [2006] C. K. Williams and C. E. Rasmussen, Gaussian processes for machine learning, Vol. 2 (MIT press Cambridge, MA, 2006).
- Farkas and Caro [2018] D. Farkas and A. Caro, Model interatomic potentials and lattice strain in a high-entropy alloy, Journal of Materials Research 33, 3218 (2018).
- Timoshenko et al. [2020] J. Timoshenko, H. S. Jeon, I. Sinev, F. T. Haase, A. Herzog, and B. R. Cuenya, Linking the evolution of catalytic properties and structural changes in copper–zinc nanocatalysts using operando EXAFS and neural-networks, Chemical Science 11, 3727 (2020).
- Schmeide et al. [2021] K. Schmeide, A. Rossberg, F. Bok, S. S. A. Azzam, S. Weiss, and A. C. Scheinost, Technetium immobilization by chukanovite and its oxidative transformation products: Neural network analysis of EXAFS spectra, Science of The Total Environment 770, 145334 (2021).
- Deringer et al. [2019] V. L. Deringer, M. A. Caro, and G. Csányi, Machine learning interatomic potentials as emerging tools for materials science, Advanced Materials 31, 1902765 (2019).
- Hegde et al. [2020] V. I. Hegde, M. Aykol, S. Kirklin, and C. Wolverton, The phase stability network of all inorganic materials, Science Advances 6, 10.1126/sciadv.aay5606 (2020).
- Rao and Curtin [2022] Y. Rao and W. Curtin, Analytical models of short-range order in FCC and BCC alloys, Acta Materialia 226, 117621 (2022).
- Rowlands et al. [2006] D. A. Rowlands, A. Ernst, B. L. Györffy, and J. B. Staunton, Density functional theory for disordered alloys with short-range order: Systematic inclusion of charge-correlation effects, Physical Review B 73, 10.1103/physrevb.73.165122 (2006).
- Fernández-Caballero et al. [2017] A. Fernández-Caballero, J. S. Wróbel, P. M. Mummery, and D. Nguyen-Manh, Short-range order in high entropy alloys: Theoretical formulation and application to mo-nb-ta-v-w system, Journal of Phase Equilibria and Diffusion 38, 391 (2017).
- Rehr et al. [2010] J. J. Rehr, J. J. Kas, F. D. Vila, M. P. Prange, and K. Jorissen, Parameter-free calculations of x-ray spectra with feff9, Phys. Chem. Chem. Phys. 12, 5503 (2010).
- Unruh et al. [2022] D. Unruh, V. S. C. Kolluru, A. Baskaran, Y. Chen, and M. K. Y. Chan, Theory+AI/ML for microscopy and spectroscopy: Challenges and opportunities, MRS Bulletin 47, 1024 (2022).
- Terry et al. [2021] J. Terry, M. L. Lau, J. Sun, C. Xu, B. Hendricks, J. Kise, M. Lnu, S. Bagade, S. Shah, P. Makhijani, A. Karantha, T. Boltz, M. Oellien, M. Adas, S. Argamon, M. Long, and D. P. Guillen, Analysis of extended x-ray absorption fine structure (exafs) data using artificial intelligence techniques, Applied Surface Science 547, 149059 (2021).
- Martini et al. [2021] A. Martini, A. L. Bugaev, S. A. Guda, A. A. Guda, E. Priola, E. Borfecchia, S. Smolders, K. Janssens, D. D. Vos, and A. V. Soldatov, Revisiting the extended x-ray absorption fine structure fitting procedure through a machine learning-based approach, Journal of Physical Chemistry A 125, 7080 (2021).
- Pate et al. [2021] C. M. Pate, J. L. Hart, and M. L. Taheri, Rapideels: machine learning for denoising and classification in rapid acquisition electron energy loss spectroscopy, Scientific Reports 2021 11:1 11, 1 (2021).
- Kalinin et al. [2021] S. V. Kalinin, K. M. Roccapriore, S. H. Cho, D. J. Milliron, R. Vasudevan, M. Ziatdinov, and J. A. Hachtel, Separating physically distinct mechanisms in complex infrared plasmonic nanostructures via machine learning enhanced electron energy loss spectroscopy, Advanced Optical Materials 9, 10.1002/ADOM.202001808 (2021).
- Tetef et al. [2021] S. Tetef, N. Govind, and G. T. Seidler, Unsupervised machine learning for unbiased chemical classification in x-ray absorption spectroscopy and x-ray emission spectroscopy, Physical Chemistry Chemical Physics 23, 23586 (2021).
- Maffettone et al. [2023] P. M. Maffettone, D. B. Allan, S. I. Campbell, M. R. Carbone, T. A. Caswell, B. L. DeCost, D. Gavrilov, M. D. Hanwell, H. Joress, J. Lynch, et al., Self-driving multimodal studies at user facilities, arXiv preprint arXiv:2301.09177 (2023).
- Ravel and Newville [2005] B. Ravel and M. Newville, Athena, artemis, hephaestus: data analysis for x-ray absorption spectroscopy using ifeffit, Journal of synchrotron radiation 12, 537 (2005).