2022
[1,2]\fnmKrisztina \surPerger
[1]\orgdivKonkoly Observatory, \orgnameELKH Research Centre for Astronomy and Earth Sciences, \orgaddress\streetKonkoly Thege Miklós út 15-17, \cityBudapest, \postcodeH-1121, \countryHungary
2]\orgdivCSFK, \orgnameMTA Centre of Excellence, \orgaddress\streetKonkoly Thege Miklós út 15-17, \cityBudapest, \postcodeH-1121, \countryHungary
3]\orgdivInstitute of Physics and Astronomy, \orgnameELTE Eötvös Loránd University, \orgaddress\streetPázmány Péter sétány 1/A, \cityBudapest, \postcodeH-1117, \countryHungary
4]\orgdivDepartment of Astronomy, Institute of Physics and Astronomy, \orgnameELTE Eötvös Loránd University, \orgaddressPázmány Péter sétány 1/A, \cityBudapest, \postcodeH-1117, \countryHungary
5]\orgnameELKH–ELTE Extragalactic Astrophysics Research Group, \orgaddressPázmány Péter sétány 1/A, \cityBudapest, \postcodeH-1117, \countryHungary
Radio and mid-infrared properties of the blazar J14190838
Abstract
The radio quasar NVSS J141922083830 (J14190838) was initially classified as an uncategorised blazar-type object, following its detection in the -ray band with the Fermi space telescope. Later, using multi-waveband observations and modeling, its was found to be a flat-spectrum radio quasar (FSRQ). However, its radio emission has never been discussed in depth in the literature. Here we present a detailed analysis on the radio properties of J14190838 using archival interferometric imaging data at pc and kpc scales. We conclude that the flux density variations, the flat radio spectrum, the compact nature of the quasar structure at all scales, and the relativistic Doppler enhancement of the radio emission all support the previous classification as an FSRQ. We also investigated the short- and long-term mid-infrared (MIR) light curve of the quasar based on observations by the Wide-field Infrared Survey Explorer satellite, and found that there is significant variability on time-scales of days as well as years. Comparison of the MIR light curve to the times of previously reported -ray and optical flares shows no clear correlation between the events at different wavebands.
keywords:
Active galactic nuclei, Quasars, Jets, Radio continuum emission, Radio interferometry, Infrared photometry1 Introduction
Active galactic nuclei (AGNs) are compact regions in the centres of galaxies, producing luminous emission in the entire electromagnetic spectrum. The most powerful AGNs are believed to have their emission relativistically enhanced because of their jet orientation close to the line of sight to the observer, and are called blazars. There are two main sub-classes of blazars, BL Lac objects and flat-spectrum radio quasars (FSRQs). The radio-loud quasar NVSS J141922083830 (J14190838 hereafter; right ascension , declination taken from the Radio Fundamental Catalogue version 2022c111http://astrogeo.org/sol/rfc/rfc_2022c/) has a reported redshift of (Buckley et al, 2022; Olmo-García et al, 2022). We note that the VLBI coordinates coincide with the optical position measured by Gaia within mas (Gaia Collaboration et al, 2016, 2022), i.e., within the formal uncertainties. The quasar was labeled as a blazar of uncertain type in the Fermi Large Area Telescope (LAT) Third AGN Catalog (3LAC, Ackermann et al, 2015), with no other distinction on its nature. Its X-ray, -ray, optical, and near-infrared properties were further investigated by Buckley et al (2022) and Olmo-García et al (2022), including spectral energy distribution (SED) modeling. These studies led to the classification of J14190838 as an FSRQ, without actually investigating whether its radio spectrum is flat or not. This new classification is also reflected in the Fermi-LAT Fourth AGN Catalog (4LAC, Ajello et al, 2022). However, these works do not take the radio properties into account in the classification process and the analysis of the source. Here we provide a detailed account on what is known about J14190838 in the radio, using archival single-dish and interferometric data with low and high angular resolutions, covering large and small spatial scales, respectively. We also analyse mid-infrared (MIR) flux density monitoring observations from the Wide-field Infrared Survey Explorer (WISE) satellite.
Adopting a standard CDM cosmological model with km s-1 Mpc-1, , and , 1 milliarcsecond (mas) angular size corresponds to 7.79 pc projected linear size at the redshift of J14190838. The quasar is at the luminosity distance Mpc (Wright, 2006).
2 Observations and data reduction
2.1 Archival radio data
We collected non-simultaneous radio flux density measurements for J14190838 from the literature and various public catalogues. The details and references are listed in Table 1. The observing frequencies span a wide range of more than 3 orders of magnitude, from 76 MHz to 285 GHz.
2.2 VLBI imaging and model-fitting
To determine the physical parameters of the jet in the radio quasar J14190838, we turned to the highest-resolution data and analysed available archival very long baseline interferometry (VLBI) measurements. The data were obtained with the US National Radio Astronomy Observatory (NRAO) Very Long Baseline Array (VLBA) at two different frequencies, and GHz, in the framework of the 7th and 8th runs of the VLBA Calibrator Survey (PI: L. Petrov, project codes: BP171a3, BP171a5, BP177b, and BP177c, Petrov, 2021) at four different epochs in 2013 and 2014. The details of the observations are given in Table 2. The calibrated interferometric visibility data were downloaded from the Astrogeo database222http://astrogeo.org/cgi-bin/imdb_get_source.csh?source=J1419-0838. The short snapshot observations were made in right circular polarisation, with MHz bandwidth in each of the 8 intermediate frequency channels (IFs), leading to a total bandwidth of MHz. The calibrated data sets were produced by the pima software (v1.28 and v2.08, Petrov et al, 2011). We performed hybrid mapping in difmap (Shepherd, 1997), using subsequent cycles of clean deconvolution (Högbom, 1974) and phase and amplitude self-calibration. Finally, we fitted circular Gaussian brightness distribution model components (Pearson, 1995) directly to the self-calibrated visibility data, to describe the brightness distribution of J14190838 quantitatively.
2.3 WISE infrared data
To address the infrared flux density variability, we collected data from WISE observations performed in the WISE and NEOWISE missions (Wright et al, 2010; Mainzer et al, 2014).
We downloaded data from the NASA/IPAC Infrared Science Archive333https://irsa.ipac.caltech.edu/frontpage/ obtained by the WISE satellite at the position of J14190838 within a search radius of . This resulted in and points within the framework of the original WISE mission (between 2009 December and 2011 February) and the NEOWISE Reactivation Mission (from 2013 December up until the beginning of 2021), respectively. These include measurements in all four bands of the WISE satellite, m (), m (), m (), and m () at the beginning of the mission, and observations taken only at the two shorter wavelengths after the depletion of the cooling material. Following the Explanatory Supplement to the WISE All-Sky Data Release Products444https://wise2.ipac.caltech.edu/docs/release/allsky/expsup/index.html, we flagged those measurements which have lower photometric quality (given in column ph_qual), may be affected by scattered moonlight (denoted in column moon_masked), were obtained when the satellite’s separation from the South-Atlantic Anomaly was (denoted in column saa_sep), or were reported to be extended. Finally, we retained points, more than % of the measurements. We converted the magnitude measurements to flux densities using the appropriate conversion factors in the given band (for a power-law spectrum with an exponent of ) listed in the Explanatory Supplement to the WISE All-Sky Data Release Products.
3 Results and discussion
3.1 Radio spectrum
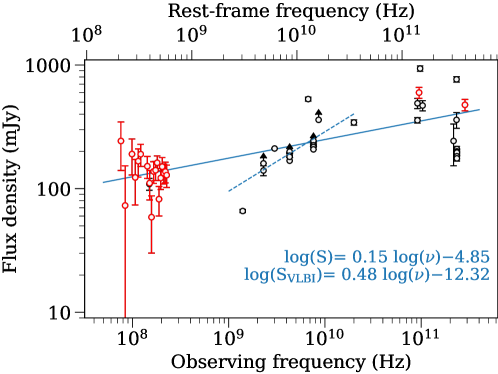
Figure 1 displays the radio spectrum of J14190838 compiled from flux density measurements listed in Table 1. To characterise the spectrum at both large (kpc) and small (pc) scales, we fitted power-law spectra555As there are significant differences in flux density values in the GLEAM catalogue (Hurley-Walker et al, 2017) between adjacent frequency bands observed at the same epoch, we excluded the MWA data points from the spectrum fit, although they are shown in Table 1 and in Fig. 1. We note that the spectral index values determined with and without the MWA data points are in agreement. in the form , where is the flux density, the observing frequency, and the spectral index. The best-fit parameters and spectral slopes for the total and pc-scale compact flux densities are shown in Fig. 1.
With the inclusion of all data points, the quasar shows a flat radio-to-submm spectrum with a spectral index of . The flux densities obtained from the highest-resolution VLBI observations suggest an inverted spectrum, with somewhat steeper slope ().
3.2 Radio flux density variability
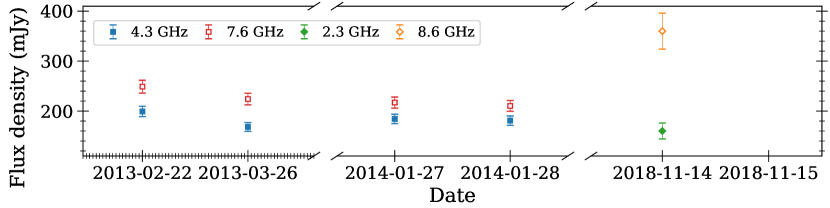
Most of the measurements shown in Fig. 1 are non-simultaneous, and flux density variability with time causes scatter in the spectral plot. Considering flux densities from the high-resolution VLBA observations, the quasar core shows some variability in the flux densities, up to at both frequency bands, on even a monthly timescale (Table 3). There is further evidence when comparing the 2.3-GHz flux densities obtained from observations by the Parkes telescope prior to 2010 and the VLBA in 2018, as the latter shows a increase, despite the better angular resolution where any large-scale extended emission should be resolved out and thus remain undetected. The variability is also apparent from sub-mm observations by the Atacama Large Millimeter/submillimeter Array (ALMA) at , , and GHz frequencies, performed at different epochs. These effects are well presented in the radio-to-submm spectrum (Fig. 1) and the VLBI light curve (Fig. 2).
3.3 Large-scale radio structure
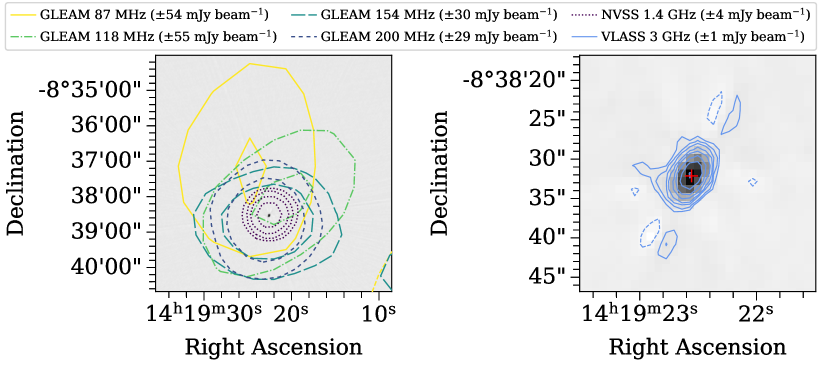
In Fig. 3, we show the large-scale structure of the quasar from observations with the Murchison Widefield Array (MWA) and the Karl G. Jansky Very Large Array (VLA), obtained in the framework of the Galactic and Extra-Galactic All-SKY MWA Survey (GLEAM, Wayth et al, 2015; Hurley-Walker et al, 2017), the NRAO VLA Sky Survey (NVSS, Condon et al, 1998), and the VLA Sky Survey (VLASS, Gordon et al, 2021). The NVSS radio image was obtained using the postage stamp server of NRAO666https://www.cv.nrao.edu/nvss/postage.shtml, while the VLASS and GLEAM image data were obtained from the Canadian Initiative for Radio Astronomy Data Analysis777http://cutouts.cirada.ca/ (CIRADA) cutout service. The position of the quasar is denoted by its VLBI coordinates obtained from Radio Fundamental Catalogue. Contours of the radio maps from observations in the GLEAM and NVSS surveys superposed on the VLASS first-epoch radio image are shown in the left panel. For better visibility, we show the central area of the higher-resolution VLASS radio map in the right panel, along with the accurate VLBI position. The source shows an unresolved, featureless single-component structure at all resolutions and frequencies at kpc scales.
3.4 Inner structure
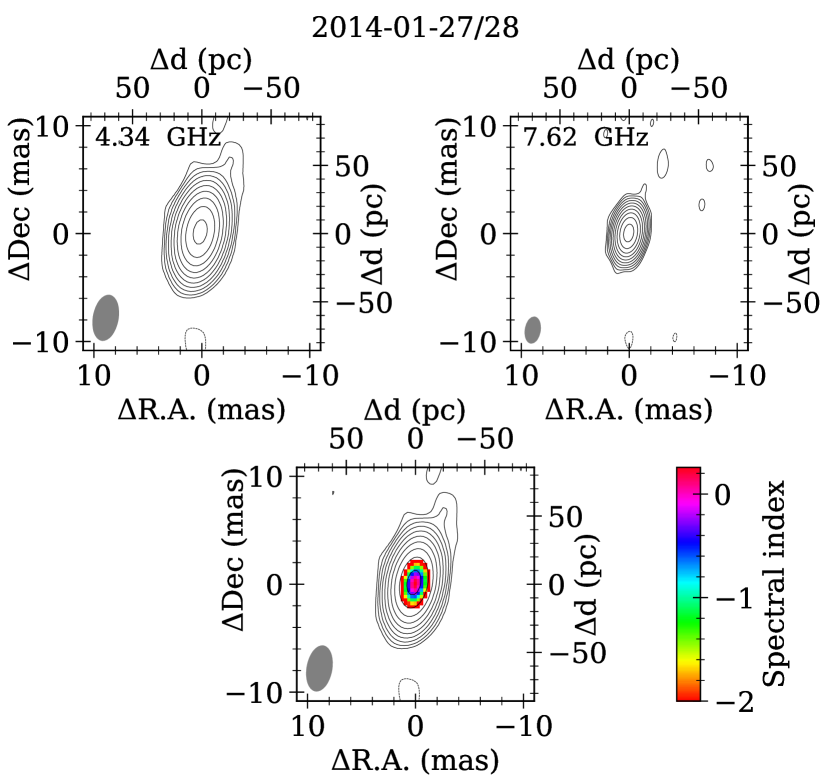
The naturally weighted clean maps of VLBA data sets resulting from the imaging are shown in Fig. 4. Parameters of the maps and the fitted model components, along with the derived physical parameters are listed in Table 3. We calculated errors for the model parameters following Lee et al (2008), with an additional absolute amplitude calibration uncertainty in the flux densities.
We found that the quasar appears as a single-component compact ‘core’ (i.e., the synchrotron self-absorbed base of the jet) at all VLBI epochs, which is further confirmed by the model-fitting results.
For all four available epochs with VLBI observations, the visibility data can be best fitted with a single Gaussian brightness distribution model component (Fig. 4 and Table 3). We calculated the brightness temperature values using the following equation (e.g. Condon et al, 1982):
| (1) |
where is the flux density of the core model component measured in Jy, the component diameter (full width at half-maximum, FWHM) in mas, and the observing frequency expressed in GHz.
Using these measured brightness temperature values that are also given in Table 3, we determined Doppler factors for each epoch as
| (2) |
where the K intrinsic brightness temperature corresponds to the energy state where the radiating particles and the magnetic field are in equipartition (Readhead, 1994). We found that the measured brightness temperatures all exceed the theoretical intrinsic equipartiton value (i.e., ), thus the radio emission of the quasar core shows relativistic Doppler enhancement at the epochs of all VLBI observations (Table 3), with values ranging between and .
Monochromatic radio power values characteristic to the mas-scale radio ‘core’ emission were also calculated using the following expression:
| (3) |
where is the spectral index determined from the VLBA observations. We found that the monochromatic powers are W Hz-1 and W Hz-1 for the 4.3- and 7.6-GHz VLBA observations, respectively. Here we give the mean value of the four observations made at different epochs, stating the uncertainties as standard deviation of the powers at each frequency band.
To assess the compactness of the radio emission region, we can compare the total (arcsec-scale) flux densities with those originating from the mas-scale structure only. Given the time variability and the uncertainties of the individual measurements, the total flux densities (Table 1 and Fig. 1) interpolated to the VLBA observing frequencies (4.3 and 7.6-GHz) are not significantly higher than the values obtained for the mas-scale structure (Table 3). Therefore, we can conclude that the radio emission of J14190838 is dominated by the inner pc-scale structure. In other words, the VLBI observations do not resolve out much of the emission measured by lower-resolution instruments.
3.5 Mid-infrared variability
Prior to the detailed -ray–optical analysis of J14190838 (Buckley et al, 2022), a large optical flare (Lipunov et al, 2015) and a 5-magnitude brightening was reported at for this quasar in 2015 February with the Cananea Near-Infrared Camera of the telescope at the Guillermo Haro Observatory (Carrasco et al, 2015).
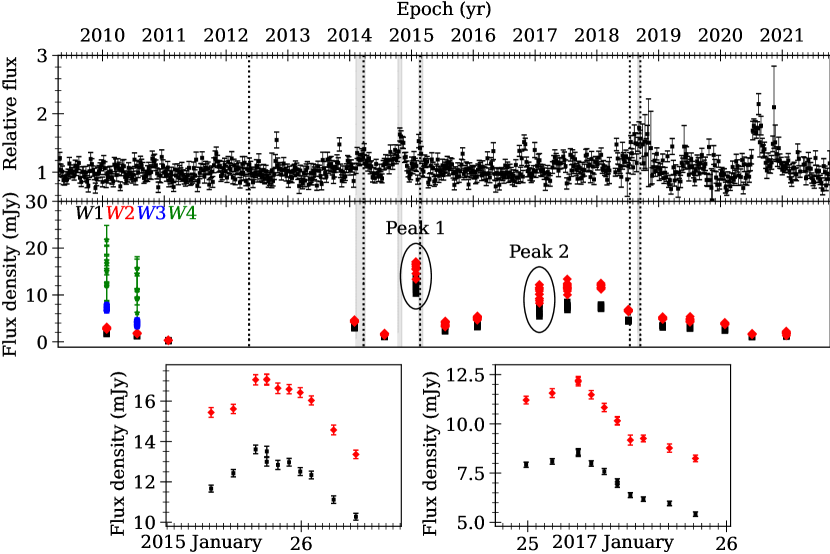
To compare the MIR flux density changes with the -ray and optical flares reported by Buckley et al (2022), we show the 100–800 MeV Fermi-LAT light curve (LCR, Abdollahi et al, 2017; Fermi-LAT Collaboration, 2021) with grey solid and black dotted stripes indicating the aforementioned flaring events in Fig. 5 (upper panel). Although the cadence of the WISE observations is around 3–4 months, a clear long-term variability can be detected in the MIR light curve of the quasar at 3.4 and 4.6 m ( and filters) on a monthly time scale (middle panel in Fig. 5). Moreover, in several WISE epochs, there is a clear intra-day variability pattern during the observations. Two ‘peaking’ events were also identified in 2015 January and 2017 January, with brightening and fading of the flux densities in and . These particular mission phases were chosen for display because they are the ones that show the clearest intra-day variations, also including a peak during the brightness changes. Moreover, as we discuss later, these data highlight that the MIR light curve peaks have no apparent correlation to the -ray and optical flaring events. Apart from the two intra-day peaking events in 2015 and 2017 January, an overall brightening with respect to the quiescent flux density level is apparent at these epochs. Although the third -ray–optical flare (Buckley et al, 2022) occurred within two months of the first MIR brightening episode in 2015, there are no other indications of any correlation/connection between the changes in the -ray–optical and the MIR light curves.
In a sample of more than AGNs, Son et al (2022) found a strong correlation between the variability of the MIR magnitudes and the colour, concluding that the variations are unlikely to originate from the contribution of the host galaxy, but likely to arise from the dusty torus of the AGNs. J14190839 shows a similar trend as the Pearson’s correlation coefficient calculated from the available WISE data between the magnitude and colour is , with . Significant brightness changes within a day, however, cannot be explained with the contribution of the surrounding torus.
The intra-day and monthly magnitude variability, combined with the changes of the optical spectral lines (Buckley et al, 2022) imply similarities between J14190839 and the so-called changing-look AGNs, for which the variations are believed to be induced by the rise in the accretion rate (Sheng et al, 2017). Another possibility is that the variability in the MIR emission is caused by the relativistically boosted radio jet (e.g. Jiang et al, 2012; Yang et al, 2018; Gabányi et al, 2018a, b) which the quasar J14190839 does have.
4 Summary and conclusions
NVSS J141922083830 (J14190838) was previously classified as a flat-spectrum radio quasar, based on its -ray, X-ray, optical, and near-infrared properties. However, no detailed analysis was published about its radio emission. Here we utilised publicly available archival radio data at pc and kpc scales to characterise its radio emission, both quantitatively and qualitatively. The quasar has a single compact mas-scale ‘core’ component at all five VLBI epochs between 2013 and 2018, and shows high measured brightness temperature values that indicate Doppler-enhanced emission from a relativistic jet pointing close to the line of sight. The radio source has indeed a flat (inverted) spectrum. Based on the radio data, we confirm that the quasar belongs to the blazar subclass of FSRQs.
Based on WISE data, we found that the MIR light curve of the quasar shows both short- and long-term variability, most likely connected with AGN phenomena. Neither the intra-day, nor the monthly light variations indicate obvious correlation with the flaring events identified in the optical and -ray light curves.
Acknowledgments This research has made use of the CIRADA cutout service at http://cutouts.cirada.ca, operated by the Canadian Initiative for Radio Astronomy Data Analysis (CIRADA). CIRADA is funded by a grant from the Canada Foundation for Innovation 2017 Innovation Fund (Project 35999), as well as by the Provinces of Ontario, British Columbia, Alberta, Manitoba and Quebec, in collaboration with the National Research Council of Canada, the US National Radio Astronomy Observatory and Australia’s Commonwealth Scientific and Industrial Research Organisation.
VLBA is operated by the National Radio Astronomy Observatory, which is a facility of the National Science Foundation, and operated under cooperative agreement by Associated Universities, Inc. The use of the VLBA under the US Naval Observatory’s time allocation is acknowledged. This work supports USNO’s ongoing research into the celestial reference frame and geodesy. These data were retrieved from the VLBA public archive.
This research has made use of the VizieR catalogue access tool, CDS, Strasbourg, France (DOI: 10.26093/cds/vizier). The original description of the VizieR service was published in Ochsenbein et al (2000).
This scientific work makes use of the Murchison Radio-astronomy Observatory, operated by CSIRO. We acknowledge the Wajarri Yamatji people as the traditional owners of the Observatory site. Support for the operation of the MWA is provided by the Australian Government (NCRIS), under a contract to Curtin University administered by Astronomy Australia Limited. We acknowledge the Pawsey Supercomputing Centre which is supported by the Western Australian and Australian Governments.
This research has made use of material from the Bordeaux VLBI Image Database (BVID). This database can be reached at http://bvid.astrophy.u-bordeaux.fr/.
This publication made use of the Astrogeo VLBI FITS image database (http://astrogeo.org/vlbi_images/) and we thank Leonid Petrov for placing observations online prior to publication.
This publication makes use of data products from the Wide-field Infrared Survey Explorer, which is a joint project of the University of California, Los Angeles, and the Jet Propulsion Laboratory/California Institute of Technology, funded by the National Aeronautics and Space Administration.
Statements and declarations
Funding
This research was supported by the Hungarian National Research, Development and Innovation Office (NKFIH), grant number OTKA K134213.
Declaration of Competing Interest
The authors have no relevant financial or non-financial interests to disclose.
Author contribution
The study conception and methodology was proposed by Sándor Frey. Collection of archival radio data, analysis, data visualisation were done, and the first draft of the manuscript was written by Krisztina Perger. Collection and initial flagging of infrared data were performed by Krisztina É. Gabányi. All authors contributed to the previous versions of the draft, read and approved the content before the submission of the final manuscript.
Data availability
Calibrated VLBI visibility data sets utilised in this work can be obtained from the Astrogeo Image Database (http://astrogeo.org/). Data from the spectral analysis are available from the VizieR catalogue access tool (https://vizier.cds.unistra.fr/). Fermi-LAT data are available in the Fermi LAT Light Curve Repository (https://fermi.gsfc.nasa.gov/ssc/data/access/lat/LightCurveRepository/). Large-scale radio maps can be downloaded from the CIRADA Image Cutout Web Service (http://cutouts.cirada.ca/).
References
- \bibcommenthead
- Abdollahi et al (2017) Abdollahi S, Ackermann M, Ajello M, et al (2017) The Second Catalog of Flaring Gamma-Ray Sources from the Fermi All-sky Variability Analysis. ApJ846(1):34. 10.3847/1538-4357/aa8092, https://arxiv.org/abs/arXiv:1612.03165 [astro-ph.HE]
- Ackermann et al (2015) Ackermann M, Ajello M, Atwood WB, et al (2015) The Third Catalog of Active Galactic Nuclei Detected by the Fermi Large Area Telescope. ApJ810(1):14. 10.1088/0004-637X/810/1/14, https://arxiv.org/abs/arXiv:1501.06054 [astro-ph.HE]
- Ajello et al (2022) Ajello M, Baldini L, Ballet J, et al (2022) The Fourth Catalog of Active Galactic Nuclei Detected by the Fermi Large Area Telescope: Data Release 3. ApJS263(2):24. 10.3847/1538-4365/ac9523, https://arxiv.org/abs/arXiv:2209.12070 [astro-ph.HE]
- Bonato et al (2018) Bonato M, Liuzzo E, Giannetti A, et al (2018) ALMACAL IV: a catalogue of ALMA calibrator continuum observations. MNRAS478(2):1512–1519. 10.1093/mnras/sty1173, https://arxiv.org/abs/arXiv:1805.00024 [astro-ph.GA]
- Buckley et al (2022) Buckley DAH, Britto RJ, Chandra S, et al (2022) A multiwavelength study of the flat-spectrum radio quasar NVSS J141922-083830 covering four flaring episodes. MNRAS517(4):5791–5804. 10.1093/mnras/stac2181, https://arxiv.org/abs/arXiv:2207.14762 [astro-ph.HE]
- Carrasco et al (2015) Carrasco L, Recillas E, Porras A, et al (2015) The ongoing Giant NIR flare of the Blazar candidate NVSSJ141922-083830. The Astronomer’s Telegram 7168:1
- Collioud and Charlot (2009) Collioud A, Charlot P (2009) The Bordeaux VLBI Image Database. In: Bourda G, Charlot P, Collioud A (eds) 19th European VLBI for Geodesy and Astrometry Working Meeting, pp 19–22
- Condon et al (1982) Condon JJ, Condon MA, Gisler G, et al (1982) Strong radio sources in bright spiral galaxies. II. Rapid star formation and galaxy-galaxy interactions. ApJ252:102–124. 10.1086/159538
- Condon et al (1998) Condon JJ, Cotton WD, Greisen EW, et al (1998) The NRAO VLA Sky Survey. AJ115(5):1693–1716. 10.1086/300337
- Fermi-LAT Collaboration (2021) Fermi-LAT Collaboration (2021) 10-year Fermi LAT point source catalog. The Astronomer’s Telegram 15110:1
- Gabányi et al (2018a) Gabányi KÉ, Moór A, Frey S (2018a) Infrared variability of radio-loud narrow-line Seyfert 1 galaxies. In: Revisiting Narrow-Line Seyfert 1 Galaxies and their Place in the Universe, p 42, 10.22323/1.328.0042, 1807.05802
- Gabányi et al (2018b) Gabányi KÉ, Moór A, Frey S (2018b) Mid-infrared Variability of the Neutrino Source Blazar TXS 0506+056. Research Notes of the American Astronomical Society 2(3):130. 10.3847/2515-5172/aad49f, https://arxiv.org/abs/arXiv:1807.07462 [astro-ph.GA]
- Gaia Collaboration et al (2016) Gaia Collaboration, Prusti T, de Bruijne JHJ, et al (2016) The Gaia mission. A&A595:A1. 10.1051/0004-6361/201629272, https://arxiv.org/abs/arXiv:1609.04153 [astro-ph.IM]
- Gaia Collaboration et al (2022) Gaia Collaboration, Vallenari A, Brown AGA, et al (2022) Gaia Data Release 3: Summary of the content and survey properties. arXiv e-prints arXiv:2208.00211. https://arxiv.org/abs/arXiv:2208.00211 [astro-ph.GA]
- Gordon et al (2021) Gordon YA, Boyce MM, O’Dea CP, et al (2021) A Quick Look at the 3 GHz Radio Sky. I. Source Statistics from the Very Large Array Sky Survey. ApJS255(2):30. 10.3847/1538-4365/ac05c0, https://arxiv.org/abs/arXiv:2102.11753 [astro-ph.GA]
- Högbom (1974) Högbom JA (1974) Aperture Synthesis with a Non-Regular Distribution of Interferometer Baselines. A&AS15:417
- Hurley-Walker et al (2017) Hurley-Walker N, Callingham JR, Hancock PJ, et al (2017) GaLactic and Extragalactic All-sky Murchison Widefield Array (GLEAM) survey - I. A low-frequency extragalactic catalogue. MNRAS464(1):1146–1167. 10.1093/mnras/stw2337, https://arxiv.org/abs/arXiv:1610.08318 [astro-ph.GA]
- Intema et al (2017) Intema HT, Jagannathan P, Mooley KP, et al (2017) The GMRT 150 MHz all-sky radio survey. First alternative data release TGSS ADR1. A&A598:A78. 10.1051/0004-6361/201628536, https://arxiv.org/abs/arXiv:1603.04368 [astro-ph.CO]
- Jiang et al (2012) Jiang N, Zhou HY, Ho LC, et al (2012) Rapid Infrared Variability of Three Radio-loud Narrow-line Seyfert 1 Galaxies: A View from the Wide-field Infrared Survey Explorer. ApJ759(2):L31. 10.1088/2041-8205/759/2/L31, https://arxiv.org/abs/arXiv:1210.2800 [astro-ph.HE]
- Lee et al (2008) Lee SS, Lobanov AP, Krichbaum TP, et al (2008) A Global 86 GHz VLBI Survey of Compact Radio Sources. AJ136(1):159–180. 10.1088/0004-6256/136/1/159, https://arxiv.org/abs/arXiv:0803.4035 [astro-ph]
- Lipunov et al (2015) Lipunov V, Gorbovskoy E, Kornilov V, et al (2015) MASTER: very bright blazar flare. The Astronomer’s Telegram 7133:1
- Mainzer et al (2014) Mainzer A, Bauer J, Cutri RM, et al (2014) Initial Performance of the NEOWISE Reactivation Mission. ApJ792(1):30. 10.1088/0004-637X/792/1/30, https://arxiv.org/abs/arXiv:1406.6025 [astro-ph.EP]
- Meyers et al (2017) Meyers BW, Hurley-Walker N, Hancock PJ, et al (2017) A Southern-Sky Total Intensity Source Catalogue at 2.3 GHz from S-Band Polarisation All-Sky Survey Data. PASA34:e013. 10.1017/pasa.2017.5, https://arxiv.org/abs/arXiv:1701.08887 [astro-ph.GA]
- Murphy et al (2010) Murphy T, Sadler EM, Ekers RD, et al (2010) The Australia Telescope 20 GHz Survey: the source catalogue. MNRAS402(4):2403–2423. 10.1111/j.1365-2966.2009.15961.x, https://arxiv.org/abs/arXiv:0911.0002 [astro-ph.GA]
- Ochsenbein et al (2000) Ochsenbein F, Bauer P, Marcout J (2000) The VizieR database of astronomical catalogues. A&AS143:23–32. 10.1051/aas:2000169, https://arxiv.org/abs/arXiv:astro-ph/0002122 [astro-ph]
- Olmo-García et al (2022) Olmo-García A, Paliya VS, Álvarez Crespo N, et al (2022) Optical spectroscopic characterization of Fermi blazar candidates of uncertain type with TNG and DOT: first results. MNRAS516(4):5702–5711. 10.1093/mnras/stac2640, https://arxiv.org/abs/arXiv:2209.06518 [astro-ph.HE]
- Pearson (1995) Pearson TJ (1995) Non-Imaging Data Analysis. In: Zensus JA, Diamond PJ, Napier PJ (eds) Very Long Baseline Interferometry and the VLBA, p 267
- Petrov (2021) Petrov L (2021) The Wide-field VLBA Calibrator Survey: WFCS. AJ161(1):14. 10.3847/1538-3881/abc4e1, https://arxiv.org/abs/arXiv:2008.09243 [astro-ph.IM]
- Petrov et al (2011) Petrov L, Kovalev YY, Fomalont EB, et al (2011) The Very Long Baseline Array Galactic Plane Survey—VGaPS. AJ142(2):35. 10.1088/0004-6256/142/2/35, https://arxiv.org/abs/arXiv:1101.1460 [astro-ph.CO]
- Petrov et al (2015) Petrov L, Natusch T, Weston S, et al (2015) First Scientific VLBI Observations Using New Zealand 30 Meter Radio Telescope WARK30M. PASP127(952):516. 10.1086/681965
- Planck Collaboration et al (2014) Planck Collaboration, Ade PAR, Aghanim N, et al (2014) Planck 2013 results. XXIX. The Planck catalogue of Sunyaev-Zeldovich sources. A&A571:A29. 10.1051/0004-6361/201321523, https://arxiv.org/abs/arXiv:1303.5089 [astro-ph.CO]
- Readhead (1994) Readhead ACS (1994) Equipartition Brightness Temperature and the Inverse Compton Catastrophe. ApJ426:51. 10.1086/174038
- Sheng et al (2017) Sheng Z, Wang T, Jiang N, et al (2017) Mid-infrared Variability of Changing-look AGNs. ApJ846(1):L7. 10.3847/2041-8213/aa85de, https://arxiv.org/abs/arXiv:1707.02686 [astro-ph.GA]
- Shepherd (1997) Shepherd MC (1997) Difmap: an Interactive Program for Synthesis Imaging. In: Hunt G, Payne H (eds) Astronomical Data Analysis Software and Systems VI, p 77
- Son et al (2022) Son S, Kim M, Ho LC (2022) Mid-infrared Variability of Low-redshift Active Galactic Nuclei: Constraints on a Hot Dust Component with a Variable Covering Factor. ApJ927(1):107. 10.3847/1538-4357/ac4dfc, https://arxiv.org/abs/arXiv:2201.09767 [astro-ph.GA]
- Wayth et al (2015) Wayth RB, Lenc E, Bell ME, et al (2015) GLEAM: The GaLactic and Extragalactic All-Sky MWA Survey. PASA32:e025. 10.1017/pasa.2015.26, https://arxiv.org/abs/arXiv:1505.06041 [astro-ph.IM]
- Wright (2006) Wright EL (2006) A Cosmology Calculator for the World Wide Web. PASP118(850):1711–1715. 10.1086/510102, https://arxiv.org/abs/arXiv:astro-ph/0609593 [astro-ph]
- Wright et al (2010) Wright EL, Eisenhardt PRM, Mainzer AK, et al (2010) The Wide-field Infrared Survey Explorer (WISE): Mission Description and Initial On-orbit Performance. AJ140(6):1868–1881. 10.1088/0004-6256/140/6/1868, https://arxiv.org/abs/arXiv:1008.0031 [astro-ph.IM]
- Yang et al (2018) Yang H, Yuan W, Yao S, et al (2018) SDSS J211852.96-073227.5: a new -ray flaring narrow-line Seyfert 1 galaxy. MNRAS477(4):5127–5138. 10.1093/mnras/sty904, https://arxiv.org/abs/arXiv:1801.03963 [astro-ph.HE]
| Freq. | (mJy) | (mJy) | Instrument | Reference | Observation date(s) |
|---|---|---|---|---|---|
| 76 MHz | 243 | 103 | MWA | Hurley-Walker et al (2017) | 2014.03.10 |
| 84 MHz | 73 | 80 | MWA | Hurley-Walker et al (2017) | 2014.03.10 |
| 99 MHz | 190 | 62 | MWA | Hurley-Walker et al (2017) | 2014.03.10 |
| 107 MHz | 123 | 49 | MWA | Hurley-Walker et al (2017) | 2014.03.10 |
| 115 MHz | 167 | 43 | MWA | Hurley-Walker et al (2017) | 2014.03.10 |
| 122 MHz | 190 | 39 | MWA | Hurley-Walker et al (2017) | 2014.03.10 |
| 143 MHz | 152 | 31 | MWA | Hurley-Walker et al (2017) | 2014.03.10 |
| 150 MHz | 109 | 12 | GMRT | Intema et al (2017) | 2011.01.18. |
| 151 MHz | 111 | 30 | MWA | Hurley-Walker et al (2017) | 2014.03.10 |
| 158 MHz | 59 | 29 | MWA | Hurley-Walker et al (2017) | 2014.03.10 |
| 166 MHz | 138 | 27 | MWA | Hurley-Walker et al (2017) | 2014.03.10 |
| 174 MHz | 141 | 25 | MWA | Hurley-Walker et al (2017) | 2014.03.10 |
| 181 MHz | 162 | 22 | MWA | Hurley-Walker et al (2017) | 2014.03.10 |
| 189 MHz | 82 | 22 | MWA | Hurley-Walker et al (2017) | 2014.03.10 |
| 197 MHz | 122 | 23 | MWA | Hurley-Walker et al (2017) | 2014.03.10 |
| 204 MHz | 151 | 27 | MWA | Hurley-Walker et al (2017) | 2014.03.10 |
| 212 MHz | 133 | 24 | MWA | Hurley-Walker et al (2017) | 2014.03.10 |
| 220 MHz | 137 | 26 | MWA | Hurley-Walker et al (2017) | 2014.03.10 |
| 227 MHz | 129 | 26 | MWA | Hurley-Walker et al (2017) | 2014.03.10 |
| 1.4 GHz | 66 | 2 | VLA | Condon et al (1998) | 1993.10.23 |
| 2.3 GHz | 140 | 13 | Parkes | Meyers et al (2017) | 2007.10–2010.01 |
| 2.3 GHz | 160 | 16 | VLBA | Collioud and Charlot (2009) | 2018.11.14 |
| 3 GHz | 211 | 1 | VLASS | Gordon et al (2021) | 2017.12.31 |
| 4.3 GHz | 199 | 10 | VLBA | Petrov (2021), this work | 2013.02.22 |
| 4.3 GHz | 168 | 9 | VLBA | Petrov (2021), this work | 2013.03.26 |
| 4.3 GHz | 185 | 10 | VLBA | Petrov (2021), this work | 2014.01.27 |
| 4.3 GHz | 184 | 12 | VLBA | Petrov (2021), this work | 2014.01.28 |
| 6.7 GHz | 530 | 20 | Warkworth,Hobart,Ceduna | Petrov et al (2015) | 2014.12.01. |
| 7.6 GHz | 249 | 16 | VLBA | Petrov (2021), this work | 2013.02.22 |
| 7.6 GHz | 224 | 12 | VLBA | Petrov (2021), this work | 2013.03.26 |
| 7.6 GHz | 217 | 11 | VLBA | Petrov (2021), this work | 2014.01.27 |
| 7.6 GHz | 210 | 13 | VLBA | Petrov (2021), this work | 2014.01.28 |
| 8.6 GHz | 360 | 36 | VLBA | Collioud and Charlot (2009) | 2018.11.14 |
| 20 GHz | 343 | 17 | ATCA | Murphy et al (2010) | 2007.10.26–30 |
| 92 GHz | 490 | 47 | ALMA | Bonato et al (2018) | 2015.12.26 |
| 92 GHz | 357 | 18 | ALMA | Bonato et al (2018) | 2017.12.20 |
| 95 GHz | 598 | 60 | ALMA | Bonato et al (2018) | 2015.02.20 |
| 98 GHz | 937 | 47 | ALMA | Bonato et al (2018) | 2017.08.16 |
| 104 GHz | 470 | 45 | ALMA | Bonato et al (2018) | 2015.12.26 |
| 143 GHz | 243 | 90 | Planck | Planck Collaboration et al (2014) | 2009.08.2–2013.10.23 |
| 233 GHz | 360 | 52 | ALMA | Bonato et al (2018) | 2015.12.26 |
| 233 GHz | 766 | 38 | ALMA | Bonato et al (2018) | 2017.07.02 |
| 235 GHz | 176 | 9 | ALMA | Bonato et al (2018) | 2016.04.10 |
| 235 GHz | 183 | 9 | ALMA | Bonato et al (2018) | 2016.04.11 |
| 235 GHz | 196 | 10 | ALMA | Bonato et al (2018) | 2016.04.13 |
| 235 GHz | 196 | 10 | ALMA | Bonato et al (2018) | 2016.04.24 |
| 235 GHz | 200 | 10 | ALMA | Bonato et al (2018) | 2016.04.24 |
| 235 GHz | 209 | 11 | ALMA | Bonato et al (2018) | 2016.05.01 |
| 285 GHz | 476 | 50 | ALMA | Bonato et al (2018) | 2015.02.20 |
Notes: Col. 1 – observing frequency, Col. 2 – flux density in mJy, Col. 3 – flux density formal error in mJy, Col. 4 – telescope or array name; MWA – Murchison Widefield Array, GMRT – Giant Metrewave Radio Telescope, VLA – Very Large Array, Parkes – Parkes radio telescope, VLBA – Very Long Baseline Array, WHC – Warkworth–Hobart–Ceduna array, ALMA – Atacama Large Millimeter/submillimeter Array, Planck – Planck space telescope, Col. 5 – reference, Col. 6 – observation date(s)
| Epoch | Project | On-source time (s) | Participating VLBA stations |
|---|---|---|---|
| 2013.02.22. | BP171a3 | 39 | FD, HN, KP, NL, OV, SC |
| 2013.03.26. | BP171a5 | 49 | BR, FD, HN, KP, LA, MK, NL, OV, PT, SC |
| 2014.01.27. | BP177b | 179 | FD, HN, LA, MK, NL, OV, PT, SC |
| 2014.01.28. | BP177c | 160 | FD, HN, LA, MK, NL, OV, PT, SC |
Notes: Station codes: BR – Brewster, FD – Fort Davis, HN – Hancock, KP – Kitt Peak, LA – Los Alamos, MK – Mauna Kea, NL – North Liberty, OV – Owens Valley, PT – Pie Town, SC – Saint Croix
| Epoch | rms | |||||||||
|---|---|---|---|---|---|---|---|---|---|---|
| (GHz) | (mJy beam-1) | (mJy beam-1) | (mJy) | (mas) | (mas) | (mas) | (∘) | (K) | ||
| 2013.02.22. | 4.34 | 0.2 | 193.26.2 | 199.210.4 | 0.430.01 | 1.8 | 5.2 | 10.3 | 1.30.2 | 2.6 |
| 7.62 | 0.2 | 242.26.7 | 249.015.7 | 0.230.01 | 1.0 | 2.8 | 11.8 | 1.90.2 | 3.8 | |
| 2013.03.26. | 4.36 | 0.2 | 166.65.8 | 168.28.8 | 1.7 | 4.4 | .4 | 4.30.6 | 8.6 | |
| 7.64 | 0.2 | 220.06.4 | 224.011.6 | 1.0 | 2.5 | 3.20.3 | 6.3 | |||
| 2014.01.27. | 4.34 | 0.1 | 182.14.3 | 184.89.5 | 1.7 | 4.1 | 4.00.4 | 8.0 | ||
| 7.62 | 0.1 | 213.14.6 | 217.011.1 | 1.0 | 2.4 | 3.00.3 | 5.9 | |||
| 2014.01.28. | 4.34 | 0.1 | 180.34.8 | 184.211.7 | 1.7 | 4.1 | 4.10.4 | 8.1 | ||
| 7.62 | 0.1 | 206.05.2 | 210.212.8 | 1.0 | 2.3 | 2.50.3 | 5.0 | |||
| 2014.01. | 4.34 | 0.1 | 181.64.2 | 183.011.0 | 2.2 | 4.2 | 3.90.4 | 7.8 | ||
| combined | 7.62 | 0.1 | 209.94.5 | 213.212.4 | 1.3 | 2.4 | 2.10.2 | 4.1 |
Notes: Col. 1 – observation epoch, Col. 2 – observing frequency, Col. 3 – rms noise of the image, Col. 4 – peak intensity, Col. 5 – flux density, Col. 6 – size (FWHM) of the fitted circular Gaussian model component, Col. 7 – minor axis of the elliptical Gaussian restoring beam, Col. 8 – major axis of the restoring beam, Col. 9 – position angle of the restoring beam major axis measured from north through east, Col. 10 – brightness temperature, Col. 11 – equipartition Doppler factor (Readhead, 1994).