Infrared variability of radio-loud narrow-line Seyfert 1 galaxies
Abstract:
Most of the radio-loud narrow-line Seyfert 1 (NLS1) galaxies resemble compact steep-spectrum sources. However, the extremely radio-loud ones show blazar-like characteristics, like flat radio spectra, compact radio cores, substantial variability and high brightness temperatures. These objects are thought to be similar to blazars as they possess relativistic jets seen at small angle to the line of sight. This claim has been further supported by the Fermi satellite discovery of gamma-ray emission from a handful of these sources. Using the Wide-Field Infrared Survey Explorer (WISE) data, we analyzed the mid-infrared variability characteristics of radio-loud NLS1 at and m. We found that out of the studied sources showed variability in at least one of the two infrared bands. In some cases, significant changes in the infrared colors can alter the location of the source in the WISE color–color diagram which might lead to different classification. More than % of the variable sources also showed variability within a day interval. Such short time scales argue for a compact emission region like those associated with the jets. This connection is further strengthened by the fact that the brightest -ray emitters of the sample ( sources), all showed short time scale infrared variability.
1 Introduction
Narrow-line Seyfert 1 galaxies (NLS1), a subclass of active galactic nuclei (AGN) are thought to contain a relatively low-mass central black hole (, [1]) and accrete at high rates [2]. The fraction of radio-loud ones among NLS1 sources is % similar to that of the whole AGN population [3]. The extremely radio-loud ones (% of the NLS1 sources [3]) show blazar-like characteristics, like flat radio spectra, compact radio cores, substantial variability and high brightness temperatures. Caccianiga et al. [4] studied the mid-infrared characteristics of radio-loud NLS1 sources with blazar-like characteristics and found that the radio and mid-infrared properties can be explained by the mixture of different components: the relativistic jets, star formation in the host galaxy, and the dusty torus. Using the available Wide-Field Infrared Survey Explorer (WISE, [5]) satellite data, we investigated the variability characteristics of these sources in the mid-infrared bands.
2 Analysis of WISE data
The WISE [5] satellite scanned the whole sky at four infrared (IR) bands, at , , , and m (referred as W1, W2, W3, and W4) during 2010. After the end of the WISE mission, the survey has continued in the framework of the NEOWISE (Near-Earth Object WISE) project [6] after September 2010 first for four months. After months of hibernation of the satellite, the NEOWISE Reactivation Mission continued. Along its mission, WISE observed the same regions of the sky every days. Therefore, during the original mission, each source was observed in two mission phases. After the approximately 3-year hibernation gap, another to epochs are added in the NEOWISE mission. However, because of the depleted cooling material, the W3 and W4 detectors could not be used any more. NEOWISE only makes measurements at the two shortest wavelength bands (W1 and W2). Moreover, not all sources have the same coverage. Due to the scanning strategy, the number of frames covering a given source depends on its ecliptic coordinates. The closer an object to the ecliptic poles, the more frames of it are obtained. Therefore, the numbers of frames within each mission phase are different for different objects.
We downloaded up to 2016 the WISE single exposure data111http://irsa.ipac.caltech.edu/Missions/wise.html of the radio-loud NLS1 sources from Caccianiga et al. [4]. We discarded bad quality data following the descriptions in the Exploratory Supplement Series222http://wise2.ipac.caltech.edu/docs/release/allwise/expsup/sec3_2.html. We obtained light curves in the W1 and W2 bands for all sources. For most of the sources, there are light curves from mission phases. For and sources, there are light curves from and mission phases, respectively. Within each mission phase, the individual measurements of the sources provide short-term light curves with a length day, and with measurements in every h. In several mission phases, days long gaps occur as well (see an example in Fig. 2). In the other two bands, most of the sources were observed only in the first mission phase, sources have measurements in the W3 and W4 from the first two mission phases. In general the signal-to-noise ratios are lower and the sources are fainter in W3 and especially in W4. There were and sources with less than three measurement points in bands W3 and W4, respectively.
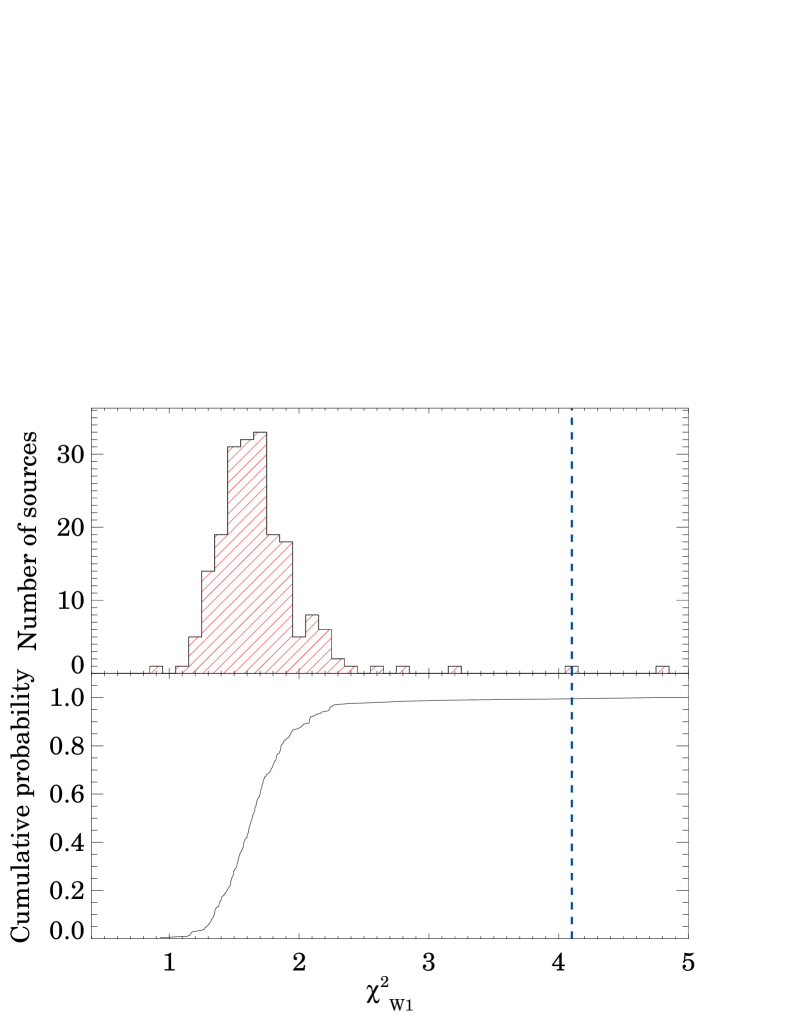
To determine the variability characteristics of the sources in W1 and W2, we calculated the Stetson index [7] and after converting the magnitudes to flux densities [5] the reduced () values. We considered a source variable if its Stetson index is larger than . In all such sources the calculated values in both bands were larger than , which also strongly supports the variability claim in these cases. The Stetson index is more sensitive to the correlated variations measured simultaneously at two bands. Therefore, we also critically examined those objects for which the Stetson index was lower, between and . In all of these objects the values exceeded in at least one of the bands. We then downloaded WISE data of the nearest objects with similar brightness in W1 and W2 and calculated their values. Based upon the obtained histograms and cumulative distributions (see an example in Fig. 2), we deemed a source variable if its in a given band was larger than % of those of the neighbouring sources.

To characterise the strength of variability, we calculated the modulation indices for the variable sources. The modulation index is defined as , where is the standard deviation of the measured flux density and is the average flux density. To study short time scale variability, we also calculated for each mission phase separately.
Due to the lower signal-to-noise ratios and shorter time baselines, we did not perform such detailed variability analysis in bands W3 and W4. We calculated the for sources having more measurement points than .
3 Results
Most of the sources, out of the (%) showed variability in at least one of the IR bands of m and m; of them were variable in both bands, sources showed variability in only one of the bands, in W1 and in W2 only. All the sources in the list that have been detected in -rays by the Fermi satellite (reported in [12], [13], [14], and [15]) showed IR variability. Most of them both in band W1 and band W2. Two sources, J11022239 and J12460238, showed variability in one band only, in W2 and W1, respectively. These two sources were the faintest -ray emitter NLS1 objects among those discovered by [15].
In the other two bands, only one source showed possible variability, J09480022 had a larger than 3 in band W3.
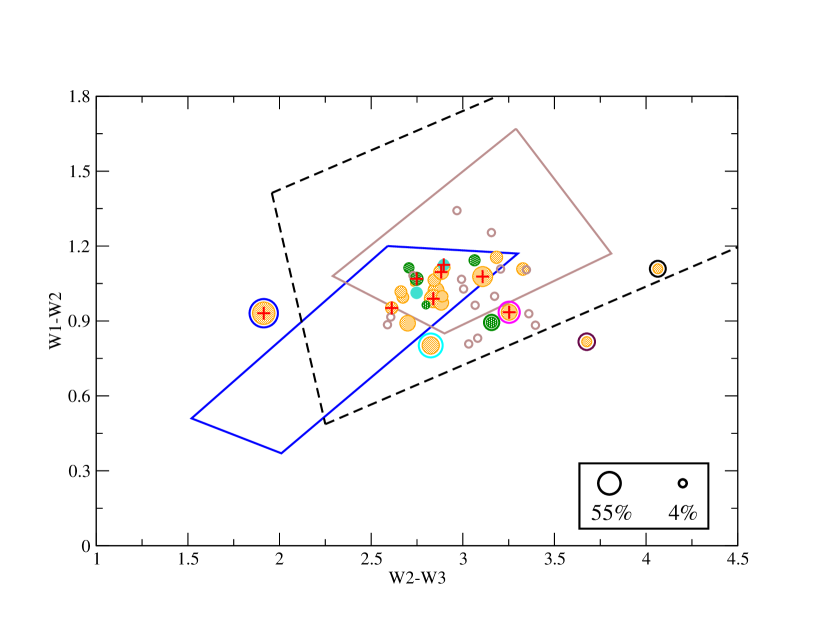
In the left panel of Fig. 3, we plot the WISE color–color diagram of the radio-loud NLS1 sources also indicating their variability behaviour. The colors were calculated using the photometric values given in the AllWISE catalog [11]. Filled symbols are the variable objects, the symbol sizes are scaled with the logarithm of modulation indices. We overplotted the AGN wedge (defined by [10], dashed line) and the ‘WISE Gamma-ray strip’ (WGS, defined by [8] and [9]) for flat-spectrum quasars (brown line) and for BL Lac objects (blue line). The fraction of variable sources in those which fall outside of the WGS is similar (%) to that of the whole sample.
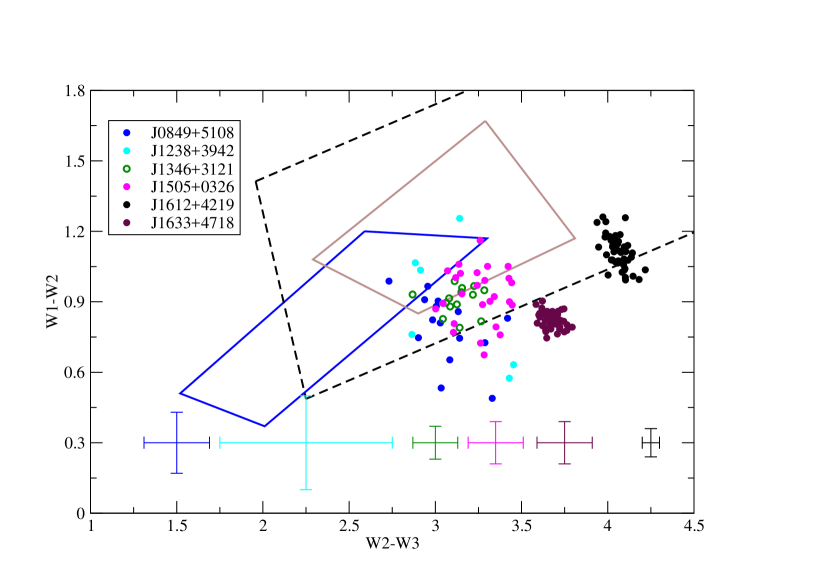
To investigate whether variability can explain the positions of these sources in the color–color plot, we calculated their colors using simultaneous measurements from the original WISE mission data taken in 2011. The mean errors for each plotted sources are shown at the bottom of the plot. In all sources but J16334718 significant change in at least one of the colors can be seen. J12383942 is the faintest among the sources in band W3 causing it to have the largest uncertainty in the W2W3 color. It can be seen from the right panel of Fig. 3 that variability can change the positions of sources significantly on the color–color diagram and such sources can easily wander in (and out of) the WGS or even the AGN wedge. The best example is J08495108, which is horizontally offset from all sources in the original WISE color–color plot (left panel), in sharp contrast with its locations in the right panel (blue dots) when using simultaneous measurements. There are two sources which remain within a well-defined small region in the color–color plot, J16124219 and J16334718. In both of them, the WISE measured IR emission can be influenced by star formation. J16334718 is an AGN and a starburst galaxy separated by [16]. These two objects cannot be resolved by WISE. According to the emission line study of Shirazi & Brinchmann [17], both J16124219 and J16334718 are composite objects, in which the ionizing radiation originates from star formation and AGN.
Most of the variable sources, out of , showed also variability at least in one band, when we checked each mission phase separately. We also detected short time scale variability in the sources (J08495180 and J09480022) previously reported by Jiang et al. [18] having intraday IR variability. We also detected short time scale variations in the third source, J15050526, studied by Jiang et al. [18], occurring in a later mission phase after the publication of [18]. The most pronounced short time scale flux density changes are produced by J09480021, showing variations in every major epochs at both bands with modulation indices as high as %. All the -ray emitters except for the two faintest in -rays (J11022239 and J12460238) showed intraday IR variability. The light curve of J16442619, one of the -ray detected NLS1 is shown on Fig. 2. The blazar nature of these sources is also supported by various very long baseline interferometric observations in the radio (e.g. [19]).
4 Summary
Using the WISE mission data we investigated IR variability in a sample of radio-loud NLS1 sources. More than % of the sources showed variability at or m. Color variations can significantly influence the location of some sources in the WISE color–color diagnostic plot and may therefore influence their classification.
Intraday variability in at least one of the IR bands of or m can be detected in % of the variable sources. As described by Jiang et al. [18], such short variability time scales imply a small size for the emitting region which is thus hard to reconcile with variations in the dusty torus. More probable explanation is that the IR emission is non-thermal and it originates from the jet. This scenario is further supported by the fact that the known bright -ray emitter NLS1 sources in the sample all showed intraday IR variability.
References
- [1] S. Mathur, Narrow-line Seyfert 1 galaxies and the evolution of galaxies and active galaxies, MNRAS 314 (2000) L17 [astro-ph/0003111].
- [2] S. Collin and T. Kawaguchi, Super-Eddington accretion rates in Narrow Line Seyfert 1 galaxies, A&A 426 (2004) 797 [astro-ph/0407181].
- [3] S. Komossa, W. Voges, D. Xu, S. Mathur, H.-M. Adorf, G. Lemson et al., Radio-loud Narrow-Line Type 1 Quasars, AJ 132 (2006) 531 [astro-ph/0603680].
- [4] A. Caccianiga, S. Antón, L. Ballo, L. Foschini, T. Maccacaro, R. Della Ceca et al., WISE colours and star formation in the host galaxies of radio-loud narrow-line Seyfert 1, MNRAS 451 (2015) 1795 [1504.07068].
- [5] E. L. Wright, P. R. M. Eisenhardt, A. K. Mainzer, M. E. Ressler, R. M. Cutri, T. Jarrett et al., The Wide-field Infrared Survey Explorer (WISE): Mission Description and Initial On-orbit Performance, AJ 140 (2010) 1868 [1008.0031].
- [6] A. Mainzer, J. Bauer, R. M. Cutri, T. Grav, J. Masiero, R. Beck et al., Initial Performance of the NEOWISE Reactivation Mission, ApJ 792 (2014) 30 [1406.6025].
- [7] P. B. Stetson, On the Automatic Determination of Light-Curve Parameters for Cepheid Variables, PASP 108 (1996) 851.
- [8] R. D’Abrusco, F. Massaro, M. Ajello, J. E. Grindlay, H. A. Smith and G. Tosti, Infrared Colors of the Gamma-Ray-detected Blazars, ApJ 748 (2012) 68 [1203.0568].
- [9] F. Massaro, R. D’Abrusco, G. Tosti, M. Ajello, D. Gasparrini, J. E. Grindlay et al., The WISE Gamma-Ray Strip Parameterization: The Nature of the Gamma-Ray Active Galactic Nuclei of Uncertain Type, ApJ 750 (2012) 138 [1203.1330].
- [10] S. Mateos, A. Alonso-Herrero, F. J. Carrera, A. Blain, M. G. Watson, X. Barcons et al., Using the Bright Ultrahard XMM-Newton survey to define an IR selection of luminous AGN based on WISE colours, MNRAS 426 (2012) 3271 [1208.2530].
- [11] R. M. Cutri and et al., VizieR Online Data Catalog: WISE All-Sky Data Release (Cutri+ 2012), VizieR Online Data Catalog 2311 (2012) .
- [12] F. Acero, M. Ackermann, M. Ajello, A. Albert, W. B. Atwood, M. Axelsson et al., Fermi Large Area Telescope Third Source Catalog, The Astrophysical Journal Supplement Series 218 (2015) 23 [1501.02003].
- [13] A. A. Abdo, M. Ackermann, M. Ajello, A. Allafort, E. Antolini, W. B. Atwood et al., The First Catalog of Active Galactic Nuclei Detected by the Fermi Large Area Telescope, ApJ 715 (2010) 429 [1002.0150].
- [14] F. D’Ammando, M. Orienti, J. Larsson and M. Giroletti, The first -ray detection of the narrow-line Seyfert 1 FBQS J1644+2619, MNRAS 452 (2015) 520 [1503.08226].
- [15] L. Foschini, Evidence of powerful relativistic jets in narrow-line Seyfert 1 galaxies, in Narrow-Line Seyfert 1 Galaxies and their Place in the Universe, p. 24, 2011, 1105.0772.
- [16] W. Yuan, B. F. Liu, H. Zhou and T. G. Wang, X-ray Observational Signature of a Black Hole Accretion Disk in an Active Galactic Nucleus RX J1633+4718, ApJ 723 (2010) 508 [1009.2808].
- [17] M. Shirazi and J. Brinchmann, Strongly star forming galaxies in the local Universe with nebular He II4686 emission, MNRAS 421 (2012) 1043 [1201.1290].
- [18] N. Jiang, H.-Y. Zhou, L. C. Ho, W. Yuan, T.-G. Wang, X.-B. Dong et al., Rapid Infrared Variability of Three Radio-loud Narrow-line Seyfert 1 Galaxies: A View from the Wide-field Infrared Survey Explorer, ApJL 759 (2012) L31 [1210.2800].
- [19] M. L. Lister, M. F. Aller, H. D. Aller, D. C. Homan, K. I. Kellermann, Y. Y. Kovalev et al., MOJAVE: XIII. Parsec-scale AGN Jet Kinematics Analysis Based on 19 years of VLBA Observations at 15 GHz, AJ 152 (2016) 12 [1603.03882].