Multi-Criteria Decision Analysis for Aiding Glyph Design
Abstract
Glyph-based visualization is one of the main techniques for visualizing complex multivariate data. With small glyphs, data variables are typically encoded with relatively low visual and perceptual precision. Glyph designers have to contemplate the trade-offs in allocating visual channels when there is a large number of data variables. While there are many successful glyph designs in the literature, there is not yet a systematic method for assisting visualization designers to evaluate different design options that feature different types of trade-offs. In this paper, we present an evaluation scheme based on the multi-criteria decision analysis (MCDA) methodology. The scheme provides designers with a structured way to consider their glyph designs from a range of perspectives, while rendering a semi-quantitative template for evaluating different design options. In addition, this work provides guideposts for future empirical research to obtain more quantitative measurements that can be used in MCDA-aided glyph design processes.
1 Introduction
Glyph-based visualization is a family of widely used techniques, which are often integrated with other families of visualization techniques, such as small multiples in geo-spatial visualization, multivariate vertices in network visualization, directional and multivariate feature depiction in volume, vector, and tensor field visualization, and dynamic characteristics of objects in event and video visualization. While there have been proposals and discourses on desirable properties of glyph designs in the literature (e.g., [Ber11, MRSS∗12, BKC∗13, CAB∗16]), it is not yet a coherent methodology that visualization designers can use, consistently and methodically, in evaluating different design options in a process for designing and developing a visualization solution.
In glyph design processes, a designer may face many challenges (e.g., knowledge about the data, users, tasks, cognitive theories and experimental findings related to glyph-based visualization, and so on). This work focuses on one particular challenge, that is, there are many desirable properties of glyph designs, and likely a good design does not necessarily meet all criteria as one might desire, but embodies a relatively optimized set of trade-offs among the visual representations of different variables. In particular, we propose a methodology for evaluating different design options based on multiple-criteria decision analysis (MCDA) [IN13, AAK20], which is an established and widely adopted methodology in management science for evaluating multiple complementary and conflicting criteria explicitly in decision making. Its applications include business, governance, medicine, and engineering.
The proposed methodology aims to introduce MCDA to glyph design as a systematic and cost-effective methodology and to bring together different desirable properties proposed in the literature into a typology of rateable criteria. Much attention has been paid to (1) providing a good coverage of all proposed criteria for static glyph designs, (2) defining each criterion to facilitate clear interpretation and unambiguous ratings, (3) minimizing the overlapping among different criteria, (4) enabling distinct considerations of conflicting criteria, and (5) recommending a weighted scoring mechanism that balances between overview vs. detail and precision vs. cost.
The proposed methodology is expected to be improved through the experience gained in its uses in practice as well as new findings in theoretical and empirical research. Furthermore, the proposed methodology is not a replacement for user-centered requirements analysis and evaluation, but it can complement, strength, and reduce the frequencies of user-centered studies in individual design processes. We will discuss these further in Section 6.
2 Related Work
Glyph visualization has been applied in many fields, such as biology, biomedical and medical research [MRSS∗12, SVUK∗19, MRZH14, MVB∗17, RCMA∗18, LHL17, KGM∗22, KSZS21, OHG∗08, MSSD∗08], meteorology and environmental studies [MSM∗08, PW13, PMR21, DBS∗11, SZD∗10], human behavioral analysis [EAGA∗16, KWS∗20], web and database searching [Cha11, SCP14], sports [LMWC16, PYHZ14, WWC∗21, WLG∗21, CF13, PLC∗11], music and multimedia [CQM09, Lin22, JBMC10, BBS∗08], and business and industrial applications [RLB∗20, Sur05, SOSG08]. A glyph object conveys multi-dimensional data in a concise way, which significantly reduces the perceptual and cognitive load for information comprehension. It has been widely adopted in applications that require a simultaneous view of multiple variables, including the facilitation of visual search [HE99, CLZZ15], data comparison [VP04, ZSL∗15, MVB∗17, KMJF22], data ordering [CAB∗16, MZFB19], and feature extraction [KKG∗17]. Glyphs have also been used in combination with spatial or temporal displays [TSWS05, RSMS∗07, DBS∗11, BH17, LCP∗12] and other visualization methods [LHL17, KKG∗20, FJ20, BARM∗12]. Algorithms for glyph placement [War02, LKH09, SF18, RLB∗20, TLS16, ML19, HSH07] and three-dimensional display [LKH09, TLS16, SBW16] were created to ensure effective presentation of glyph objects. Some studies developed techniques for specialized scenarios or requirements, such as temporal summarization [DTW∗15, EAGA∗16, GRT17, TSWS05, BBS∗08], uncertainty depiction [AMTB05, SZD∗10, RWG∗12, HLNW11, WPL96], visualizing data with special structure or inter-relations [RLB∗20, DS13, CCB13, LCM21, SML∗20, CGSQ11, RPC19, KGM∗22], and display of trends and gradients of vectors and tensor fields [Dov95, WPL96, SK10, TZJ∗16, MVB∗17, ZSL∗15, GRT16, GRT17, HNKS19, PPvA∗09, PGL∗11, HYW03, HLNW11]. The recent appearance of accessible tools for glyph generation [RAEM94, XHRC∗18, BKH21, YSD∗22, CPMM18] should lead to a broader application of this visualization technique.
With the seemingly endless design space and the wide variety of applications, guidance is required for glyph designers to evaluate and make selections among different designs. The development of a comprehensive list of criteria that allows systematic evaluations of glyph designs could provide designers with a framework to create designs of quality and to compare design options. The most common and straightforward evaluation is done via user studies [AMTB05, Sur05, WT05, CQM09, Cha11, SCP14, DS13]. A systematic review conducted by Fuchs et al.[FIBK16] revealed that users’ accuracy scores and task completion times are the most widely adopted measures to evaluate the effectiveness of visualisations. These measurements provide reliable statistical evidence for the evaluation; however, there are limitations. Firstly, it takes significant time and effort to design and carry out studies of users. This is especially true when multiple design options and objectives exist. Secondly, the performance outcomes are often the collective effect of various design factors, and they provide few indications of specific changes which could be made to improve the design.
Normative rating is another way to evaluate visualizations, in which design qualities can be individually quantified. Subjective rating is commonly used in user studies to gauge design qualities from user experiences [LRB03, AMTB05, Sur05, FFM∗13]. McDougall et al. [MDBC00] adopted subjective ratings to characterize cognitive features of icon designs and used the ratings in further analyses to investigate the correlations between the qualities. However, in most cases, the subjective rating is performed without a clear definition of each rating level. The only instruction given was how the two ends of the scale map to the extremities of the target quality, e.g. 1=very unfamiliar; 5=very familiar. The boundaries between the rating levels remained flexible to the raters. This casts doubts about the consistency of the scoring standards. It has also been shown that the users’ preferences are not always consistent with the results from the statistical evidence [FIBK16].
Attempts have been made to develop standardized measures for qualities of glyph visualization. Garcia et al. [GBS94] proposed a metric to evaluate glyph complexity. Forsythe et al. [FSS03] proposed an automatic complexity measuring algorithm, aiming to remove subjective elements from the evaluation of complexity and to prevent judgment bias. Up to now, however, the number of standardized measures of visual design qualities remains very limited.
Fortunately, there have been abundant glyph design guidelines proposed in the literature. The guidelines concern various levels of glyph design: variable encoding, inter-channel interaction, and holistic glyph design. At the variable encoding level, Bertin [BBWoWP83] proposed basic semantic criteria for determining the suitability of channel encoding. Cleveland and McGill [CM84] identified the accuracy of human perception in various visual variables and gave recommendations on the choices of visual channels for different tasks and purposes of visualization. Other considerations include the capacity, orderability, semantic closeness, visual pre-attentiveness, robustness, and normalizability of the channels [LKH09, LCP∗12, ROP11, War08, CLP∗15, You01]. At the levels of inter-channel interactions and holistic glyph design, guidelines were proposed for the integration and separability of channels, the balance of attention, searchability, visual hierarchy, and the learnability of glyph designs [KG07, MRSS∗12, LKH09, CLP∗15]. Beyond the design for the glyph object per se, advice was provided for the stages of data-mapping and glyph rendering [RSMS∗07, War08, MSSD∗08, RP08, LKH09, ROP11]. A survey conducted by Borgo et al. [BKC∗13] collected glyph design guidelines and criteria from a wide range of previous studies. Consulting the three-stage glyph design framework by Lie et al. [LKH09] and the perceptual-based glyph taxonomy by Ropinski et al. [RP08, ROP11], a set of fourteen design guidelines that aimed to provide comprehensive coverage of glyph-based visualization was proposed.
More recent studies[MRSS∗12, CLP∗15, BKC∗13] have integrated guidelines from various previous studies, and consensus on some universal design criteria has started to form. With further development, a normative set of evaluation criteria might be expected to emerge through a process of collecting and comparing existing guidelines and selecting, modifying, or creating definitions of criteria to make them generally applicable to a vast range of glyph applications and data types. To make the criteria set succinct and equally weighted amongst different design aspects, higher orthogonality must be considered. Ideally, to make the evaluations consistent amongst raters, standards should be defined for each and every level of the evaluation criteria.
3 Overview, Terminology, and Design Considerations
In this work, we adopt the narrow definition of glyph given by Borgo et al. [BKC∗13], i.e., “a glyph is a small independent visual object that depicts attributes of a data record; glyphs are discretely placed in a display space; and glyphs are a type of visual sign but differ from other types of signs such as icons, indices and symbols.” We focus only on 2D glyphs. Consider a multivariate data record for storing the values of variables, , and a glyph for encoding such a record using visual channels . Since each data variable can be encoded using multiple visual channels, we have .
Multiple-criteria decision analysis (MCDA) [IN13, AAK20] can be viewed as a tree-based scoring system, where the score of each node is a weighted average of the scores at its child-nodes. Here an unweighted average is considered as a special case. There are a few high-level design considerations, e.g., do we decompose the holistic assessment into the assessments of data variables or visual channels and how detailed should we carry out the assessment?
Design Consideration 1. Data Variables vs Visual Channels. As mentioned in Section 2, a number of criteria for glyph design have been proposed in the literature [Ber11, MRSS∗12, BKC∗13, CAB∗16]. Some criteria are defined for accessing visual channels (e.g., channel capacity [CAB∗16], while others are applicable to data variable (e.g., metaphoric representation [MRSS∗12]). When one assumes a 1-to-1 mapping between a data variable and a visual channel, evaluating a data variable implicitly implies the evaluation of the corresponding visual channel, and vice versa. However, when a data variable is encoded using multiple visual channels, assessing individual channels independently may not inform their combined effect on perception and interpretation of the data variable concerned. Hence the propose the scheme places an emphasis on data variables.
Design Consideration 2. Hierarchy of MCDA Evaluation. There are potentially more, if such criteria are combined or finely decomposed in evaluation. Some criteria may be applicable to each data variable or visual channel (e.g., Bertin’s criteria [Ber11]), while others may involve assessing a group of data variables (e.g., separability [CAB∗16]), or a whole glyph (e.g., attention balance [CAB∗16]). There are four types of basic assessment modes:
- Type A.
-
A criterion is for evaluating the visual encoding of a data variable independently. Given data variables, there are assessments for each Type A criterion.
- Type B.
-
A criterion is for evaluating how the encoding of a data variable is affected by the encoding of another . Given variables, there are potentially assessments as the impact of on may not be the same as the impact of on .
- Type C.
-
A criterion is for evaluating how the encoding of a data variable is affected by that of all others, i.e., . There are assessments for variables.
- Type D.
-
A criterion is for evaluating the whole glyph holistically. There is one assessment per glyph for each Type D criterion.
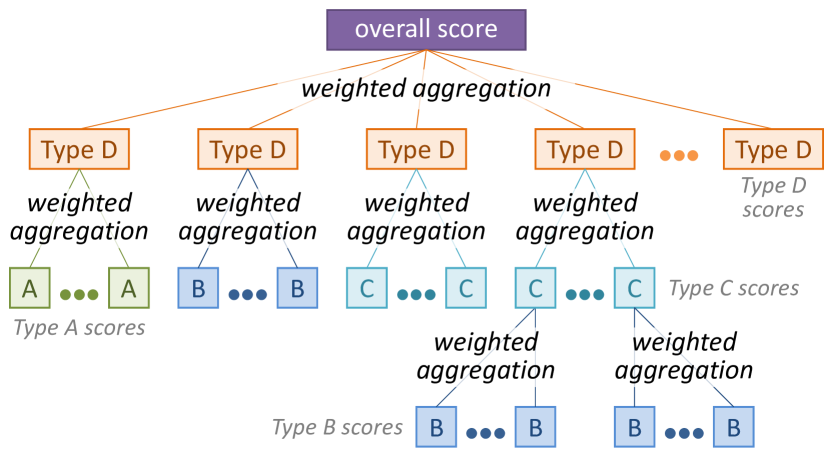
As illustrated in Figure 1, the score of a high-level criterion (e.g., Type D) can often be obtained from scores of low-level criteria (e.g., Type A and Type B) through aggregation. If a MCDA process consists of many low-level criteria, the designer will need to determine scores for individual variables or pairs of variables. In comparison with produce a high-level score directly (i.e., not through aggregation), the low-level scores are usually more precise, easier to judge, but more time-consuming to obtain. Hence, there is a trade-off between precision and time cost. In our proposed MCDA scheme, we indicate the possible modes, in which each criterion could be assessed, and recommend a specific mode of assessment for optimizing the trade-off concerned.
Design Consideration 3. Multiple complementary or conflicting facets. In the literature, a suggested criterion may consist two or more facets. For example, attention balance [CAB∗16] encourages glyph designers to allow the encoding of important data variables to attract more attention, while making sure other data variables are not seriously disadvantaged. To ease the assessment, we intentionally divide such a multi-facet criterion into two criteria at the same level, allowing the designers to score the two potentially conflicting criteria independently.
4 An MCDA Scheme for Glyph Design
Our proposed scheme consists of 12 criteria, which are described in the following subsections. For each criterion, we provide a definition, a specification of five-level scores [15], a recommended weight, and a recommended mode of assessment (in black) and other possible modes (in grey).
4.1 Typedness
- Definition:
-
This criterion assesses whether or not the visual channel (channels) of a data variable is (are) appropriated selected to match with the data type of the variable to be encoded. Such data types may include, but are not limited to: nominal, ordinal, interval, ratio, and directional.
- Recommended Modes:
-
Type A (direct), Type D (aggregated).
- Recommended Weight:
-
Type A (unweighted), Type D [1.0].
The above definition was proposed by Chung et al. [CAB∗16, BKC∗13] for assessing each visual channel in a glyph based on Bertin’s four kinds of perception (KOPs), namely, associative, selective, ordered, and quantitative perception. Not all KOPs are applicable to all data types. For example, ordered, and quantitative perception is not required for a nominal variable. Hence, we consider only applicable KOPs (i.e., AKOPs in short).
We consider three levels of typedness, appropriate, usable, and inappropriate. When a data variable is encoded using just one visual channel , we may derive a score as follows:
-
5.
The visual channel is appropriate for all AKOPs.
-
4.
The visual channel is appropriate for some AKOPs and is usable for the other AKOPs.
-
3.
The visual channel is usable for all AKOPs.
-
2.
The visual channel is inappropriate for some AKOPs.
-
1.
The visual channel is inappropriate for all AKOPs.
When a data variable is encoded using two or more visual channels , we consider the best visual channel for each KOP. Hence the above scores are redefined as:
-
5.
For each AKOP, at least one visual channel is appropriate.
-
4.
For some AKOPs, the best visual channel is appropriate, while for the other AKOPs, the best is usable.
-
3.
For each AKOP, the best visual channel is usable.
-
2.
For some AKOPs, all visual channels are inappropriate.
-
1.
For each AKOP, all visual channels are inappropriate.
4.2 Discernability
- Definition:
-
This criterion assesses whether the encoding of a data variable allows viewers to differentiate key values or major value ranges. The encoding may use one or more visual channels.
- Recommended Modes:
-
Type A (direct), Type D (aggregated).
- Recommended Weight:
-
Type A (unweighted), Type D [1.0].
A data variable may has a number of valid values in an application context. For some numerical variables, the number can be huge. Glyph-based visualization is normally not intended for users to observe such data variables at a high-resolution. It therefore helpful to define a set of key values (or key data ranges) for each data variable in an application context. Given key values (or key value ranges), viewers potentially need to differentiate pairs of values (ranges). We define five levels based on .
-
5.
All pairs of values (ranges) can be differentiated at ease.
-
4.
Most of the pairs of values (ranges) can be differentiated at ease, and the rest are perceptually differentiable. Numerically, “most” is defined as , i.e.,
-
3.
A large portion of the pairs of values (ranges) can be differentiated at ease, and the rest are perceptually differentiable. Numerically, “large portion” is defined as , i.e., .
-
2.
Most of the pairs of values (ranges) are perceptually differentiable. The rest are not. As [4.], “most” is defined as .
-
1.
A significant portion of the pairs of values (ranges) are not perceptually differentiable. Numerically, “significant portion” is defined as [25, 100], i.e., .

4.3 Intuitiveness
- Definition:
-
This criterion assesses how the encoding of a data variable is semantically-related to the knowledge of viewers, and how such a relation makes the encoding knowable to the viewers by intuition.
- Recommended Modes:
-
Type A (direct), Type D (aggregated).
- Recommended Weight:
-
Type A (unweighted), Type D [1.0].
Given a data variable in an application domain, there may be a Domain-specific Convention (DC) for encoding the data variable visually. Such encoding captures the semantic knowledge of the discipline, hence facilitating intuitiveness. Given a design option for encoding a data variable , there are three basic scenarios of DC: no existing DC (noDC), consistent with the existing DC (cnDC), and inconsistent with the existing DC (inDC).
The encoding may also introduce one or more Additional Visual Metaphors (AM) for enhancing the existing DC or filling the gap when there is no existing DC. An appropriate metaphor can make effective connection between the semantics of and viewers’ knowledge to facilitate intuitiveness. Hence, we consider four basic scenarios of AM: no additional metaphor (noAM), appropriate metaphor (apAM), adequate metaphor (okAM), and inappropriate metaphor (inAM). Combining the two sets of scenarios results in 12 combinations. We define five levels as:
-
5.
cnDC-apAM or noDC-apAM.
-
4.
cnDC-noAM, cnDC-okAM, or noDC-okAM.
-
3.
noDC-noAM.
-
2.
cnDC-inAM, inDC-okAM, inDC-apAM.
-
1.
noDC-inAM, inDC-noAM, inDC-inAM.
Here we do not assume that DC is always better than AM, or vice versa. Nevertheless, the criterion awards the creativity of visual design by rating noDC-apAM slightly higher than cnDC-noAM.
4.4 Invariance: Geometry
- Definition:
-
This criterion assesses the undesirable impact of the geometrical variations in displaying a glyph upon its visual quality. The primary geometrical variations are size variations and other considerations include minor variations of aspect radio, projection angle, and rotation.
- Recommended Modes:
-
Type A, Type D (direct).
- Recommended Weight:
-
Type D [0.5].
Maguire et al. [MRSS∗12] conducted scalability tests in their glyph design process. Legg et al. [LMWC16] studied the geometric and color degeneration of glyphs. To reduce the complexity of assessing these two types of degeneration (i.e., Design Consideration 2), we have two sub-criteria, geometry (this section) and colorimetry (next section), under the common quality term “Invariance”.
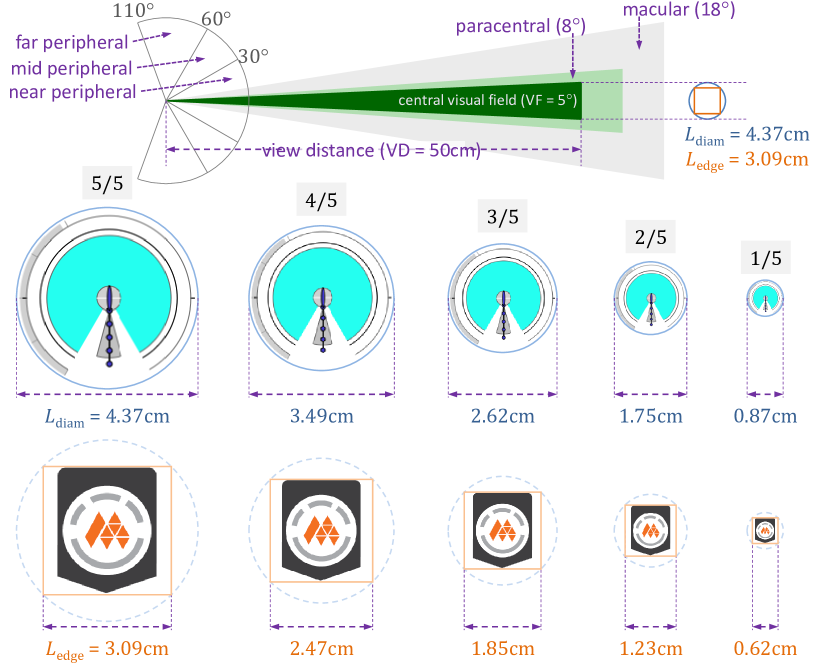
In the fields of vision science and human-computer interaction, there is a wealth of research on viewing distances and icon sizes. We can build on these findings to consider the geometric scalability of glyphs. As illustrated in Figure 3, the viewing area can be approximated by a cone that has a visual field VF degrees and a viewing distance VD. The central VF of human eyes is . Typical viewing distances for monitors, laptops, and phones are cm, cm, and cm respectively. We can estimate the viewing area as a circle with diameter or its inner square with edge length as follows:
In this work, we use [Wan95, SRJ11] and cm (widely-recommended viewing distance) as the baseline measures. The baseline of a circular viewing area has a diameter of 4.37 cm and a square with an edge length of 3.09 cm as illustrated in Figure 3. We can define the five levels based on scaling factors and the absence of any degradation of discernability of any visual channel (i.e., invariance) at each scale.
-
5.
Discernability is invariant at the scale.
-
4.
Discernability is invariant at the scale but variant at .
-
3.
Discernability is invariant at the scale but variant at .
-
2.
Discernability is invariant at the scale but variant at .
-
1.
Discernability is variant at the scale.
As exemplified by Maguire et al. [MRSS∗12], such invariance tests can easily be carried out by glyph designers. Since one will likely apply a scaling factor to a whole glyph, we recommend to assess this criterion with a Type D score directly.
4.5 Invariance: Colorimetry
- Definition:
-
This criterion assesses the undesirable impact of the non-geometrical appearance variations in displaying a glyph upon its visual quality. The main considerations are chromatic and achromatic variations of colors, which may be caused by limitations of a display device and/or environmental lighting conditions.
- Recommended Modes:
-
Type A, Type D (direct).
- Recommended Weight:
-
Type D [0.5].
Chromatic and achromatic variations of colors are commonly caused by undesirable environmental lighting (e.g., reflection) and occasionally by display devices (e.g., in an energy saving mode). Such variations can be approximated by using a function for varying the contrast and brightness of the imagery representation of a glyph. Consider the RGB representation of a pixel, such that . One commonly-used function is:
where specifies the increment (positive) or decrement (negative) of contrast, while specifies the increment or decrement of brightness. We recommend to assess this criterion with a Type D score. We define the five levels based on 10%, 20%, 30%, and 40% of variations, which are translated to and for and .
-
5.
Discernability is invariant with .
-
4.
Discernability is invariant when , but variant when .
-
3.
Discernability is invariant when , but variant when .
-
2.
Discernability is invariant when , but variant when .
-
1.
Discernability is variant when .
4.6 Composition: Separability
- Definition:
-
This criterion assesses the undesirable interference among visual channels in a glyph, which would affect the perception of some visual channels.
- Recommended Modes:
-
Type B, Type C, Type D (direct).
- Recommended Weight:
-
Type D [0.5].
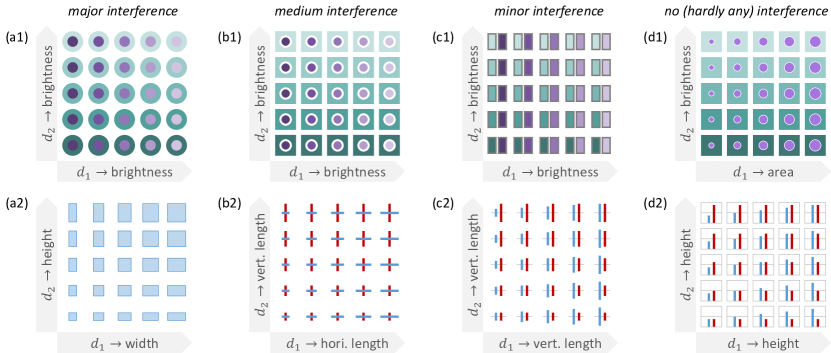
This criterion is based on the discourse by Maguire et al. [MRSS∗12] and hung et al. [CAB∗16] on the interference among visual channels in glyph design. Such interference is often caused by visual channels that are integrated into the same visual object or hosted by closely-placed visual objects. Visual channels of similar types (e.g., brightness, length) are more likely to suffer from interference as exemplified in Figure 4. In general, a glyph occupies a small display space, and interference is often unavoidable. Such minor interference would normally be considered to be acceptable in glyph design. In addition, for some applications, it is desirable to make some visual channels comparable, which conflicts with the desire for separating visual channels by using different types of visual channels or moving them away from each other. To balance these two sides of the same “Composition” coin, we have introduced “comparability” as a different criterion.
Although many empirical studies have evaluated the interference among different visual channels, there is not yet a standard metric for measuring the severity of such interference. While such a standard metric will hopefully be defined in future research, we hereby use a relatively subjective measure to categorize interference in glyph design as major, medium, minor, and none, which correspond to interference scores 1, 0.1, 0.01, and 0 respectively. Figure 4 shows two examples for each severity category.
Given a total of visual channels in a glyph, each channel can potentially be influenced by other channels. Let be the score of the interference received by from , and be the aggregated score for , which is defined as:
We can observe that is a pairwise score for Type B assessment, and is a score for Type C assessment. From these scores, we can obtain two Type D scores, a mean score and a maximum score :
We can therefore define the five levels as:
-
5.
: only minor interference.
-
4.
: some medium but no major interference.
-
3.
: some major interference, and less than of visual channels are affected.
-
2.
: some major interference, and between and of visual channels are affected.
-
1.
: some major interference, and more than of visual channels are affected.
As obtaining pairwise scores will be time-consuming, we recommend to evaluate each glyph design holistically. The above specification of the five levels facilities the option of obtaining a Type D score directly.
4.7 Composition: Comparability
- Definition:
-
This criterion assesses the desirable level of support featured in a glyph design for enabling required comparative tasks such as determining the order of two related data variables ( vs. ), estimating their addition , their difference , or their ratio .
- Recommended Modes:
-
Type B, Type C, Type D (direct).
- Recommended Weight:
-
Type D [0.5].
As mentioned in Section 4.6, we introduce this criterion to complement “Separability”. This criterion was not discussed explicitly in the existing surveys (e.g., [BKC∗13]), possibly because one only considers this when there is a need to compare some data variables within a glyph. Nevertheless, several glyph designs in the literature addressed the need to compare some data variables within a glyph representation. For example, Duffy et al. [DTW∗15] presented a glyph design representing some 20 data variables, among which three related distance variables were to be compared in terms of their lengths and relative ratios. Duffy et al. encoded these variables using three nested arcs, facilitating easy comparison.
When one needs to compare two visual channels that encode two different data variables, the following obstacles will likely hinder comparative tasks:
-
•
Major obstacle – Two visual channels are of very different types, e.g., area vs. brightness as shown in Figure 4 (d1).
-
•
Major obstacle – Two visual channels are of the same type but with inconsistent encoding schemes, e.g., two color channels, one with a divergence colormap and another with a sequential colormap, or two length channels, one uses 20 pixels to encode the range [0, 10] and another uses 40 pixels for the same range.
- •
-
•
Medium obstacle – Two visual channels do not have any common reference point, e.g., two length channels without any reference lines, unlike Figure 4 (c2, d2).
-
•
Minor obstacle – Two visual channels are placed far away from each other. where the word “far” is in the context of a glyph.
It is necessary to note, when a data variable is encoded using multiple visual channels, as long as one of the visual channels is comparable, one can omit the consideration of other visual channels. For example, if data variable is encoded using both length and a continuous colormap, and data variable is encoded using length only, we only need to consider -length vs. -length. We can define the five levels as:
-
5.
Major: none; Medium: none; Minor: none.
-
4.
Major: none; Medium: none; Minor: one or a few.
-
3.
Major: none; Medium: one; Minor: more than a few.
-
2.
Major: none; Medium: more than one; Minor: any.
-
1.
Major: at least one. Medium: any; Minor: any.
where we recommend that the term “a few” is defined as less than 10% of all pairwise comparisons, and “more than a few” is 10% or more but less than 50%. We also recommend to evaluate this criterion holistically by obtaining a Type D score directly. When there is no need for comparing any data variables within a glyph, we recommend to set the weight for this criterion to zero.
4.8 Attention: Importance
- Definition:
-
This criterion assesses the desirable level of support featured in a glyph design for encoding data variables according to their importance, e.g., by allocating more pre-attentive visual channels or higher encoding bandwidth to more important data variables.
- Recommended Modes:
-
Type B, Type C, Type D (direct).
- Recommended Weight:
-
Type D [0.5].
Ropinski and Preim [ROP11] instigated the benefit of encoding data variables according to their importance in the context of an application. Maguire et al. [MRSS∗12] identified several factors that may influence an important ranking: the level of a variable in a taxonomy, the usage of a variable in users’ tasks, and so on. The factors that help a visual channel receive more attention include the pop-out effect, the hierarchy effect, the size of the visual objects hosting the visual channel, and so on. Furthermore, when a data variable is encoded using multiple visual channels, it will likely receive more attention. Maguire et al. presented a method to bring the rankings of variables and visual channels together in glyph design.
Chung et al. [CAB∗16] defined “attention balance” as a criterion for matching the levels of attention that visual channels may receive with the importance levels of the variables. The term “attention balance” implicitly indicates two sides of the same coin. Following the third design consideration, we make the two sides of the same coin as two sub-criteria. This criterion focuses on “importance”, and the next criterion on “balance”. When there is no importance ranking of the data variables within a glyph, we recommend to set the weight for the importance criterion to zero. Nevertheless, the balance criterion will always be assessed.
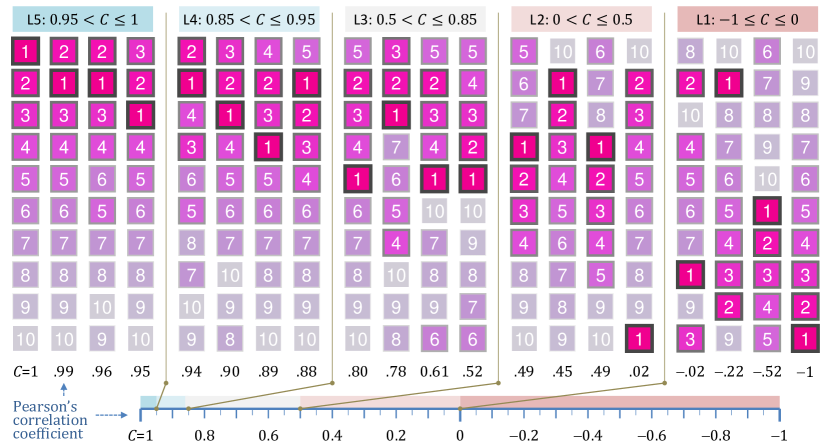
Consider a list of data variables, . Each variable is associated with two ranking values: for the importance of and for the attention of through its visual encoding. We have . The highest ranks of importance and attention are represented by 1 and the lowest by . If two data variables are ranked same for importance (or attention), their (or ) values are the same. We can compute the Pearson correlation coefficient:
where and are mean ranking values of importance and attention respectively. The five levels are defined as:
-
5.
The correlation coefficient .
-
4.
The correlation coefficient .
-
3.
The correlation coefficient .
-
2.
The correlation coefficient .
-
1.
The correlation coefficient .
Figure 5 shows four examples at each level. We can observe minor misalignment of the ordering has limited impact on the correlation coefficient, which is suitable for the uncertainty in ranking importance and attention, because of the subjective nature of importance ranking and the lack of experimental measures in attention ranking. In theory, one may first obtain Type B or Type C scores. In practice, it is more efficient to compute a Type D score directly.
4.9 Attention: Balance
- Definition:
-
This criterion assesses the undesirable disadvantages that some data variables may suffer, which may make such data variables easily overlooked or difficult to perceive.
- Recommended Modes:
-
Type B, Type C, Type D (direct).
- Recommended Weight:
-
Type D [0.5].
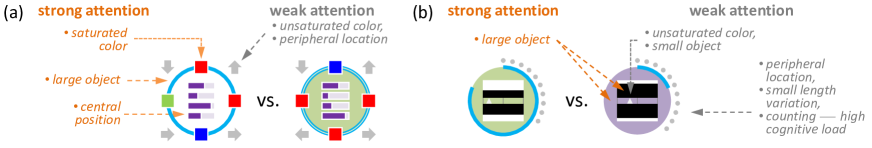
As described in Section 4.8, this criterion is assessing the opposite side of the same coin of “Attention”. When attention is prioritized for the importance of data variables, it is necessary to ensure that no data variable may be seriously disadvantaged or suffer from inattentional blindness, which is a phenomenon studied extensively in psychology. In the context of glyph design, inattentional blindness primarily occurs when some data variables attract significantly more attention and thus limit cognitive resource, causing the variations of some other data variables to go unnoticed.
Here we assume that (i) the variables concerned are discernable (see Section 4.2), and (ii) the importance-based ordering is correct (see Section 4.8). The blindness is caused by imbalanced allocation of cognitive resource for noticing variations. The factors of imbalance may include (a) peripheral location, (b) unsaturated color, (c) minor shape variation, (d) small object, (e) variation demanding high cognitive load, and so on. As illustrated in Figure 6, the blindness is usually due to the co-existence of two or more such factors.
Ideally, empirical research in the future will provide us with methods for identifying visual encoding that may suffer from inattentional blindness. Until then, one may identify such a variable for juxtaposing two glyphs (of the same design) where all data variables have some variations. As illustrated in Figure 6, one can observe those variables receiving weak attention, i.e., their variations are easily overshadowed by other variables.
We recommend evaluating this criterion holistically by obtaining a Type D score directly. We define the five levels based on the number of data variables that receive weak attention and may cause inattentional blindness:
-
5.
No data variable receives weak attention.
-
4.
One data variable receives weak attention.
-
3.
Two data variables receive weak attention.
-
2.
Three data variables receive weak attention.
-
1.
More than three data variables receive weak attention.
4.10 Searchability
- Definition:
-
This criterion assesses the desirable properties that the visual channel(s) for each data variable can be recognized easily among others after a viewer has learned and remembered the encoding scheme.
- Recommended Modes:
-
Type C, Type D (direct).
- Recommended Weight:
-
Type D [0.5].
Chung et al. [CAB∗16] defined “Searchability” as the level of ease when one needs to identify a visual channel associated to a specific data variable. Here we assume that the user has already learned and remembered such an association semantically. This allows us to consider searchability independently of whether the encoding is easy to learn or remember. As illustrated in Figure 7, when many variables have similar visual encoding except their positions in a glyph, they can be difficult to find, despite that their encoding following Bertin’s rules and receiving adequate attention.

Let us consider a meta-variable for representing the association between a data variable and a visual channel , such that if an association exists and false otherwise. In each of the three examples in Figure 7, is encoded primarily using a spacial location, which may also be searched through a related visual cue such as angle or count. In psychology, previous experiments have shown that the accuracy and response time of visual search and counting are affected by the number of objects and some other factors. For example, In Figure 7(a), the first and last bars are easier to search than other eight. If there were a smaller number of bars, e.g., a group of five bars in Figure 7(d,e), symmetry can aid the visual search. In Figure 7(b), for some numbers, the bars can be placed along lines from the center to the vertices of a square, hexagon, octagon, or even dodecagon, with one vertex at the 12’o clock direction. These placements can also aid visual search. One can easily use multiple encoding by adding additional visual cues (e.g., colors and symbols) to improve the searchability. For example, in Figure 7(c), one could replace each cross symbol with an object that has the shape defining the column and the color defining the row. In Figure 7(e), the 10 bars are divided into two groups using two colors. Ideally, the assessment of this criterion could be based on the measurement of accuracy, response time, and/or cognitive load in visual search. The previous empirical research in psychology has not provided standardized measurements that can be used for assessing glyph designs. We anticipate that this will be obtained in future empirical studies in visualization. For the time being, we coarsely define three levels of cognitive effort in visual search as:
-
•
Low cognitive load – It requires almost no effort to find a specific variable, e.g., the first or last bar in Figure 7(a).
-
•
Medium cognitive load – It requires a small and undemanding amount of counting or reasoning effort. One normally feels such an effort, but is fairly sure about the search results. For example, the 2nd and 3rd bars in Figure 7(a) fall into this category.
-
•
High cognitive load – It requires an amount of searching effort that one feels bothersome or burdensome, while one may hesitate about the correctness of the search. For example, the 4th through the 7th bar in Figure 7(a) fall into this category.
Based on these three categories, we can define the five levels as:
-
5.
High: none; Medium: none; Low all.
-
4.
High: none; Medium: one or a few; Low: most.
-
3.
High: none; Medium: more than a few; Low: more than half.
-
2.
High: one or a few; Medium: any; Low: any.
-
1.
High: more than a few; Medium: any; Low: any.
where we recommend that the term “a few” is defined as fewer than 10% of all data variables. We also recommend to evaluate this criterion holistically by obtaining a Type D score directly.
4.11 Learnability
- Definition:
-
This criterion assesses the desirable property that the whole encoding scheme of a glyph is easy to explain and to learn.
- Recommended Modes:
-
Type D (direct).
- Recommended Weight:
-
Type D [0.5].
Chung et al. [CAB∗16] defined learnability as the level of ease in learning and remembering a visual encoding scheme. As learning and memorizing are often studied separately in psychology, we split “learnability” and “memorability” into two related sub-criteria. For example, if the glyph in Figure 7(a) encodes the average marks of 10 courses (unnumbered), the scheme is easy to learn but difficult to remember. If it encodes the attendance of 10 weeks in an academic term, it is both easy to learn and remember. While both learnability and memorability can benefit from the intuitive encoding of individual visual channels (see Section 4.3), there are many holistic factors, such as the total number of data variables, their relative positions, their semantic similarity and difference, and so on. In order not to overload a criterion (Design Consideration 2), we let intuitiveness focus on individual visual channels through Type A scores, while focusing learnability and the memorability on two holistic sub-criteria through Type D scores.
Learnability is user-dependent. In order to focus on glyph designs, we assume that that the target users have already had the knowledge about the data variables to be encoded, e.g., terms such as scrum, ruck, lineout, maul, and try in the context of rugby sports [LCP∗12]. In many applications, glyph-based visualization is designed for domain experts. Because of the assumption of domain knowledge, controlled or semi-controlled empirical studies are typically unsuitable for assessing this criterion since the lack of domain knowledge of the experiment participants would invalidate the experiment results. Meanwhile, learnability should be assessed in relation to the baseline that the target users have little knowledge about the visual design concerned. For example, domain experts often contribute directly ideas of visual encoding in a design process. Naturally, these domain experts have already “learned” the designs to be evaluated and their knowledge would bias the assessment.
For a typical target user with adequate domain knowledge but little knowledge about the visual design to be evaluated, we defined the five levels based on learning time, learning mode (i.e., levels of training engagement), and the effort required for repeated learning after a short period of not using the glyphs. The five levels are:
-
5.
Learning time: hours; Learning mode: self-learning only; Repeated learning: effortless.
-
4.
Learning time: hour; Learning mode: self-learning + Q&A; Repeated learning: effortless.
-
3.
Learning time: hours; Learning mode: tutorial; Repeated learning: minor effort.
-
2.
Learning time: hours; Learning mode: tutorial; Repeated learning: noticeable effort.
-
1.
Learning time: hours; Learning mode: tutorial; Repeated learning: serious effort.
Here we define three learning modes: self-learning only, self-learning + Q&A, and tutorial. We define the effort for repeated learning as effortless (e.g., a quick glance at the encoding scheme), minor effort (e.g., reading the encoding scheme again for 5–10 minutes), noticeable (e.g., reading the encoding scheme again for 10–30 minutes and/or requiring Q&A), and serious effort (e.g., requiring another tutorial and/or more than 30 minutes). Note that the frequency of repeated learning relates to memorability.
4.12 Memorability
- Definition:
-
This criterion assesses the desirable property that the whole encoding scheme of a glyph is easy to remember once a viewer has learned the scheme.
- Recommended Modes:
-
Type D (direct).
- Recommended Weight:
-
Type D [0.5].
As already discussed in Section 4.11, this complementary criterion assesses the easiness of memorizing an encoding scheme. Similar to learnability, it is a holistic criterion and is assessed through a Type D score. The assessment assumes that the users have already learned the encoding scheme, and the effort for repeated learning and memory refreshing is considered as part of learnability.
Because of the effort to learn a glyph design, the learned encoding scheme must be stored in long-term memory. While one could assess how long the target users can remember an encoding scheme, the overall intention of this MCDA method is to evaluate different glyph designs without too much delay. Therefore, we recommend to base the assessment of this criterion on the memorability after 1 hour and 24 hours following learning. Both time periods meet the requirement for testing long-term memory [GC66, BEA20].
For a typical target user, we define the five levels according to how much the user can remember about an encoding scheme:
-
5.
after 1 hour: 100%, and after 24 hours: 100%.
-
4.
after 1 hour: <100%, , or after 24 hours: <100%, .
-
3.
after 1 hour: <90%, , or after 24 hours: <75%, .
-
2.
after 1 hour: <75%, , or after 24 hours: <50%, .
-
1.
after 1 hour: <50%, or after 24 hours: <25%.
| |
|
|
|
|
|---|---|---|---|---|
| A: Maguire et al. | B: Parody of A | C: Legg et al. | D: Parody of C | E: Chung et al. |
| Criterion | weight | rank | weight | rank | weight | rank | weight | rank | weight | rank |
| Typedness | 1 | 5.00 | 1 | 4.71 | 1 | 5.00 | 1 | 5.00 | 1 | 5.00 |
| Discernability | 1 | 5.00 | 1 | 5.00 | 1 | 5.00 | 1 | 5.00 | 1 | 5.00 |
| Intuitiveness | 1 | 4.14 | 1 | 3.29 | 1 | 4.13 | 1 | 3.63 | 1 | 4.10 |
| Invariance: Geometry | 0.5 | 5 | 0.5 | 4 | 0.5 | 5 | 0.5 | 5 | 0.5 | 3 |
| Invariance: Colorimetry | 0.5 | 3 | 0.5 | 3 | 0.5 | 5 | 0.5 | 5 | 0.5 | 4 |
| Composition: Separability | 0.5 | 5 | 0.5 | 1 | 0.5 | 5 | 0.5 | 3 | 0.5 | 5 |
| Composition: Comparability | ||||||||||
| Attention: Importance | 0.5 | 5 | 0.5 | 5 | 0.5 | 5 | 0.5 | 4 | 0.5 | 5 |
| Attention: Balance | 0.5 | 5 | 0.5 | 2 | 0.5 | 5 | 0.5 | 5 | 0.5 | 5 |
| Searchability | 0.5 | 5 | 0.5 | 1 | 0.5 | 5 | 0.5 | 5 | 0.5 | 5 |
| Learnability | 0.5 | 5 | 0.5 | 2 | 0.5 | 5 | 0.5 | 3 | 0.5 | 4 |
| Memorability | 0.5 | 4 | 0.5 | 1 | 0.5 | 5 | 0.5 | 1 | 0.5 | 3 |
| Total Weight & Weighted Average | 7 | 4.66 | 7 | 3.21 | 7 | 4.80 | 7 | 4.16 | 7 | 4.44 |
5 MCDA-aided Evaluation: Case Studies
We applied the MCDA scheme described in Section 4 to a number of visual designs in the literature and their “parodies” (alternative designs). These case studies allowed us to test the scheme, identify ambiguous definitions, unbalanced categorization, and inappropriate thresholds, facilitating the improvement of the scheme.
Table 1 shows the summary of five case studies. We have included a spreadsheet for recording the MCDA scores in the supplementary materials. Among these, A is the original design by Maguire et al. [MRSS∗12], who also reported a number of alternative encoding methods for individual data variables. It is not difficult for us to configure “parody” designs based on these alternative encoding methods. Design B is one of such parody designs. In B, variable S6 is encoded using three colors instead of three shapes (e.g., dark gray instead white circle in Table 1). Variable S2 is encoded using five colors for an outline instead of five metaphoric shapes (e.g., cyan square instead of an icon for material combination). S5 is encoded using seven basic shapes instead of seven countable metaphoric shapes as shown in the first row of Figure 2. The From Table 1, we can observe that the parody design has over-used colors and basic shapes, having a negative impact on several criteria, especially in terms of separability, attention balance, searchability, learnability, and memorability.
C is the original design by Legg et al. for supporting real-time event analysis during a rugby match. Design D is a parody design of C with two modifications: (i) replacing the silhouette pictogram at the center of the glyph with abstract shapes, and (ii) swapping the locations of the outcome circle (orange for unsuccessful) with the territory box (location A) in the glyphs representing Design C and Design D. As the data variable for event types has 16 key values, in comparison with pictograms in C, the abstract shapes in D reduces intuitiveness, learnability, and memorability. Meanwhile, the swapping changes the order between variables outcome and territory. The outcome circle is not as attentive as in C and becomes less separable from the abstract shapes in the center.
E is a design by Chung et al. [CLP∗15], where a similar set of pictograms was used for event types. Unlike C that was designed for rugby coaches and sports analysts, E was designed for analysts only, and it contains several numerical variables resulting from video analysis, such as gain, tortuosity, and net lateral movement. The discernability of these variables are affected by size and color degeneration. Although visual designs for these variables were introduced for this application, the analysts who had the technical background could learn and memorize these with a bit extra effort.
We have included the documentation about the parody designs B and D in a zip file as part of the supplementary materials.
6 Discussions and Conclusions
Summary. In this work, we have formulated a MCDA-aided assessment scheme for supporting glyph designs, and have tested the scheme on a range of glyph designs in the literature as well as their variants configured in the testing process. The scheme is built on the existing qualitative criteria in the literature, and enables a major step forward towards a more systematic, consistent, and semi-quantitative approach. Even when a glyph designer does not rank each criterion quantitatively, the scheme can serve as a reminder of the major considerations in encoding data variables and integrating different visual channels into a glyph representation.
Limitations. (a) The scheme does not encode any domain-specific information. It is not in anyway a replacement for user-centered design and evaluation, especially when the target users are domain experts. Nevertheless, the scheme can help glyph designers phrase questions in seeking advice from domain experts and speed up the design process. (b) The weights recommended in this work are specified based on our tests and analysis. On the one hand, there is a need for a set of weights that can be consistently applied to most (if not all) applications. On the other hands, weights are not ground truth, and their optimization needs the participation of the VIS community through many iterations. Thus the current recommendation is expected to be improved in the future. Meanwhile, it is important for glyph designers to ensure that the weights used in the assessment are transparent. (c) For several criteria, e.g., separability, comparability, attention balance, and searchability, the specification of the five levels can be improved in the future based on new empirical research designed to obtain more precise measurements. We hope that the proposed scheme will stimulate such research. (d) This proposed scheme does not cover the designs of 3D glyphs, glyph layout, interaction with glyphs, multi-scale glyphs, and so on. We hope that future research will extend the scheme.
Future Work. In addition to aforementioned future research, the field of VIS can benefit from publicly-available glyph editing tools. The proposed scheme can potentially be integrated into such tools, facilitating human-centered and semi-automatic assessment of glyph designs during a design process.
References
- [AAK20] Azzabi L., Azzabi D., Kobi A.: The Multi-Criteria Approach for Decision Support: An Introduction with Practical Applications. Springer, 2020.
- [AMTB05] Aigner W., Miksch S., Thurnher B., Biffl S.: Planninglines: novel glyphs for representing temporal uncertainties and their evaluation. In Ninth International Conference on Information Visualisation (IV’05) (2005), IEEE, pp. 457–463.
- [BARM∗12] Borgo R., Abdul-Rahman A., Mohamed F., Grant P. W., Reppa I., Floridi L., Chen M.: An empirical study on using visual embellishments in visualization. IEEE Transactions on Visualization and Computer Graphics 18, 12 (2012), 2759–2768.
- [BBS∗08] Botchen R. P., Bachthaler S., Schick F., Chen M., Mori G., Weiskopf D., Ertl T.: Action-based multifield video visualization. IEEE Transactions on Visualization and Computer Graphics 14, 4 (2008), 885–899.
- [BBWoWP83] Bertin J., Berg W., Wainer H., of Wisconsin Press U.: Semiology of Graphics. University of Wisconsin Press, 1983. URL: https://books.google.co.uk/books?id=ruZQAAAAMAAJ.
- [BEA20] Baddeley A., Eysenck M. W., Anderson M. C.: Memory, 3rd ed. Routledge, 2020.
- [Ber11] Bertin J.: Semiology of Graphics. Esri Press, Redlands, CA, 2011.
- [BH17] Bleisch S., Hollenstein D.: Exploring multivariate representations of indices along linear geographic features. In ICC 2017: Proceedings of the 2017 International Cartographic Conference (2017).
- [BKC∗13] Borgo R., Kehrer J., Chung D. H. S., Maguire E., Laramee R. S., Hauser H., Ward M., Chen M.: Glyph-based visualization: Foundations, design guidelines, techniques and applications. In Eurographics STAR Programme (2013).
- [BKH21] Brehmer M., Kosara R., Hull C.: Generative design inspiration for glyphs with diatoms. arXiv preprint arXiv:2107.09015 (2021).
- [CAB∗16] Chung D. H. S., Archambault D., Borgo R., Edwards D. J., Laramee R. S., Chen M.: How ordered is it? on the perceptual orderability of visual channels. Computer Graphics Forum 35, 3 (2016), 131–140.
- [CCB13] Cayli M., Cobanoglu M. C., Balcisoy S.: Glyphlink: An interactive visualization approach for semantic graphs. Journal of Visual Languages & Computing 24, 6 (2013), 463–471.
- [CF13] Cava R., Freitas C. D. S.: Glyphs in matrix representation of graphs for displaying soccer games results. In The 1st Workshop on Sports Data Visualization. IEEE (2013), vol. 13, p. 15.
- [CGSQ11] Cao N., Gotz D., Sun J., Qu H.: Dicon: Interactive visual analysis of multidimensional clusters. IEEE transactions on visualization and computer graphics 17, 12 (2011), 2581–2590.
- [Cha11] Chau M.: Visualizing web search results using glyphs: Design and evaluation of a flower metaphor. Acm transactions on management information systems (tmis) 2, 1 (2011), 1–27.
- [CLP∗15] Chung D. H., Legg P. A., Parry M. L., Bown R., Griffiths I. W., Laramee R. S., Chen M.: Glyph sorting: Interactive visualization for multi-dimensional data. Information Visualization 14, 1 (2015), 76–90.
- [CLZZ15] Cai Z., Li Y.-N., Zheng X. S., Zhang K.: Applying feature integration theory to glyph-based information visualization. In 2015 IEEE Pacific Visualization Symposium (PacificVis) (2015), IEEE, pp. 99–103.
- [CM84] Cleveland W. S., McGill R.: Graphical perception: Theory, experimentation, and application to the development of graphical methods. Journal of the American statistical association 79, 387 (1984), 531–554.
- [CPMM18] Cunha J. M., Polisciuc E., Martins P., Machado P.: The many-faced plot: strategy for automatic glyph generation. In 2018 22nd International Conference Information Visualisation (IV) (2018), IEEE, pp. 71–77.
- [CQM09] Chan W.-Y., Qu H., Mak W.-H.: Visualizing the semantic structure in classical music works. IEEE transactions on visualization and computer graphics 16, 1 (2009), 161–173.
- [DBS∗11] Drocourt Y., Borgo R., Scharrer K., Murray T., Bevan S., Chen M.: Temporal visualization of boundary-based geo-information using radial projection. Computer Graphics Forum 30, 3 (2011), 981–990.
- [Dov95] Dovey D.: Vector plots for irregular grids. In Proceedings Visualization’95 (1995), IEEE, pp. 248–253.
- [DS13] Dunne C., Shneiderman B.: Motif simplification: improving network visualization readability with fan, connector, and clique glyphs. In Proceedings of the SIGCHI Conference on Human Factors in Computing Systems (2013), pp. 3247–3256.
- [DTW∗15] Duffy B., Thiyagalingam J., Walton S., Smith D. J., Trefethen A., Kirkman-Brown J. C., Gaffney E. A., Chen M.: Glyph-based video visualization for semen analysis. IEEE Transactions on Visualization and Computer Graphics 21, 8 (2015), 980–993.
- [EAGA∗16] El-Assady M., Gold V., Acevedo C., Collins C., Keim D.: Contovi: Multi-party conversation exploration using topic-space views. Computer Graphics Forum 35, 3 (2016), 431–440.
- [FFM∗13] Fuchs J., Fischer F., Mansmann F., Bertini E., Isenberg P.: Evaluation of alternative glyph designs for time series data in a small multiple setting. In Proceedings of the SIGCHI conference on human factors in computing systems (2013), pp. 3237–3246.
- [FIBK16] Fuchs J., Isenberg P., Bezerianos A., Keim D.: A systematic review of experimental studies on data glyphs. IEEE transactions on visualization and computer graphics 23, 7 (2016), 1863–1879.
- [FJ20] Fernstad S. J., Johansson J.: To explore what isn’t there–glyph-based visualization for analysis of missing values. arXiv preprint arXiv:2011.12125 (2020).
- [FSS03] Forsythe A., Sheehy N., Sawey M.: Measuring icon complexity: An automated analysis. Behavior Research Methods, Instruments, & Computers 35, 2 (2003), 334–342.
- [GBS94] García M., Badre A. N., Stasko J. T.: Development and validation of icons varying in their abstractness. Interacting with computers 6, 2 (1994), 191–211.
- [GC66] Glanzer M., Cunitz A. R.: Two storage mechanisms in free recall. Journal of Verbal Learning and Verbal Behavior 5, 4 (1966), 351–360.
- [GRT16] Gerrits T., Rössl C., Theisel H.: Glyphs for general second-order 2d and 3d tensors. IEEE transactions on visualization and computer graphics 23, 1 (2016), 980–989.
- [GRT17] Gerrits T., Rössl C., Theisel H.: Glyphs for space-time jacobians of time-dependent vector fields. Tech. rep., Václav Skala-UNION Agency, 2017.
- [HE99] Healey C. G., Enns J. T.: Large datasets at a glance: Combining textures and colors in scientific visualization. IEEE transactions on visualization and computer graphics 5, 2 (1999), 145–167.
- [HLNW11] Hlawatsch M., Leube P., Nowak W., Weiskopf D.: Flow radar glyphs—static visualization of unsteady flow with uncertainty. IEEE Transactions on Visualization and Computer Graphics 17, 12 (2011), 1949–1958.
- [HNKS19] Hergl C., Nagel T., Kolditz O., Scheuermann G.: Visualization of symmetries in fourth-order stiffness tensors. In 2019 IEEE Visualization Conference (VIS) (2019), IEEE, pp. 291–295.
- [HSH07] Hlawitschka M., Scheuermann G., Hamann B.: Interactive glyph placement for tensor fields. In International Symposium on Visual Computing (2007), Springer, pp. 331–340.
- [HYW03] Hashash Y. M., Yao J. I.-C., Wotring D. C.: Glyph and hyperstreamline representation of stress and strain tensors and material constitutive response. International journal for numerical and analytical methods in geomechanics 27, 7 (2003), 603–626.
- [IN13] Ishizaka A., Nemery P.: Multi-Criteria Decision Analysis: Methods and Software. John Wiley & Sons, 2013.
- [JBMC10] Jänicke H., Borgo R., Mason J. S., Chen M.: Soundriver: semantically-rich sound illustration. Computer Graphics Forum 29, 2 (2010), 357–366.
- [KG07] Karve A., Gleicher M.: Glyph-based overviews of large datasets in structural bioinformatics. In 11th International Conference Information Visualization-Supplements (IV’07) (2007), IEEE, pp. 1–6.
- [KGM∗22] Kalamaras I., Glykos K., Megalooikonomou V., Votis K., Tzovaras D.: Graph-based visualization of sensitive medical data. Multimedia Tools and Applications 81, 1 (2022), 209–236.
- [KKG∗17] Keck M., Kammer D., Gründer T., Thom T., Kleinsteuber M., Maasch A., Groh R.: Towards glyph-based visualizations for big data clustering. In Proceedings of the 10th international symposium on visual information communication and interaction (2017), pp. 129–136.
- [KKG∗20] Kammer D., Keck M., Gründer T., Maasch A., Thom T., Kleinsteuber M., Groh R.: Glyphboard: Visual exploration of high-dimensional data combining glyphs with dimensionality reduction. IEEE transactions on visualization and computer graphics 26, 4 (2020), 1661–1671.
- [KMJF22] Koc K., McGough A. S., Johansson Fernstad S.: Peaglyph: Glyph design for investigation of balanced data structures. Information Visualization 21, 1 (2022), 74–92.
- [KSZS21] Khawatmi M., Steux Y., Zourob S., Sailem H.: Shapography: a glyph-oriented visualisation approach for creating pictorial representations of bioimaging data. bioRxiv (2021).
- [KWS∗20] Kovacevic N., Wampfler R., Solenthaler B., Gross M., Günther T.: Glyph-based visualization of affective states. In EuroVis 2020-22nd EG/VGTC Conference on Visualization Norrköping, Sweden, May 25-29, 2020 (2020), Eurographics Association.
- [LCM21] Lee J. H., Coelho D., Mueller K.: Cluster appearance glyphs: A methodology for illustrating high-dimensional data patterns in 2-d data layouts. Information 13, 1 (2021), 3.
- [LCP∗12] Legg P., Chung D., Parry M., Jones M., Long R., Griffiths I., Chen M.: Matchpad: Interactive glyph-based visualization for real-time sports performance analysis. Computer Graphics Forum 31, 3 (2012), 1255–1264.
- [LHL17] Lichtenberg N., Hansen C., Lawonn K.: Concentric circle glyphs for enhanced depth-judgment in vascular models. In VCBM (2017), pp. 179–188.
- [Lin22] Lind J.: Visualizing harmony using chordal glyphs and color mapping. In Music Encoding Conference 2021 (2022).
- [LKH09] Lie A. E., Kehrer J., Hauser H.: Critical design and realization aspects of glyph-based 3d data visualization. In Proceedings of the 25th Spring Conference on Computer Graphics (2009), pp. 19–26.
- [LMWC16] Legg P. A., Maguire E., Walton S., Chen M.: Glyph visualization: A fail-safe design scheme based on quasi-hamming distances. IEEE computer graphics and applications 37, 2 (2016), 31–41.
- [LRB03] Lee M. D., Reilly R. E., Butavicius M. E.: An empirical evaluation of chernoff faces, star glyphs, and spatial visualizations for binary data. In Proceedings of the Asia-Pacific symposium on Information visualisation-Volume 24 (2003), pp. 1–10.
- [MDBC00] McDougall S. J., De Bruijn O., Curry M. B.: Exploring the effects of icon characteristics on user performance: The role of icon concreteness, complexity, and distinctiveness. Journal of Experimental Psychology: Applied 6, 4 (2000), 291.
- [ML19] McNabb L., Laramee R. S.: Multivariate maps—a glyph-placement algorithm to support multivariate geospatial visualization. Information 10, 10 (2019), 302.
- [MRSS∗12] Maguire E., Rocca-Serra P., Sansone S.-A., Davies J., Chen M.: Taxonomy-based glyph design – with a case study on visualizing workflows of biological experiments. IEEE Transactions on Visualization and Computer Graphics 18, 12 (2012), 2603–2612.
- [MRZH14] Müller H., Reihs R., Zatloukal K., Holzinger A.: Analysis of biomedical data with multilevel glyphs. BMC bioinformatics 15, 6 (2014), 1–12.
- [MSM∗08] Martin J. P., Swan J. E., Moorhead R. J., Liu Z., Cai S.: Results of a user study on 2d hurricane visualization. Computer Graphics Forum 27, 3 (2008), 991–998.
- [MSSD∗08] Meyer-Spradow J., Stegger L., Döring C., Ropinski T., Hinrichs K.: Glyph-based spect visualization for the diagnosis of coronary artery disease. IEEE Transactions on Visualization and Computer Graphics 14, 6 (2008), 1499–1506.
- [MVB∗17] Meuschke M., Voß S., Beuing O., Preim B., Lawonn K.: Glyph-based comparative stress tensor visualization in cerebral aneurysms. Computer Graphics Forum 36, 3 (2017), 99–108.
- [MZFB19] Miller M., Zhang X., Fuchs J., Blumenschein M.: Evaluating ordering strategies of star glyph axes. In 2019 IEEE Visualization Conference (VIS) (2019), IEEE, pp. 91–95.
- [OHG∗08] Oeltze S., Hennemuth A., Glaßer S., Kühnel C., Preim B.: Glyph-based visualization of myocardial perfusion data and enhancement with contractility and viability information. In VCBM (2008), pp. 11–20.
- [PGL∗11] Peng Z., Grundy E., Laramee R. S., Chen G., Croft N.: Mesh-driven vector field clustering and visualization: An image-based approach. IEEE Transactions on Visualization and Computer Graphics 18, 2 (2011), 283–298.
- [PLC∗11] Parry M. L., Legg P. A., Chung D. H., Griffiths I. W., Chen M.: Hierarchical event selection for video storyboards with a case study on snooker video visualization. IEEE Transactions on Visualization and Computer Graphics 17, 12 (2011), 1747–1756.
- [PMR21] Pfeiffer L., Martinussen M., Rosenthal P.: On glyph design for wind information in en-route air traffic control. In 16th International Joint Conference on Computer Vision, Imaging and Computer Graphics Theory and Applications, VISIGRAPP 2021 (2021), vol. 3, SciTePress, pp. 164–172.
- [PPvA∗09] Peeters T. H., Prckovska V., van Almsick M., Vilanova A., ter Haar Romeny B. M.: Fast and sleek glyph rendering for interactive hardi data exploration. In 2009 IEEE Pacific Visualization Symposium (2009), IEEE, pp. 153–160.
- [PW13] Pilar D. H., Ware C.: Representing flow patterns by using streamlines with glyphs. IEEE transactions on visualization and computer graphics 19, 8 (2013), 1331–1341.
- [PYHZ14] Polk T., Yang J., Hu Y., Zhao Y.: Tennivis: Visualization for tennis match analysis. IEEE transactions on visualization and computer graphics 20, 12 (2014), 2339–2348.
- [RAEM94] Ribarsky W., Ayers E., Eble J., Mukherjea S.: Glyphmaker: creating customized visualizations of complex data. Computer 27, 7 (1994), 57–64.
- [RCMA∗18] Raidou R. G., Casares-Magaz O., Amirkhanov A., Moiseenko V., Muren L. P., Einck J. P., Vilanova A., Gröller M. E.: Bladder runner: Visual analytics for the exploration of rt-induced bladder toxicity in a cohort study. Computer Graphics Forum 37, 3 (2018), 205–216.
- [RLB∗20] Rees D., Laramee R. S., Brookes P., D’Cruze T., Smith G. A., Miah A.: Agentvis: visual analysis of agent behavior with hierarchical glyphs. IEEE transactions on visualization and computer graphics 27, 9 (2020), 3626–3643.
- [ROP11] Ropinski T., Oeltze S., Preim B.: Survey of glyph-based visualization techniques for spatial multivariate medical data. Computers & Graphics 35, 2 (2011), 392–401.
- [RP08] Ropinski T., Preim B.: Taxonomy and usage guidelines for glyph-based medical visualization. In SimVis (2008), vol. 522, pp. 121–138.
- [RPC19] Reda K., Potts C., Childers T.: Dynamic glyphs: Appropriating causality perception in multivariate visual analysis. In Vis x Vision Workshop: Novel Directions in Vision Science and Visualization Research (2019).
- [RSMS∗07] Ropinski T., Specht M., Meyer-Spradow J., Hinrichs K. H., Preim B.: Surface glyphs for visualizing multimodal volume data. In VMV (2007), vol. 1, pp. 3–12.
- [RWG∗12] Ribicic H., Waser J., Gurbat R., Sadransky B., Gröller M. E.: Sketching uncertainty into simulations. IEEE Transactions on Visualization and Computer Graphics 18, 12 (2012), 2255–2264.
- [SBW16] Stevens A. H., Butkiewicz T., Ware C.: Hairy slices: Evaluating the perceptual effectiveness of cutting plane glyphs for 3d vector fields. IEEE Transactions on Visualization and Computer Graphics 23, 1 (2016), 990–999.
- [SCP14] Siva N., Chaparro A., Palmer E.: Evaluation of milstd 2525 glyph features in a visual search paradigm. Proceedings of the Human Factors and Ergonomics Society Annual Meeting 58, 1 (2014), 1189–1193.
- [SF18] Streeb D., Fuchs J.: Design considerations on glyph placement strategies. In VisGuides 2018: 2nd Workshop on the Creation, Curation, Critique and Conditioning of Principles and Guidelines in Visualization (2018).
- [SK10] Schultz T., Kindlmann G. L.: Superquadric glyphs for symmetric second-order tensors. IEEE transactions on visualization and computer graphics 16, 6 (2010), 1595–1604.
- [SML∗20] Soares A. G. M., Miranda E. T. C., Lima R. S. d. A. D., Resque dos Santos C. G., Meiguins B. S.: Depicting more information in enriched squarified treemaps with layered glyphs. Information 11, 2 (2020), 123.
- [SOSG08] Suntinger M., Obweger H., Schiefer J., Groller M. E.: The event tunnel: Interactive visualization of complex event streams for business process pattern analysis. In 2008 IEEE Pacific Visualization Symposium (2008), IEEE, pp. 111–118.
- [SRJ11] Strasburger H., Rentschler I., Jüttner M.: Peripheral vision and pattern recognition: A review. Journal of vision 11, 5 (2011), 13–13.
- [Sur05] Surtola H.: The effect of data-relatedness in interactive glyphs. In Ninth International Conference on Information Visualisation (IV’05) (2005), IEEE, pp. 869–876.
- [SVUK∗19] Somarakis A., Van Unen V., Koning F., Lelieveldt B., Höllt T.: Imacyte: visual exploration of cellular micro-environments for imaging mass cytometry data. IEEE transactions on visualization and computer graphics 27, 1 (2019), 98–110.
- [SZD∗10] Sanyal J., Zhang S., Dyer J., Mercer A., Amburn P., Moorhead R.: Noodles: A tool for visualization of numerical weather model ensemble uncertainty. IEEE transactions on visualization and computer graphics 16, 6 (2010), 1421–1430.
- [TLS16] Tong X., Li C., Shen H.-W.: Glyphlens: View-dependent occlusion management in the interactive glyph visualization. IEEE Transactions on Visualization and Computer Graphics 23, 1 (2016), 891–900.
- [TSWS05] Tominski C., Schulze-Wollgast P., Schumann H.: 3d information visualization for time dependent data on maps. In Ninth International Conference on Information Visualisation (IV’05) (2005), IEEE, pp. 175–181.
- [TZJ∗16] Tong X., Zhang H., Jacobsen C., Shen H.-W., McCormick P. S.: Crystal glyph: Visualization of directional distributions based on the cube map. In EuroVis (Short Papers) (2016), pp. 13–17.
- [VP04] Verma V., Pang A.: Comparative flow visualization. IEEE Transactions on Visualization and Computer Graphics 10, 6 (2004), 609–624.
- [Wan95] Wandell B.: Foundations of Vision:. Europäische Hochschulschriften. Oxford University Press, Incorporated, 1995. URL: https://books.google.co.uk/books?id=5uhqAAAAMAAJ.
- [War02] Ward M. O.: A taxonomy of glyph placement strategies for multidimensional data visualization. Information Visualization 1, 3-4 (2002), 194–210.
- [War08] Ward M. O.: Multivariate data glyphs: Principles and practice. In Handbook of data visualization. Springer, 2008, pp. 179–198.
- [WLG∗21] Wu J., Liu D., Guo Z., Xu Q., Wu Y.: Tacticflow: Visual analytics of ever-changing tactics in racket sports. IEEE Transactions on Visualization and Computer Graphics 28, 1 (2021), 835–845.
- [WPL96] Wittenbrink C. M., Pang A. T., Lodha S. K.: Glyphs for visualizing uncertainty in vector fields. IEEE transactions on Visualization and Computer Graphics 2, 3 (1996), 266–279.
- [WT05] Weigle C., Taylor R. M.: Visualizing intersecting surfaces with nested-surface techniques. In VIS 05. IEEE Visualization, 2005. (2005), IEEE, pp. 503–510.
- [WWC∗21] Wang J., Wu J., Cao A., Zhou Z., Zhang H., Wu Y.: Tac-miner: Visual tactic mining for multiple table tennis matches. IEEE Transactions on Visualization and Computer Graphics 27, 6 (2021), 2770–2782.
- [XHRC∗18] Xia H., Henry Riche N., Chevalier F., De Araujo B., Wigdor D.: Dataink: Direct and creative data-oriented drawing. In Proceedings of the 2018 CHI Conference on Human Factors in Computing Systems (2018), pp. 1–13.
- [You01] Yousef M. K.: Assessment of metaphor efficacy in user interfaces for the elderly: a tentative model for enhancing accessibility. In Proceedings of the 2001 EC/NSF workshop on Universal accessibility of ubiquitous computing: providing for the elderly (2001), pp. 120–124.
- [YSD∗22] Ying L., Shu X., Deng D., Yang Y., Tang T., Yu L., Wu Y.: Metaglyph: Automatic generation of metaphoric glyph-based visualization. IEEE Transactions on Visualization and Computer Graphics (2022).
- [ZSL∗15] Zhang C., Schultz T., Lawonn K., Eisemann E., Vilanova A.: Glyph-based comparative visualization for diffusion tensor fields. IEEE transactions on visualization and computer graphics 22, 1 (2015), 797–806.