Discrimination of pp solar neutrinos and 14C double pile-up events in a large-scale LS detector
Abstract
As a unique probe, precision measurement of pp solar neutrinos is important for studying the Sun’s energy mechanism, monitoring thermodynamic equilibrium, and studying neutrino oscillation in the vacuum-dominated region. For a large-scale liquid scintillator detector, one bottleneck for pp solar neutrino detection comes from pile-up events of intrinsic 14C decays. This paper presents a few approaches to discriminate pp solar neutrinos and 14C pile-up events by considering the difference in their time and spatial distributions. In this work, a Geant4-based Monte Carlo simulation is constructed. Then multivariate analysis and deep learning technology were adopted respectively to investigate the capability of 14C pile-up reduction. As a result, the BDTG model and VGG network showed good performance in discriminating pp solar neutrinos and 14C double pile-up events. Their signal significance can achieve 10.3 and 15.6 using only one day of statistics. In this case, the signal efficiency is 51.1% for discrimination using the BDTG model when rejecting 99.18% 14C double pile-up events, and the signal efficiency is 42.7% for the case using the VGG network when rejecting 99.81% 14C double pile-up events.
I Introduction
With the development of nuclear physics and astrophysics, we were able to glimpse the Sun’s energy mechanism, which comes from the nuclear fusion of light nuclei in the core of the Sun Bethe-1938 ; Bethe-1939 ; Bahcall-1996pt . The proton-proton (pp) cycle produces 99% of the solar energy, and its primary reaction is the fusion of two protons into a deuteron:
| (1) |
In the reaction, large amounts of low-energy neutrinos are emitted, named pp neutrinos ( MeV). In addition, the proton-electron-proton (pep) process and the secondary reactions in the pp cycle emit neutrinos as well, they are known as pep neutrinos, 7Be neutrinos, 8B neutrinos and hep (helium-proton) neutrinos, respectively. The remaining energy of the Sun is contributed by the carbon-nitrogen-oxygen (CNO) cycle, with CNO neutrinos emitted. The detection of solar neutrinos is considered as a direct way to test theoretical solar models. However, differences between early observations and theoretical predictions were discovered Davis-1968cp ; Cleveland-1998nv ; GALLEX-1992gcp ; GALLEX-1998kcz ; Kaether-2010ag ; GNO-2005bds ; SAGE-2009eeu ; Gavrin-2019sok ; Kamiokande-II-1989hkh ; Kamiokande-1996qmi , leading to the so-called ”solar neutrino problem” that has plagued us for more than 30 years. Later, the MSW-LMA mechanism Wolfenstein-1977ue ; Mikheyev-1985zog was proved to be the standard solution since solid evidence was provided by SNO SNO-2001kpb ; SNO-2003bmh and KamLAND KamLAND-2002uet . Currently, the Standard Solar Model (SSM) Bahcall-1995bt ; Christensen-Dalsgaard-1996hpz ; DeglInnocenti-1996uex ; Brun-1999dw ; Bahcall-2001pf ; Serenelli-2009yc can provide a precise prediction for the flux and energy distribution of solar neutrinos. As for the detection of solar neutrinos, almost all solar neutrino components have been observed Borexino-2007kvk ; BOREXINO-2014pcl ; BOREXINO-2018ohr ; BOREXINO-2020aww , and we are expected to enter an era of precise and comprehensive measurement of solar neutrinos in the next decades Gann-2021ndb ; Xu-2022wcq .
pp neutrinos are strongly related to the predominant energy production of the Sun and carry the recent message of the core of the Sun. These characteristics make pp neutrinos a unique messenger for the study of the Sun’s energy mechanism and thermodynamic equilibrium monitoring. On the other hand, pp neutrinos can be used for the study of neutrino oscillation in the vacuum-dominated region. The detection of pp neutrinos requires a low threshold ( keV) and effective background reduction at the same time. The first detection of pp neutrinos was made by 71Ga-based radiochemical detectors GALLEX-1992gcp ; GALLEX-1998kcz ; Kaether-2010ag ; GNO-2005bds ; SAGE-2009eeu ; Gavrin-2019sok . Later, a large-scale liquid scintillator (LS) detector was successfully applied in the Borexino experiment and provided the best measurement of pp neutrinos at 10% level BOREXINO-2014pcl ; BOREXINO-2018ohr via elastic neutrino-electron scattering.
According to the experience from Borexino, intrinsic 14C decays from the organic liquid scintillator and its associated pile-up events are a crucial internal background for a large-scale LS detector. 14C pile-up events correspond to the case that more than one 14C decays at different detector positions but takes place in the same trigger window. In addition, pile-up can be classified into the following categories according to the multiplicity of 14C accidental coincidence: double pile-up, threefold pile-up, fourfold pile-up, and so on. The Borexino experiment (278 ton) takes a lot of effort in LS purification and makes the 14C concentration reach about g/g. With this concentration, 14C double pile-up is about 10% of the events in the spectral gap between 14C and 210Po spectra BOREXINO-2014pcl .
| Event types | (Borexino-like) | |||
| pp- | ( ) | ( ) | ( ) | ( ) |
| 14C single | ||||
| 14C double | ( ) | ( ) | ( ) | ( ) |
| 14C triple | ||||
| Signal-to-background ratio: () | 1 : 17 | 1 : 126 | 1 : 431 | 1: 1727 |
For an LS detector whose sensitive target mass is kiloton (kton), the frequency of 14C single event is:
| (2) |
where is Avogadro’s constants (), and , , correspond to 14C’s lifetime, molar mass and its concentration in LS, respectively.
The frequency of 14C pile-up events can be calculated as follows:
| (3) |
Where () denotes the multiplicity of 14C accidental coincidence, for example, represents the case of double 14C pile-up. is the time window for detection and corresponds to the reconstruction efficiency of 14C pile-up events.
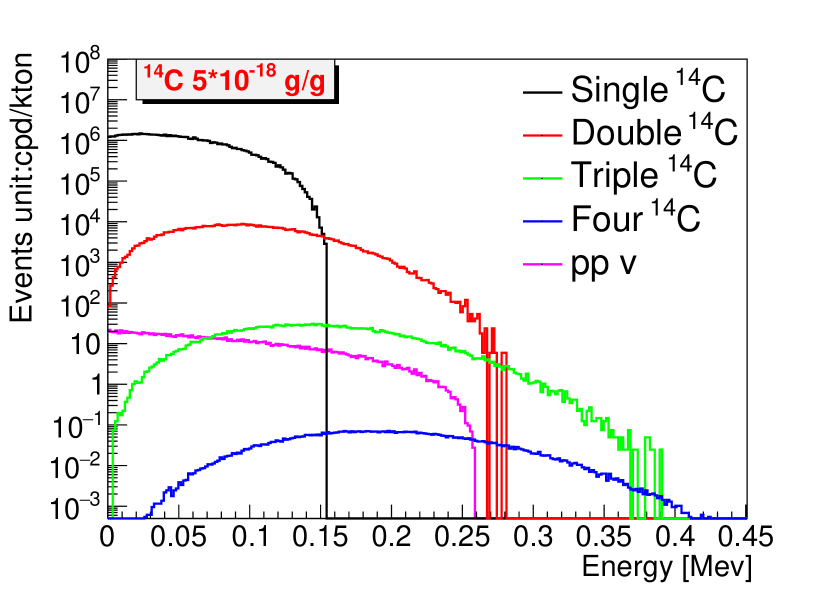
As the detector mass increases, the dramatic increase in 14C pile-up events has to be taken into account and rejected effectively. Taking a large spherical LS detector as an example, assuming the radius of the detector is 15 m thus the detector mass is about 12 kton, Table 1 lists the event rate of pp neutrinos, 14C single and pile-up events in different 14C concentrations. A 500 ns time window was used in this calculation and reconstruction efficiency was set to 100%. Assuming the 14C concentration of LS is g/g in the above detector, Fig. 1 shows the recoil energy spectrum of pp neutrinos via elastic neutrino-electron scattering, its calculation can be found in Xu-2022wcq . The energy spectra of 14C single, double, and triple pile-up events are shown for comparison. For this giant detector, pp neutrino signals are totally swamped by 14C pile-up events of more than two orders of magnitude.
In Table 1, the values in brackets indicate the event rates inside the energy range of interest, which is from 0.16 MeV to 0.25 MeV for deposited energy by considering that the Q value of 14C decay is keV and the scattered electron of pp neutrino is difficult to distinguish from the emitted electron of 14C single event. The target mass of the above detector (12 kton) is 43 times larger compared to Borexino (278 ton). As a result, the signal-to-background ratio of neutrinos and 14C double pile-up events is smaller than 1 : 126 in the case of 14C concentration at g/g in this detector, and the signal-to-background ratio will be much poorer if an unlucky 14C concentration was found. On the other hand, since the energy resolution will introduce smearing in the energy spectrum, the energy range of analysis needs to be determined based on realistic situations.
More neutrino experiments are under construction or being planned, many of them JUNO-PPNP ; Jinping-2016iiq ; DARWIN-2020bnc ; Bieger-2021sas ; juno-yellowbook ; JUNO-PPNP ; LENA have good potential in pp neutrino detection since they are expected to have a large detector target, well-controlled radioactivity, low detection threshold or good energy resolution. For those experiments with LS detectors of tens of kilotons, 14C pile-up makes the detection difficult at the low energy region. Hence it is necessary to develop an approach for 14C pile-up discrimination and reduction, especially the discrimination of 14C double pile-up since its event rate is much higher than other accidental coincidences.
This paper focuses on the discrimination of pp solar neutrinos and 14C double pile-up events. As for the discrimination of other accidental coincidences with 14C multiplicity 3, it is an important topic in the case of poor 14C concentration, but it is not the subject of this article. The details of our work will be presented as follows: First, we build an LS detector in simulation and investigate the features of the detector’s PMT hit pattern for pp neutrinos and 14C double pile-up events (Sec. II). Then, we present several approaches for 14C double pile-up discrimination based on multivariate analysis and deep learning technology (Sec. III). In Sec. IV, the discrimination performance will be shown and compared. Finally, a summary will be provided in Sec. V
II Detector simulation
In this work, a spherical LS detector was built in Monte Carlo (MC) simulation using Geant4 toolkit GEANT4-2002zbu , version 4.10.p02. The radius of the spherical detector is 15 m, and the LS is contained in an acrylic sphere with 10 cm thick. To simplify the simulation, a sensitive optical surface is defined for photons receiving instead of the PMT simulation in detail. The sensitive optical surface is a sphere outside the acrylic sphere, separated by 1 m thick water. Next, the coverage and the quantum efficiency of the photosensors can be easily applied and tuned. In the simulation, the coverage rate is 65% and it corresponds to about 10650 20-inch photomultipliers (PMTs) uniformly distributed on the sensitive optical surface. Fig. LABEL:fig:detector shows the schematic view of the detector. In the simulation, a 30% averaged quantum efficiency was used for 20-inch PMTs with 2% Gaussian relative spread. The LS properties were referenced from Zhou-2015gwa ; Gao-2013pua ; Wurm-2010ad ; Zhang-2020mqz ; Ding-2015sys ; Buck-2015jxa ; OKeeffe-2011dex ; Yu-2022god , and comprehensive optical processes were adopted, including quenching, Rayleigh scattering, absorption, and re-emission. Table 2 summarizes the main parameters of PMTs in the simulation, including the transit time spread (TTS), quantum efficiency (QE), dark noise, and the resolution of single photoelectron (spe). As a result, about 1100 photoelectrons (PEs) will be observed by 10650 PMTs for a 1 MeV electron fully deposited its kinetic energy in the center of the detector, and it corresponds to about 3% energy resolution. On the other hand, there are about 105 additional PEs that will be detected, which come from the PMT dark noise in a time window of 500 ns.
| Parameters | Values |
| PMT Coverage | 65% |
| PMT QE | 30% 2% (Gaussian) |
| PMT TTS | 3 0.3 ns (Gaussian) |
| PMT dark rate | 20 3 kHz (Gaussian) |
| PMT spe resolution | 30% 3% (Gaussian) |
| Time window | 500 ns |
To investigate the response features of pp neutrinos and 14C double pile-up events, their MC samples were generated and compared. About 1 million final-state electrons from the elastic neutrino-electron scattering reaction of pp neutrinos were uniformly simulated in the LS volume, and the spectrum of scattered electrons was referenced from Xu-2022wcq . Since the final-state electrons from the elastic neutrino-electron scattering are similar to the emitted electrons from 14C decay (14C single event), it is difficult to distinguish them in event-by-event level. Therefore, an energy cut is needed to focus on a narrow energy region. The same treatment is applied by Borexino. On the other hand, there is about 5% energy non-linearity Yu-2022god ; DayaBay-2019fje for electrons whose kinetic energy is around 0.2 MeV in LS, and energy resolution is included in the above simulation naturally. As a result, in our analysis, a 255 PEs cut was applied to the total number of photoelectrons of all PMTs by considering 156 keV end-point energy of 14C decay (150 PEs) and the contribution of PMT dark noise (105 PEs).
After the total PEs cut, an MC sample which includes 100 thousand of pp neutrino will be used for the study of discrimination, and they are uniformly distributed in the LS. As for the generation of 14C double pile-up sample, firstly, a large dataset was produced by simulating 10 million 14C single events in the LS via 14C decay. Next, two 14C single events were randomly picked up from the dataset and then merged into a double pile-up event. In the merge operation, since the lifetime of 14C is longer than 8000 years, the time interval of two 14C single events can be approximately treated as a uniform distribution in a few hundred nanoseconds. Similarly, a 255 PEs cut was applied and 100 thousand 14C double pile-up events will be used for our analysis.
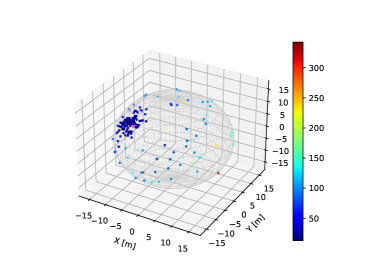
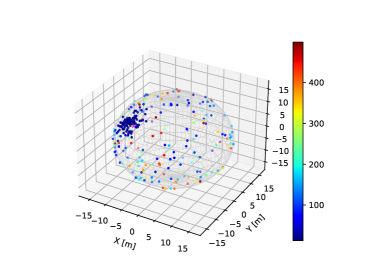
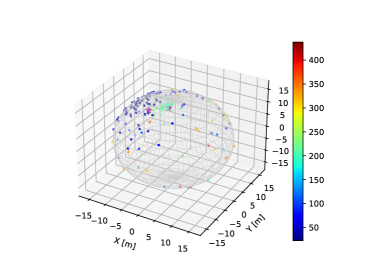
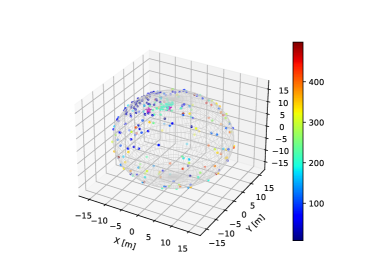
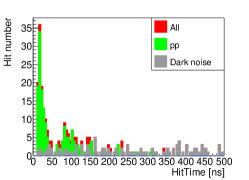
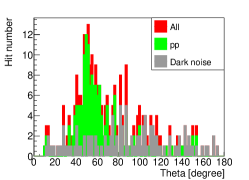
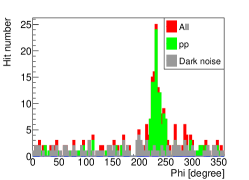
As illustrated in Fig. 3 and Fig. 4, pp solar neutrinos and 14C double pile-up events show different features in their time and spatial distributions. pp solar neutrino is a single point-like event whose energy deposition occurs in a relatively short time and a small space; hence, only one cluster will be found in its PMT hit pattern. As for 14C double pile-up event, if two 14C decay at different detector positions, two clusters will be found. On the other hand, since the hit time distribution of the fired PMTs includes both scintillation time and photon’s time of flight, as well as the decay time of 14C, this makes the hit time distribution useful for identification studies. Especially for the case that two 14C decay near each other, their spatial distribution will not be significantly different from a single point-like event, but the hit time distribution may still be helpful if the time interval between two 14C decays is large. An example of this case can be found in Fig. 4. In Sec. III, event spatial information will be extracted and used together with hit time information as input to the discrimination algorithms.
III Discrimination methods
The basic idea to develop a discrimination algorithm for pp solar neutrinos and 14C double pile-up events is by utilizing their time and spatial information, which have different characteristics (Sec. II). Similar approaches were applied in the discrimination of single-site and multi-site energy depositions in large-scale liquid scintillation detectors Dunger:2019dfo . During the measurement, the cluster structure will be smeared by interference from the dark noise and the TTS of the PMT. These effects make the identification becomes more challenging and requires efficient approaches. In this study, a multivariate analysis using the TMVA (Toolkit for Multivariate Data Analysis) Hocker:2007ht ; Speckmayer:2010zz is performed, and the widely used algorithm BDTG (Boosted Decision Trees with Gradient boosting) is chosen, and investigated. In addition, deep learning technologies based on the VGG network have also been applied. In the following, we present the details of the discrimination method.
III.1 TMVA analysis
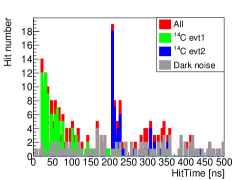
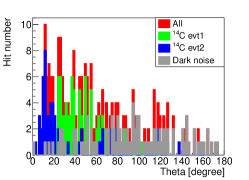
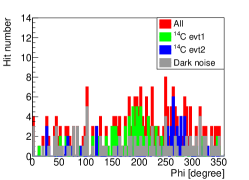
TMVA Hocker:2007ht ; Speckmayer:2010zz is a powerful tool for multivariate analysis, and it has been successfully applied in both signal and background classification in accelerator physics Lampen:2008zza , component identification of cosmic rays LHAASO:2019qdu and event reconstruction in LS detectors for neutrino experiments Qian-2021vnh . The TMVA toolkit hosts a large variety of multivariate classification algorithms. In this paper, we choose and investigate the TMVA algorithm BDTG. To extract input variables, the PMT hit pattern was projected onto a one-dimensional (1-D) plane for hit time, and and of each fired PMT in spherical coordinates, respectively. The projection results of Fig. 3 are shown in Fig. 5 and the projection results of Fig. 4 are shown in Fig. 6. The pp solar neutrino, which is a single point-like event, only shows one cluster in its distributions, while the 14C double pile-up event shows two clusters.
These 1-D distributions will be used in the multivariate analysis. The input variables of TMVA algorithms should be sensitive to discrimination and contain the characteristics of pp solar neutrinos and 14C double pile-up events. In our analysis, it was found that the hit time information dominates the discrimination performance, so more variables are extracted from the 1-D distribution of hit time. A total of eighteen variables were used in the TMVA analysis. These variables are marked as , where , etc., and they correspond to the extracted parameters in each 1-D distribution. , or , which denotes that the variables are from the 1-D distribution of hit time, or . Their details can be found in Table 3.
| Variable | Description |
| Number of hits in the first 200 ns | |
| The peak position of the highest bin in the first 200 ns | |
| The amplitude of the highest bin in the first 200 ns | |
| The ratio between the peak amplitude and the peak position of the highest bin in the first 200 ns | |
| Number of hits in (200, 500) ns | |
| The peak position of the highest bin in (200, 500) ns | |
| The amplitude of the highest bin in (200, 500) ns | |
| The ratio between the peak amplitude and the peak position of the highest bin in (200, 500) ns | |
| The ratio between the number of hits in the first 200 ns and in (200, 500) ns | |
| The RMS value of the 1-D distribution of hit time | |
| The Mean value of the 1-D distribution of hit time | |
| The skewness coefficient of the 1-D distribution of hit time | |
| The RMS value of the 1-D distribution of | |
| The skewness coefficient of the 1-D distribution of | |
| The kurtosis coefficient of the 1-D distribution of | |
| The RMS value of the 1-D distribution of | |
| The skewness coefficient of the 1-D distribution of | |
| The kurtosis coefficient of the 1-D distribution of |
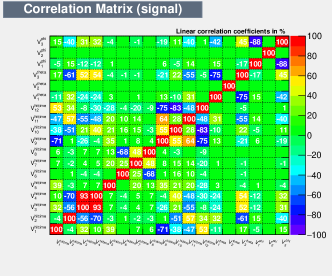
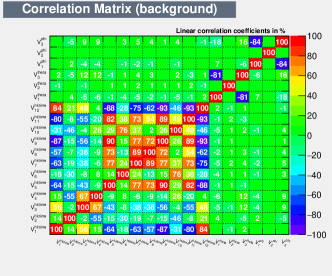
Fig. LABEL:fig:TMVA_parameterInput_example shows the normalized distributions of these input variables, and the difference in their shapes is observed by comparing the two types of events. On the other hand, the correlations of the input variables are checked for both pp solar neutrinos and 14C double pile-up events. As shown in Fig. 8, since we have dropped several variables with strong correlations in the previous study, the correlation of the current variables is acceptable with no one greater than 95%.
| Configuration option | Setting | Description |
| NTrees | 1000 | Number of trees in the forest |
| MaxDepth | 2 | Max depth of the decision tree allowed |
| MinNodeSize | 2.5% | Minimum percentage of training events required in a leaf node |
| nCuts | 20 | Number of grid points in variable range used in finding optimal cut in node splitting |
| BoostType | Grad | Boosting type for the trees in the forest |
The MC samples of pp solar neutrinos and 14C double pile-up events are divided into two equal parts, respectively, one for TMVA training and the other for validation. To improve the performance, several main parameters are tuned in the BDTG algorithm, Table 4 shows the settings of the parameters, the other parameters are set to their default values and aren’t listed in the tables.
III.2 Deep learning
Deep learning technology is widely used in high energy physics and nuclear physics, there are many successful applications Guest-2016iqz ; Guest-2018yhq ; He-2018nst ; Ma-2019nst ; Qian-2021vnh ; Li-2022nst ; Liu-2022nst , such as energy reconstruction, track reconstruction, particle identification, signal processing, etc. In this paper, the deep learning algorithm VGG convolutional neural network is used for feature recognition of one-dimensional sequences. The extracted PMT hit patterns are projected into a one-dimensional feature series for hit time, and , , respectively, which is similar to Fig. 5 and Fig. 6. To extract their features, a one-dimensional convolution kernel is used for the above three series, a pooling layer is used for information compression, and a fully connected layer is used for particle classification. The model structure is based on the architecture of VGG-16, which includes 13 convolution and pooling modules, 3 fully connected layers, batch normalization layers, and connected neural unit dropout processing.
On the other hand, in addition to one-dimensional projection using the PMT hit patterns, we also tried two-dimensional projection methods to provide input to deep learning network, including Mercator projection, sinusoidal projection, and the projection method based on the arrangement of PMTs Qian-2021vnh . However, after applying the two-dimensional projection, it is found that the performance does not improve but slightly decreases. Considering that the number of hits is very small in the energy range of interest, we performed a detailed investigation and comparison, and this result can be explained by the fact that the cluster features are much more pronounced in the one-dimensional projection, but they are very discrete in the two-dimensional projection.
Finally, a one-dimensional projection is used to provide input to the VGG network described above. We trained the VGG network using Adaptive Momentum with a batch size of 256 samples, a momentum of 0.9, and an initial learning rate of 0.01. For every 10 epochs, the learning rate is reduced by a factor of 10. The accuracy of the model is evaluated using a cross-entropy loss function.
IV Discrimination performance and discussion
IV.1 Discrimination performance of the BDTG model
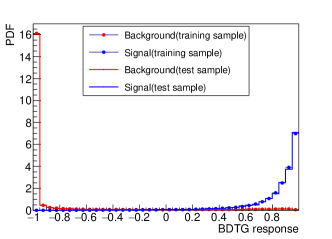
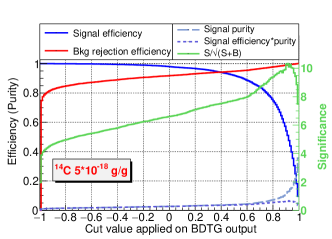
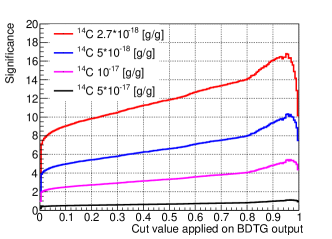
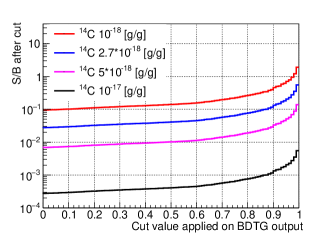
Fig. 9 shows the training results of the BDTG model. The network is not overtrained as the response of testing data is consistent with the training data (Fig. 9. Basically, the signal and the background are separated into two parts after training, but there are still some overlapping components, indicating that their event features are similar and hence the network fails to distinguish between them. According to a detailed investigation, it was found that one of the main contributions to the failed identification comes from the stacking case of two 14C that are very close together in both time and space. To optimize the significance: (where and are the numbers of signal and background after identification), we scanned the cut value on BDTG response and the corresponding efficiencies can be obtained as well. The 14C concentration of LS is assumed to g/g in Fig. 9, the calculation of the significance using one day of statistics in the analysis region (true energy: 160-250 keV) based on the estimation in Table 1, they are 1653 for signal and 712440 for background (only consider 14C double pile-up events) before the identification. For the BDTG model, the significance can reach its maximum value of 10.33 after applying a cut at 0.915, and the signal efficiency and the background rejection efficiency are 51.1% and 99.18% in this case. As discussed in Sec. I, the signal-to-background ratio of neutrinos and 14C double pile-up events is poor in a large-scale LS detector, thus a strict cut is needed to reject the most of background. In this case, 51.1% is an acceptable value for signal efficiency, and it still corresponds to a much larger statistics of effective pp neutrino signal per day compared to most existing experiments.
In Fig. 9, significance is evaluated using different assumptions of 14C concentration, while Fig. 9 shows the signal-to-background ratio after identification using the BDTG model, and the calculations were based on one day of statistics in the case of different 14C concentrations. As a result, the BDTG model shows great performance and it can handle most of 14C double pile-up events effectively.

In addition, other TMVA algorithms are also investigated, including the Likelihood algorithm and several BDT models (BDT, BDTD). Many of them exhibit similar performance (Fig. LABEL:fig:TMVA_compare), indicating the good robustness and stability of our analysis.
IV.2 Discrimination performance of the VGG network
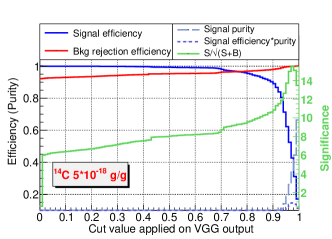
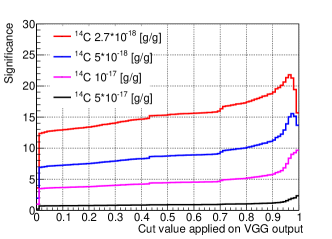
Fig. 11 shows the training results of the VGG network. The network is not overtrained as the response of testing data is consistent with the training data (Fig. 11. To optimize the significance, we scan the cut values on the VGG output, and the corresponding efficiencies can also be obtained. The 14C concentration of LS is assumed to g/g in Fig. 11, and the calculation of the significance using one day of statistics in the analysis region based on the estimation in Table 1. For the VGG network, the significance can reach its maximum value of 15.55 after applying a cut at 0.975, and the signal efficiency and the background rejection efficiency are 42.7% and 99.81% in this case.
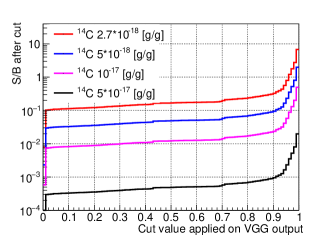
In Fig. 11, significance is evaluated using different assumptions of 14C concentration, while Fig. 11 shows the signal-to-background ratio after identification using the VGG network, and the calculations were based on one day of statistics in the case of different 14C concentrations. As a result, the VGG network shows great performance and it is able to achieve higher significance and a good improvement in the signal-to-background ratio compared to the BDTG model.
Furthermore, the discrimination performance was compared using different MC samples, as shown in Fig. LABEL:fig:roc_differentCase, the performance of discrimination gets worse after included the PMT dark noise, while TTS only has a little influence. And the discrimination performance based on the VGG network is stable when rejecting 99.8% 14C double pile-up events.
V Summary
Large-scale LS detectors have the benefits of huge target mass and high energy resolution, which makes them have a good potential in pp solar neutrino detection, but also face serious 14C pile-up background. In this paper, we investigate the discrimination of pp solar neutrinos and 14C double pile-up events in a large-scale LS detector using both multivariate analysis and deep learning technology. In the simulation study, a spherical LS detector was built using the Geant4 toolkit, and comprehensive optical processes were adopted. The response features in the PMT hit patterns of pp neutrinos and 14C double pile-up events were compared, clear differences were found in their time and spatial distributions since one of them is a single point-like event and the other one is an accidental coincidence of multiple events.
For the discrimination based on the BDTG model, a signal significance of 10.3 can be achieved using only one day of statistics. And the signal efficiency is 51.1% when rejecting 99.18% 14C double pile-up events. As for the VGG network, signal significance can achieve 15.6 using only one day of statistics, and the signal efficiency is 42.7% when rejecting 99.81% 14C double pile-up events. This analysis provides a reliable method reference for similar experiments in low-threshold physics detection and 14C pile-up background reduction.
References
- (1) H.A. Bethe and C.L. Critchfield, The formation of deuterium by proton combination. Phys. Rev. 54, 248-254 (1938). https://doi.org/10.1103/PhysRev.54.248
- (2) H.A. Bethe, Energy production in stars. Phys. Rev. 55, 434–456 (1939). https://doi.org/10.1103/PhysRev.55.434
- (3) J.N. Bahcall, M. Fukugita and P.I. Krastev, How does the Sun shine? Phys. Lett. B 374, 1-6 (1996). https://doi.org/10.1016/0370-2693(96)00187-6
- (4) R. Davis, Jr., D.S. Harmer et al., Search for neutrinos from the sun. Phys. Rev. Lett. 20, 1205-1209 (1968). https://doi.org/10.1103/PhysRevLett.20.1205
- (5) B.T. Cleveland, T. Daily, R. Davis et al., Measurement of the solar electron neutrino flux with the Homestake chlorine detector. Astrophys. J. 496, 505-526 (1998). https://doi.org/10.1086/305343
- (6) P. Anselmann, W. Hampel, G. Heusser et al., Solar neutrinos observed by GALLEX at Gran Sasso. Phys. Lett. B 285, 376-389 (1992). https://doi.org/10.1016/0370-2693(92)91521-A
- (7) W. Hampel, J. Handt, G. Heusser et al., GALLEX solar neutrino observations: Results for GALLEX IV. Phys. Lett. B 447, 127-133 (1999). https://doi.org/10.1016/S0370-2693(98)01579-2
- (8) F. Kaether, W. Hampel, G. Heusser et al., Reanalysis of the GALLEX solar neutrino flux and source experiments. Phys. Lett. B 685, 47-54 (2010). https://doi.org/10.1016/j.physletb.2010.01.030
- (9) M. Altmann, M. Balata, P. Belli et al., Complete results for five years of GNO solar neutrino observations. Phys. Lett. B 616, 174-190 (2005). https://doi.org/10.1016/j.physletb.2005.04.068
- (10) J.N. Abdurashitov, V.N. Gavrin, V.V. Gorbachev et al., Measurement of the solar neutrino capture rate with gallium metal. III: Results for the 2002–2007 data-taking period. Phys. Rev. C 80, 015807 (2009). https://doi.org/10.1103/PhysRevC.80.015807
- (11) V. N. Gavrin, The history, present and future of SAGE (Soviet-American Gallium Experiment). https://doi.org/10.1142/9789811204296_0002
- (12) K.S. Hirata, T. Kajita, T. Kifune et al., Observation of B-8 Solar Neutrinos in the Kamiokande-II Detector. Phys. Rev. Lett. 63, 16 (1989). https://doi.org/10.1103/PhysRevLett.63.16
- (13) Y. Fukuda, T. Hayakawa, K. Inoue et al., Solar neutrino data covering solar cycle 22, Phys. Rev. Lett. 77, 1683-1686 (1996). https://doi.org/10.1103/PhysRevLett.77.1683
- (14) L. Wolfenstein, Neutrino Oscillations in Matter. Phys. Rev. D 17, 2369-2374 (1978). https://doi.org/10.1103/PhysRevD.17.2369
- (15) S.P. Mikheyev and A.Y. Smirnov, Resonance Amplification of Oscillations in Matter and Spectroscopy of Solar Neutrinos. Sov. J. Nucl. Phys. 42, 913-917 (1985).
- (16) Q.R. Ahmad, R.C. Allen, J.D. Anglin et al., Measurement of the rate of interactions produced by 8B solar neutrinos at the Sudbury Neutrino Observatory. Phys. Rev. Lett. 87, 071301 (2001). https://doi.org/10.1103/PhysRevLett.87.071301
- (17) S.N. Ahmed, A.E. Anthony, E.W. Beier et al., Measurement of the total active B-8 solar neutrino flux at the Sudbury Neutrino Observatory with enhanced neutral current sensitivity. Phys. Rev. Lett. 92, 181301 (2004). https://doi.org/10.1103/PhysRevLett.92.181301
- (18) K. Eguchi, S. Enomoto, K. Furuno et al., First results from KamLAND: Evidence for reactor anti-neutrino disappearance. Phys. Rev. Lett. 90, 021802 (2003). https://doi.org/10.1103/PhysRevLett.90.021802
- (19) J.N. Bahcall and M.H. Pinsonneault, Solar models with helium and heavy element diffusion. Rev. Mod. Phys. 67, 781-808 (1995). https://doi.org/10.1103/RevModPhys.67.781
- (20) J. Christensen-Dalsgaard, W. Dappen, S.V. Ajukov et al., The current state of solar modeling. Science 272, 1286-1292 (1996). https://doi.org/10.1126/science.272.5266.1286
- (21) S. Degl’Innocenti, W.A. Dziembowski, G. Fiorentini et al., Helioseismology and standard solar models. Astropart. Phys. 7, 77-95 (1997). https://doi.org/10.1016/S0927-6505(97)00004-2
- (22) A.S. Brun, S. Turck-Chieze and J. P. Zahn, Standard solar models in the light of new helioseismic constraints. 2. mixing below the convective zone. Astrophys. J. 525, 1032-1041 (1999). https://doi.org/10.1086/307932
- (23) J.N. Bahcall, The Luminosity constraint on solar neutrino fluxes. Phys. Rev. C 65, 025801 (2002). https://doi.org/10.1103/PhysRevC.65.025801
- (24) A. Serenelli, S. Basu, J.W. Ferguson et al., New Solar Composition: The Problem With Solar Models Revisited. Astrophys. J. Lett. 705, L123-L127 (2009). https://doi.org/10.1088/0004-637X/705/2/L123
- (25) C. Arpesella, G. Bellini, J. Benziger et al., First real time detection of Be-7 solar neutrinos by Borexino. Phys. Lett. B 658, 101-108 (2008). https://doi.org/10.1016/j.physletb.2007.09.054
- (26) G. Bellini, J. Benziger, D. Bick et al., Neutrinos from the primary proton–proton fusion process in the Sun. Nature 512, no.7515, 383-386 (2014). missinghttps://doi.org/10.1038/nature13702
- (27) M. Agostini, K. Altenmüller, S. Appel et al., Comprehensive measurement of -chain solar neutrinos. Nature 562, no.7728, 505-510 (2018). https://doi.org/10.1038/s41586-018-0624-y
- (28) M. Agostini, K. Altenmüller, S. Appel et al., Experimental evidence of neutrinos produced in the CNO fusion cycle in the Sun. Nature 587, 577-582 (2020). https://doi.org/10.1038/s41586-020-2934-0
- (29) G.D.O. Gann, K. Zuber, D. Bemmerer et al., The Future of Solar Neutrinos. Ann. Rev. Nucl. Part. Sci. 71, 491-528 (2021). https://doi.org/10.1146/annurev-nucl-011921-061243
- (30) X.J. Xu, Z. Wang and S. Chen, Solar neutrino physics. https://doi.org/10.48550/arXiv.2209.14832
- (31) A. Abusleme et al., JUNO Physics and Detector. Prog. Part. Nucl. Phys. 123, 103927 (2022). https://doi.org/10.1016/j.ppnp.2021.103927
- (32) J.F. Beacom, S.M. Chen, J.P. Cheng et al., Physics prospects of the Jinping neutrino experiment. Chin. Phys. C 41, no.2, 023002 (2017). https://doi.org/10.1088/1674-1137/41/2/023002
- (33) J. Aalbers, F. Agostini, S.E.M. Ahmed Maouloud et al., Solar neutrino detection sensitivity in DARWIN via electron scattering. Eur. Phys. J. C 80, no.12, 1133 (2020). https://doi.org/10.1140/epjc/s10052-020-08602-7
- (34) L. Bieger, T. Birkenfeld, D. Blum et al., Potential for a precision measurement of solar pp neutrinos in the Serappis experiment. Eur. Phys. J. C 82, no.9, 779 (2022). https://doi.org/10.1140/epjc/s10052-022-10725-y
- (35) F.P. An, G.P An, Q. An et al., Neutrino Physics with JUNO. J. Phys. G 43, no.3, 030401 (2016). https://doi.org/10.1088/0954-3899/43/3/030401
- (36) M. Wurm, Studying neutrino properties in the future LENA experiment. Nucl. Phys. B Proc. Suppl. 237-238, 314-316 (2013). https://doi.org/10.1016/j.nuclphysbps.2013.04.114
- (37) S. Agostinelli, J. Allison, K. Amako et al., GEANT4–a simulation toolkit. Nucl. Instrum. Meth. A 506, 250-303 (2003). https://doi.org/10.1016/S0168-9002(03)01368-8
- (38) X. Zhou, Q. Liu, M. Wurm et al., Rayleigh scattering of linear alkylbenzene in large liquid scintillator detectors. Rev. Sci. Instrum. 86, no.7, 073310 (2015). https://doi.org/10.1063/1.4927458
- (39) L. Gao, B.x. Yu, Y.y. Ding et al., Attenuation length measurements of a liquid scintillator with LabVIEW and reliability evaluation of the device. Chin. Phys. C 37, 076001 (2013). https://doi.org/10.1088/1674-1137/37/7/076001
- (40) M. Wurm, F.von Feilitzsch, M. Goeger-Neff et al., Optical Scattering Lengths in Large Liquid-Scintillator Neutrino Detectors. Rev. Sci. Instrum. 81, 053301 (2010). https://doi.org/10.1063/1.3397322
- (41) Y. Zhang, Z.Y. Yu, X.Y. Li et al., A complete optical model for liquid-scintillator detectors. Nucl. Instrum. Meth. A 967, 163860 (2020). https://doi.org/10.1016/j.nima.2020.163860
- (42) X.F. Ding, L.J. Wen, X. Zhou et al., Measurement of the fluorescence quantum yield of bis-MSB. Chin. Phys. C 39, no.12, 126001 (2015). https://doi.org/10.1088/1674-1137/39/12/126001
- (43) C. Buck, B. Gramlich and S. Wagner, Light propagation and fluorescence quantum yields in liquid scintillators. JINST 10, no.09, P09007 (2015). https://doi.org/10.1088/1748-0221/10/09/P09007
- (44) H.M. O’Keeffe, E. O’Sullivan and M.C. Chen, Scintillation decay time and pulse shape discrimination in oxygenated and deoxygenated solutions of linear alkylbenzene for the SNO+ experiment. Nucl. Instrum. Meth. A 640, 119-122 (2011). https://doi.org/10.1016/j.nima.2011.03.027
- (45) M. Yu, L. Wen, X. Zhou et al., Determine Energy Nonlinearity and Resolution of and in Liquid Scintillator Detectors by A Universal Energy Response Model. https://doi.org/10.48550/arXiv.2211.02467
- (46) D. Adey, A.B. Balantekin, M. Bishai et al., A high precision calibration of the nonlinear energy response at Daya Bay. Nucl. Instrum. Meth. A 940, 230-242 (2019). https://doi.org/10.1016/j.nima.2019.06.031
- (47) J. Dunger and S.D. Biller, Multi-site Event Discrimination in Large Liquid Scintillation Detectors, Nucl. Instrum. Meth. A 943, 162420 (2019). https://doi.org/10.1016/j.nima.2019.162420
- (48) A. Hocker, P. Speckmayer, J. Stelzer et al., TMVA - Toolkit for Multivariate Data Analysis, https://doi.org/10.48550/arXiv.physics/0703039
- (49) P. Speckmayer, A. Hocker, J. Stelzer et al., The toolkit for multivariate data analysis, TMVA 4, J. Phys. Conf. Ser. 219, 032057 (2010). https://doi.org/10.1088/1742-6596/219/3/032057
- (50) T. Lampen, F. Garcia, A. Heikkinen et al., Testing TMVA software in b-tagging for the search of MSSM Higgs bosons at the LHC, J. Phys. Conf. Ser. 119, 032028 (2008). https://doi.org/10.1088/1742-6596/119/3/032028
- (51) L.Q. Yin, S.S. Zhang, Z. Cao et al. [LHAASO], Expected energy spectrum of cosmic ray protons and helium below 4 PeV measured by LHAASO, Chin. Phys. C 43, no.7, 075001 (2019). https://doi.org/10.1088/1674-1137/43/7/075001
- (52) D. Guest, J. Collado, P. Baldi et al., Jet Flavor Classification in High-Energy Physics with Deep Neural Networks, Phys. Rev. D 94, no.11, 112002 (2016). https://doi.org/10.1103/PhysRevD.94.112002
- (53) D. Guest, K. Cranmer and D. Whiteson, Deep Learning and its Application to LHC Physics, Ann. Rev. Nucl. Part. Sci. 68, 161-181 (2018). https://doi.org/10.1146/annurev-nucl-101917-021019
- (54) J.P. He, X.B. Tang, P. Gong et al., Spectrometry analysis based on approximation coefficients and deep belief networks. NUCL SCI TECH 29, 69 (2018). https://doi.org/10.1007/s41365-018-0402-4
- (55) X.K. Ma, H.Q. Huang, Q.C. Wang et al., Estimation of Gaussian overlapping nuclear pulse parameters based on a deep learning LSTM model. NUCL SCI TECH 30, 171 (2019). https://doi.org/10.1007/s41365-019-0691-2
- (56) Z. Qian, V. Belavin, V. Bokov et al., Vertex and energy reconstruction in JUNO with machine learning methods. Nucl. Instrum. Meth. A 1010, 165527 (2021). https://doi.org/10.1016/j.nima.2021.165527
- (57) Y.Z. Li, Z. Qian, J.H. He et al., Improvement of machine learning-based vertex reconstruction for large liquid scintillator detectors with multiple types of PMTs. NUCL SCI TECH 33, 93 (2022). https://doi.org/10.1007/s41365-022-01078-y
- (58) H.L. Liu, H.B. Ji, J.M. Zhang et al., A novel approach for feature extraction from a gamma-ray energy spectrum based on image descriptor transferring for radionuclide identification. NUCL SCI TECH 33, 158 (2022). https://doi.org/10.1007/s41365-022-01150-7