Type Ia supernovae SN 2013bz, PSN J0910+5003 and ASASSN-16ex: similar to 09dc–like?
Abstract
We present optical photometric and spectroscopic studies of three supernovae (SNe) SN 2013bz, PSN J0910+5003 and ASASSN-16ex. UV-optical photometric data of ASASSN-16ex obtained with Swift-UVOT are also analyzed. These objects were initially classified as 09dc–like type Ia SNe. The decline rate parameters () are derived as 0.92 0.04 (SN 2013bz), 0.70 0.05 (PSN J0910+5003) and 0.73 0.03 (ASASSN-16ex). The estimated band absolute magnitudes at maximum: 19.61 0.20 mag for SN 2013bz, 19.44 0.20 mag for PSN J0910+5003 and 19.78 0.20 mag for ASASSN-16ex indicate that all the three objects are relatively bright. The peak bolometric luminosities for these objects are derived as 43.38 0.07 erg s-1, 43.26 0.07 erg s-1 and 43.40 0.06 erg s-1, respectively. The spectral and velocity evolution of SN 2013bz is similar to a normal SN Ia, hence it appears to be a luminous, normal type Ia supernova. On the other hand, the light curves of PSN J0910+5003 and ASASSN-16ex are broad and exhibit properties similar to 09dc–like SNe Ia. Their spectroscopic evolution shows similarity with 09dc–like SNe, strong C ii lines are seen in the pre-maximum spectra of these two events. Their photospheric velocity evolution is similar to SN 2006gz. Further, in the UV bands, ASASSN-16ex is very blue like other 09dc–like SNe Ia.
keywords:
supernovae: general – supernovae: individual: SN 2013bz – PSN J0910+5003 – ASASSN-16ex – galaxies: individual: PGC 170248 – UGC 4812 – SDSS J171023.63+262350.3 – techniques: photometric – spectroscopic.1 Introduction
Thermonuclear Supernovae are an important class of supernovae (SNe), whose progenitors are low-mass stars found in elliptical as well as spiral galaxies. They are commonly known as Type-Ia SNe (SNe Ia) and populate the brighter side of the luminosity distribution of SNe. Most SNe Ia, referred to as ‘normal SNe Ia’, display uniform spectral and light-curve properties. Their luminosity is correlated with the width of their light curve (Phillips, 1993; Phillips et al., 1999) and hence are considered standardizable candles. This uniformity and high luminosity, make them a vital probe for studying cosmic evolution (Riess et al., 1998; Perlmutter et al., 1999). SNe Ia are the primary source of Iron Group Elements (IGEs), hence play an important role in enriching the Inter-Stellar Medium (ISM) with IGEs (Matteucci & Greggio 1986; Matteucci et al. 2009; Nomoto, Kobayashi & Tominaga 2013).
Our understanding of the progenitor and explosion mechanism giving rise to these events still needs to be completed. From the theoretical and observational work, it is inferred that thermonuclear disruption of a carbon-oxygen (C/O) White Dwarf (WD) in a binary system results in a type Ia explosion (Hoyle & Fowler 1960, see Maoz, Mannucci & Nelemans 2014; Jha, Maguire & Sullivan 2019 for reviews). There are two possible progenitor models suggested for a WD to explode. In the first one, a WD accretes matter from a non-degenerate star, known as the single degenerate (SD) model (Whelan & Iben, 1973). In the double degenerate (DD) model, the explosion results from the merger of two WDs (Iben & Tutukov, 1984; Webbink, 1984). Most SNe Ia are considered to be an explosion of Chandrasekhar mass WD (Mazzali et al., 2007) via delayed detonation (Khokhlov, 1991). However, if the accumulated material is He-rich, the explosion can occur at a sub-Chandrasekhar mass through double-detonation. With sufficiently rapid He accretion on the surface of a C/O WD, a detonation is first initiated within the helium layer. The emanating shock wave propagates through the WD and triggers carbon detonation at the center of the WD (Woosley & Weaver, 1994; Woosley & Kasen, 2011; Ruiter et al., 2014; Tanikawa et al., 2018). The donor star could be either a non-degenerate He star (SD channel), another C/O WD with He in the outer layer or a He WD (DD channel). This mechanism can explain normal and fast declining SNe Ia of different brightness distributions (Pakmor et al., 2013). Currently, it is difficult to identify which SN results from which channel (see Wang, 2018; Livio & Mazzali, 2018; Soker, 2019; Ruiter, 2020, for reviews).
With the increasing number of well-studied SNe Ia, it became clear that there is a considerable spread in the luminosity of SNe Ia. There are objects populating both the higher and lower luminosity end of normal objects (Li et al., 2011). Some have extreme properties that are significantly different from the normal class (Taubenberger, 2017).
A small group of extreme/peculiar objects (e.g., SN 2003fg: Howell et al. 2006, SN 2006gz: Hicken et al. 2007; Maeda et al. 2009, SN 2007if: Scalzo et al. 2010; Yuan et al. 2010, SN 2009dc: Yamanaka et al. 2009; Silverman et al. 2011; Taubenberger et al. 2011) are known to have broad light curves and generally have a brighter peak luminosity than predicted by their decline rate (Phillips et al., 1999). In most of these, the ejecta mass inferred through simple analytic modelling, and hence the progenitor mass is found to be higher than the Chandrasekhar mass, making them to be termed as super-Chandrasekhar SNe Ia or 03fg/09dc–like SNe Ia. They are UV blue and bright in the early phase. Near maximum spectra of 09dc–like SNe are similar to the normal events, characterized by intermediate-mass elements (IMEs) but with relatively narrow/weak spectral features. The photospheric velocity is found to be low, with a slow evolution. The presence of unburned carbon in the ejecta is often seen in the pre-maximum spectral sequence.
The light-curve and spectral evolution of SN 2012dn was similar to 09dc–like objects. However, it had weak carbon, relatively strong features from IMEs, and was fainter compared to other 09dc–like SNe Ia (Brown et al., 2014b; Chakradhari et al., 2014; Parrent et al., 2016; Yamanaka et al., 2016; Taubenberger et al., 2019). Now it appears that even this group (with some new members, e.g., ASASSN-15pz, LSQ14fmg, ASASSN-15hy and SN 2020esm) exhibits diverse observational properties (Chen et al., 2019; Hsiao et al., 2020; Lu et al., 2021; Ashall et al., 2021; Dimitriadis et al., 2022). The luminous type Ia SN 2020hvf (Jiang et al., 2021), SN 2021zny (Dimitriadis et al., 2023) and SN 2022ilv (Srivastav et al., 2023) were also found to be similar to 09dc–like SNe having broad light curves and strong carbon features in the early spectra. Early excess emission was seen in these SNe within a few hours of the explosion.
In this work, we present a detailed photometric and spectroscopic study of three SNe Ia: SN 2013bz, PSN J0910+5003 and ASASSN-16ex. They were initially classified as 09dc–like SNe Ia.
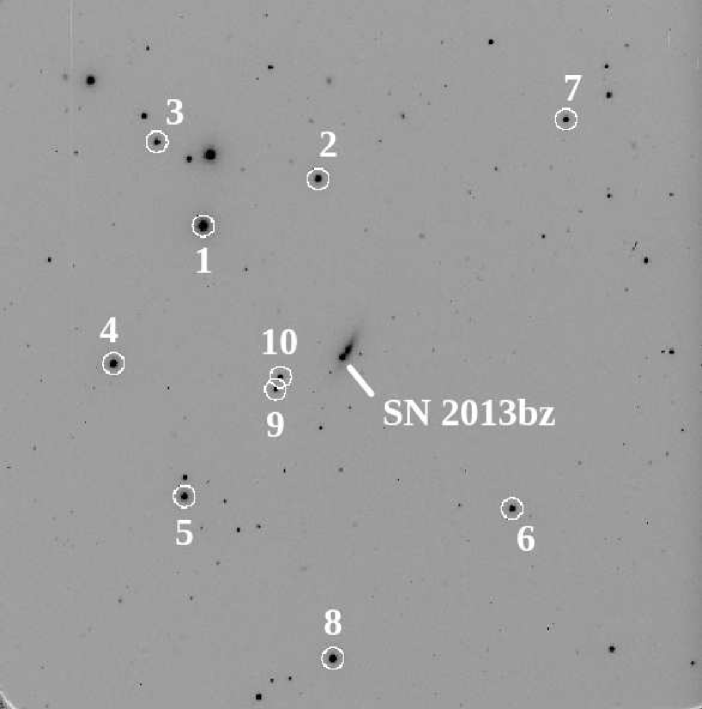
The Catalina Real-time Transient Survey discovered SN 2013bz on April 21.28 (time is always in ut), 2013 and classified it as a normal type Ia SN around the maximum. However, noted that it could also be an overluminous event (Howerton et al., 2013). Ochner et al. (2013) reported that the spectrum obtained on May 4.96, 2013, matched well with SNe 2006gz/09dc. SN was located at RA = 13:26:51.32, DEC = -10:01:32.2 (J2000), 7.5 arcsec East and 5.8 arcsec South to the nucleus of host galaxy PGC 170248 (Fig. 1, top).
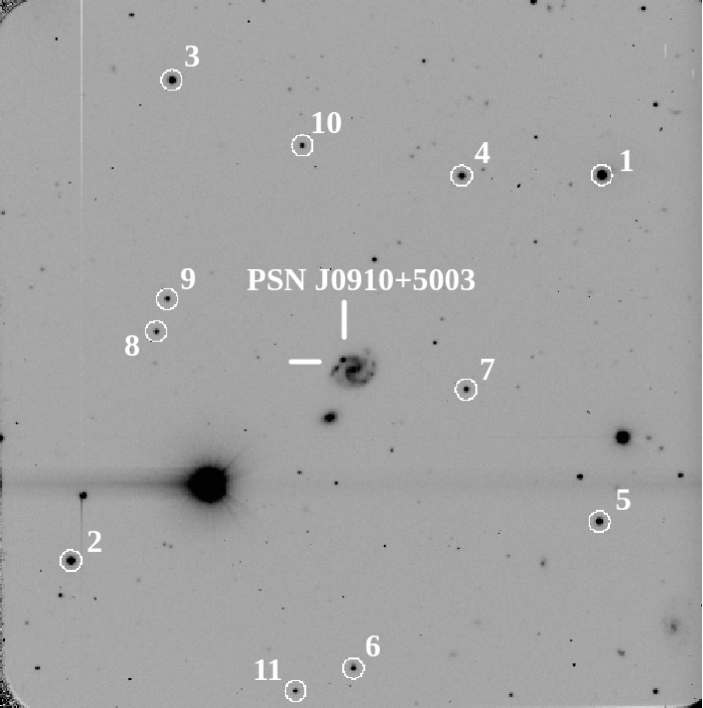
The Italian SNe Search Project discovered PSN J0910+5003 on November 8.17, 2015 (Ciabattari, Mazzoni & Petroni, 2015). The object was located at RA = 09:10:08.85, DEC = 50:03:39.6 (J2000), 9 arcsec East and 8 arcsec North of the centre of host galaxy UGC 4812 (Fig. 1, middle). A spectrum obtained on November 09.13, 2015, matched well with SN 2009dc about ten days before maximum light (Tomasella et al., 2015).
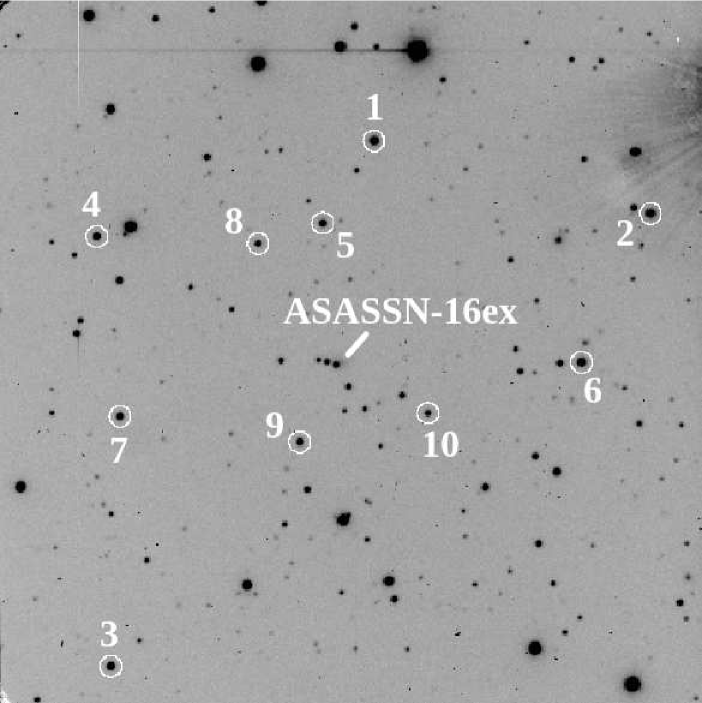
All Sky Automated Survey for SNe discovered ASASSN-16ex (SN 2016ccj) on May 03.43, 2016 (Kiyota et al., 2016). The SN was located at RA = 17:10:23.92, DEC= 26:23:47.89 (J2000), 1.9 arcsec South and 3.8 arcsec East from the centre of the host galaxy SDSS J171023.63+262350.3 (Fig. 1, bottom). Spectra obtained by Tomasella et al. (2016); Piascik & Steele (2016) matched well with SNe 2009dc/06gz, about 10–12 days before maximum. Prominent C ii lines (6580 Å and 7234 Å) were also detected in the spectra. The UV colours and absolute magnitudes of ASASSN-16ex were found to be blue and bright similar to 09dc–like events (Brown & Milne, 2016).
The layout of this paper is as follows. Observations and data reduction techniques are presented in Section 2. The light curves and colour curves are discussed in Section 3. Physical parameters of the SNe, e.g., peak absolute magnitude, bolometric luminosity and mass of 56Ni, etc., are estimated in Section 4. The spectral evolution and comparison with other well-studied SNe Ia are presented in Section 5. The results are discussed and summarized in Section 6. Throughout this paper, we adopt the Vega magnitude system.
2 OBSERVATIONS AND DATA REDUCTION
2.1 Imaging
SN 2013bz, PSN J0910+5003 and ASASSN-16ex were monitored using the 2-m Himalayan Chandra Telescope (HCT) of the Indian Astronomical Observatory (IAO111https://www.iiap.res.in/?q=iao.htm), Hanle, India. Observations were carried out in Bessell’s bands using the Himalaya Faint Object Spectrograph Camera (HFOSC).
Photometric monitoring of SN 2013bz started on May 02, 2013 and continued until July 04, 2013. Standard star fields PG 1633+099, PG 2213-006, PG 1525-71 and PG 1323-086 from Landolt (1992) were observed on six photometric nights (May 02, May 14, May 21, May 30, June 04 and July 04, 2013) to calibrate a sequence of secondary standards in the SN field.
Photometric observations of PSN J0910+5003 were carried out from November 10, 2015, to March 13, 2016. Standard star fields PG 0231+051, PG 0918+029, PG 2213-006, PG 1047+003 and PG 0942-029 were observed on five photometric nights (November 17, November 20, November 28, 2015; December 01, 2020; and March 01, 2021).
Photometric monitoring of ASASSN-16ex began on May 07, 2016, and continued till September 17, 2016. Standard star fields PG 1633+099, SA 110, PG 2213-006, PG 0231+051 and PG 2331+055 were observed on seven photometric nights (May 14, June 03, June 18, June 26, July 06, July 31 and October 04, 2016). Several bias frames and twilight flats necessary for pre-processing were also obtained during each observation.
The observed data were processed in a standard manner using the Image Reduction and Analysis Facility (iraf222https://iraf-community.github.io/) package. The observed Landolt standards were used to calibrate a sequence of secondary standards in the SNe field, following the procedures of Chakradhari et al. (2014); Chakradhari, Sahu & Anupama (2019). The mean magnitudes of secondary standards in the field of SN 2013bz, PSN J0910+5003 and ASASSN-16ex (marked in Fig. 1) are listed in Table 1.
| ID | U | B | V | R | I |
|---|---|---|---|---|---|
| SN 2013bz | |||||
| 1 | 14.34 0.02 | 14.22 0.03 | 13.51 0.02 | 13.20 0.03 | 12.81 0.02 |
| 2 | 15.64 0.02 | 15.61 0.03 | 14.92 0.02 | 14.60 0.02 | 14.18 0.02 |
| 3 | 15.60 0.02 | 15.78 0.03 | 15.16 0.02 | 14.85 0.02 | 14.43 0.01 |
| 4 | 14.92 0.01 | 15.08 0.03 | 14.47 0.02 | 14.18 0.02 | 13.78 0.02 |
| 5 | 15.20 0.01 | 15.36 0.02 | 14.75 0.02 | 14.46 0.02 | 14.06 0.01 |
| 6 | 16.51 0.03 | 16.28 0.02 | 15.52 0.02 | 15.17 0.02 | 14.73 0.02 |
| 7 | 17.14 0.05 | 16.63 0.02 | 15.73 0.02 | 15.30 0.02 | 14.77 0.01 |
| 8 | 15.66 0.03 | 15.36 0.02 | 14.54 0.02 | 14.19 0.03 | 13.71 0.02 |
| 9 | 17.65 0.05 | 16.92 0.03 | 15.96 0.02 | 15.50 0.02 | 14.98 0.01 |
| 10 | 16.76 0.03 | 16.74 0.02 | 16.05 0.02 | 15.73 0.02 | 15.31 0.02 |
| PSN J0910+5003 | |||||
| 1 | 14.43 0.04 | 14.51 0.04 | 13.94 0.02 | 13.59 0.02 | 13.35 0.02 |
| 2 | 16.11 0.04 | 15.80 0.02 | 15.02 0.01 | 14.56 0.02 | 14.17 0.04 |
| 3 | 17.58 0.01 | 16.50 0.04 | 15.39 0.02 | 14.73 0.02 | 14.16 0.01 |
| 4 | 17.44 0.01 | 16.61 0.04 | 15.62 0.03 | 15.05 0.02 | 14.57 0.02 |
| 5 | 17.02 0.04 | 16.49 0.04 | 15.62 0.02 | 15.12 0.02 | 14.66 0.03 |
| 6 | 19.10 0.05 | 18.06 0.04 | 16.92 0.03 | 16.29 0.03 | 15.73 0.03 |
| 7 | 19.57 0.08 | 18.54 0.03 | 17.04 0.03 | 16.12 0.01 | 15.25 0.03 |
| 8 | 18.65 0.01 | 18.19 0.04 | 17.32 0.02 | 16.86 0.04 | 16.44 0.04 |
| 9 | 19.90 0.02 | 18.92 0.03 | 17.45 0.02 | 16.36 0.03 | 15.01 0.03 |
| 10 | 19.21 0.02 | 18.52 0.03 | 17.51 0.03 | 16.93 0.03 | 16.38 0.03 |
| 11 | 19.42 0.01 | 18.54 0.08 | 17.51 0.04 | 16.87 0.04 | 16.27 0.04 |
| ASASSN-16ex | |||||
| 1 | 15.91 0.02 | 15.89 0.03 | 15.21 0.02 | 14.84 0.02 | 14.50 0.02 |
| 2 | 16.31 0.03 | 16.04 0.04 | 15.22 0.02 | 14.74 0.02 | 14.29 0.03 |
| 3 | 16.36 0.02 | 16.37 0.04 | 15.70 0.02 | 15.33 0.03 | 14.98 0.03 |
| 4 | 16.73 0.04 | 16.70 0.03 | 16.01 0.02 | 15.64 0.02 | 15.28 0.03 |
| 5 | 16.88 0.04 | 16.88 0.03 | 16.19 0.02 | 15.81 0.01 | 15.44 0.02 |
| 6 | 16.89 0.02 | 16.30 0.04 | 15.38 0.02 | 14.85 0.01 | 14.36 0.02 |
| 7 | 17.02 0.05 | 16.89 0.04 | 16.13 0.02 | 15.72 0.02 | 15.33 0.02 |
| 8 | 17.00 0.05 | 17.35 0.02 | 16.79 0.02 | 16.44 0.02 | 16.09 0.02 |
| 9 | 17.15 0.05 | 17.09 0.04 | 16.41 0.02 | 16.03 0.02 | 15.65 0.02 |
| 10 | 17.36 0.03 | 17.70 0.03 | 17.16 0.02 | 16.83 0.01 | 16.49 0.03 |
| All magnitudes are in the Vega system. | |||||
The host galaxy background significantly contaminated SN 2013bz and PSN J0910+5003. Template subtraction photometry was performed for these SNe to remove contribution from the host on the SN flux. Deep template frames of PGC 170248 and UGC 4812 fields were obtained in good seeing condition with the same instrumental setup on March 15, 2016, and March 01, 2021, respectively. Template image subtraction was performed in a standard manner using iraf cl-script. In the template subtracted frame, aperture photometry was performed on the SN and calibrated differentially with respect to the secondary standards. The estimated magnitudes of SN 2013bz and PSN J0910+5003 are listed in Table 2.
For ASASSN-16ex, profile-fitting photometry was used. The fitting radius was chosen close to the FWHM of the stellar profile. A correction factor was obtained from the difference between the aperture and profile fitting magnitudes using bright field stars. This correction factor was applied to the SN magnitude derived using profile fitting, which was then calibrated differentially with respect to the secondary standards in the field. The derived magnitudes of ASASSN-16ex are listed in Table 2. The magnitudes presented in this paper are not K-corrected.
| Date | JD | Phasea | U | B | V | R | I |
|---|---|---|---|---|---|---|---|
| SN 2013bz | |||||||
| 02/05/2013 | 245 6415.22 | 5.72 | 15.49 0.02 | 15.90 0.01 | 15.55 0.01 | 15.52 0.01 | 15.72 0.01 |
| 03/05/2013 | 245 6416.16 | 6.66 | 15.93 0.01 | 15.54 0.01 | 15.54 0.01 | 15.79 0.03 | |
| 05/05/2013 | 245 6418.18 | 8.68 | 16.09 0.01 | 15.65 0.01 | 15.66 0.01 | 15.94 0.02 | |
| 06/05/2013 | 245 6419.22 | 9.72 | 15.77 0.01 | 16.11 0.01 | 15.71 0.01 | 15.74 0.02 | 16.01 0.02 |
| 08/05/2013 | 245 6421.24 | 11.74 | 15.94 0.02 | 16.30 0.02 | 15.83 0.01 | 15.96 0.01 | 16.19 0.01 |
| 14/05/2013 | 245 6427.13 | 17.63 | 16.91 0.01 | 16.17 0.01 | 16.19 0.01 | 16.19 0.02 | |
| 18/05/2013 | 245 6431.21 | 21.71 | 17.36 0.01 | 16.32 0.01 | 16.17 0.01 | 16.03 0.01 | |
| 20/05/2013 | 245 6433.21 | 23.71 | 17.77 0.17 | 17.56 0.02 | 16.40 0.01 | 16.10 0.02 | 16.01 0.01 |
| 21/05/2013 | 245 6434.26 | 24.76 | 17.85 0.02 | 16.55 0.02 | 16.34 0.05 | 16.16 0.08 | |
| 27/05/2013 | 245 6440.18 | 30.68 | 18.25 0.02 | 16.80 0.02 | 16.44 0.01 | 16.08 0.02 | |
| 28/05/2013 | 245 6441.23 | 31.73 | 16.87 0.01 | 16.53 0.02 | 16.09 0.01 | ||
| 29/05/2013 | 245 6442.22 | 32.72 | 18.37 0.05 | 18.34 0.01 | 16.89 0.01 | 16.52 0.01 | 16.06 0.02 |
| 30/05/2013 | 245 6443.23 | 33.73 | 18.42 0.03 | 18.40 0.01 | 16.96 0.01 | 16.57 0.01 | 16.14 0.02 |
| 31/05/2013 | 245 6444.19 | 34.69 | 18.40 0.04 | 18.43 0.01 | 16.97 0.01 | 16.66 0.01 | 16.28 0.02 |
| 04/06/2013 | 245 6448.21 | 38.71 | 18.69 0.04 | 18.66 0.01 | 17.30 0.01 | 16.89 0.02 | 16.47 0.02 |
| 13/06/2013 | 245 6457.23 | 47.73 | 18.72 0.03 | 17.57 0.05 | 17.35 0.02 | 16.94 0.03 | |
| 04/07/2013 | 245 6478.17 | 68.67 | 18.98 0.05 | 19.17 0.02 | 18.19 0.01 | 18.13 0.02 | 18.15 0.03 |
| PSN J0910+5003 | |||||||
| 10/11/2015 | 245 7337.46 | 9.54 | 17.71 0.04 | 17.65 0.03 | 17.54 0.02 | 17.55 0.02 | |
| 17/11/2015 | 245 7344.38 | 2.62 | 16.70 0.11 | 17.16 0.03 | 17.02 0.02 | 16.89 0.02 | 16.93 0.02 |
| 19/11/2015 | 245 7346.49 | 0.51 | 17.15 0.05 | 16.99 0.04 | 16.82 0.06 | 16.94 0.03 | |
| 20/11/2015 | 245 7347.42 | 0.42 | 17.12 0.03 | 16.95 0.02 | 16.79 0.02 | 16.97 0.02 | |
| 22/11/2015 | 245 7349.45 | 2.45 | 16.69 0.04 | 17.18 0.07 | 16.92 0.03 | 16.71 0.02 | 16.80 0.05 |
| 27/11/2015 | 245 7354.44 | 7.44 | 17.07 0.17 | 17.32 0.04 | 16.91 0.04 | 16.73 0.04 | 16.89 0.04 |
| 28/11/2015 | 245 7355.42 | 8.42 | 17.49 0.08 | 16.95 0.03 | 16.79 0.10 | 16.80 0.04 | |
| 01/12/2015 | 245 7358.46 | 11.46 | 17.57 0.04 | 17.03 0.03 | 16.80 0.02 | 16.91 0.04 | |
| 09/12/2015 | 245 7366.39 | 19.39 | 18.13 0.03 | 17.31 0.02 | 17.06 0.02 | 16.97 0.04 | |
| 20/12/2015 | 245 7377.52 | 30.52 | 19.12 0.11 | 17.75 0.02 | 17.32 0.02 | 17.02 0.06 | |
| 23/12/2015 | 245 7380.43 | 33.43 | 19.17 0.12 | 17.87 0.03 | 17.35 0.03 | 16.98 0.02 | |
| 19/01/2016 | 245 7407.50 | 60.50 | 18.64 0.03 | 18.28 0.03 | 17.86 0.05 | ||
| 25/01/2016 | 245 7413.27 | 66.27 | 18.80 0.04 | 18.30 0.04 | 17.96 0.04 | ||
| 20/02/2016 | 245 7439.21 | 92.21 | 18.98 0.06 | 18.40 0.06 | |||
| 13/03/2016 | 245 7461.22 | 114.22 | 20.39 0.10 | 19.71 0.04 | 19.53 0.05 | 18.93 0.06 | |
| ASASSN-16ex | |||||||
| 07/05/2016 | 245 7516.38 | 6.87 | 16.41 0.02 | 17.07 0.02 | 17.03 0.01 | 17.01 0.01 | 17.16 0.03 |
| 12/05/2016 | 245 7521.15 | 2.10 | 16.22 0.05 | 16.86 0.01 | 16.81 0.01 | 16.79 0.02 | 16.92 0.04 |
| 14/05/2016 | 245 7523.25 | 0.00 | 16.26 0.03 | 16.84 0.01 | 16.78 0.02 | 16.78 0.01 | 16.95 0.03 |
| 16/05/2016 | 245 7525.28 | 2.03 | 16.28 0.03 | 16.85 0.02 | 16.78 0.01 | 16.78 0.02 | 16.95 0.04 |
| 21/05/2016 | 245 7530.25 | 7.00 | 16.59 0.05 | 17.04 0.03 | 16.89 0.03 | 16.90 0.02 | 17.12 0.04 |
| 03/06/2016 | 245 7543.36 | 20.11 | 17.93 0.01 | 17.33 0.01 | 17.21 0.01 | 17.27 0.02 | |
| 10/06/2016 | 245 7550.42 | 27.17 | 18.46 0.01 | 17.59 0.02 | 17.30 0.01 | 17.24 0.02 | |
| 18/06/2016 | 245 7558.31 | 35.06 | 18.89 0.05 | 19.04 0.03 | 17.95 0.02 | 17.58 0.04 | 17.40 0.02 |
| 21/06/2016 | 245 7561.25 | 38.00 | 19.07 0.08 | 19.14 0.03 | 18.06 0.02 | 17.65 0.02 | 17.45 0.02 |
| 26/06/2016 | 245 7566.37 | 43.12 | 19.33 0.02 | 18.26 0.01 | 17.85 0.02 | 17.55 0.02 | |
| 06/07/2016 | 245 7576.17 | 52.92 | 19.47 0.02 | 18.46 0.01 | 18.20 0.03 | 17.94 0.04 | |
| 10/07/2016 | 245 7580.16 | 56.91 | 18.36 0.02 | ||||
| 31/07/2016 | 245 7601.13 | 77.88 | 19.04 0.01 | 18.87 0.02 | 18.73 0.02 | ||
| 14/08/2016 | 245 7615.26 | 92.01 | 20.01 0.04 | 19.28 0.02 | 19.12 0.02 | 18.99 0.04 | |
| 17/09/2016 | 245 7649.17 | 125.92 | 20.48 0.10 | 19.96 0.04 | 19.88 0.08 | 19.89 0.12 | |
| ain days with respect to the epoch of the band maximum. All magnitudes are in the Vega system. | |||||||
| JD | Phasea | ||||||
|---|---|---|---|---|---|---|---|
| 245 7514.46 | 8.79 | 18.43 0.18 | 18.04 0.12 | 17.12 0.10 | 16.28 0.06 | 17.24 0.08 | 17.32 0.18 |
| 245 7517.70 | 5.55 | 18.05 0.15 | 17.71 0.11 | 17.02 0.09 | 16.14 0.07 | 17.01 0.08 | 16.90 0.14 |
| 245 7522.75 | 0.50 | 18.21 0.17 | 18.09 0.15 | 17.06 0.10 | 16.10 0.07 | 16.94 0.08 | 16.78 0.13 |
| 245 7530.21 | 6.96 | 18.94 0.21 | 18.71 0.19 | 18.05 0.16 | 16.54 0.07 | 16.98 0.07 | 16.76 0.11 |
| 245 7532.67 | 9.42 | 19.85 0.78 | 19.36 0.67 | 18.19 0.26 | 16.83 0.14 | 17.06 0.12 | 17.02 0.23 |
| 245 7537.52 | 14.27 | 19.75 0.50 | 19.86 0.54 | 18.94 0.35 | 17.27 0.13 | 17.41 0.10 | 17.35 0.22 |
| 245 7539.32 | 16.07 | 20.01 0.55 | 19.91 0.45 | 18.92 0.29 | 17.73 0.17 | 17.50 0.11 | 17.20 0.16 |
| 245 7541.85 | 18.60 | 20.28 1.23 | 19.94 0.51 | 18.01 0.33 | 17.60 0.16 | 17.19 0.27 | |
| 245 7544.50 | 21.25 | 20.16 0.71 | 19.88 0.50 | 19.17 0.44 | 18.27 0.33 | 17.80 0.14 | 17.40 0.26 |
| 245 7547.84 | 24.59 | 19.15 0.24 | 18.44 0.15 | 18.19 0.14 | 17.74 0.56 | ||
| 245 7551.21 | 27.96 | 19.33 0.18 | 18.72 0.12 | 18.56 0.13 | 17.66 0.14 | ||
| 245 7553.54 | 30.29 | 19.49 0.31 | 18.77 0.20 | 18.86 0.24 | 17.79 0.19 | ||
| 245 7557.45 | 34.20 | 19.82 0.49 | 18.92 0.29 | 19.00 0.30 | 18.02 0.28 | ||
| 245 7565.88 | 42.63 | 19.91 0.43 | 19.42 0.35 | 19.36 0.29 | 18.28 0.36 | ||
| 245 7572.28 | 49.03 | 20.19 0.35 | 19.68 0.25 | 19.34 0.18 | |||
| ain days with respect to the epoch of the band maximum. All magnitudes are in the Vega system. | |||||||
2.1.1 UV–optical photometry of ASASSN-16ex using UVOT.
ASASSN-16ex was also observed with the Ultraviolet/Optical Telescope (UVOT; Roming et al. 2005) onboard the Neil Gehrels Swift Observatory. Raw imaging data in the three broad-band UV filters (: 1928 Å, : 2246 Å, : 2600 Å) and three broad-band optical filters (: 3465 Å, : 4392 Å, : 5468 Å) were accessed from the Swift database. Data processing was done using various packages available in the High Energy Astrophysics Software (heasoft333https://heasarc.gsfc.nasa.gov/docs/software/heasoft/), following methods outlined in Poole et al. (2008), Brown et al. (2009); Brown et al. (2014a) and Breeveld et al. (2011). The UV–optical magnitudes of ASASSN-16ex are listed in Table 3.
2.2 Spectroscopy
Medium resolution ( 7 Å) spectra of SN 2013bz, PSN J0910+5003 and ASASSN-16ex were obtained using the HFOSC-HCT. Two grisms, Gr7 (3500–7000 Å) and Gr8 (5200–9200 Å), were used to cover the optical wavelength range. A log of spectroscopic observation is given in Table 4. Besides bias and flat frames, spectra of FeNe and FeAr arc lamps were taken for wavelength calibration. Spectra of spectrophotometric standards were obtained to correct for the instrumental response.
Spectroscopic data were reduced using iraf in a standard manner, as discussed in Chakradhari et al. (2014, 2019). The final spectra were corrected for reddening (refer to Section 4.1) and redshift using = 0.019 for SN 2013bz (source NED), = 0.034 for PSN J0910+5003 (source NED), and = 0.04 for ASASSN-16ex (Foley et al., 2018).
| Date | JDa | Phaseb | Range (Å) |
| SN 2013bz | |||
| 30/04/2013 | 6413.30 | 3.80 | 3500–7000 |
| 02/05/2013 | 6415.16 | 5.66 | 3500–7000; 5200–9100 |
| 03/05/2013 | 6416.18 | 6.68 | 3500–7000; 5200–9100 |
| 06/05/2013 | 6419.26 | 9.76 | 3500–7000 |
| 09/05/2013 | 6422.19 | 12.69 | 3500–7000; 5200–9100 |
| 14/05/2013 | 6427.14 | 17.64 | 3500–7000; 5200–9100 |
| 20/05/2013 | 6433.25 | 23.75 | 3500–7000; 5200–9100 |
| 21/05/2013 | 6434.34 | 24.84 | 3500–7000 |
| 27/05/2013 | 6440.22 | 30.72 | 3500–7000; 5200–9100 |
| 29/05/2013 | 6442.24 | 32.74 | 3500–7000; 5200–9100 |
| 31/05/2013 | 6444.22 | 34.72 | 3500–7000; 5200–9100 |
| PSN J0910+5003 | |||
| 17/11/2015 | 7344.42 | 2.58 | 3500–7000; 5200–9100 |
| 20/11/2015 | 7347.44 | 0.44 | 3500–7000; 5200–9100 |
| 27/11/2015 | 7354.39 | 7.39 | 3500–7000; 5200–9100 |
| 28/11/2015 | 7355.36 | 8.36 | 3500–7000; 5200–9100 |
| 09/12/2015 | 7366.41 | 19.41 | 3500–7000; 5200–9100 |
| 20/12/2015 | 7377.45 | 30.45 | 3500–7000; 5200–9100 |
| 19/01/2016 | 7407.41 | 60.41 | 3500–7000; 5200–9100 |
| 22/01/2016 | 7410.24 | 63.24 | 3500–7000; 5200–9100 |
| ASASSN-16ex | |||
| 06/05/2016 | 7515.42 | 7.83 | 3500–7000 |
| 08/05/2016 | 7517.41 | 5.84 | 3500–7000; 5200–9100 |
| 13/05/2016 | 7522.17 | 1.08 | 3500–7000; 5200–9100 |
| 14/05/2016 | 7523.16 | 0.09 | 3500–7000; 5200–9100 |
| 21/05/2016 | 7530.27 | 7.02 | 3500–7000; 5200–9100 |
| 11/06/2016 | 7551.18 | 27.93 | 3500–7000 |
| 19/06/2016 | 7559.35 | 36.10 | 3500–7000; 5200–9100 |
| 26/06/2016 | 7566.30 | 43.05 | 3500–7000 |
| a2450000+; bin days from the band maximum. | |||
3 Light curves and Colour Curves
The estimated magnitudes of SN 2013bz, PSN J0910+5003 and ASASSN-16ex are plotted in Fig. 2, Fig. 3 and Fig. 4, respectively. UV–optical data of ASASSN-16ex from Swift UVOT are also plotted in Fig. 4. In order to understand the characteristics of these SNe; we derived various photometric parameters from their light curves and are listed in Table 5 and Table 6.
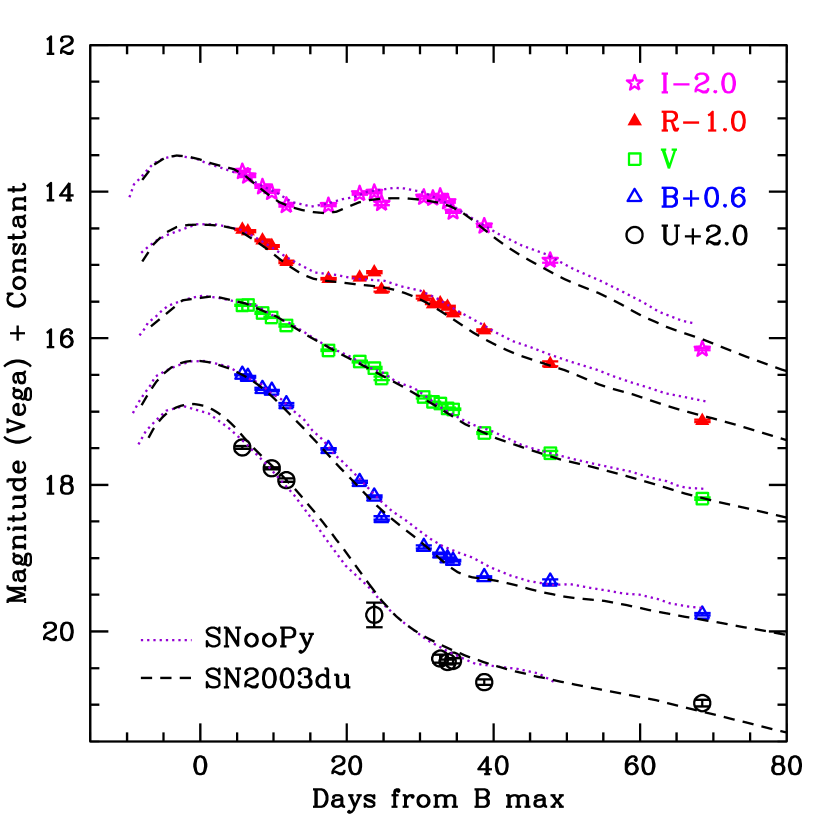
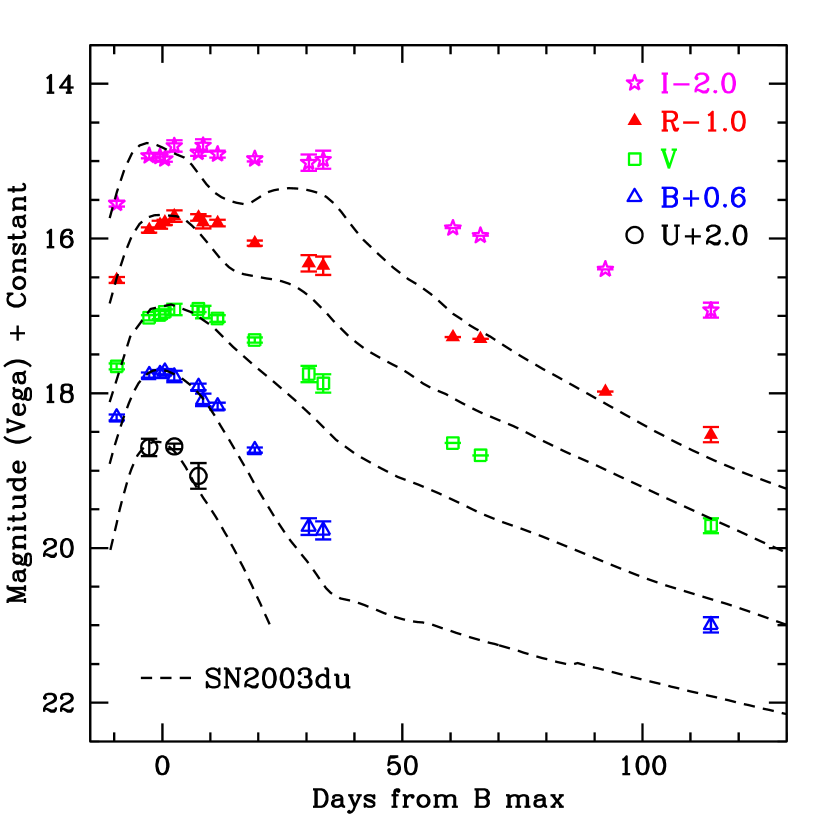
Our observation of SN 2013bz started in the post-maximum phase; hence we used max-model of SNooPy (Burns et al., 2011) package to fit templates and derive light curve parameters. The best-matching template light curves are over-plotted onto the observed light curves (Fig. 2). SN 2013bz reached maximum brightness in the band on JD 245 6409.5 0.8 with an apparent brightness of 15.71 0.04 mag. Similar to the normal and 91T–like SNe Ia, in SN 2013bz, the maxima in and bands precede, and those in the and bands follow the band maximum (refer to Table 5). The decline in the band brightness 15 days after the maximum is estimated as = 0.91 0.04 mag and = 0.92 0.04 (Phillips et al., 1999; Folatelli et al., 2010). The estimated decline rate parameter for SN 2013bz is smaller than the normal SNe Ia, suggesting it to be a luminous event (Phillips et al., 1999). The decline rates in other bands are listed in Table 6. A distinct and pronounced secondary peak in the band light curve, a characteristic feature of normal and 91T–like SNe Ia, is seen +30 d. A small hump is also seen in the band light curve at a similar phase. The band secondary maximum timing agrees with its derived (Hamuy et al., 1996; Kasen, 2006; Folatelli et al., 2010). The light curves of a typical Ia event SN 2003du (Anupama, Sahu & Jose, 2005) are also plotted along with SN 2013bz in Fig. 2. From a quick comparison, it is apparent that the light curves of SN 2013bz are similar to a normal Ia event.
In the case of PSN J0910+5003 and ASASSN-16ex, our observations started well before the maximum phase. We fitted a cubic spline function to the data points around the maximum to estimate the date of maximum and magnitude at maximum. PSN J0910+5003 reached maximum brightness in the band on JD 245 7347.0 0.6 with 17.13 0.04 mag. The decline rate parameter is estimated as = 0.69 0.04 and = 0.70 0.04. The decline rate of PSN J0910+5003 is slower than the normal SNe Ia. The important photometric parameters derived for PSN J0910+5003 are listed in Table 6.
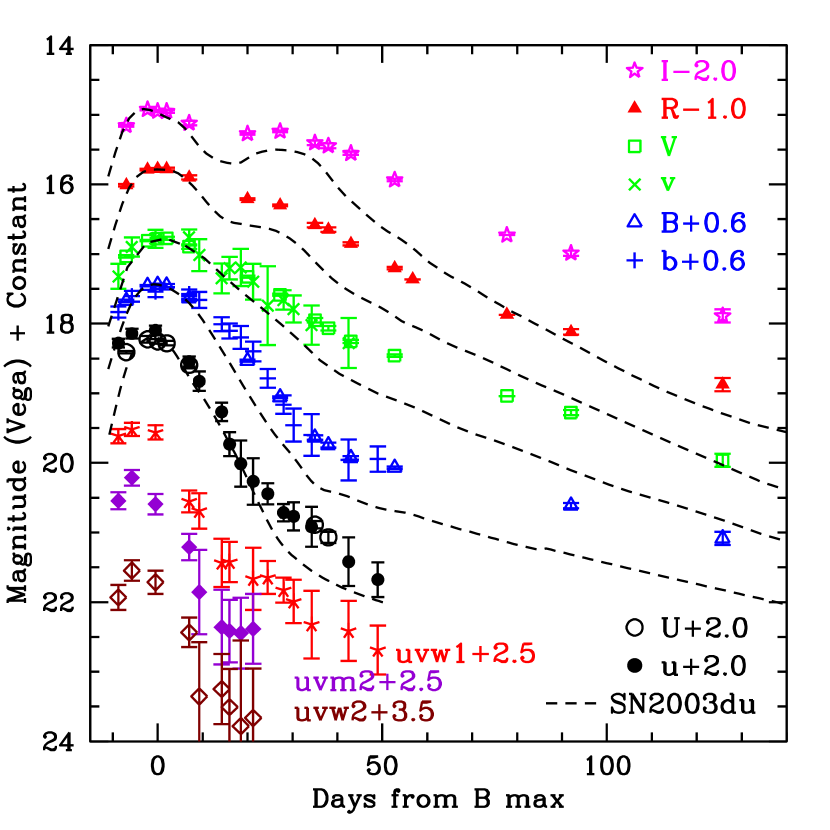
ASASSN-16ex reached maximum light on JD 245 7523.25 0.5 with 16.84 0.03 mag. The decline rate parameter for ASASSN-16ex is estimated as = 0.72 0.03 and = 0.73 0.03. The important light curve parameters derived for ASASSN-16ex (including data from UVOT) are listed in Table 6.
The slow declining nature of PSN J0910+5003 and ASASSN-16ex is obvious from an immediate comparison of their light curves (refer to Fig. 3, 4) with the light curves of the normal Type Ia SN 2003du. It is interesting to note that for both PSN J0910+5003 and ASASSN-16ex, is close to 09dc–like SNe Ia: SN 2009dc ( = 0.71; Taubenberger et al. 2011), SN 2007if ( = 0.71; Scalzo et al. 2010), SN 2006gz ( = 0.69; Hicken et al. 2007), ASASSN-15pz ( = 0.67; Chen et al. 2019, and ASASSN-15hy ( = 0.72; Lu et al. 2021).
Timing of maximum brightness in , , and bands for PSN J0910+5003, ASASSN-16ex and some other well-studied SNe Ia are listed in Table 5. In PSN J0910+5003, the band peak appears much later (6 d) than the band, similar to 09dc–like SNe Ia. In contrast, the band peak in ASASSN-16ex follows the trend of normal SNe Ia.
In Fig. 5, light curves of SN 2013bz, PSN J0910+5003 and ASASSN-16ex are compared with those of well-studied normal SNe Ia: SN 2003du ( = 1.04; Anupama et al. 2005), SN 2005cf ( = 1.11; Pastorello et al. 2007), SN 2011fe ( = 1.07; Richmond & Smith 2012; Vinkó et al. 2012; Brown et al. 2012), the luminous SN 1991T ( = 0.95; Lira et al. 1998), and 09dc–like SNe Ia: SN 2006gz (Hicken et al. 2007), SN 2007if (Scalzo et al. 2010), SN 2009dc (Taubenberger et al. 2011), ASASSN-15pz (Chen et al. 2019), SN 2012dn ( = 0.92; Chakradhari et al. 2014) and SN 2011aa ( = 0.59; Dutta et al. 2022). All the light curves are shifted to match their peak brightness and the epoch of the band maximum.
The comparison shows that SN 2013bz closely follows the light curves of normal type Ia SNe 2003du/05cf/11fe in bands. The trough in between band primary and secondary maxima, the strength of the band secondary maximum, and the shoulder in the band also match those of normal SNe Ia (refer to Fig. 6 for a zoomed view). Though the decline rate parameter, , is lower than that of a typical SN Ia, SN 2013bz appears to be a perfectly normal type Ia event.
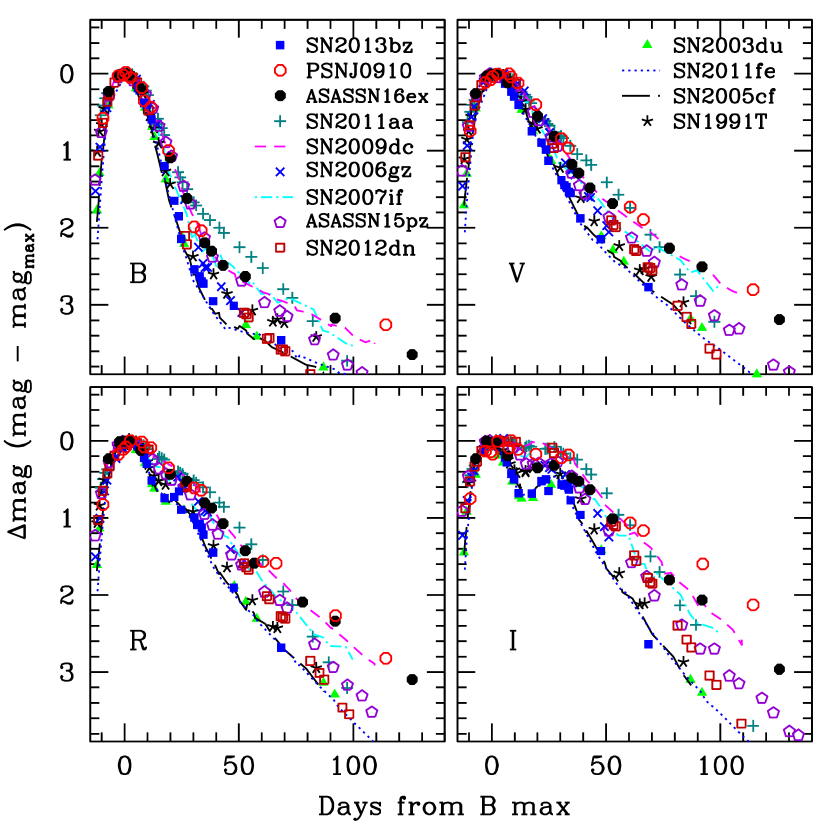
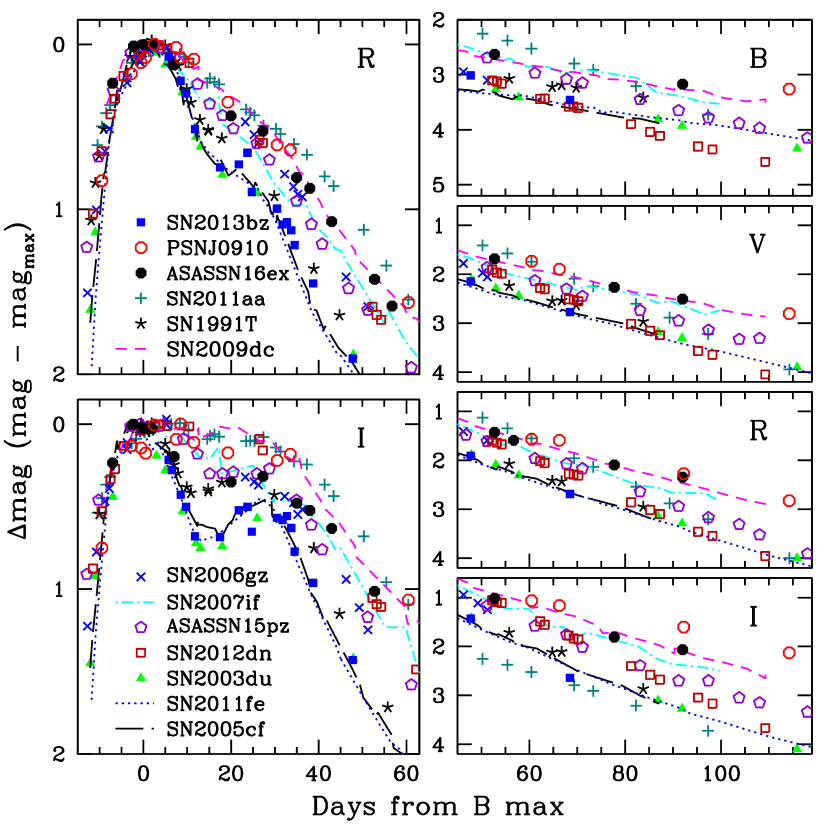
On the other hand, light curves of PSN J0910+5003 and ASASSN-16ex are broad and closely follow the 09dc–like events. Similar to 09dc–like SNe, band light curves of PSN J0910+5003 and ASASSN-16ex appear flat during the early post-maximum phase (till 40 d); in the later phase they also follow 09dc–like SNe. An enhanced fading is seen in the light curves of 09dc–like SNe in the nebular phase. In some events, e.g., SN 2012dn, ASASSN-15pz and LSQ14fmg, it was observed quite early (1–3 months from the maximum phase). This is not observed in PSN J0910+5003 and ASASSN-16ex until our last observations ( 126 d, refer to Fig. 6, right panel).
The decline rates of ASASSN-16ex and PSN J0910+5003 in bands during 50–100 d are estimated by a linear fit and listed in Table 6. The late phase decline of ASASSN-16ex and PSN J0910+5003 light curves are comparable to SNe 2007if/09dc.
| Object | U | V | R | I | Ref.a |
| SN 2013bz | 2.0 | +0.2 | +1.0 | 3.0 | 1 |
| PSN J0910+5003 | - | +5.0 | +4.0 | +6.0 | 1 |
| ASASSN-16ex | 1.5 | +1.5 | 0 | 1.8 | 1 |
| SN 2006gz | 3.0 | +2.0 | +6.0 | +6.0 | 2 |
| SN 2009dc | 2.0 | 0 | +1.0 | +2 | 3 |
| SN 2012dn | 2.5 | +1.6 | +2.6 | +3 | 4 |
| ASASSN-15pz | - | 0 | +1 | +0.4 | 5 |
| ASASSN-15hy | 6.0 | +3.0 | +5.5 | +7.3 | 6 |
| LSQ14fmg | - | 1.0 | +1 | +1 | 7 |
| SN 2020esm | 4.0 | 0 | +3.5 | +5 | 8 |
| SN 2020hvf | 4.0 | +1.0 | +1.8 | +2.7 | 9 |
| SN 2011aa | 0.3 | +3.8 | +4.5 | +7.1 | 10 |
| SN 2003du | 1.3 | +1.0 | +0.3 | 1.9 | 11 |
| SN 2005cf | 1.6 | +1.3 | +0.6 | 2.0 | 12 |
| SN 2011fe | 1.4 | +1.0 | +0.6 | 2.9 | 13, 14 |
| SN 1991T | 1.7 | +2.6 | +1.4 | 0.4 | 15 |
| a1. This work, 2. Hicken et al. (2007) | |||||
| 3. Taubenberger et al. (2011) | |||||
| 4. Chakradhari et al. (2014), 5. Chen et al. (2019) | |||||
| 6. Lu et al. (2021), 7. Hsiao et al. (2020) | |||||
| 8. Dimitriadis et al. (2022), 9. Jiang et al. (2021) | |||||
| 10. Dutta et al. (2022), 11. Anupama et al. (2005) | |||||
| 12. Pastorello et al. (2007), 13. Richmond & Smith (2012) | |||||
| 14. Pereira et al. (2013), 15. Lira et al. (1998) | |||||
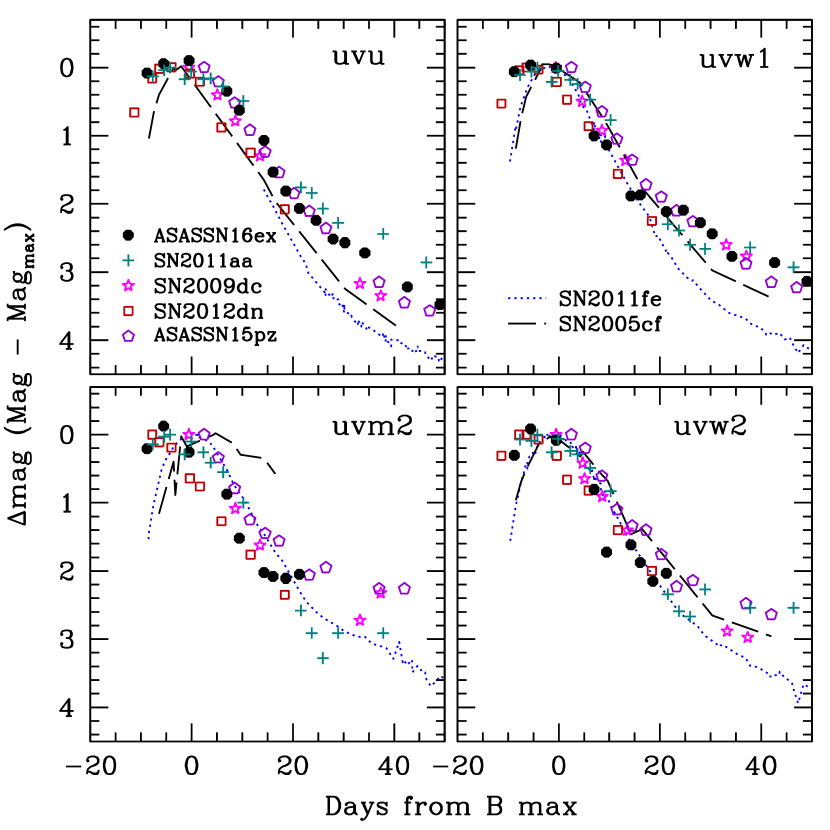
In Fig. 7, the light curves of ASASSN-16ex in , , , and bands are compared with normal and 09dc–like SNe Ia. It is clear that the light curves of ASASSN-16ex in all the bands are distinct from normal SNe 2005cf/11fe and closely follow the 09dc–like SNe. Similar to 09dc–like SNe, the light curves of ASASSN-16ex in , , and reached maximum light a few days before the normal SNe 2005cf/11fe. Also, the light curves of ASASSN-16ex and 09dc–like SNe are broader than the normal events.
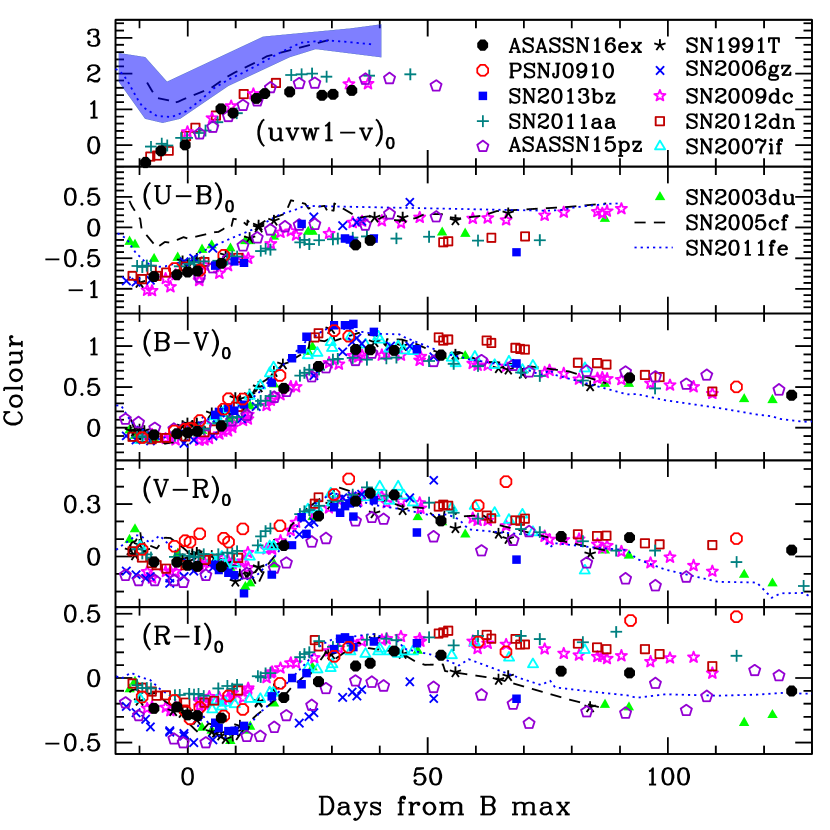
The reddening (refer to Section 4.1) corrected , , , and colour curves of SN 2013bz, PSN J0910+5003 and ASASSN-16ex are plotted in Fig. 8. Colour curves of well-studied SNe Ia (used in the light curve comparison) are also plotted in Fig. 8. They are corrected for reddening, as mentioned in their respective references.
The colour evolution of ASASSN-16ex is similar to 09dc–like SNe. The normal SNe 2005cf/11fe are redder in the early phase and evolve to blue with the bluest value a few days before the band maximum. Their colour evolution makes a characteristic ‘V’-shape pattern (Milne et al., 2013; Brown et al., 2014b). However, ASASSN-16ex is bluer by 1 mag in the early phase and reddens monotonically, similar to other 09dc–like SNe. Milne et al. (2013) have divided normal SNe Ia into NUV-blue and NUV-red categories based on the (near-UV optical) colour evolution. The shaded region in Fig. 8 (top panel) shows the colour evolution of normal SNe Ia (which includes NUV-blue and NUV-red objects; Milne et al. 2013; Brown et al. 2014b). With a significantly blue (near-UV optical) colour, ASASSN-16ex and 09dc–like SNe Ia are clearly distinguishable from normal SNe Ia. This colour criterion can be used to separate 09dc–like objects from the SNe Ia sample with a precise host extinction estimate. The colour of SN 2013bz, PSN J0910+5003 and ASASSN-16ex is bluer relative to normal events.
The colour of SN 2013bz follows those of normal SNe Ia, while ASASSN-16ex follows the evolution of 09dc–like SNe 2006gz/09dc/ASASSN-15pz in the complete phase range. The 09dc–like SNe 2006gz/09dc/ASASSN-15pz have a bluer curve during 0 to +50 d, while normal SNe 2003du/05cf/11fe and 91T have a relatively red colour. PSN J0910+5003 appears to follow the redder path similar to normal SNe Ia.
The colour of ASASSN-16ex is similar to SN 2009dc up to 100 d; PSN J0910+5003 have a more gradual and redder colour evolution. The colour of ASASSN-16ex is a little bluer but similar to SN 2009dc, while PSN J0910+5003 have a colour similar to SN 2007if. Compared to normal events, the and colours of 09dc–like SNe show less evolution, i.e., red to blue change, because of their broad light curves. The scatter in the colours within the 09dc–like SNe group can be attributed to their differing light curves. The and colours of SN 2013bz are similar to normal events.
| Band | JD (max) | Decline ratea | |||
|---|---|---|---|---|---|
| SN 2013bz | (35–70 d) | ||||
| 245 6407.2 0.8 | 14.93 0.06 | 20.53 0.20 | 1.21 0.06 | 1.52 | |
| 245 6409.5 0.8 | 15.71 0.04 | 19.61 0.20 | 0.91 0.04 | 2.07 | |
| 245 6409.7 0.8 | 15.42 0.04 | 19.70 0.20 | 0.57 0.04 | 3.48 | |
| 245 6410.2 0.8 | 15.44 0.07 | 19.53 0.20 | 0.66 0.07 | 4.38 | |
| 245 6406.3 0.8 | 15.51 0.09 | 19.30 0.20 | 0.59 0.09 | 5.62 | |
| PSN J0910+5003 | (50–100 d) | ||||
| 245 7347.0 0.6 | 17.13 0.05 | 19.44 0.20 | 0.69 0.05 | 1.51 | |
| 245 7352.0 0.8 | 16.90 0.04 | 19.48 0.20 | 0.44 0.04 | 1.96 | |
| 245 7351.2 0.8 | 16.70 0.05 | 19.54 0.20 | 0.35 0.04 | 2.43 | |
| 245 7353.0 0.9 | 16.80 0.05 | 19.29 0.20 | 0.18 0.05 | 1.95 | |
| ASASSN-16ex | (50–100 d) | ||||
| 245 7517.7 0.6 | 18.05 0.15 | 18.80 0.30 | 1.27 0.15 | - | |
| 245 7517.7 0.6 | 17.71 0.11 | 19.36 0.30 | 1.51 0.11 | - | |
| 245 7517.7 0.6 | 17.02 0.09 | 19.75 0.30 | 1.26 0.09 | - | |
| 245 7521.7 0.7 | 16.23 0.05 | 20.47 0.20 | 0.91 0.05 | - | |
| 245 7523.2 0.5 | 16.84 0.03 | 19.78 0.20 | 0.72 0.03 | 2.14 | |
| 245 7524.7 0.5 | 16.77 0.03 | 19.71 0.20 | 0.43 0.03 | 2.14 | |
| 245 7523.2 0.6 | 16.78 0.03 | 19.62 0.20 | 0.35 0.03 | 2.54 | |
| 245 7521.5 0.6 | 16.94 0.04 | 19.35 0.20 | 0.31 0.04 | 2.97 | |
| ain unit of mag (100 d)-1. | |||||
4 ABSOLUTE LIGHT CURVES and BOLOMETRIC LUMINOSITY
4.1 Reddening Estimate
The Galactic reddening for SN 2013bz is = 0.04 0.002 mag (Schlafly & Finkbeiner, 2011). Empirical relations (Phillips et al., 1999; Altavilla et al., 2004; Reindl et al., 2005; Wang et al., 2006; Folatelli et al., 2010) suggest a large total reddening, = 0.30 – 0.40 mag. SNooPy fit suggests a reddening of = 0.21 0.06 mag. A strong Na i D feature is seen at the rest frame of the host galaxy in the spectra of SN 2013bz with an average equivalent width (EW) of 1.9 0.2 Å. The Milky way component of Na i D feature is not detectable. The measured EW (Na i D) translates into = 0.29 0.03 mag (Turatto, Benetti & Cappellaro, 2003), close to the value obtained using other empirical relations. We found that the observed colour curve of SN 2013bz matches well with normal SNe Ia (refer to Fig. 8) when it is dereddened by = 0.19 0.04 mag. This estimate is close to the value suggested by the SNooPy fit and is used for further analysis.
The Galactic reddening for PSN J0910+5003 is = 0.02 0.001 mag (Schlafly & Finkbeiner, 2011). The empirical relations using photometry suggest 0.25 mag. The Na i D features are not detected in the spectra of PSN J0910+5003. The observed colour curve of PSN J0910+5003 matches well with other well-studied SNe Ia (refer to Fig. 8) after correcting it by = 0.18 0.05 mag, which we use in our analysis.
The Galactic reddening for ASASSN-16ex is = 0.03 0.001 mag (Schlafly & Finkbeiner, 2011). The empirical relations suggest 0.11 – 0.18 mag. No feature of Na i D is detected in the spectra of ASASSN-16ex. It was shown (refer to Section 3) that the photometric properties of ASASSN-16ex closely resemble 09dc–like SNe Ia. Chen et al. (2019) found that among 09dc–like SNe, ASASSN-15pz suffered minimal reddening, and its colour evolution can be used to estimate the reddening of similar objects. The observed colour curve of ASASSN-16ex matches well with ASASSN-15pz and other 09dc–like objects after a correction by = 0.12 0.04 mag. Hence, we use this value of total reddening in further analysis.
4.2 Absolute Magnitudes
Recession velocity corrected for infall of the Local Group towards Virgo cluster is 5 807 45 km sec-1 for PGC 170248, and for UGC 4812, it is 10 503 31 km sec-1 (Mould et al. 2000; source NED). With = 72 5 km sec-1 Mpc-1 (Freedman et al., 2001), distances of SN 2013bz and PSN J0910+5003 are calculated as 80.65 5.6 Mpc ( = 34.53 0.20 mag) and 145.88 10 Mpc ( = 35.82 0.20 mag), respectively. For SDSS J171023.63+262350.3 (host of ASASSN-16ex), using = 0.04 (Foley et al., 2018), we derived a distance of 166.67 12 Mpc ( = 36.11 0.20 mag).
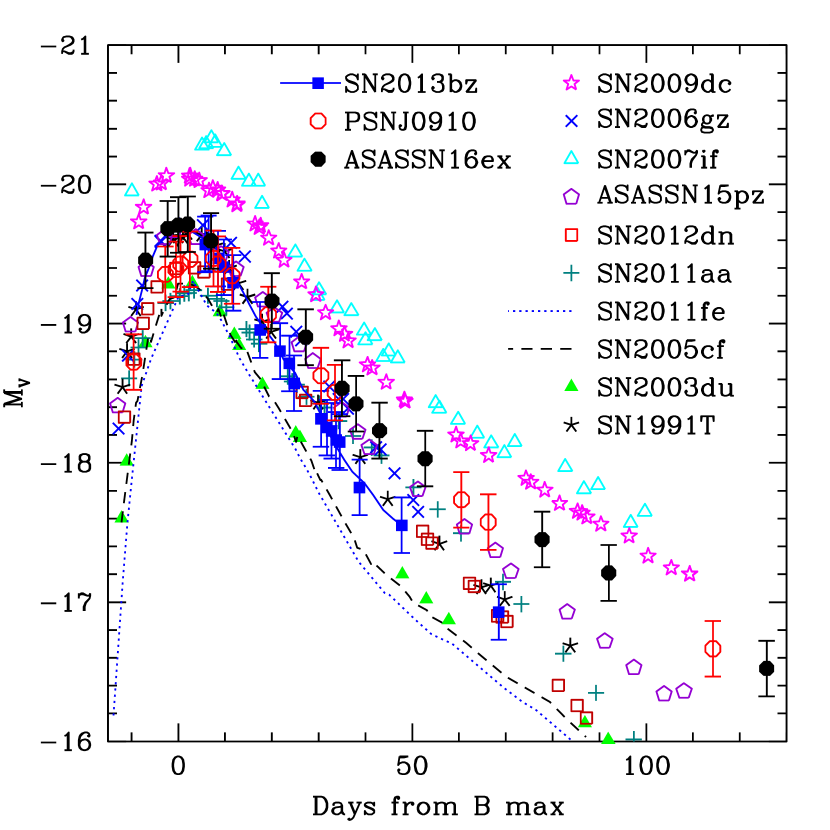
Using the estimated distances, reddening values and Cardelli, Clayton & Mathis (1989) extinction law with , the peak absolute magnitudes of SN 2013bz, PSN J0910+5003 and ASASSN-16ex in different bands are estimated and listed in Table 6. The absolute band light curves of these SNe are displayed in Fig. 9 and compared with other well-studied SNe Ia. SN 2013bz and ASASSN-16ex have luminosities comparable to SNe 2006gz/91T, ASASSN-15pz. The light curve of SN 2013bz is similar to SN 1991T. With a constant difference of 0.4 mag, the absolute band light curve of ASASSN-16ex runs almost parallel to SN 2009dc. The light curve of PSN J0910+5003 is fainter than 09dc–like objects but brighter than normal SNe 2003du/05cf/11fe. At maximum PSN J0910+5003 is fainter than ASASSN-16ex. However, during the late phase, they show similar light curve evolution.
4.3 Bolometric Light curve
The quasi-bolometric luminosities of SN 2013bz, PSN J0910+5003 and ASASSN-16ex were derived using the observed magnitudes in Table 2. The magnitudes were dereddened with the reddening values estimated in section 4.1 and converted to monochromatic fluxes using zero points from Bessell, Castelli & Plez (1998). The derived fluxes on each night were integrated over the observed wavelength range to get the total flux at optical bands. The integrated flux is converted to quasi-bolometric luminosity using the distances derived in section 4.2.
The peak quasi-bolometric luminosity for SN 2013bz obtained by integration of optical fluxes is = 43.30 erg s-1. Adding 20% flux to account for the contribution from the missing bands (Wang et al., 2009a) results in = 43.38 0.07 erg s-1.
The maximum quasi-bolometric luminosity for ASASSN-16ex is obtained as = 43.29 erg s-1 using optical observations. We used Swift UVOT data of ASASSN-16ex to estimate contributions from UV bands. The UV magnitudes were dereddened following Brown et al. (2010) and converted to monochromatic flux using the zero points from Poole et al. (2008). With the UV contribution, the peak bolometric luminosity of ASASSN-16ex becomes = 43.39 erg s-1. The UV contribution to the bolometric luminosity is found as 29%, 22%, and 13% at 7 d, maximum, and +20 d, respectively. The 09dc–like SNe Ia are found to be UV bright (Brown et al., 2014b; Chakradhari et al., 2014; Chen et al., 2019; Dimitriadis et al., 2022), ASASSN-16ex follows a similar trend. After adding 5% contribution from NIR bands (Wang et al., 2009a; Scalzo et al., 2010; Yamanaka et al., 2016), the peak bolometric luminosity of ASASSN-16ex is estimated as = 43.40 0.06 erg s-1.
The peak quasi-bolometric luminosity for PSN J0910+5003 is derived as = 43.17 erg s-1 by integrating the optical data points. For 09dc–like objects, close to the maximum, the UV band contributes 20% (Chakradhari et al., 2014) to the bolometric flux. We found similar UV contribution in ASASSN-16ex. On adding 20% UV and 5% NIR contributions, the peak bolometric luminosity of PSN J0910+5003 is obtained as = 43.26 0.07 erg s-1.
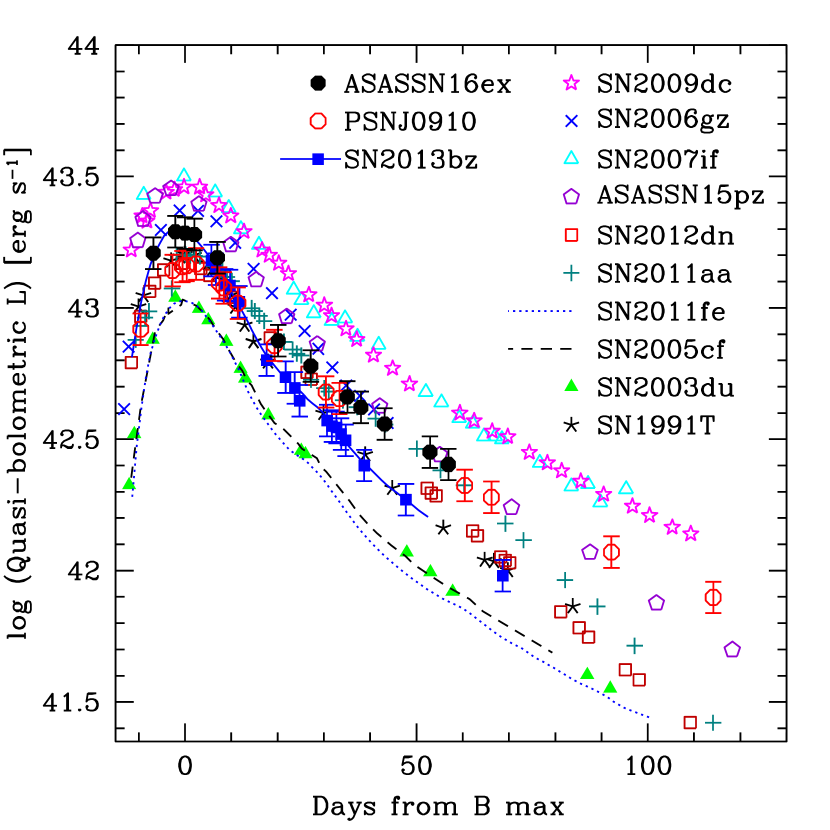
The quasi-bolometric light curves of SN 2013bz, PSN J0910+5003 and ASASSN-16ex are plotted in Fig. 10 and compared with other well-studied SNe Ia. The peak quasi-bolometric luminosities of SN 2013bz, PSN J0910+5003 and ASASSN-16ex are lower than 09dc–like SNe 2006gz/07if/09dc/ASASSN-15pz and brighter than normal SNe Ia.
4.4 Mass of Nickel synthesized
Type Ia SNe are powered by the radioactive decay of 56Ni to 56Co and subsequently to 56Fe. The peak bolometric luminosity can be used to estimate the mass of 56Ni synthesized in the explosion of SNe Ia.
The mass of 56Ni synthesized in the explosion of SN 2013bz, PSN J0910+5003 and ASASSN-16ex is estimated using Arnett’s rule (Arnett, 1982). This rule states that the peak bolometric luminosity of a type Ia SN is proportional to the instantaneous energy release rate from radioactive decay. This can be written as-
where M is the mass of 56Ni, is the ratio of bolometric to radioactive luminosities (near unity), and is the radioactivity luminosity per unit nickel mass evaluated for the rise time . From Nadyozhin (1994), can be written as-
where 8.8 and 111.3 d are e-folding lifetimes () of 56Ni and 56Co, respectively.
With the lack of early observations, it is difficult to constrain these events’ explosion epoch and rise time. This limits an accurate determination of the mass of 56Ni. Rise time () for the normal SNe Ia is found to be 17.4 d (Hayden et al., 2010), 18 d (Ganeshalingam, Li & Filippenko, 2011), 18.9 d (Firth et al., 2015; Miller et al., 2020), 19.1 – 19.6 d (Riess et al., 1999; Conley et al., 2006). Using = 18 2 d, and = 1.2 0.2 (Branch, 1992), the mass of 56Ni synthesized in the explosion of SN 2013bz is estimated as M = 0.96 0.24 M⊙. The 09dc–like SNe are found to have longer 21 – 24 d (Scalzo et al., 2010; Silverman et al., 2011; Chen et al., 2019; Lu et al., 2021) with an average of 22 4 d (Ashall et al., 2021). Using = 22 d and = 1.2, the mass of 56Ni in PSN J0910+5003 and ASASSN-16ex is estimated as M = 0.89 0.24 M⊙ and M = 1.2 0.32 M⊙, respectively.
5 SPECTRAL EVOLUTION
Spectral series were obtained for SN 2013bz, PSN J0910+5003 and ASASSN-16ex using HFOSC-HCT. In total, 11 spectra spanning +4 to +35 d for SN 2013bz, 8 spectra from 3 to +63 d for PSN J0910+5003, and 8 spectra from 8 to +43 d for ASASSN-16ex were obtained444Phase with respect to band maximum.. The details of spectroscopic observations are given in Table 4. Spectral evolution of SN 2013bz, PSN J0910+5003 and ASASSN-16ex are presented in Fig. 11, Fig. 12 and Fig. 13, respectively. All the spectra are reddening and redshift corrected. Telluric lines are not removed.
Spectral features in the early phase of type Ia SNe are mostly absorption lines of singly ionized IMEs such as O, Mg, Si, S and Ca produced at outer photospheric layers. As the ejecta expands, the photosphere moves into deeper layers, and lines from the inner layers are seen. During this, features from IMEs are replaced by the IGEs, e.g., Fe, Co and Ni.
5.1 SN 2013bz
The early post-maximum spectra of SN 2013bz (+4, +6 and +7 d) show the characteristics features of SNe Ia, mostly from IMEs marked in Fig. 11. At the bluer end, a deep absorption seen around 4000 Å is due to Ca ii H&K lines. The next prominent and broad feature at around 4500 Å is due to a blend of Fe iii 4404, Mg ii 4481 and Fe ii 4555. Moving red-ward, a sharp absorption due to Si iii 4560 is seen in the first spectrum at +4 d, which has become weak in the following spectrum at +6 d. The Si iii 4560 is generally seen during the early hot photospheric phase. A broad blend is seen at 5000 Å due to Fe ii 4924, 5018, Si ii 5051, Fe iii 5129 and Fe ii 5169. The ‘W’-shaped S ii 5654, 5468 feature is also visible with its decreasing strength in subsequent spectra. Features on the red side of the spectrum, such as O i and Ca ii NIR, are weak in SN 2013bz. A small narrow feature seen at 6000 Å is due to Na i D from the host galaxy.
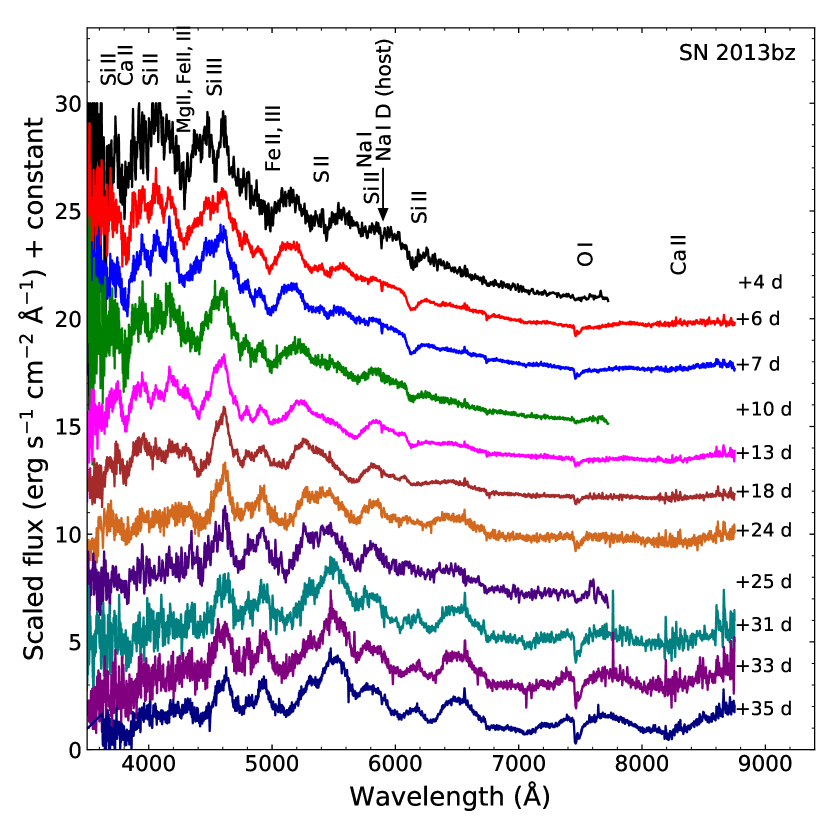
In the spectra obtained at +10, +13, and +18 d, most of the features due to IMEs’ such as ‘W’-shaped S ii and Si ii weakened/disappeared. The features due to IMEs are getting replaced by Fe ii lines. Development of emission peaks, such as at 4600 Å, can also be noticed. A strong absorption due to Na i from SN ejecta is visible at 5700 Å. The spectra after one-month post-maximum are dominated by Fe ii lines. Feature due to Ca ii NIR triplet looks stronger than earlier.
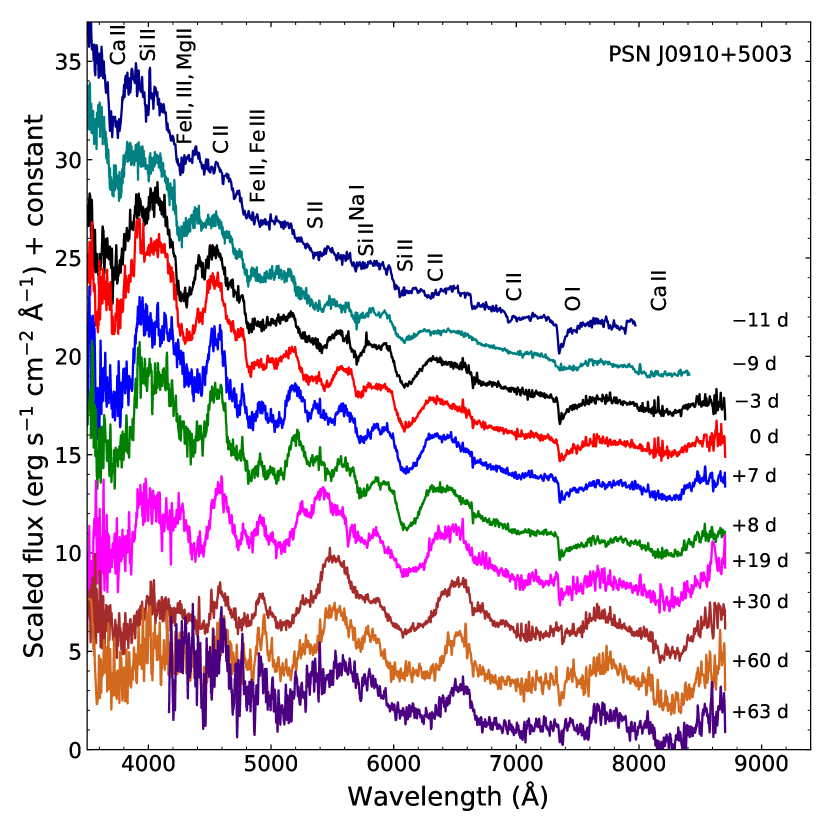
5.2 PSN J0910+5003
The spectral evolution of PSN J0910+5003 from 11 to +63 d is shown in Fig. 12. The first two spectra at 11 and 9 d are taken from WISeREP (Tomasella et al., 2015; Stahl et al., 2020) and displayed to show early evolution and spectral characteristics. The first spectrum at 11 d looks like a featureless continuum; most spectral lines are shallow/not yet fully developed. A strong C ii 6580 absorption can be seen in the red-wing of Si ii 6355, which makes the absorption at 6200 Å very broad. This indicates the presence of unburned material in the ejecta, usually found in 09dc–like SNe Ia (Taubenberger et al., 2011; Chakradhari et al., 2014; Chen et al., 2019; Lu et al., 2021; Jiang et al., 2021; Dimitriadis et al., 2022; Srivastav et al., 2023).
In the spectrum at 9 d, the features from IMEs are strengthening. The carbon lines have almost disappeared; only a tiny suppression is seen at the red-wing of Si ii 6355. By 3 d, the absorption features due to IMEs are fully developed and dominate the spectra till one-week post-maximum. In contrast to SN 2013bz, features like Si ii 5972, O i and Ca ii NIR are stronger in PSN J0910+5003. Spectrum at +19 d and subsequent spectra show the appearance of several emission peaks due to IGEs. Fe ii lines have replaced the features from IMEs.
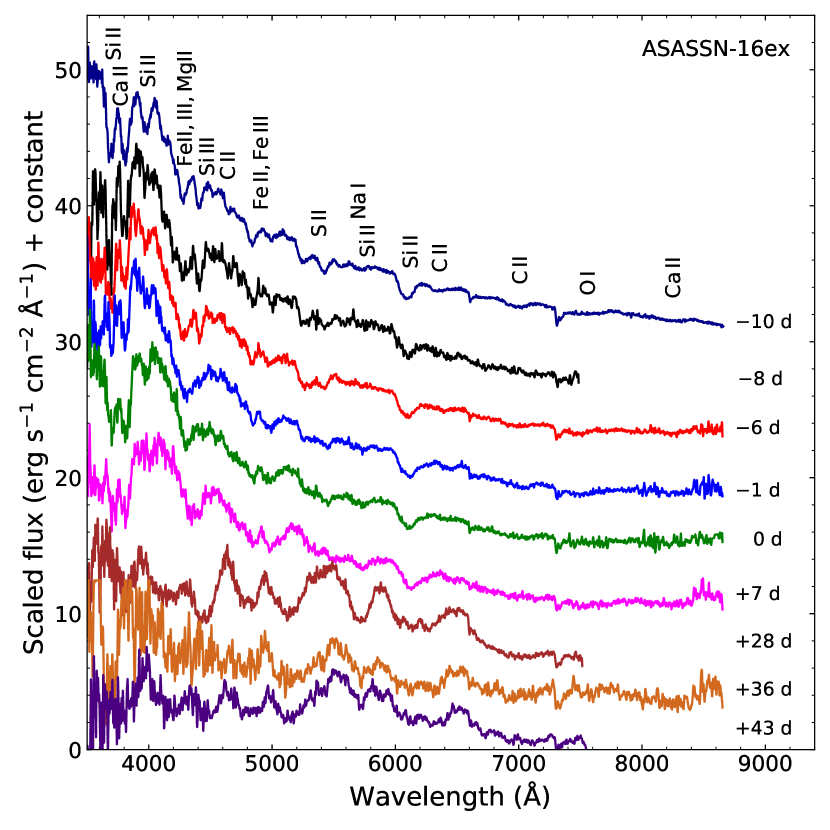
5.3 ASASSN-16ex
The spectral evolution of ASASSN-16ex from 10 to +43 d is shown in Fig. 13. The first spectrum at 10 d is taken from WISeREP (Tomasella et al., 2016). Similar to PSN J0910+5003, the signature of unburned C ii is seen in this object. Compared to PSN J0910+5003, spectral features in ASASSN-16ex are well developed and sharp. The Si ii 5972, O i and Ca ii NIR features are weak in ASASSN-16ex than PSN J0910+5003. Along with a weak Si ii 5972 line, a strong Si iii 4560 feature is present in the spectrum of ASASSN-16ex, suggesting a hot photosphere. In the spectrum at one month and in the subsequent spectra, the features of IMEs are replaced by Fe ii lines, and the development of emission lines can be seen.
5.4 Spectral Comparison
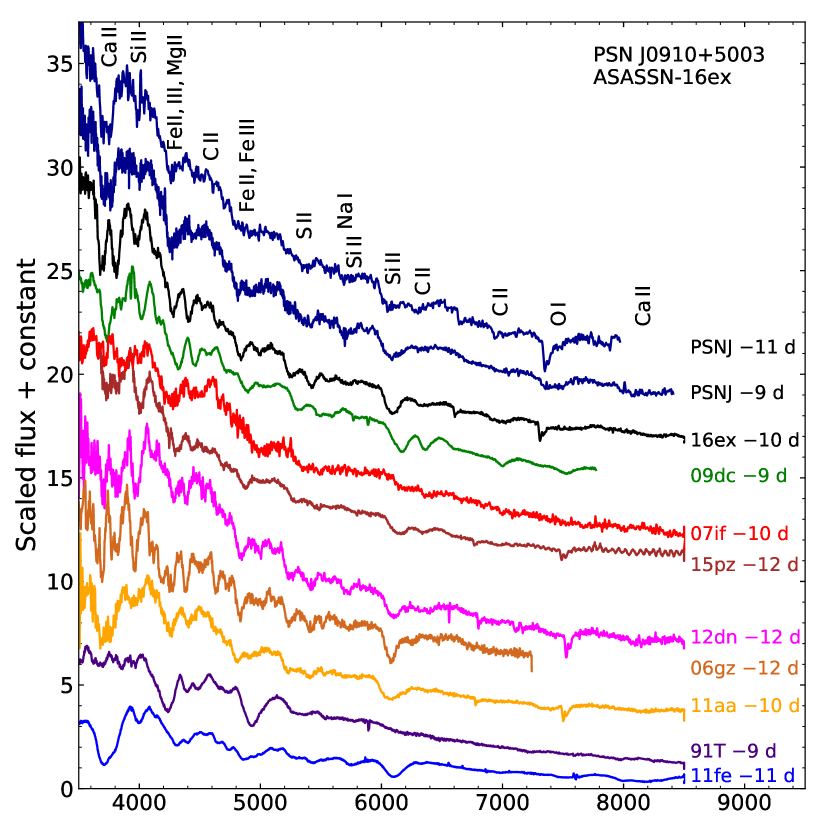
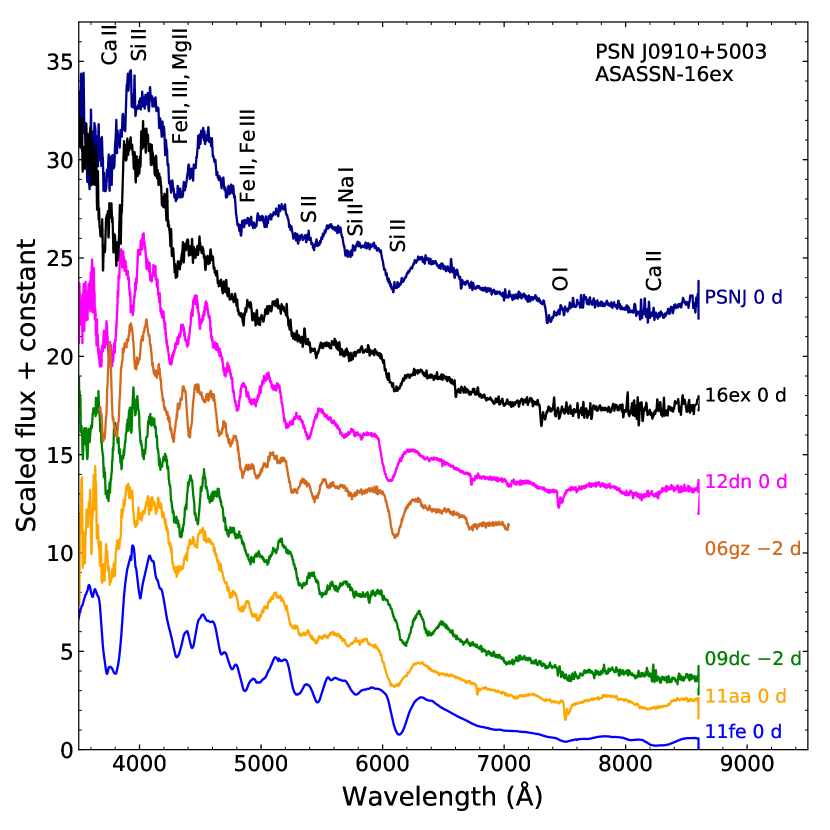
In Fig. 14 (top panel), the early spectra of PSN J0910+5003 (11, 9 d) and ASASSN-16ex (10 d) are compared with those of SN 1991T (Filippenko et al., 1992), SN 2006gz (Hicken et al., 2007), SN 2007if (Scalzo et al., 2010), SN 2009dc (Taubenberger et al., 2011), SN 2011fe (Parrent et al., 2012), SN 2011aa (Dutta et al., 2022) and ASASSN-15pz (Chen et al., 2019) at similar epoch. Though the lines in PSN J0910+5003 are shallower, the spectra of both PSN J0910+5003 and ASASSN-16ex are similar to 09dc–like SNe. Strong C ii features are seen in both events.
The spectral features of ASASSN-16ex are very similar to those of 2006gz/09dc/12dn. In the bluer region, well-separated sharp absorption due to Si ii 3858, Ca ii H&K, Si ii 4130 and Si iii 4560 are identical in these events. Other features like ‘W’-shaped S ii, Si ii 6355, and a shallower Si ii 5972 look similar in these objects. The spectral features in PSN J0910+5003 at 11 and 9 d are similar to those in SN 2007if and SN 2011aa. A comparison of spectra of PSN J0910+5003, ASASSN-16ex and other SNe is made at the maximum phase in the bottom panel of Fig. 14. At this phase also, ASASSN-16ex closely resembles SN 2012dn/06gz. The spectrum of PSN J0910+5003 is similar to SN 2011aa. Absorption lines in PSN J0910+5003 appear broader and blended.
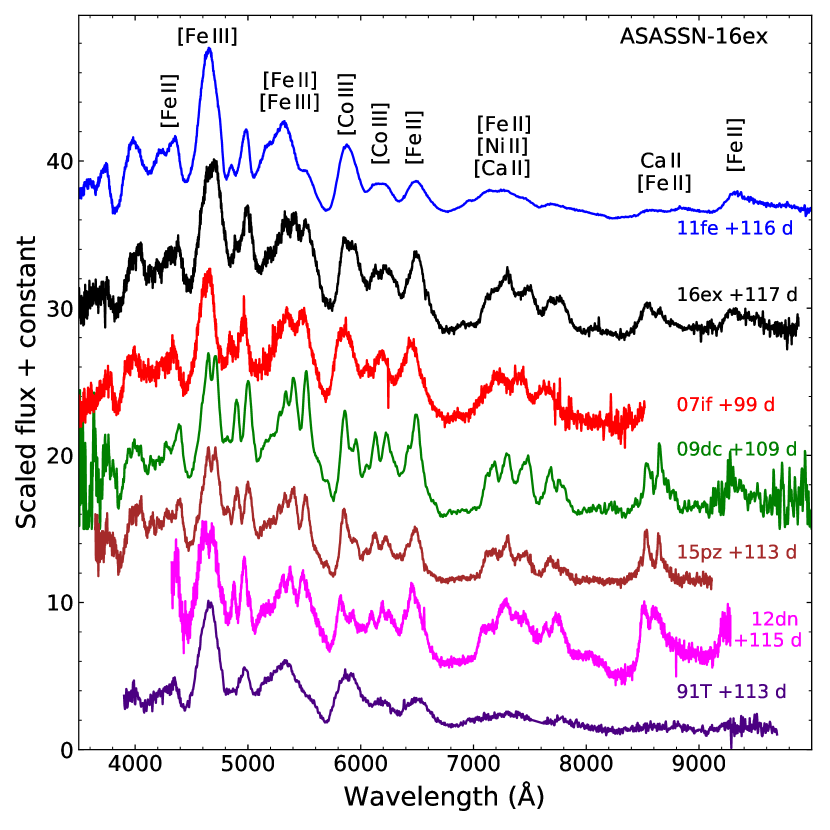
In Fig. 15, the spectrum of ASASSN-16ex four months after maximum light (taken from WISeREP, Stahl et al. 2020) is compared with those of SN 2011fe (Stahl et al., 2020), SN 2007if (Silverman et al., 2011), SN 2009dc (Taubenberger et al., 2011), ASASSN-15pz (Chen et al., 2019), SN 1991T (Silverman et al., 2012) and SN 1991bg (Turatto et al., 1996) at a similar epoch. A few months after the explosion, SN enters into nebular phase, the ejecta becomes optically thin, and the inner part of the ejecta becomes visible. Forbidden emission lines of IGEs, i.e., Fe, Co, and Ni, characterize spectra of SNe Ia at this phase. Some prominent nebular features are marked in Fig. 15. Similarity in the spectral features between ASASSN-16ex and a normal SN Ia can be seen. However, there are certain noticeable differences also. The blending of lines in ASASSN-16ex is less than a normal SN Ia. In the red region beyond 6500 Å, features in ASASSN-16ex are more pronounced as compared to normal SN 2011fe and luminous SN 1991T. There are a number of similarities between the spectrum of ASASSN-16ex and 09dc–like SNe, which include (i) double-peaked [Fe ii]+[Fe iii] complex at 5400 Å; strength of [Fe iii] 4700 Å appears lower relative to [Fe ii]+[Fe iii] (ii) strong [Fe ii] at 6500 Å (iii) a broad absorption trough with a flat bottom around 6700 – 7000 Å (iv) multiple emission peaks around 7000 – 7900 Å (v) sharp emission peaks at 8500 Å.
5.5 SYN++ Synthetic model spectra
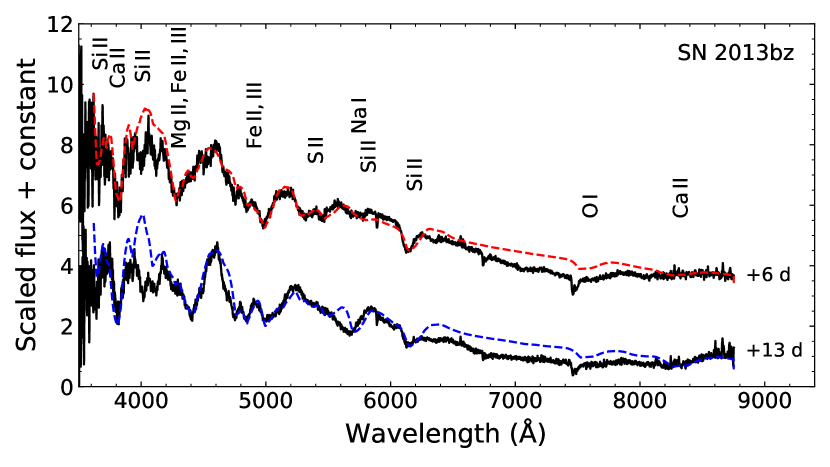
Spectra of SN 2013bz at +6 and +13 d are compared with the synthetic spectra generated using SYN++ code (Fisher, 2000; Thomas, Nugent & Meza, 2011) and plotted in Fig. 16. The observed spectrum at +6 d matches the synthetic spectrum with a photospheric velocity () of 10 500 km s-1 and blackbody temperature () of 11 000 K. The species used are marked. The spectrum at +13 d matches with similar and species but with a lower of 10 200 km s-1.
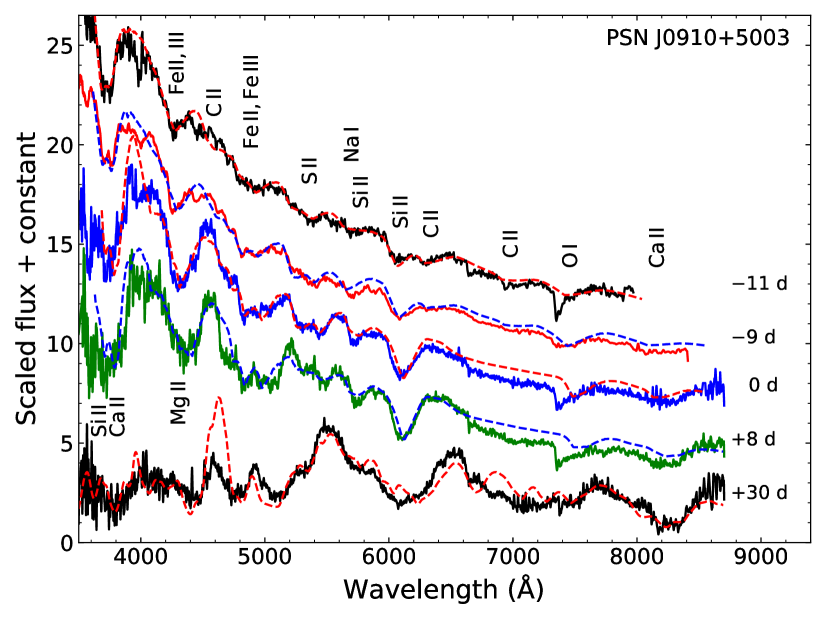
Spectra of PSN J0910+5003 at 11, 9, 0, +8 and +30 d are matched with the synthetic spectrum and plotted in Fig. 17. The synthetic spectrum at 11 d is produced using = 14 500 km s-1 and = 15 000 K. Ions used are marked in the figure. The synthetic spectrum at 9 d is reproduced with similar species, = 13 500 km s-1 and = 14 300 K. For the maximum and one-week post-maximum phase, we used = 11 700 and 11 500 km s-1, = 13 000 and 11 500 K, respectively. Species used are similar to the 9 d spectrum; C ii is not included. The synthetic spectrum at +30 d has a = 10 000 km s-1 and = 8 000 K. It includes species of Si ii, Ca ii, Fe ii, Ni ii and Co ii.
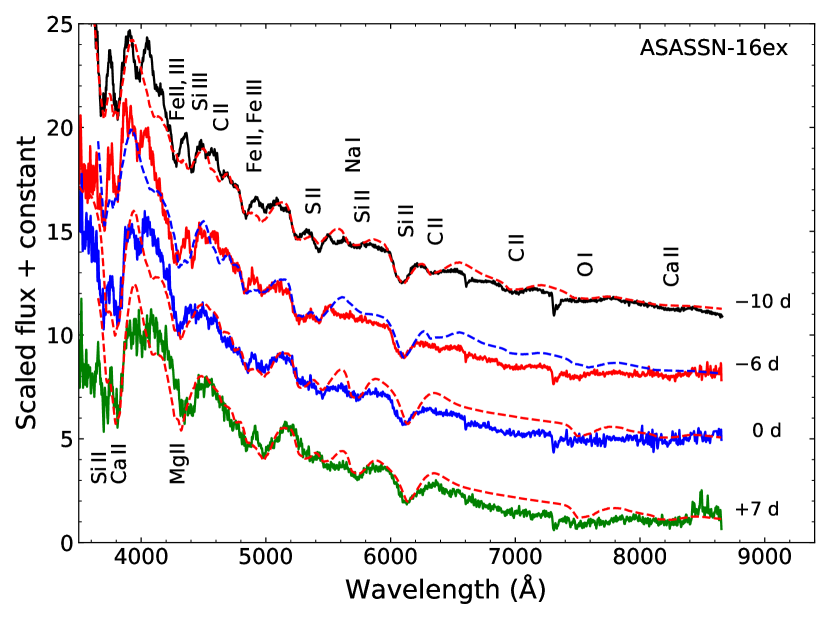
Spectra of ASASSN-16ex at 10, 6, 0, and +7 d are matched with the synthetic spectrum and plotted in Fig. 18. The synthetic spectrum at 10 d is generated using = 12 500 km s-1 and = 15 000 K. Species used are marked. The observed spectrum of ASASSN-16ex at 6 d matches the synthetic spectrum with similar parameters and species used at 10 d. The synthetic spectra at maximum and one-week post-maximum phase have lower (11 200 km s-1 and 11 000 km s-1) and (14 500 and 14 000 K). Both include species of O i, Na i, Mg ii, Si ii, S ii, Ca ii, Fe ii, and Fe iii.
5.6 Velocity and spectral parameters
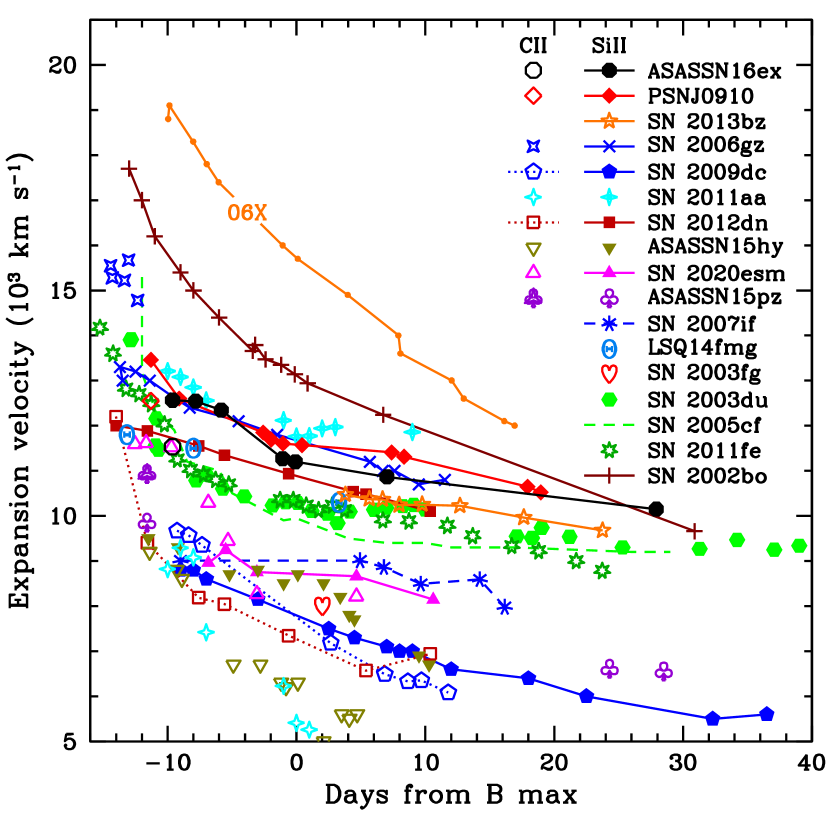
The photospheric velocities of SN 2013bz, PSN J0910+5003 and ASASSN-16ex estimated using the absorption minimum of Si ii 6355 are plotted in Fig. 19, along with other well-studied SNe Ia for comparison. The velocity evolution of SN 2013bz is similar to normal event SN 2003du. The velocity evolution of PSN J0910+5003 and ASASSN-16ex is similar to SN 2006gz and the early evolution of SN 2011aa. The Carbon 6580 line, detected in the early phase (10 d) is found to have 1 000 km s-1 lower velocity than that of the Si ii line in both PSN J0910+5003 and ASASSN-16ex. This could be due to the clumping/line of sight effect (Parrent et al., 2011).
Normal SNe Ia are characterized by a pair of Si ii 5972 and Si ii 6355 features near the maximum phase. SNe Ia can be categorized and studied based on the various spectroscopic parameters derived from these lines, such as EWs (Branch et al., 2006) and strength ratio (Nugent et al., 1995), the photospheric velocity measured from Si ii 6355 line (Wang et al., 2009b) and its gradient (Benetti et al., 2005). We measured these parameters for SN 2013bz, PSN J0910+5003 and ASASSN-16ex, and listed in Table 7. All three SNe belong to normal velocity (NV, Wang et al. 2009b) and low velocity gradient (LVG, Benetti et al. 2005) subgroup. SN 2013bz and ASASSN-16ex fall in the shallow silicon (SS) subgroup, while PSN J0910+5003 is near the boundary of SS and core normal (CN) subgroup of SNe Ia (Branch et al., 2006).
| Parametera | 13bz | PSN | 16ex |
|---|---|---|---|
| 1. (km s-1) | 10500 600 | 11600 200 | 11200 400 |
| 2. (km s-1 d-1) | 40 3 | 31 3 | 50 4 |
| 3. EW (Si ii 5972 Å) | 11 2 | 20 2 | 16 2 |
| 4. EW (Si ii 6355 Å) | 30 3 | 83 8 | 60 6 |
| 5. | 0.34 0.03 | 0.37 0.04 | 0.32 0.03 |
| 6. Spectroscopic classb | LVG | LVG | LVG |
| 7. Spectroscopic classc | SS | SS/CN | SS |
| 8. Spectroscopic classd | NV | NV | NV |
| anear max, bBenetti et al. (2005) | |||
| cBranch et al. (2006), dWang et al. (2009b) | |||
6 Discussion and Summary
SN 2013bz, PSN J0910+5003 and ASASSN-16ex were classified as 09dc–like objects using their early spectra (Ochner et al., 2013; Tomasella et al., 2015, 2016; Piascik & Steele, 2016). We have conducted a detailed photometric and spectroscopic study on these objects to further investigate their properties. Among these, SN 2013bz is a slow-declining, luminous event with a decline rate parameter of = 0.92 0.04. Its photometric and spectral characteristics are similar to normal SNe Ia, while PSN J0910+5003 and ASASSN-16ex are similar to 09dc–like SNe Ia. The light curves of both PSN J0910+5003 and ASASSN-16ex are very broad relative to normal events. Their decline rate parameters ( = 0.70 0.05 and 0.73 0.03) are similar to 09dc–like SNe Ia. Further, ASASSN-16ex is very blue and bright in UV bands. The absolute luminosities of SN 2013bz, PSN J0910+5003 and ASASSN-16ex are on the higher side of normal SNe Ia. Their band peak absolute magnitudes are estimated as 19.61 0.20 mag, 19.44 0.20 mag and 19.78 0.20 mag, respectively.
The peak bolometric luminosities for these objects are derived as = 43.38 0.07 erg s-1, 43.26 0.07 erg s-1 and 43.40 0.06 erg s-1, respectively. The mass of 56Ni synthesized in the explosion of these events are estimated as 0.96 0.24 M⊙, 0.89 0.24 M⊙, and 1.2 0.32 M⊙, respectively. The contribution of the UV flux in the bolometric luminosity for ASASSN-16ex is estimated to be 22% at maximum. The late phase spectrum of ASASSN-16ex, four months after maximum light, also looks very similar to those of 09dc–like SNe Ia.
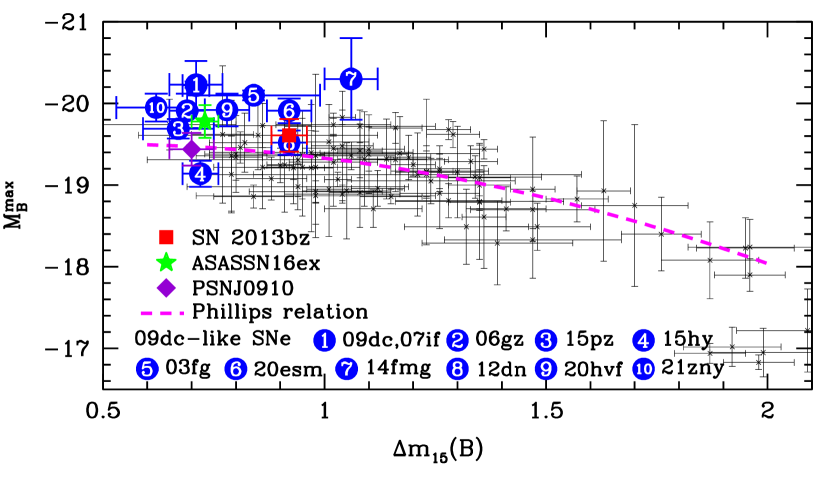
Position of SN 2013bz, PSN J0910+5003 and ASASSN-16ex along with known 09dc–like objects and a sample of SNe Ia from Hicken et al. (2009), in the luminosity width relation diagram of Phillips et al. (1999), is shown in Fig. 20. Phillips et al. (1999) used SNe Ia in the range of 0.85 1.7. Since then, the sample of SNe Ia has increased significantly with more number of objects in both the higher and lower luminosity end. Normal SNe Ia are suggested to follow this relation.
The 09dc–like SNe Ia are now known to have a large dispersion in their luminosity. SNe 2003fg, 07if, 09dc, LSQ14fmg were exceptionally bright (Howell et al., 2006; Scalzo et al., 2010; Yuan et al., 2010; Yamanaka et al., 2009; Silverman et al., 2011; Taubenberger et al., 2011; Hsiao et al., 2020), while ASASSN-15hy had a lower luminosity (Lu et al., 2021). Other SNe 2006gz, 12dn, ASASSN-15pz, 20esm, 20hvf and 21zny have luminosities in between (Hicken et al., 2009; Maeda et al., 2009; Chakradhari et al., 2014; Taubenberger et al., 2019; Chen et al., 2019; Dimitriadis et al., 2022; Jiang et al., 2021; Dimitriadis et al., 2023). Their decline rate ranges from 0.62 0.09 (SN 2021zny, Dimitriadis et al. 2023) to 1.06 0.06 (LSQ14fmg, Hsiao et al. 2020). Except for LSQ14fmg, all the 09dc–like objects have lower than a typical SN Ia. From Fig. 20, it is clear that with a slower decline, PSN J0910+5003 and ASASSN-16ex lie towards the region occupied by 09dc–like objects and are moderately luminous. SN 2013bz falls in the region of normal-luminous SNe Ia.
One of the characteristics seen in the 09dc–like SNe is the appearance of delayed band maximum. Timing of band peak relative to the band peak for 09dc–like SNe, 91T and normal SNe are listed in Table 5. PSN J0910+5003 has a delayed band peak (6 d), similar to other objects showing the most delayed band peak, e.g., SN 2006gz (6 d), SN 2011aa (7 d) and ASASSN-15hy (7 d). However, ASASSN-16ex does not show the delayed band peak.
Kasen (2006) suggested that double-peak appearance in the NIR light curves can be regarded as a direct consequence of the ejecta stratification and concentration of IGEs in the central regions. The secondary maximum results due to the ionization evolution of IGEs in the ejecta and transition from doubly ionized to singly ionized (Fe iii to Fe ii) state (Pinto & Eastman, 2000; Kasen, 2006). Brighter SNe are expected to have a more pronounced and delayed secondary maximum but may vary depending on the amount and mixing of 56Ni, stable Fe/metallicity, and the abundance of Calcium (Kasen, 2006). Folatelli et al. (2010) suggested that mixing has the most significant effect on the strength of secondary maximum, and it can transform double-peak morphology into a single peak, as seen in the 09dc–like SNe.
Ashall et al. (2021) suggested that full mixing in the ejecta should cause a prominent band break in the NIR spectrum, which is not seen during the early post-maximum phase in the 09dc–like SNe; instead, it is delayed by 1-2 months. The delayed appearance of the band break indicates that the 56Ni resides in the very inner layers. Vigorous mixing would bring 56Ni in the outermost region of the ejecta. However, the decay of surface 56Ni was not a good fit for the short duration early excess of SN 2020hvf (Jiang et al., 2021).
Explaining the bolometric light curve of 09dc–like SNe requires a higher 56Ni mass, suggesting ejecta mass in excess of Chandrasekhar mass (Scalzo et al., 2010). In the SD scenario, differentially rotating WDs can have mass over Chandrasekhar mass (Yoon & Langer, 2005), a possible progenitor for 09dc–like SN Ia (Howell et al., 2006). However, Pfannes et al. (2010a); Pfannes, Niemeyer & Schmidt (2010b); Hachinger et al. (2012); Fink et al. (2018) show that the explosion energetics/burning products do not match well with this model. The deflagration model of differentially rotating WDs produces SNe Iax–like events. The explosion in detonation/delayed detonation is very powerful, the velocities of IMEs are significantly high, and most of the materials are burned to IGEs with just a small portion remaining unburned, contrary to what is seen in 09dc–like SNe Ia.
The ejecta-CSM interaction has also been proposed as an alternative energy source to power these events. In this scenario, 09dc–like SNe are suggested to be a thermonuclear explosion in an enshrouded shell/envelope (Khokhlov, Mueller & Hoeflich, 1993; Hoeflich & Khokhlov, 1996) of C/O-rich materials with which the supernova ejecta interacts. The conversion/reprocessing of kinetic energy/shock interaction energy acts as an additional source (Hicken et al., 2007; Scalzo et al., 2010; Taubenberger et al., 2013; Noebauer et al., 2016; Hsiao et al., 2020; Ashall et al., 2021; Lu et al., 2021).
The signature of ejecta-CSM has been observed in some 09dc–like SNe Ia. In SN 2012dn, the excess NIR luminosity was interpreted due to the presence of CSM dust (Yamanaka et al. 2016; Nagao, Maeda & Yamanaka 2017). Short-duration pulse-like early excess emission in SN 2020hvf (Jiang et al., 2021), SN 2021zny (Dimitriadis et al., 2023) and SN 2022ilv (Srivastav et al., 2023), within a few hours of the supernova explosion was modelled as an interaction of SN ejecta with the CSM close to the progenitor (see also Maeda et al., 2023). However, the absence of narrow emission lines in the spectra of 09dc–like SNe Ia, indicates the CSM to be H/He-poor.
The origin of CSM is not well understood. Yamanaka et al. (2016); Nagao et al. (2017) suggest an SD scenario. The merger of two WDs in the DD scenario gives a high ejecta mass suitable for the 09dc–like SNe Ia (Hicken et al., 2007), and naturally explains the absence of H/He features. During the disruption, a WD merging with another WD can form a dense envelope of C/O-rich materials. However, the physics of merging WDs needs to be understood, whether it is able to explain SNe Ia (Hoeflich & Khokhlov, 1996; Fryer et al., 2010; Shen et al., 2012; Moll et al., 2014; Raskin et al., 2014) or it will result in an accretion-induced collapse (Saio & Nomoto, 1985). Hsiao et al. (2020); Lu et al. (2021); Ashall et al. (2021) suggest a ‘core-degenerate’ scenario (Kashi & Soker, 2011), where the explosion takes place in a degenerate C/O core enveloped by an AGB star. However, interaction signatures, e.g., bright X-ray emission, UV late-time rebrightening, narrow H/He lines, etc., have not been observed.
SN 2011aa was found to be the slowest declining type Ia event with photometric evolution similar to 09dc–like objects. However, it was neither over-luminous nor showed narrow spectral features, as seen in 09dc–like objects (Dutta et al., 2022). Photometric properties of PSN J0910+5003 closely match with the 09dc–like objects, while spectral lines in PSN J0910+5003 are broad, similar to SN 2011aa (refer to Section 5.4). Early velocity evolution of PSN J0910+5003 is also similar to SN 2011aa (refer to Fig. 19). Dutta et al. (2022) have shown that events like SN 2011aa could be explained by the violent merger of white dwarfs.
The strong C ii feature is seen in the early spectra of PSN J0910+5003 and ASASSN-16ex at 10 d. The presence of strong carbon lines is a characteristic of 09dc–like objects. Though carbon is seen in early spectra of a good fraction of normal SNe Ia, it generally disappears soon (Parrent et al., 2011; Folatelli et al., 2012; Silverman & Filippenko, 2012). Some of the 09dc–like objects have shown carbon features extending up to maximum/post-maximum phase, e.g., SN 2009dc (Taubenberger et al., 2011), SN 2012dn (Chakradhari et al., 2014; Parrent et al., 2016; Taubenberger et al., 2019), LSQ14fmg (Hsiao et al., 2020), ASASSN-15hy (Lu et al., 2021), SN 2020hvf (Jiang et al., 2021), SN 2020esm (Dimitriadis et al., 2022), SN 2021zny (Dimitriadis et al., 2023), SN 2022ilv (Srivastav et al., 2023). The C ii lines seen around 10 d in PSN J0910+5003 and ASASSN-16ex faded speedily, similar to SN 2006gz. The origin of carbon is not fully understood. The strong C ii lines in the 09dc–like SNe suggest a large amount of unburned material in the SN ejecta. This supports the model with an extended envelope. SN 2020esm had a nearly pure C/O atmosphere during the first few days of the explosion. The large amount of carbon in the envelope is swept up by the ejecta giving rise to strong/persistent C ii features (Taubenberger et al., 2013; Noebauer et al., 2016; Dimitriadis et al., 2022). Maeda et al. (2023) suggest that the sequence of SN 2020hvf, 2012dn and 2020esm/2009dc could be connected to an increase in the C/O-rich envelope, resulting in increasing strength of the C ii and decreasing velocity of Si ii as found by Ashall et al. (2021) for a sample of 09dc–like SNe Ia.
The presence of carbon may also help in dust formation in these objects (Maeda et al., 2023). Pre-existing dust or CO/dust formation may cause a fast decline in the light curves (Taubenberger et al., 2013, 2019; Chakradhari et al., 2014; Yamanaka et al., 2016; Nagao et al., 2017; Hsiao et al., 2020). Early fast decline, starting within 1 – 3 months from maximum was seen in SN 2012dn (Chakradhari et al., 2014; Yamanaka et al., 2016; Taubenberger et al., 2019), ASASSN-15pz (Chen et al., 2019) and LSQ14fmg (Hsiao et al., 2020). While a fast decline in the late phase was seen in SN 2006gz (Maeda et al., 2009), SN 2009dc (Silverman et al., 2011; Taubenberger et al., 2013) and SN 2020esm (Dimitriadis et al., 2022). No signature of fast decline is seen in the light curves of PSN J0910+5003 and ASASSN-16ex till the last available data point ( 4 months).
Shell/envelope configuration helps to explain the low ejecta velocity and slow evolution (Noebauer et al., 2016). Most of the 09dc–like SNe Ia, e.g., SN 2003fg, 07if, 09dc, 20esm, ASASSN-15pz, 15hy were found to have very low ejecta velocities. Their velocities near the maximum phase are below 10 000 km s-1. While SNe 2006gz, 12dn and LSQ14fmg were found to have higher velocities (refer Fig. 19). Both PSN J0910+5003 and ASASSN-16ex have velocity evolution similar to SN 2006gz. Along with high-velocity features, SN 2020hvf had a relatively high ejecta velocity. Jiang et al. (2021) suggest that there could be different origins of 09dc–like SNe with different velocities.
All the 09dc–like SNe Ia can be placed in the normal velocity (NV) subgroup of Wang et al. (2009b). They have a lower gradient in their velocity evolution, falling in the LVG subgroup of Benetti et al. (2005) classification scheme. PSN J0910+5003 and ASASSN-16ex both fall in NV and LVG subgroups. The strength of Si ii 5972, 6355 lines in 09dc–like SNe Ia is found to be weak. The relative strength of these lines is temperature-sensitive (Nugent et al., 1995). Hotter events have a weaker Si ii 5972 line. At lower temperatures, Fe ii/Co ii line blanketing increases the strength of Si ii 5972, while at higher temperatures, Fe iii/Co iii line blanketing washes out this feature. 09dc–like SNe are UV blue and bright during the early/maximum phase, making their photosphere hotter, giving a weaker Si ii 5972 line. The 09dc–like SNe mostly fall in the ‘shallow silicon’ (SS) subgroup of the Branch et al. (2006) classification. The Si ii 5972, 6355 lines appear weak in the maximum phase spectrum of ASASSN-16ex; hence spectroscopically, it can be categorized in the SS subgroup. While PSN J0910+5003 falls near the boundary of the SS and CN subgroups. The velocity evolution of SN 2013bz is similar to SN 2003du. The Si ii 5972 line is shallower, falling in the ‘shallow silicon’ (SS) subgroup. It has a normal velocity (NV) at maximum and a low-velocity gradient (LVG) in post-maximum phase.
In this work, we have presented detailed photometric and spectroscopic analyses of the three supernovae: SN 2013bz, PSN J0910+5003 and ASASSN-16ex. SN 2013bz is a slow-declining, luminous event with photometric/spectral characteristics similar to normal SNe Ia. While most of the photometric/spectroscopic properties of PSNJ 0910+5003 and ASASSN-16ex are similar to 09dc–like SNe Ia. The combined data of these objects allow us to explore and compare various astrophysical parameters of normal and peculiar SNe Ia and help understand differences in their characteristics. Adding well-studied new members to the family of peculiar SNe Ia will enhance our knowledge of these objects and SNe Ia diversity.
Acknowledgements
We thank the anonymous referee for providing constructive comments, which improved the presentation of this paper. ST and NKC are thankful to the Director and Dean of IIA, Bengaluru, for the local hospitality and facilities provided. We are thankful to the staff at CREST and IAO for their assistance during the observations and to all the observers of the 2-m HCT (IAO-IIA), who kindly provided part of their observing time for supernova observations. We have used public data in the Swift data archive. This work has made use of the NASA Astrophysics Data System (ADS), NASA/IPAC Infrared Science Archive (IRSA) and the NASA/IPAC Extragalactic Database (NED), which is operated by Jet Propulsion Laboratory, California Institute of Technology, under contract with the National Aeronautics and Space Administration. We acknowledge the use of Weizmann Interactive Supernova Data Repository (WISeREP) maintained by the Weizmann Institute of Science computing center.
Data Availability
The photometric and spectroscopic data presented in this paper will be made available by the corresponding author upon request.
References
- Altavilla et al. (2004) Altavilla G., et al., 2004, MNRAS, 349, 1344
- Anupama et al. (2005) Anupama G. C., Sahu D. K., Jose J., 2005, A&A, 429, 667
- Arnett (1982) Arnett W. D., 1982, ApJ, 253, 785
- Ashall et al. (2021) Ashall C., et al., 2021, ApJ, 922, 205
- Benetti et al. (2005) Benetti S., et al., 2005, ApJ, 623, 1011
- Bessell et al. (1998) Bessell M. S., Castelli F., Plez B., 1998, A&A, 337, 321
- Branch (1992) Branch D., 1992, ApJ, 392, 35
- Branch et al. (2006) Branch D., et al., 2006, PASP, 118, 560
- Breeveld et al. (2011) Breeveld A. A., Landsman W., Holland S. T., Roming P., Kuin N. P. M., Page M. J., 2011, in McEnery J. E., Racusin J. L., Gehrels N., eds, American Institute of Physics Conference Series Vol. 1358, Gamma Ray Bursts 2010. pp 373–376 (arXiv:1102.4717), doi:10.1063/1.3621807
- Brown & Milne (2016) Brown P. J., Milne P., 2016, The Astronomer’s Telegram, 9035, 1
- Brown et al. (2009) Brown P. J., et al., 2009, AJ, 137, 4517
- Brown et al. (2010) Brown P. J., et al., 2010, ApJ, 721, 1608
- Brown et al. (2012) Brown P. J., et al., 2012, ApJ, 753, 22
- Brown et al. (2014a) Brown P. J., Breeveld A. A., Holland S., Kuin P., Pritchard T., 2014a, Ap&SS, 354, 89
- Brown et al. (2014b) Brown P. J., et al., 2014b, ApJ, 787, 29
- Burns et al. (2011) Burns C. R., et al., 2011, AJ, 141, 19
- Cardelli et al. (1989) Cardelli J. A., Clayton G. C., Mathis J. S., 1989, ApJ, 345, 245
- Chakradhari et al. (2014) Chakradhari N. K., Sahu D. K., Srivastav S., Anupama G. C., 2014, MNRAS, 443, 1663
- Chakradhari et al. (2019) Chakradhari N. K., Sahu D. K., Anupama G. C., 2019, MNRAS, 487, 1886
- Chen et al. (2019) Chen P., et al., 2019, ApJ, 880, 35
- Ciabattari et al. (2015) Ciabattari F., Mazzoni E., Petroni G., 2015, Central Bureau for Astronomical Telegrams TOCP, PSN J09100885+5003396
- Conley et al. (2006) Conley A., et al., 2006, AJ, 132, 1707
- Dimitriadis et al. (2022) Dimitriadis G., et al., 2022, ApJ, 927, 78
- Dimitriadis et al. (2023) Dimitriadis G., et al., 2023, MNRAS,
- Dutta et al. (2022) Dutta A., Anupama G. C., Chakradhari N. K., Sahu D. K., 2022, ApJ, 938, L22
- Filippenko et al. (1992) Filippenko A. V., et al., 1992, ApJ, 384, L15
- Fink et al. (2018) Fink M., Kromer M., Hillebrandt W., Röpke F. K., Pakmor R., Seitenzahl I. R., Sim S. A., 2018, A&A, 618, A124
- Firth et al. (2015) Firth R. E., et al., 2015, MNRAS, 446, 3895
- Fisher (2000) Fisher A. K., 2000, PhD thesis, The University of Oklahoma
- Folatelli et al. (2010) Folatelli G., et al., 2010, AJ, 139, 120
- Folatelli et al. (2012) Folatelli G., et al., 2012, ApJ, 745, 74
- Foley et al. (2018) Foley R. J., et al., 2018, MNRAS, 475, 193
- Freedman et al. (2001) Freedman W. L., et al., 2001, ApJ, 553, 47
- Fryer et al. (2010) Fryer C. L., et al., 2010, ApJ, 725, 296
- Ganeshalingam et al. (2011) Ganeshalingam M., Li W., Filippenko A. V., 2011, MNRAS, 416, 2607
- Hachinger et al. (2012) Hachinger S., Mazzali P. A., Taubenberger S., Fink M., Pakmor R., Hillebrandt W., Seitenzahl I. R., 2012, MNRAS, 427, 2057
- Hamuy et al. (1996) Hamuy M., Phillips M. M., Suntzeff N. B., Schommer R. A., Maza J., Smith R. C., Lira P., Aviles R., 1996, AJ, 112, 2438
- Hayden et al. (2010) Hayden B. T., et al., 2010, ApJ, 712, 350
- Hicken et al. (2007) Hicken M., Garnavich P. M., Prieto J. L., Blondin S., DePoy D. L., Kirshner R. P., Parrent J., 2007, ApJ, 669, L17
- Hicken et al. (2009) Hicken M., et al., 2009, ApJ, 700, 331
- Hoeflich & Khokhlov (1996) Hoeflich P., Khokhlov A., 1996, ApJ, 457, 500
- Howell et al. (2006) Howell D. A., et al., 2006, Nature, 443, 308
- Howerton et al. (2013) Howerton S., et al., 2013, Central Bureau Electronic Telegrams, 3507
- Hoyle & Fowler (1960) Hoyle F., Fowler W. A., 1960, ApJ, 132, 565
- Hsiao et al. (2020) Hsiao E. Y., et al., 2020, ApJ, 900, 140
- Iben & Tutukov (1984) Iben Jr. I., Tutukov A. V., 1984, ApJS, 54, 335
- Jha et al. (2019) Jha S. W., Maguire K., Sullivan M., 2019, Nature Astronomy, 3, 706
- Jiang et al. (2021) Jiang J.-a., et al., 2021, ApJ, 923, L8
- Kasen (2006) Kasen D., 2006, ApJ, 649, 939
- Kashi & Soker (2011) Kashi A., Soker N., 2011, MNRAS, 417, 1466
- Khokhlov (1991) Khokhlov A. M., 1991, A&A, 245, L25
- Khokhlov et al. (1993) Khokhlov A., Mueller E., Hoeflich P., 1993, A&A, 270, 223
- Kiyota et al. (2016) Kiyota S., et al., 2016, The Astronomer’s Telegram, 9020, 1
- Landolt (1992) Landolt A. U., 1992, AJ, 104, 340
- Li et al. (2011) Li W., et al., 2011, MNRAS, 412, 1441
- Lira et al. (1998) Lira P., et al., 1998, AJ, 115, 234
- Livio & Mazzali (2018) Livio M., Mazzali P., 2018, Phys. Rep., 736, 1
- Lu et al. (2021) Lu J., et al., 2021, ApJ, 920, 107
- Maeda et al. (2009) Maeda K., Kawabata K., Li W., Tanaka M., Mazzali P. A., Hattori T., Nomoto K., Filippenko A. V., 2009, ApJ, 690, 1745
- Maeda et al. (2023) Maeda K., Jiang J.-a., Doi M., Kawabata M., Shigeyama T., 2023, MNRAS,
- Maoz et al. (2014) Maoz D., Mannucci F., Nelemans G., 2014, ARA&A, 52, 107
- Matteucci & Greggio (1986) Matteucci F., Greggio L., 1986, A&A, 154, 279
- Matteucci et al. (2009) Matteucci F., Spitoni E., Recchi S., Valiante R., 2009, A&A, 501, 531
- Mazzali et al. (2007) Mazzali P. A., Röpke F. K., Benetti S., Hillebrandt W., 2007, Science, 315, 825
- Miller et al. (2020) Miller A. A., et al., 2020, ApJ, 902, 47
- Milne et al. (2013) Milne P. A., Brown P. J., Roming P. W. A., Bufano F., Gehrels N., 2013, ApJ, 779, 23
- Moll et al. (2014) Moll R., Raskin C., Kasen D., Woosley S. E., 2014, ApJ, 785, 105
- Mould et al. (2000) Mould J. R., et al., 2000, ApJ, 529, 786
- Nadyozhin (1994) Nadyozhin D. K., 1994, ApJS, 92, 527
- Nagao et al. (2017) Nagao T., Maeda K., Yamanaka M., 2017, ApJ, 835, 143
- Noebauer et al. (2016) Noebauer U. M., Taubenberger S., Blinnikov S., Sorokina E., Hillebrandt W., 2016, MNRAS, 463, 2972
- Nomoto et al. (2013) Nomoto K., Kobayashi C., Tominaga N., 2013, ARA&A, 51, 457
- Nugent et al. (1995) Nugent P., Phillips M., Baron E., Branch D., Hauschildt P., 1995, ApJ, 455, L147
- Ochner et al. (2013) Ochner P., Tomasella L., Pastorello A., Benetti S., Cappellaro E., Turatto M., 2013, Central Bureau Electronic Telegrams, 3513
- Pakmor et al. (2013) Pakmor R., Kromer M., Taubenberger S., Springel V., 2013, ApJ, 770, L8
- Parrent et al. (2011) Parrent J. T., et al., 2011, ApJ, 732, 30
- Parrent et al. (2012) Parrent J. T., et al., 2012, ApJ, 752, L26
- Parrent et al. (2016) Parrent J. T., et al., 2016, MNRAS, 457, 3702
- Pastorello et al. (2007) Pastorello A., et al., 2007, MNRAS, 376, 1301
- Pereira et al. (2013) Pereira R., et al., 2013, A&A, 554, A27
- Perlmutter et al. (1999) Perlmutter S., et al., 1999, ApJ, 517, 565
- Pfannes et al. (2010a) Pfannes J. M. M., Niemeyer J. C., Schmidt W., Klingenberg C., 2010a, A&A, 509, A74
- Pfannes et al. (2010b) Pfannes J. M. M., Niemeyer J. C., Schmidt W., 2010b, A&A, 509, A75
- Phillips (1993) Phillips M. M., 1993, ApJ, 413, L105
- Phillips et al. (1999) Phillips M. M., Lira P., Suntzeff N. B., Schommer R. A., Hamuy M., Maza J., 1999, AJ, 118, 1766
- Piascik & Steele (2016) Piascik A. S., Steele I. A., 2016, The Astronomer’s Telegram, 9023, 1
- Pinto & Eastman (2000) Pinto P. A., Eastman R. G., 2000, ApJ, 530, 757
- Poole et al. (2008) Poole T. S., et al., 2008, MNRAS, 383, 627
- Raskin et al. (2014) Raskin C., Kasen D., Moll R., Schwab J., Woosley S., 2014, ApJ, 788, 75
- Reindl et al. (2005) Reindl B., Tammann G. A., Sandage A., Saha A., 2005, ApJ, 624, 532
- Richmond & Smith (2012) Richmond M. W., Smith H. A., 2012, Journal of the American Association of Variable Star Observers (JAAVSO), 40, 872
- Riess et al. (1998) Riess A. G., et al., 1998, AJ, 116, 1009
- Riess et al. (1999) Riess A. G., et al., 1999, AJ, 118, 2675
- Roming et al. (2005) Roming P. W. A., et al., 2005, Space Sci. Rev., 120, 95
- Ruiter (2020) Ruiter A. J., 2020, IAU Symposium, 357, 1
- Ruiter et al. (2014) Ruiter A. J., Belczynski K., Sim S. A., Seitenzahl I. R., Kwiatkowski D., 2014, MNRAS, 440, L101
- Saio & Nomoto (1985) Saio H., Nomoto K., 1985, A&A, 150, L21
- Scalzo et al. (2010) Scalzo R. A., et al., 2010, ApJ, 713, 1073
- Schlafly & Finkbeiner (2011) Schlafly E. F., Finkbeiner D. P., 2011, ApJ, 737, 103
- Shen et al. (2012) Shen K. J., Bildsten L., Kasen D., Quataert E., 2012, ApJ, 748, 35
- Silverman & Filippenko (2012) Silverman J. M., Filippenko A. V., 2012, MNRAS, 425, 1917
- Silverman et al. (2011) Silverman J. M., Ganeshalingam M., Li W., Filippenko A. V., Miller A. A., Poznanski D., 2011, MNRAS, 410, 585
- Silverman et al. (2012) Silverman J. M., et al., 2012, MNRAS, 425, 1789
- Soker (2019) Soker N., 2019, New Astronomy Reviews, 87, 101535
- Srivastav et al. (2023) Srivastav S., et al., 2023, ApJ, 943, L20
- Stahl et al. (2020) Stahl B. E., et al., 2020, MNRAS, 492, 4325
- Tanikawa et al. (2018) Tanikawa A., Nomoto K., Nakasato N., 2018, ApJ, 868, 90
- Taubenberger (2017) Taubenberger S., 2017, Handbook of Supernovae, The Extremes of Thermonuclear Supernovae. p. 317, doi:10.1007/978-3-319-21846-5_37
- Taubenberger et al. (2011) Taubenberger S., et al., 2011, MNRAS, 412, 2735
- Taubenberger et al. (2013) Taubenberger S., et al., 2013, MNRAS, 432, 3117
- Taubenberger et al. (2019) Taubenberger S., et al., 2019, MNRAS, 488, 5473
- Thomas et al. (2011) Thomas R. C., Nugent P. E., Meza J. C., 2011, PASP, 123, 237
- Tomasella et al. (2015) Tomasella L., et al., 2015, The Astronomer’s Telegram, 8263, 1
- Tomasella et al. (2016) Tomasella L., et al., 2016, The Astronomer’s Telegram, 9024, 1
- Turatto et al. (1996) Turatto M., Benetti S., Cappellaro E., Danziger I. J., Della Valle M., Gouiffes C., Mazzali P. A., Patat F., 1996, MNRAS, 283, 1
- Turatto et al. (2003) Turatto M., Benetti S., Cappellaro E., 2003, in Hillebrandt W., Leibundgut B., eds, Proc. ESO/MPA/MPE Workshop, From Twilight to Highlight: The Physics of Supernovae. Springer, Berlin, p. 200 (arXiv:astro-ph/0211219), doi:10.1007/10828549_26
- Vinkó et al. (2012) Vinkó J., et al., 2012, A&A, 546, A12
- Wang (2018) Wang B., 2018, Research in Astronomy and Astrophysics, 18, 049
- Wang et al. (2006) Wang X., Wang L., Pain R., Zhou X., Li Z., 2006, ApJ, 645, 488
- Wang et al. (2009a) Wang X., et al., 2009a, ApJ, 697, 380
- Wang et al. (2009b) Wang X., et al., 2009b, ApJ, 699, L139
- Webbink (1984) Webbink R. F., 1984, ApJ, 277, 355
- Whelan & Iben (1973) Whelan J., Iben Jr. I., 1973, ApJ, 186, 1007
- Woosley & Kasen (2011) Woosley S. E., Kasen D., 2011, ApJ, 734, 38
- Woosley & Weaver (1994) Woosley S. E., Weaver T. A., 1994, ApJ, 423, 371
- Yamanaka et al. (2009) Yamanaka M., et al., 2009, ApJ, 707, L118
- Yamanaka et al. (2016) Yamanaka M., et al., 2016, PASJ, 68, 68
- Yoon & Langer (2005) Yoon S. C., Langer N., 2005, A&A, 435, 967
- Yuan et al. (2010) Yuan F., et al., 2010, ApJ, 715, 1338