Abstract
We have carried absolute frequency measurements of the transition in 171Yb (the intercombination line), where the spin-1/2 isotope yields two hyperfine lines. The measurements rely on sub-Doppler spectroscopy to yield a discriminator to which a 556 nm laser is locked. The frequency reference for the optical frequency measurements is a high-quality quartz oscillator steered to the GNSS timescale that is bridged with a frequency comb. The reference is validated to by spectroscopy on the (clock) line in laser cooled and trapped 171Yb atoms. From the hyperfine separation between the and levels of we determine the hyperfine constant to be kHz.
Intercombination line frequencies in 171Yb validated with the clock transition
Daniel M. Jones, Frank van Kann and John J. McFerran
Department of Physics, The University of Western Australia, 6009 Crawley, Australia
Corresponding author: john.mcferran@uwa.edu.au
1 Introduction
The ytterbium line has proven to be an excellent choice for a frequency reference and time standard [1, 2, 3, 4]. While not a contender for state-of-the-art optical clocks, the knowledge of the absolute frequencies of the intercombination lines (ICLs) is important for comparison with atomic structure calculations [5, 6, 7, 8]. Complex modelling of the Yb atom becomes robust when the calculated energy level separations agree with measured values. Outputs of the atomic structure calculations, such as hyperfine structure constants, and isotope shift parameters become more reliable when there is such agreement. Also between calculated and measured hyperfine constants themselves. Isotope shift parameters have become particularly relevant in the recent work related to Dark Matter interactions [9, 10, 11]. In this light it is important that the ICL frequencies are measured carefully. The and lines of ytterbium are in common use in many experiments [9, 12, 13, 14, 15]. Locating the doubly-forbidden ( and ) clock transition can be challenging without access to a frequency comb and reference. However, knowledge of the ICL frequency can be used to calibrate a wavemeter and thereby bypass the need for such items.
We are further motivated to test the validity of previous measurements that employed a hydrogen maser as a frequency reference. Atkinson et al. [16] made use of absolute frequencies, but the only published value was for isotope 176Yb. In this previous work we carried out isotope shift spectroscopy on the ICL across all the naturally occurring isotopes (and hyperfine levels). Careful analysis of the absolute frequencies was not part of the investigation. Here, our focus is on the absolute frequencies of the ICL in 171Yb, where we have a carefully assessed clock transition () to act as an additional frequency reference. Previous measurements of the intercombination line frequencies in ytterbium include works by [17, 18, 19, 20], but these all relied on a Doppler broadened lines.
We have structured the paper as follows: In Sect. 2 we describe the experimental method beginning with the cold atom preparation, then detailing aspects of the GNSS frequency reference. A commercial GPS discipline oscillator was used, but since its 10 MHz reference signal lacks short term stability, we use it to steer a higher performing quartz oscillator that provides a reference for the frequency comb. Sect. C describes the frequency stabilization of the 578 nm light needed to probe the clock transition, along with the event sequence that is required to carry out the clock-line spectroscopy. Sect. 3 details results pertaining to the clock line spectroscopy and the intercombination line frequency measurements, before ending with conclusions.
2 Experimental Method
A Atom preparation for spectroscopy
We begin by describing the clock line spectroscopy that is performed on laser cooled atoms. The general scheme is illustrated in Fig. 1. The MOT operates in two stages: first with 399 nm light acting on the transition, then 556 nm light acting on the transition to reduce the atomic temperature to K. A dual tapered Zeeman slower (crossing zero magnetic field) assists with loading atoms into the MOT. The 399 nm light is generated by frequency doubling 798 nm light from a Ti:sapphire laser (Coherent MBR-E110) in a resonant cavity. The 556 nm light is produced by use of a second frequency doubling cavity, where the incident 1112 nm light originates from a fiber laser (Koheras) that injection locks a semiconductor laser (EYP-RWL-1120) [21]. The 399 nm light is stabilized by locking to the line in an effused beam of atoms before they reach a Zeeman slower. The 556 nm light is frequency stabilized by locking to the line of the atoms in the same thermal beam using a saturated absorption scheme (but modified to create an inverted crossover resonance (ICR) that grants higher signal-to-noise of the spectral line [22]). Laser frequencies are made tuneable by the use of acousto-optic modulators (AOMs).
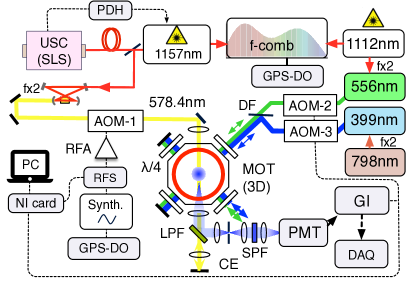
The clock-line laser at 578 nm is produced by use of a third frequency doubling cavity, where the master laser (at 1157 nm) is an extended cavity diode laser (LD1001 Time-Base), and Hänsch-Couillaud frequency stabilization is used for the doubling cavity [23, 24]. The yellow light frequency is tuned with an additional AOM (AOM-1 in Fig. 1) whose frequency is set with a synthesizer (Agilent E4428C) that is referenced to a GPS-disciplined oscillator (GPS-DO). Further discussion of the GPS-DO appears below. The optical frequencies of the 1157 nm and 1112 nm lasers are found by generating beat signals with a frequency comb. The optical frequencies of the visible counterparts are evaluated with
| (1) |
where and are the frequency comb’s mode spacing (repetition rate) and offset frequency, respectively ( MHz), is the beat frequency, is the mode number of the comb, and is the radio frequency of the AOM in the path of the 578 nm or 556 nm light (the latter is relevant to the ICL frequency measurements). The sign of may be positive or negative depending on the measurement. Some details of the comb have been discussed previously [25], so we make a brief summary here. Stabilization of the repetition rate occurs at GHz. This avalanche photodetector signal is phase locked to the sum of 20 MHz from a direct digital synthesizer (DDS) and 980 MHz from a dielectric resonator-oscillator. The GPS-DO frequency is doubled to 10 MHz, which acts as the reference frequency for the DDS, and to which the dielectric resonator-oscillator is phase-locked. The DDS frequency is set so that the relevant comb beat signals lie at the center of available bandpass filters. E.g., the 1157 nm beat signal lies at the center of a 30 MHz bandpass filter, while the 1157 nm laser is simultaneously locked to an utrastable cavity (described below).
B GPS disciplined oscillator
One may access GPS time with use of a GPS-DO [26], a GPS-disciplined frequency standard [27, 28], or by a GPS carrier phase link [29, 30], which includes precise point positioning (PPP) [31, 32, 33]. Our principal frequency reference is that of a GPS disciplined oscillator (GPS-DO), specifically the Trimble Thunderbolt with 10 MHz and PPS outputs. However, its 10 MHz signal only has a stability of between 1 s and 100 s before integrating down. To provide a better reference for the frequency comb we use an Oscilloquartz oscillator (OQO-8607-B) that exhibits a fractional frequency instability (FFI) of between 2 and 500 s. The frequency of the OQO is tuneable, which allows for stabilization of the OQO’s frequency over longer timescales ( s). This long term stabilization is carried out with the scheme shown in Fig. 2.
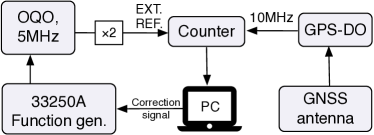
The PC records the counter’s frequency measurements of the 10 MHz signal from the GPS-DO with 3 s gate time. A mean value is determined every 160 samples (480 s), and the difference from precisely 10 MHz is used to produce a correction signal that steers the OQO. The correction signal is provided by a function generator (Agilent 33250A) in DC mode. The OQO thus becomes the disciplined oscillator. The tuning rate of the OQO in terms of the at 578 nm light frequency (as it is multiplied by the frequency comb) is 3.1 kHz/mV and the smallest incremental step is 100 V. The function generator’s DC level () is adjusted in proportion to the offset from 10 MHz, denoted . The gain (or tuning coefficient) used to correct the OQO is mV/mHz, such that for event . The time constant of the servo is 4.5 hrs. After an integration time of s the square root Allan variance of the counter’s measurement is and the mean offset from 10 MHz is 3.0 mHz (or 3 parts in ). Hence, the scheme ensures that there is synchronization between the GNSS receiver’s internal timing reference and the external clock (i.e., the OQO).
We need to mention that for many of the earlier measurements seen below, a slightly different scheme was employed. Rather than use the 10 MHz signal from the GPS-DO, we made use of the PPS (pulse per second) signal. The counter was set to make 1 s period measurements instead of counting 10 MHz. We have since realized that the counter was producing a gate-time dependent error. Only when the gate time of the counter is extended to 18 s does the error become insignificant. The effect created an offset in the clock line frequency measurements of in fractional terms. This shift has since been accounted for in the inter-combination line data (further discussion appears below). The scheme using the PPS was tested with both a Novatel Propak6 and the Trimble Thunderbolt unit. They both generated the same offset (for the same gate dead time of 6 s).
C Laser stabilization and event sequence
For the 171Yb clock line spectroscopy a 1157 nm laser is stabilized with use of an ultrastable cavity (USC) and Pound-Drever-Hall lock developed by Stable Laser Systems [24]. The linear coefficient of thermal expansion is zero at ∘C, and the second order thermal expansion coefficient is K-2 (for THz). These were measured with the aid of a hydrogen maser (in our lab). The free spectral range of the cavity is 1496.52 MHz. By locking to the fundamental mode of the cavity and offsetting the 578 nm light by MHz with AOM-1, the transition frequency is reached. The drift rate of the 1157 nm laser locked to the USC is mHz/s. This was deduced by comparing the change in the AOM frequency at the center of the line over 8 months (and accounting for the factor of 2). This is also observed by a more direct comparison between the USC stabilised laser and the GNSS signal via the frequency comb, but with some variation either side of 17 mHz/s from month to month.
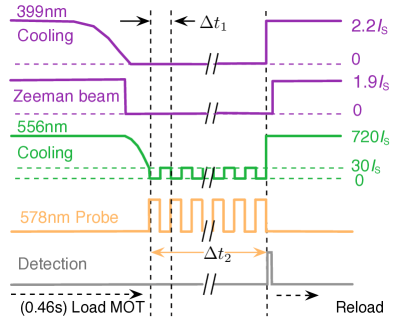
The event sequence for the clock line spectroscopy is presented in Fig. 3. Each cycle has a duration of 0.5 s, the majority of which is used to load atoms into the MOT. The 399 nm light is ramped down over 20 ms during which time the second stage cooling with 556 nm light takes effect. The 556 nm intensity is also ramped down over a similar timescale to reduce the temperature of the atoms to K [35]. The magnetic quadrupole field is held fixed with a -axis gradient of 0.42 Tm-1 (the -axis is into the page of Fig. 1). To avoid light-shifting the atoms the 556 nm and 578 nm light pulses are interleaved with a duration of 600 s for the yellow light and 400 s for the green light (for later measurements it is 500 s for both: the difference is not significant). This interleaving lasts for a period of 40 ms, after which the 399 nm is switched back on and detection of the ground state atoms is made (and MOT loading recommences). The maximum intensity of the 578 nm light was 39 kWm-2 with a corresponding Rabi frequency, , of 11 kHz (representing 1/20th of the transition linewidth). Fluorescence at 399 nm is filtered both spatially and spectrally before detection with a photomultiplier tube (PMT, Hamamatsu H10492-001) [36]. The PMT signal is received by a gated integrator (SRS SR250), which outputs to a digital volt meter for data acquisition. The gated integrator is triggered by the main control sequence program so that detection is made within 300 s of the 399 nm light resuming (the SNR of the clock line spectrum is not sensitive to this value). The gate width was set to a maximum of 15 s. The interleaved pulse technique has previously been applied to lines in strontium [37], ytterbium [38], and mercury [39].
3 Absolute frequency measurements
A Clock-line spectroscopy
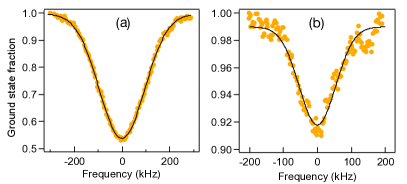
The majority of the clock-line frequency measurements reported here rely on line fitting to the Doppler profile produced by the cold cloud of slow moving Yb atoms (when shelved to the level by the 578 nm probe light). An example of the spectrum is shown in Fig. 4(a). This was recorded with a Rabi frequency of 11kHz. About 45 % of the atomic population in the ground state is depleted. From the Gaussian line shape fit the FWHM is 220 kHz. The time taken to generate the trace was 80 s. A Gaussian line shape was used expecting the spectrum to be thermally (Doppler) broadened. However, this is not completely the case. Figure 4(b) shows a spectrum taken with a much lower intensity (Rabi frequency = 0.9 kHz). The FWHM here is 130 kHz. Assuming Doppler broadened, this corresponds to a temperature of 20 K, which is consistent with temperature measurements relying on ballistic expansion [22]. For all the clock line frequency measurements reported here we used the higher intensity with higher SNR. There was no observable light shift at the different intensities, as discussed below. Our Rabi frequency estimates rely on a natural line width estimate of 43 mHz from Derevianko and Porsev [40], used in the expression , where is the natural inewidth, is the intensity and W m-2 is the saturation intensity.
For all measurements of the transition frequency the 578 nm light was retro-reflected with a cat’s eye (lens-mirror combination). About 60% of the 578 nm light reaches the atoms on the return pass (the loss being due to a long-pass filter used to reflect 399 nm fluorescence to the PMT). Under optimal conditions one may expect to see a recoil doublet, due to the atom’s recoil when absorbing/emitting a photon [39]. For the clock transition in 171Yb the recoil peak separation should be 6.98 kHz, which is just below the current resolution. Instead we observe a single saturated absorption dip (such a dip with Yb was mentioned by Hoyt et al. [38]). Examples are shown in Fig. 5. The time taken for the sweep varied from 80 s for Figs. 5(c) to 5(f), 100 s for Fig. 5(b), to 160 s for Fig. 5(a).
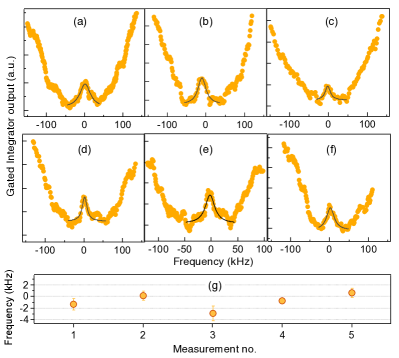
The curve fits are Lorentzian line shape functions. The mean of FWHM of the saturation features shown here is 23 kHz. There is some line width dependence on 578 nm light intensity, but for frequency measurements we use the maximum light available to enhance the SNR. The background Doppler profile at the time of these measurements was 300 kHz full-width at half maximum, only the base of which is shown here. An important aspect is that the saturation dip lies near the center of the Doppler profiles. These saturation dips were only observed when the yellow and green light was interleaved during the probe period. A set of frequency measurements based on saturation dips (or peaks in this case) is shown in Fig. 5(g). There was approximately 4 minutes between measurements. The statistical (1-) variation here is 1.4 kHz. Unfortunately, after a time this saturation feature could not be reproduced on demand. The main experimental change since these traces were recorded is that the number of atoms has more than halved due to a significant reduction in 798 nm laser power. Despite this, the SNR of the Doppler background (e.g. Fig. 4a) has improved to the point where the statistical uncertainty of the line-center frequencies is comparable with that seen here. The number of atoms contributing to the clock line signal is now .
The transition (with a lifetime of 4 s) has very low sensitivity to environmental factors [41] and most systematic shifts are negligible at kilohertz resolution; however, care must be taken to ensure the atoms are not exposed to laser light during the excitation phase(s). The 399 nm light is blocked with a physical shutter (Cambridge Technology Inc.) during the 578 nm probe. For the 500 s probe pulses the 556 nm light is not physically blocked but switched off via AOM-2. The residual light intensity is . We find that this produces negligible shift at the kilohertz level. In support of this we present light shift measurements due to the 556 nm MOT beams in Fig. 6(a) looking initially at the data points marked with triangles. Rather than interleave the 556 nm and 578 nm light, a full 40 ms pulse of 578 nm is applied and different levels of 556 nm light are imposed on the atoms. Only at zero intensity are the two beams interleaved. The light shift dependence is approximately linear.
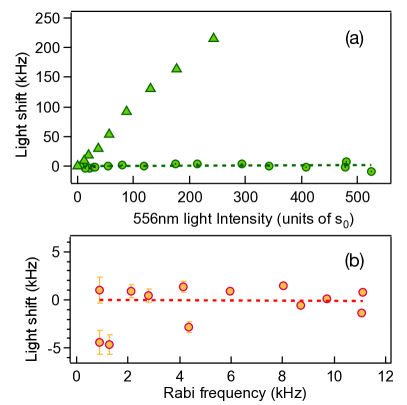
Of importance is that there is no discontinuity between the zero-intensity case and the extrapolation of the bulk data. Thus, we can be assured that the residual 556 nm light is producing negligible shift. The data points with marked with circles in Fig. 6(a) show the result of changing the green light intensity when using the interleaved method. The line of best fit has a slope that is almost zero. For the clock line spectroscopy we operate at a 556 nm beam intensity of , which has a corresponding shift of +0.2 kHz. For completeness we also present the AC Stark shift of the transition as a function of the 578 nm intensity, where the intensity is expressed in units of Rabi frequency (Fig. 6b). The slope is zero within the measurement uncertainty. At the lowest intensity the FWHM reduced to 130 kHz (as seen above).
The gated integrator averages over 3 samples (with an exponential moving average). The leads to a hysteresis-like effect on the line profiles causing a line-center shift. To counter this we scan in both directions and take the mean of the two for the line-center frequency. For example, for or a scan across 400 kHz in 80 s the corresponding shift is 8.5(0.3) kHz.
Our absolute frequency measurements of the transition in 171Yb are shown in Fig. 7(a). The frequencies are offset by the recommended BIPM value of kHz [42], which follows from the work of several research institutes [3, 2, 43]. The weighted mean offset from the well established frequency is 5.9(0.9) kHz (or in fractional units). An offset is to be expected when relying on the Doppler line shapes. During the excitation pulses the atoms are in free fall. The change in their velocity due to gravity over 500s has a corresponding mean Doppler shift of 4.2 kHz [38]. Since the downward beam has more intensity than the reverse beam, it plays a greater role in forming the line shape. This downward beam frequency is redshifted with respect to the falling atoms (hence the measured frequency is slightly higher than expected). The 4.2 kHz shift does not account fully for the 5.9 kHz offset, but it lies within 2-. The difference corresponds to 3.2 parts in .
Other perturbations to the optical transition frequency were explored. An examination was made of AC Stark shifts; for example, from the 556 nm beams as described above. There was some evidence that the far-detuned (-7 ) Zeeman slower beam was producing a light shift. To mitigate this the Zeeman slower beam was blocked (with a physical shutter) during the 578 nm probe. This was implemented at day 164. One sees that the frequency variations have reduced beyond this time. As well as inserting the shutter, the Zeeman beam was weakly focussed giving rise to a larger number of atoms in the MOT, thus increasing the SNR and reducing the line-center uncertainty. In retrospect, the Zeeman beam appears to have produced very little light shift (comparing data before and after day 164). Shifts with respect to a bias magnetic field were tested, but as expected for the transition there was no observable shift.
Systematic shifts were investigated on the side of the GNSS frequency reference. These included: (i ) the cable length between GNSS antenna and receiver, (ii) the cable length between receiver and counter, and (iii) receiver temperature. No shifts were found at the kilohertz level. A check was also made with regard to the frequency comb. The integrity of the DDS was tested by changing its reference frequency from 10 MHz to 220 MHz. The 220 MHz was provided by a synthesiser referenced to the OQO. Shifts in the 1157 nm comb beat frequency were less than 100 Hz (in the noise).
B Intercombination line measurements
The link with GNSS time provides a reliable means of measuring the intercombination line frequencies in Yb (in conjunction with the Yb clock line). Here we focus on two lines: ( and ). We will denote the two lines as and , respectively. The natural linewidth of this transition is 184 kHz [44]. We point out that there is a slight difference in the experimental approach between the two lines. Both are methods with sub-Doppler resolution. For we use the more typical saturated absorption scheme where the background magnetic field is cancelled so all the upper levels are degenerate. For we use a small bias field (0.09 mT) to generate an inverted crossover resonance (ICR). In both cases the light polarization is parallel to the magnetic field so that , and third harmonic detection is used in the signal demodulation. The saturated absorption spectroscopy (SAS) and ICR schemes make use of a thermal Yb beam leading to the Zeeman slower and MOT. Laser light at 1112 nm is frequency doubled in a resonant frequency doubling cavity producing 556 nm light for the saturation spectroscopy (as well as for second stage atomic cooling in the main clock chamber). Further details of the SAS and ICR setups may be found in [45, 16]. The fundamental light (1 mW) is combined with light from the frequency comb on an avalanche photodiode, generating a beat note with frequency . The comb light is bandpass filtered with a 15 nm FWHM filter. Based on the parameters of the frequency comb ( MHz, and depend on the line), and the frequency of AOM-2 (108.80 MHz) that tunes the 556 nm light frequency, we can determine the absolute optical frequency of the transition by use of Eq. 1.
The dominant systematic shifts and their uncertainties are listed in Table 1 for the two lines. The central column is data for (the inverted crossover resonance). It experiences smaller shifts with regard to beam alignment and the cat’s eye lens position compared to ; furthermore, has no discernible shift with respect to the magnetic field at the kilohertz level due to the nature of the resonance [22]. The only systematic that requires a correction is the AC Stark shift (values are stated in the Table 1 heading). The cat’s eye provides parallelism between the forward and reverse beams and reduces the sensitivity to beam alignment. Shifts associated with horizontal beam alignment are negligible, but there remains sensitivity to vertical beam alignment.
| Effect | ||
|---|---|---|
| (kHz) | (kHz) | |
| Cat’s eye lens position | 11 | 47 |
| Cat’s eye mirror position | 8 | 8 |
| AC Stark shift | 2 | 3 |
| 1st order Zeeman | 0 | 4 |
| Servo error | 3 | 3 |
| Vertical beam alignment | 31 | 48 |
| Total | 34 | 68 |
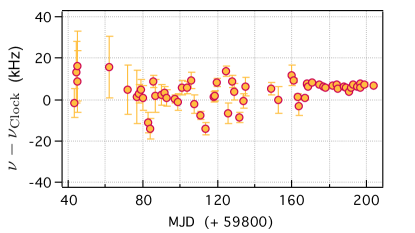
Absolute frequency measurements of the 171Yb transition, recorded over 240 days, are shown in Fig. 8. For the majority of this data a correction has been applied due to the counter inaccuracy mentioned above. At the clock line frequency the shift between the two GPS servo methods was (2.0) kHz. The ICL frequencies have therefore been reduced by 33.0 kHz (it scales by the ratio of the optical frequencies). The thick solid line shows a measured value from 2019, taken using a hydrogen maser as the main frequency reference (the absolute values were used in Ref. [16], but they were not published). The measurements taken with the GNSS reference are in good agreement with the previous measurement. Both the data in Fig. 8 and the 2019 measurement include a kHz light shift. Accounting for this, the mean frequency is 539 390 405 756.0 (2.4)Stat (68.0)Sys kHz. The systematic uncertainty is represented by the shaded region in Fig. 8. The statistical (systematic) uncertainty corresponds to 1.3 % (37 %) of the natural line width of the transition.
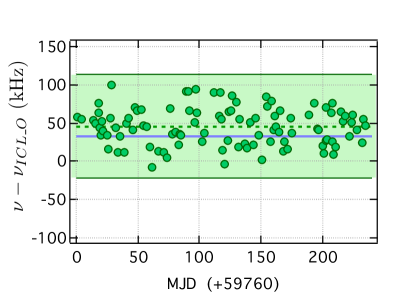
Similar measurements were performed for the 171Yb (=1/2) line as summarised in Fig. 9. The frequency is offset by kHz, where ICR implies it is an inverted crossover resonance.
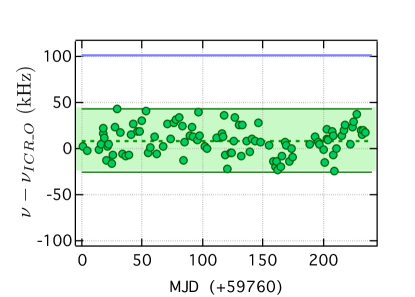
The statistical variation is slightly less than that of , which relates to the observation that is less susceptible to beam pointing variations than (the former relies on a larger subsection of atoms in the atomic beam or rather, two ever-so-slightly diverging sets of the atoms [22]). There is an offset from a 2019 measurement taken with the H-maser. It is attributed to a ground-loop that created a voltage offset at the input of the integrating operational amplifier (op-amp) used to lock the 1112 nm laser. A sign switch preceded the integrator and the effect was only manifest for the non-invert condition, hence, it only affected the ICR and not the SAS, which have opposite slope discriminators. The input offset of the integrating op-amp causes a shift of -1.51(8) kHz/mV in the infrared. It can be nulled to within a 1 mV producing a systematic uncertainty in the visible of 3 kHz. Our estimate for the 171Yb line frequency is 539 384 469 010.1 (1.6)Stat (34.0)Sys kHz. Here the light shift correction is only +1.8 kHz.
The reliance on GNSS can be minimised by considering the ratios of the optical frequencies when systematic shifts of the clock line frequency are mitigated [46]. When the beat frequencies for any two lines are measured with the comb set to the same repetition frequency, then the frequency ratio between the lines can be written as
| (2) |
where
| (3) |
The values of and are different for the two lines, hence the two values of and (the AOM frequencies are divided by 2 when computing in the infrared). The relative magnitude of the and terms of Eq. 2 are parts in , so the influence of the GPS-DO through becomes insignificant. The mode numbers for the green () and yellow lines are and , respectively, giving . With regard to the frequency comb, the main change made is that the DDS is held at 20 000 550 Hz for all the beat frequency measurements. This moves the 1157 nm beat to -60.5 MHz (from 30.2 MHz). Measurement of the first order corrections over a series of 40 daily measurements gives . This is a separate set of measurements from those of Fig. 8 and Fig. 9. With use of the BIPM value for (the clock line) we find the frequency of the () line to be 539 390 405 768.5 (4.5)Stat (68.0)Sys kHz. By a similar process, for the () line the mean frequency is 539 384 469 005.2 (4.2)Stat (34.0)Sys kHz. The light shift corrections have been applied post multiplication of the clock line frequency. The frequency for is 12.6 kHz higher than that obtained using the direct frequency comb measurement. For the difference is only kHz. Both differences are well within the systematic uncertainties.
Given the frequencies of the two 171Yb hyperfine lines we can determine their hyperfine separation. For this purpose we will take a weighted mean (based on the statistical uncertainties) of the two values measured by the two methods discussed above. The resultant frequencies are therefore: 539 390 405 761 (69) kHz for and 539 384 469 009 (35) kHz for . The hyperfine separation is found to be 5 936 749 (41) kHz. The uncertainty here is not a simple RMS sum because most of the systematic shifts are partially common between the two lines. The hyperfine constant in 171Yb is two thirds of the hyperfine separation, giving kHz. This is higher than the value reported by Pandey et al. by 52 kHz [17], but well within our overlapping uncertainties.
4 Conclusions
With the knowledge of the absolute frequencies of the transition frequency and the ICL () we evaluate the difference between them to be 21 094 569 168 (69) kHz. The uncertainty is dominated by that of the ICL. This value may be used for comparison in atomic structure calculations involving Yb i when computing the energies of levels. It can also assist with finding the clock transition should a frequency comb and accurate reference not be available (e.g. with a wave-meter).
To summarize, we have measured the absolute frequencies of the 171Yb (=1/2) and (=3/2) lines, where the GNSS timescale has been used to provide a frequency reference (the final values are stated just above). The frequency for the (=3/2) line is consistent with previous (unpublished) measurements that relied on a hydrogen maser as the reference. The frequency for the (=1/2) line departed slightly from a H-maser based measurement for reasons discussed in Sect. B. These measurements provide a new value for the hyperfine constant . The GNSS reference was validated by carrying out frequency measurements of the 171Yb clock transition. The clock line spectroscopy on laser cooled Yb atoms revealed a saturation dip free from the first-order Doppler shift, but for the majority of the measurements the 200 kHz wide Doppler profile was used. The line-centre frequency agreed with the CODATA value to almost 3 parts in . Access to the absolute ICL frequencies of the other ytterbium isotopes can be made via previously measured isotope shifts [16, 17].
Acknowledgment
We thank E. Ivanov and M. Goryachev for the use of the Oscilloquartz oscillator and C. Blair for the loan of the Trimble Thunderbolt. We are grateful to N. Nemitz for suggesting the ratio approach for optical frequency measurements. We thank L. Nenadović for proofreading the manuscript.
Funding Australian Research Council LE110100054.
Disclosures The authors declare no conflicts of interest.
References
- [1] K. Beloy, M. I. Bodine, T. Bothwell, S. M. Brewer, S. L. Bromley, J.-S. Chen, J.-D. Deschênes, S. A. Diddams, R. J. Fasano, T. M. Fortier, Y. S. Hassan, D. B. Hume, D. Kedar, C. J. Kennedy, I. Khader, A. Koepke, D. R. Leibrandt, H. Leopardi, A. D. Ludlow, W. F. McGrew, W. R. Milner, N. R. Newbury, D. Nicolodi, E. Oelker, T. E. Parker, J. M. Robinson, S. Romisch, S. A. Schäffer, J. A. Sherman, L. C. Sinclair, L. Sonderhouse, W. C. Swann, J. Yao, J. Ye, X. Zhang, and B. A. C. O. N. B. Collaboration*, “Frequency ratio measurements at 18-digit accuracy using an optical clock network,” Nature 591, 564–569 (2021).
- [2] M. Pizzocaro, P. Thoumany, B. Rauf, F. Bregolin, G. Milani, C. Clivati, G. A. Costanzo, F. Levi, and D. Calonico, “Absolute frequency measurement of the transition of 171Yb,” Metrologia 54, 102 (2017).
- [3] N. Nemitz, T. Ohkubo, M. Takamoto, I. Ushijima, M. Das, N. Ohmae, and H. Katori, “Frequency ratio of Yb and Sr clocks with uncertainty at 150 seconds averaging time,” Nat. Photon. 10, 258–261 (2016).
- [4] K. Beloy, N. Hinkley, N. Phillips, J. Sherman, M. Schioppo, J. Lehman, A. Feldman, L. Hanssen, C. Oates, and A. Ludlow, “Atomic clock with room-temperature blackbody stark uncertainty,” Phys. Rev. Lett. 113, 260801 (2014).
- [5] J. S. Schelfhout and J. J. McFerran, “Isotope shifts for Yb lines from multiconfiguration Dirac-Hartree-Fock calculations,” Phys. Rev. A 104, 022806 (2021).
- [6] V. Dzuba and A. Derevianko, “Dynamic polarizabilities and related properties of clock states of the ytterbium atom,” J. Phys. B 43, 074011 (2010).
- [7] S. G. Porsev, Y. G. Rakhlina, and M. G. Kozlov, “Calculation of hyperfine structure constants for ytterbium,” Journal of Physics B: Atomic, Molecular and Optical Physics 32, 1113–1120 (1999).
- [8] W. Liu, M. Dolg, and L. Li, “Fully relativistic density functional calculations of the ground and excited states of Yb, YbH, YbF, and YbO,” The Journal of Chemical Physics 108, 2886–2895 (1998).
- [9] K. Ono, Y. Saito, T. Ishiyama, T. Higomoto, T. Takano, Y. Takasu, Y. Yamamoto, M. Tanaka, and Y. Takahashi, “Observation of nonlinearity of generalized king plot in the search for new boson,” Phys. Rev. X 12, 021033 (2022).
- [10] N.-H. Rehbehn, M. K. Rosner, H. Bekker, J. C. Berengut, P. O. Schmidt, S. A. King, P. Micke, M. F. Gu, R. Müller, A. Surzhykov, and J. R. C. López-Urrutia, “Sensitivity to new physics of isotope-shift studies using the coronal lines of highly charged calcium ions,” Phys. Rev. A 103, L040801 (2021).
- [11] I. Counts, J. Hur, D. P. L. Aude Craik, H. Jeon, C. Leung, J. C. Berengut, A. Geddes, A. Kawasaki, W. Jhe, and V. Vuletić, “Evidence for nonlinear isotope shift in Yb+ search for new boson,” Phys. Rev. Lett. 125, 123002 (2020).
- [12] F. Gerbier and J. Dalibard, “Gauge fields for ultracold atoms in optical superlattices,” New J. Phys. 12, 033007 (2010).
- [13] A. Guttridge, M. D. Frye, B. C. Yang, J. M. Hutson, and S. L. Cornish, “Two-photon photoassociation spectroscopy of CsYb: Ground-state interaction potential and interspecies scattering lengths,” Phys. Rev. A 98, 022707 (2018).
- [14] C. Bruni and A. Görlitz, “Observation of hyperfine interaction in photoassociation spectra of ultracold RbYb,” Phys. Rev. A 94, 022503 (2016).
- [15] S. Nakajima, T. Tomita, S. Taie, T. Ichinose, H. Ozawa, L. Wang, M. Troyer, and Y. Takahashi, “Topological Thouless pumping of ultracold fermions,” Nature Physics 12, 296 (2016).
- [16] P. E. Atkinson, J. S. Schelfhout, and J. J. McFerran, “Hyperfine constants and line separations for the intercombination line in neutral ytterbium with sub-Doppler resolution,” Phys. Rev. A 100, 042505 (2019).
- [17] K. Pandey, A. K. Singh, P. V. K. Kumar, M. V. Suryanarayana, and V. Natarajan, “Isotope shifts and hyperfine structure in the 555.8-nm line of Yb,” Phys. Rev. A 80, 022518 (2009).
- [18] W. van Wijngaarden and J. Li, “Measurement of isotope shifts and hyperfine splittings of ytterbium by means of acousto-optic modulation,” J. Opt. Soc. Am. B 11, 2163–2166 (1994).
- [19] W.-G. Jin, T. Horiguchi, M. Wakasugi, T. Hasegawa, and W. Yang, “Systematic study of isotope shifts and hyperfine structures in Yb I by atomic-beam laser spectroscopy,” Journal of the Physical Society of Japan 60, 2896–2906 (1991).
- [20] D. Clark, M. Cage, D. Lewis, and G. Greenlees, “Optical isotopic shifts and hyperfine splittings for Yb,” Phys. Rev. A 20, 239 (1979).
- [21] N. Kostylev, C. R. Locke, M. E. Tobar, and J. J. McFerran, “Spectroscopy and laser cooling on the line in Yb via an injection-locked diode laser at 1111.6 nm,” Applied Physics B 118, 517–525 (2015).
- [22] L. A. Salter, E. de Clercq, and J. J. McFerran, “Inverted crossover resonance within one Zeeman manifold,” Journal of Physics B: Atomic, Molecular and Optical Physics 50, 165003 (2017).
- [23] T. Hänsch and B. Couillaud, “Laser frequency stabilization by polarization spectroscopy of a reflecting reference cavity,” Optics Communications 35, 441 – 444 (1980).
- [24] L. Nenadović and J. McFerran, “Clock and inter-combination line frequency separation in 171Yb,” Journal of Physics B: Atomic, Molecular and Optical Physics 49, 065004 (2016).
- [25] J. S. Schelfhout, L. D. Toms-Hardman, and J. J. McFerran, “Fourier transform detection of weak optical transitions in atoms undergoing cyclic routines,” Applied Physics Letters 118, 014002 (2021).
- [26] F.-L. Hong, M. Takamoto, R. Higashi, Y. Fukuyama, J. Jiang, and H. Katori, “Frequency measurement of a Sr lattice clock using an SI-second-referenced optical frequency comb linked by a global positioning system (GPS),” Opt. Express 13, 5253 (2005).
- [27] R. Zinkstok, S. Witte, W. Ubachs, W. Hogervorst, and K. Eikema, “Frequency comb laser spectroscopy in the vacuum-ultraviolet region,” Phys. Rev. A 73, 61801 – 1 (2006).
- [28] A. Gambetta, N. Coluccelli, M. Cassinerio, T. T. Fernandez, D. Gatti, A. Castrillo, A. Ceausu-Velcescu, E. Fasci, L. Gianfrani, L. Santamaria, V. Di Sarno, P. Maddaloni, P. De Natale, P. Laporta, and G. Galzerano, “Frequency-comb-assisted precision laser spectroscopy of CHF3 around 8.6 m,” The Journal of Chemical Physics 143, 234202 (2015).
- [29] K. Larson and J. Levine, “Carrier-phase time transfer,” IEEE Transactions on Ultrasonics, Ferroelectrics, and Frequency Control 46, 1001–1012 (1999).
- [30] M. Takamoto, F. L. Hong, R. Higashi, Y. Fujii, M. Imae, and H. Katori, “Improved frequency measurement of a one-dimensional optical lattice clock with a spin-polarized fermionic Sr-87 isotope,” J. Phys. Soc. Jpn. 75, 104302 (2006).
- [31] G. Petit, A. Kanj, S. Loyer, J. Delporte, F. Mercier, and F. Perosanz, “ frequency transfer by GPS PPP with integer ambiguity resolution,” Metrologia 52, 301 (2015).
- [32] H. Hachisu, G. Petit, and T. Ido, “Absolute frequency measurement with uncertainty below using International Atomic Time,” Applied Physics B 123, 34 (2016).
- [33] P. Dubé, J. E. Bernard, and M. Gertsvolf, “Absolute frequency measurement of the 88Sr+ clock transition using a GPS link to the SI second,” Metrologia 54, 290 (2017).
- [34] P. Defraigne, GNSS Time and Frequency Transfer (Springer International Publishing, Cham, 2017), pp. 1187–1206.
- [35] J. J. McFerran, “Laser stabilization with a frequency-to-voltage chip for narrow-line laser cooling,” Opt. Lett. 43, 1475–1478 (2018).
- [36] N. Kostylev, E. Ivanov, M. Tobar, and J. McFerran, “Sub-Doppler cooling of ytterbium with the transition including 171Yb (I=1/2),” J. Opt. Soc. Am. B 31, 1614 (2014).
- [37] I. Courtillot, A. Quessada, R. P. Kovacich, A. Brusch, D. Kolker, J.-J. Zondy, G. D. Rovera, and P. Lemonde, “Clock transition for a future optical frequency standard with trapped atoms,” Phys. Rev. A 68, 030501 (2003).
- [38] C. Hoyt, Z. Barber, C. Oates, T. Fortier, S. Diddams, and L. Hollberg, “Observation and absolute frequency measurements of the optical clock transition in neutral ytterbium,” Phys. Rev. Lett. 95, 083003–1 (2005).
- [39] M. Petersen, R. Chicireanu, S. T. Dawkins, D. V. Magalhaes, C. Mandache, Y. L. Coq, A. Clairon, and S. Bize, “Doppler-free spectroscopy of the 1S0-3P0 optical clock transition in laser-cooled fermionic isotopes of neutral mercury,” Phys. Rev. Lett. 101, 183004 (2008).
- [40] A. Derevianko and S. G. Porsev, Accurate Evaluation of Parameters of Optical Lattice Clocks (Elsevier Inc., 2011), vol. 60 of Advances in Atomic, Molecular, and Optical Physics, chap. 9, p. 415.
- [41] S. Porsev, A. Derevianko, and E. Fortson, “Possibility of an optical clock using the 6 transition in 171,173Yb atoms held in an optical lattice,” Phys. Rev. A 69, 21403 – 1 (2004).
- [42] BIPM, “Recommended values of standard frequencies (www.bipm.org/en/publications/mises-en-pratique/standard-frequencies),” .
- [43] W. F. McGrew, X. Zhang, H. Leopardi, R. J. Fasano, D. Nicolodi, K. Beloy, J. Yao, J. A. Sherman, S. A. Schäffer, J. Savory, R. C. Brown, S. Römisch, C. W. Oates, T. E. Parker, T. M. Fortier, and A. D. Ludlow, “Towards the optical second: verifying optical clocks at the SI limit,” Optica 6, 448 (2019).
- [44] K. Beloy, J. Sherman, N. Lemke, N. Hinkley, C. Oates, and A. Ludlow, “Determination of the 5d6s state lifetime and blackbody-radiation clock shift in Yb,” Phys. Rev. A 86, 051404 (2012).
- [45] J. J. McFerran, “An inverted crossover resonance aiding laser cooling of 171Yb,” J. Opt. Soc. Am. B 33, 1278–1285 (2016).
- [46] N. Ohmae, F. Bregolin, N. Nemitz and H. Katori, “Direct measurement of the frequency ratio for Hg and Yb optical lattice clocks and closure of the Hg/Yb/Sr loop,” Opt. Express 28, 15112–15121 (2020).