Mapping the Decline with Redshift of Dusty Star-forming Galaxies Using JWST and SCUBA-2
Abstract
We use JWST NIRCam observations of the massive lensing cluster field A2744 to develop a red galaxy selection of Jy and that picks out all 9 ALMA 1.1 or 1.2 mm sources and 17 of the 19 SCUBA-2 850 m sources in the covered areas. We show that by using the red galaxies as priors, we can probe deeper in the SCUBA-2 850 m image. This gives a sample of 44 SCUBA-2 850 m sources with accurate positions, photometric redshifts, and magnifications. To investigate why our red galaxy selection picks out the 850 m sources, we next analyze an extended sample of 167 sources with Jy and . We find that the fainter sources in this sample are too faint to be detected in the SCUBA-2 850 m image. We also show that there is a strong drop between and (a factor of around 5) in the ratio of the far-infrared luminosity estimated from the 850 m flux to the (5000) at rest-frame 5000 Å. We argue that this result may be due to the high-redshift sources having less dust content than the lower redshift sources.
1 Introduction
Distant, dusty, extremely luminous galaxies (e.g., Smail et al., 1997; Barger et al., 1998; Hughes et al., 1998; Eales et al., 1999) are some of the most powerfully star-forming galaxies in the universe and are significant contributors to the total star formation history from to at least (e.g., Barger et al., 2000, 2014; Chapman et al., 2005; Wardlow et al., 2011; Casey et al., 2013; Swinbank et al., 2014; Cowie et al., 2017; Zavala et al., 2021). These dusty star-forming galaxies (DSFGs) (also known as submillimeter galaxies, or SMGs) are most easily found through wide-field submillimeter/millimeter imaging on single-dish telescopes, such as the James Clerk Maxwell Telescope (JCMT) with the SCUBA-2 camera (Holland et al., 2013), or, in the near future, the Large Millimeter Telescope with the TolTEC camera (Wilson et al., 2020).
The natural limit of single-dish submillimeter/millimeter surveys is the depth where confusion—the blending of sources, or where the noise is dominated by unresolved contributions from fainter sources—becomes important. For example, Cowie et al. (2017) give a confusion limit of 1.65 mJy for 850 m observations using SCUBA-2 on the 15 m JCMT.
The lack of positional accuracy is also a major problem when trying to ascertain the properties of DSFGs. Such identifications are critical for estimating photometric redshifts, modeling spectral energy distributions (SEDs), and determining morphologies. Historically, deep radio interferometric images were used to identify counterparts to SMGs (e.g., Barger et al., 2000; Smail et al., 2000; Ivison et al., 2002; Chapman et al., 2003), while, more recently, submillimeter/millimeter interferometry with the Submillimeter Array (SMA; Ho et al. 2004), NOEMA (and, previously, the IRAM Plateau de Bure interferometer), and, most powerfully, the Atacama Large Millimeter/submillimeter Array (ALMA) have become essential tools for obtaining accurate positions, as well as for resolving some single-dish sources into multiple submillimeter/millimeter sources (e.g., Wang et al. 2011). However, interferometric observations have small fields of view, which make direct searches (e.g., Dunlop et al., 2017; González-López et al., 2017; Franco et al., 2018; Umehata et al., 2018; Casey et al., 2021; Fujimoto et al., 2023), or even follow-up observations of sources detected in single-dish surveys (e.g., Daddi et al., 2009; Barger et al., 2012; Walter et al., 2012; Hodge et al., 2013; Chen et al., 2014; Cowie et al., 2018; Stach et al., 2019; Jones et al., 2021; Cooper et al., 2022; Cairns et al., 2023), quite costly.
It has been recognized for some time that galaxies with extremely red infrared colors, such as the -4.5 m selected KIEROs of Wang et al. (2012) (the KIEROs acronym stands for and IRAC selected Extremely Red Objects) or the -4.5 m (also -3.6 m) selected HIEROs of Caputi et al. (2012), Wang et al. (2016b), and Alcalde Pampliega et al. (2019) (the HIEROs acronym stands for and IRAC selected Extremely Red Objects) are effective in picking out submillimeter/millimeter galaxies (Wang et al., 2012, 2019). However, the advent of JWST, with its extremely deep, very high spatial resolution near-infrared (NIR) observations, is set to revolutionize this field.
Using the CEERS JWST NIRCam data (JWST-ERS-1345), Barrufet et al. (2023) described the selection and properties of dark galaxies with 4.44 m to 1.6 m flux ratios (based on the Caputi et al. 2012 selection from Spitzer and HST). They showed that these are very dusty galaxies extending over a wide range of redshifts (–8). Although they suggested that their dark galaxies may be higher redshift, lower star formation rate (SFR) extensions of submillimeter/millimeter selected DSFGs, they did not match to the submillimeter/millimeter data in the field to relate their dark galaxies to DSFGs directly.
In the present paper, we demonstrate using observations of the massive lensing cluster field A2744 how ideally suited JWST NIRCam data are to finding DSFGs. The structure of the paper is as follows. In Section 2, we introduce the published datasets that we use in our analysis. In Section 3, we give our NIRCam color selection criteria that identify all of the known ALMA sources in the field. In Section 4, we use these criteria to find NIRCam counterparts to nearly all of the SCUBA-2 sources in the NIRCam-observed region, which allows us to obtain accurate positions for the SCUBA-2 sources. In Section 5, we invert this procedure and use our NIRCam color selected sample as priors to obtain deeper submillimeter measurements in the SCUBA-2 images. In Section 6, we use the photometric redshifts and magnifications of our NIRCam color selected sample to compare the far-infrared (FIR) luminosities to the rest-frame optical luminosities. In Section 7, we summarize our results.
We assume a cosmology of km s-1 Mpc-1, , and (Larson et al., 2011) throughout.
2 Data
A2744 is one of the six Hubble Frontier Field clusters (HFF; Lotz et al., 2017). A2744 has both deep SCUBA-2 observations from Cowie et al. (2022) and deep ALMA mosaics from the ALMA Lensing Cluster Survey (ALCS; 1.2 mm; Kohno 2019; Fujimoto et al. 2023) and the ALMA Frontier Fields Survey (AFFS; 1.1 mm; González-López et al. 2017). The AFFS has a threshold of 0.28 mJy. The very central regions of A2744 are relatively rich in luminous DSFGs. The mosaicked ALMA images, together with deeper follow-up ALMA observations (ALMA program #2017.1.01219.S; PI: F. Bauer), have yielded 9 ALMA sources. These are listed in Table 9 of Cowie et al. (2022), along with their known spectroscopic redshifts. Note that we have updated the spectroscopic redshift of the second A2744 source in the Cowie et al. (2022) table from to based on the ALMA CO observations of F. Bauer (priv. comm.); see Kokorev et al. (2023) for a detailed analysis of this source.
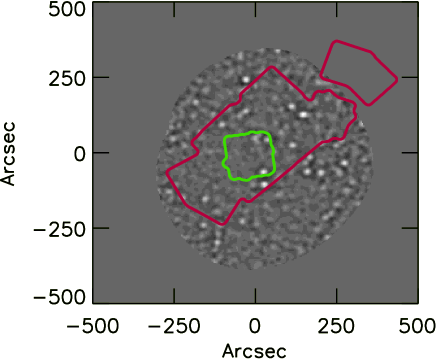
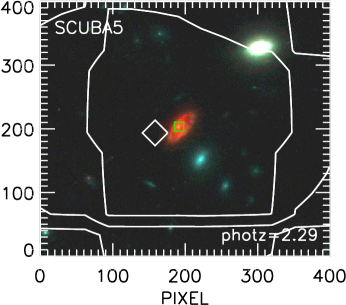
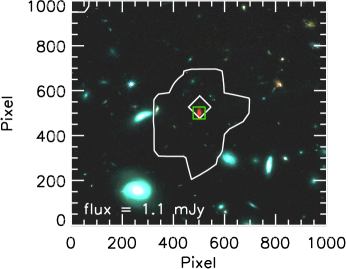
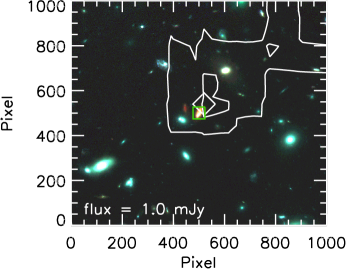
A2744 was the target of multiple JWST NIRCam programs (JWST-ERS-1324, JWST-GO-2561, JWST-DDT-2756). The combined images and a catalog were released by Paris et al. (2023) for the GLASS team, and images and a catalog were released by Weaver et al. (2023) for the UNCOVER team. In Figure 1, we show the areas covered by the combined ALMA mosaics (green) and the JWST NIRCam F444W data (red) of Paris et al. (2023), overlaid on the SCUBA-2 850 m matched filter image of Cowie et al. (2022). In this work, we adopt the Paris et al. (2023) isophotal flux catalog. We visually inspected the images at the catalog positions in theses areas to flag artifacts and identify objects that are likely parts of a single object. In these latter cases, we combined the fluxes from the parts to provide a single flux for the object. We note that there is substantial patterning in some regions of the images, so visual inspection is important.
The Weaver et al. (2023) catalog gives photometric redshifts obtained from the EAZY code (Brammer et al., 2008) and magnifications based on the source positions and redshifts (Furtak et al., 2023). In this work, we adopt these photometric redshifts and magnifications (), but we note that the Weaver et al. (2023) catalog does not fully cover the JWST NIRCam image from Paris et al. (2023).
| ALMA | ALMA | SCUBA-2 | JWST NIRCam | Redshift | ||||
|---|---|---|---|---|---|---|---|---|
| No. | R.A. | Decl. | 850 m | 450 m | Ratio | |||
| (J2000.0) | (mJy) | (Jy) | ||||||
| (1) | (2) | (3) | (4) | (5) | (6) | (7) | (8) | (9) |
| 1 | 3.5825000 | -30.385473 | 1.82(0.27) | 3.07(2.93) | 7.21(0.019) | 0.73(0.011) | 9.84 | 2.99(2.92,3.09) |
| 2 | 3.5764582 | -30.413166 | 6.37(0.27) | 13.6(3.01) | 1.41(0.003) | 0.18(0.002) | 7.52 | 2.585 |
| 3 | 3.5850000 | -30.381777 | 3.27(0.28) | 9.30(2.97) | 20.2(0.047) | 4.40(0.023) | 4.60 | 3.058 |
| 4 | 3.5732501 | -30.383472 | 3.37(0.27) | 21.8(3.01) | 29.2(0.026) | 7.34(0.014) | 3.97 | 1.498 |
| 5 | 3.5796666 | -30.378389 | 1.67(0.29) | 5.38(3.04) | 19.5(0.039) | 1.87(0.015) | 10.4 | 2.409 |
| 6 | 3.5720000 | -30.382944 | 4.18(0.27) | 20.7(3.03) | 44.0(0.042) | 5.38(0.022) | 8.17 | 1.83(1.55,1.89) |
| 7 | 3.5920832 | -30.380472 | -0.3(0.29) | 4.88(3.02) | 8.20(0.013) | 0.22(0.008) | 36.4 | 2.644 |
| 8 | 3.5812500 | -30.380196 | 1.78(0.28) | -6.5(3.01) | 3.32(0.019) | 0.13(0.010) | 25.0 | 3.50(3.23,3.53) |
| 9 | 3.5824583 | -30.377167 | 0.49(0.30) | 8.30(3.07) | 2.14(0.019) | 0.35(0.008) | 5.96 | 4.25(4.11,4.41) |
Note. — The columns are (1) ALMA source number, (2) and (3) ALMA R.A. and decl., (4) and (5) SCUBA-2 850 m and 450 m fluxes (uncertainties in parentheses) measured at each ALMA position, (6), (7), and (8) F444W and F150W fluxes (uncertainties in parentheses) and their ratio (these fluxes are from the Paris et al. 2023 catalog), and (9) redshift (see Section 2; spectroscopic has three digits after the decimal point, while photometric has two digits after the decimal point, with the 16th and 84th percentiles of the posterior given in parentheses).
| SCUBA-2 | JWST NIRCam | SCUBA-2 | JWST NIRCam | ALMA | Redshift | ||||
|---|---|---|---|---|---|---|---|---|---|
| No. | R.A. | Decl. | 850 m | 450 m | Ratio | No. | |||
| (J2000.0) | (mJy) | (mJy) | |||||||
| (1) | (2) | (3) | (4) | (5) | (6) | (7) | (8) | (9) | (10) |
| 1 | 3.5362918 | -30.360361 | 7.63(0.38) | 32.1(4.01) | 43.5(0.02) | 7.06(0.02) | 6.16 | 1.82(1.69,1.92) | |
| 2 | 3.5761251 | -30.413166 | 6.36(0.27) | 13.9(3.01) | 3.11(0.00) | 0.15(0.00) | 20.5 | ALMA2 | 2.585 |
| 3 | 3.5755000 | -30.424389 | 6.18(0.29) | 8.72(3.35) | 5.00(0.02) | 0.14(0.01) | 34.0 | 3.76(2.64,3.91) | |
| 4 | 3.5490835 | -30.352222 | 5.29(0.41) | 15.7(3.93) | 16.9(0.02) | 2.23(0.01) | 7.61 | 2.60(2.43,2.68) | |
| 5 | 3.5473332 | -30.388306 | 5.12(0.30) | 16.9(3.64) | 19.8(0.02) | 1.81(0.01) | 10.9 | 2.29(2.13,2.61) | |
| 6 | 3.6172917 | -30.368832 | 4.66(0.38) | 7.82(3.58) | 30.3(0.02) | 8.35(0.01) | 3.62 | 3.50(2.46,3.50) | |
| 7 | 3.5938752 | -30.356638 | 4.66(0.42) | 19.7(4.01) | 92.2(0.04) | 22.5(0.02) | 4.09 | 1.40(1.36,1.87) | |
| 8 | 3.5720000 | -30.382973 | 4.18(0.27) | 20.7(3.03) | 44.0(0.04) | 5.38(0.02) | 8.17 | ALMA6 | 1.83(1.55,1.89) |
| 9 | 3.6341667 | -30.437721 | 4.27(0.37) | 21.3(4.02) | 4.50(0.03) | 0.28(0.01) | 15.5 | ⋆ | |
| 10 | 3.5849168 | -30.381777 | 3.27(0.28) | 9.30(2.97) | 20.2(0.04) | 4.40(0.02) | 4.60 | ALMA3† | 3.058 |
| 11 | 3.5990834 | -30.359779 | 2.68(0.40) | 6.54(3.81) | 60.8(0.04) | 15.7(0.02) | 3.86 | 1.26(1.22,1.35) | |
| 12 | 3.5404584 | -30.359249 | 2.45(0.38) | 10.3(3.95) | 2.93(0.01) | 0.52(0.00) | 5.64 | 2.91(2.13,3.09) | |
| 13 | 3.5332916 | -30.358639 | 3.54(0.38) | -11.0(4.07) | |||||
| 14 | 3.5796666 | -30.378389 | 1.67(0.29) | 5.38(3.04) | 19.5(0.03) | 1.87(0.01) | 10.4 | ALMA5 | 2.409 |
| 15 | 3.5579166 | -30.377140 | 2.46(0.31) | 6.54(3.40) | 28.3(0.02) | 9.34(0.02) | 3.03 | 2.62(2.56,2.65) | |
| 16 | 3.5863333 | -30.425028 | 1.54(0.31) | 5.97(3.44) | 9.83(0.03) | 1.93(0.01) | 5.08 | 3.62(3.52,3.67) | |
| 17 | 3.5809166 | -30.386139 | 1.10(0.27) | 1.36(2.92) | |||||
| 18 | 3.5600834 | -30.417528 | 2.07(0.28) | 6.02(3.27) | 21.8(0.04) | 3.43(0.01) | 6.35 | 1.48(1.47,1.63) | |
| 19 | 3.5850000 | -30.381748 | 3.27(0.28) | 9.30(2.97) | 20.2(0.04) | 4.40(0.02) | 4.60 | ALMA3† | 3.058 |
Note. — The columns are (1) SCUBA-2 source number, (2) and (3) R.A. and decl. of the JWST NIRCam counterpart, if there is one, or the SCUBA-2 850 m position otherwise, (4) and (5) SCUBA-2 850 m and 450 m fluxes (uncertainties in parentheses) measured at each SCUBA-2 position, (6), (7), and (8) F444W and F150W fluxes (uncertainties in parentheses) and their ratio for the sources with NIRCam counterparts (these fluxes are from the Paris et al. 2023 catalog), (9) ALMA source match from Table 1, if there is one, and (10) redshift (see Section 2; spectroscopic has three digits after the decimal point, while photometric has two digits after the decimal point, with the 16th and 84th percentiles of the posterior given in parentheses). ⋆This source lies off the photometric redshift catalog of Weaver et al. (2023). †Two SCUBA-2 sources are matched to the same ALMA counterpart (see Figure 5).
3 JWST NIRCam Properties of ALMA Sources
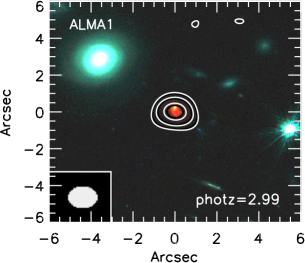
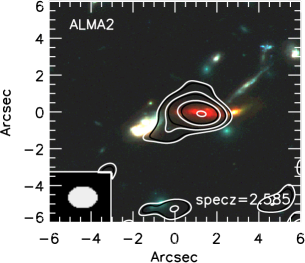
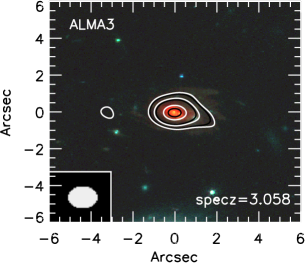
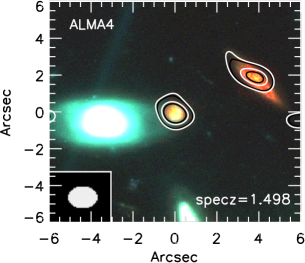
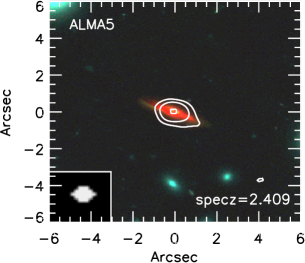
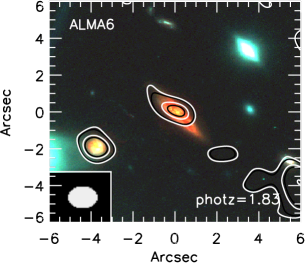
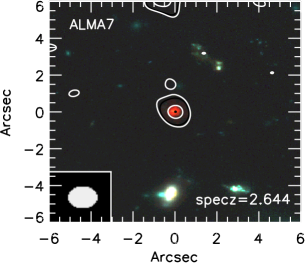
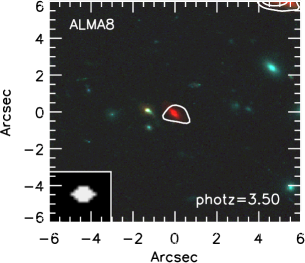
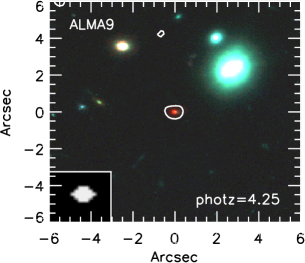
We used the ALMA positions to find the counterparts in the JWST NIRCam images of Paris et al. (2023). As we show with thumbnails in Figure 2, all 9 ALMA sources have bright red NIRCam counterparts, which closely match in position, and in some cases shape, to the ALMA images (white contours). In Table 1, we summarize the 850 m and 450 m fluxes and uncertainties measured from the SCUBA-2 images at the ALMA positions, along with the NIRCam F444W and F150W (4.44 m and 1.5 m) fluxes and uncertainties and their ratio. We also give the spectroscopic redshifts, where available, and otherwise the photometric redshifts and uncertainties.
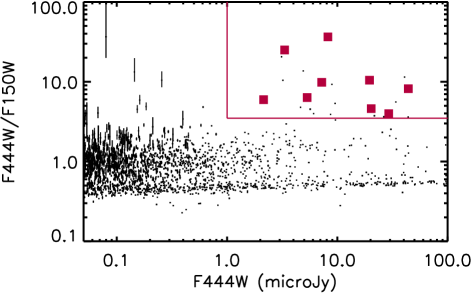
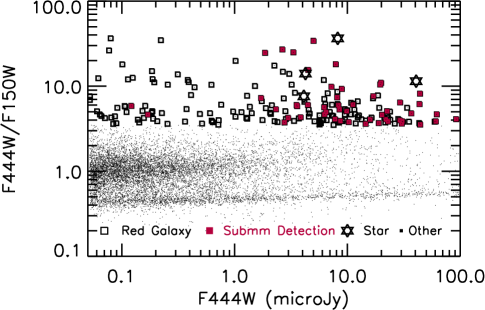
In Figure 3 (left), we plot for the 9 ALMA sources (red squares) and for the full JWST NIRCam sample in the area covered by the combined ALMA mosaics (black dots). Throughout, we show the data above Jy. Down to this level, is well defined, as can be seen from Figure 3 (left). All 9 ALMA sources lie in the upper right corner defined by Jy and (red lines). In what follows, we will use this flux and color selection to identify our sample of red galaxies.
Some of the other sources lying in the red galaxy region are detected at lower significance in the ALMA data. After combining one galaxy (second thumbnail in top row of Figure 2) that is divided into 4 parts in the Paris et al. (2023) catalog, there are 16 JWST NIRCam sources that satisfy our red galaxy selection criteria. Of these, 10 have detections in the AFFS mosaic, which has a minimum 1.1 mm rms of 0.055 mJy. One of the 9 ALMA sources is not included in this number, since it was detected in longer follow-up ALMA observations (ALMA program #2017.1.01219.S; PI: F. Bauer). Thus, in total, we have 11 ALMA sources, or 69% of our red galaxy sample.
In determining our red galaxy selection criteria, we used , which matches most closely to previous definitions of dark galaxies. (As we discussed in the Introduction, these previous works often used the Spitzer 4.5 m to HST 1.6 m flux ratio.) However, there may be other flux ratios we should consider.
The use of as our long-wavelength anchor is clear, since it is the reddest JWST NIRCam band, but as we illustrate in Figure 3 (right), another shorter wavelength band, such as F115W, could replace F150W. In this case, (horizontal line) contains all 9 ALMA sources. There is only a slightly higher contamination level for (i.e., non-ALMA sources above the horizontal line) than for (i.e., non-ALMA sources to the right of the vertical line), but both selections are comparably effective. There are 22 sources found by both selections. There are 2 additional sources that satisfy the selection but not the selection, and 1 additional source that satisfies the selection but not the selection. The figure also emphasizes that using multiple colors would only marginally improve the selection.
Use of the F150W band also avoids any contamination by galaxies. Castellano et al. (2023) report the detection of seven such galaxies in the A2744 JWST NIRCam field. While these galaxies are fainter than our flux selection threshold in F444W with fluxes in the 0.03 to 0.35 Jy range, they satisfy, by construction, our red color threshold in but not in . That is, they are flat at longer wavelengths and break at F115W.
4 JWST NIRCam Counterparts to SCUBA-2 Sources
We next aim to see whether we can obtain accurate positions for low-resolution single-dish submillimeter/millimeter sources by finding their red galaxy counterparts. We use the SCUBA-2 imaging of A2744, which has been slightly deepened over that presented in Cowie et al. (2022). The reduction, extraction, and cataloging follow that of Cowie et al. (2022), providing 850 m and 450 m imaging with central rms noise of 0.26 and 2.8 mJy, respectively. The noise quoted here is the white noise; we add a confusion noise of 0.33 mJy (Cowie et al., 2017) in quadrature when selecting sources from the 850 m image.
As can be seen from Figure 1, the JWST NIRCam observations are mostly well positioned on the SCUBA-2 image, and here we focus on the SCUBA-2 area also observed by NIRCam. In this area, there are 19 850 m sources () stretching down to an 850 m flux of 2.4 mJy. For each 850 m source, we determine the nearest red galaxy. We find that 17 of the 19 850 m sources have such counterparts within a match radius, the rough uncertainty in the 850 m position. We show these counterparts in Figure 4, omitting the five that are ALMA sources and hence already shown in Figure 2. We note that two of the SCUBA-2 sources (SCUBA10 and SCUBA19) match to the same red galaxy and ALMA source (ALMA3). We show this anomalous situation in Figure 5, alongside a more typical match. We list all 19 SCUBA-2 sources in Table 2.
The full NIRCam area covers 171,900 arcsec2, and there are 202 sources satisfying our selection criteria, giving a surface density of 0.00118 arcsec-2. This corresponds to a probability of 0.057 of seeing such a source in a radius circle. Thus, we expect one false positive in our sample of 19 sources. Measurements of random positions in the field give a similar contamination rate. Consequently, nearly all 17 red galaxy counterparts in Table 2 are real.
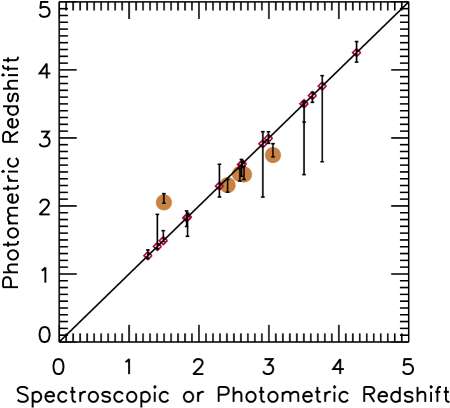
In combination, Figures 2 and 4 give 21 directly detected submillimeter/millimeter sources with accurate positions in the field. Twenty of these have either spectroscopic or photometric redshifts (the remaining source, SCUBA9, lies outside the Weaver et al. 2023 catalog). In Figure 6, we show for these sources the photometric redshifts and uncertainties versus the spectroscopic redshifts, where available, or the photometric redshifts otherwise. The photometric redshifts do a reasonable job of estimating the spectroscopic redshifts for those sources that have both.
5 JWST NIRCam Selection of SCUBA-2 Sources
We can now invert the procedure of the previous two sections and use the color selected JWST NIRCam sources as priors to probe deeper in the SCUBA-2 image and to avoid the effects of confusion present in a direct search.
We restrict to the portion of the SCUBA-2 image where the 850 m rms white noise is mJy (twice the central noise) and where the area is covered by the NIRCam footprint (see Figure 1). There are 11,200 NIRCam sources in this region with Jy. Of these, 156 have Jy and , satisfying our red galaxy selection criteria.
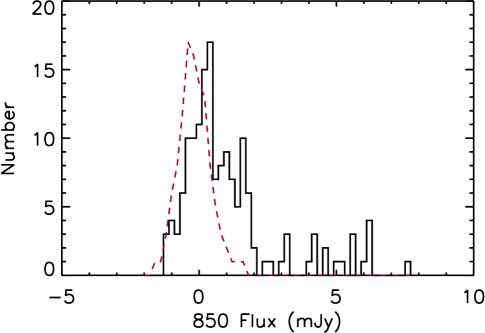
We take these 156 sources as our priors and measure the 850 m flux and error at each NIRCam position in the SCUBA-2 image. We make the same measurement for all of the Jy sources in the region, excluding the priors. In Figure 7, we show the distribution of measured 850 m flux for the two populations.
It is clear from Figure 7 that there is a significant 850 m flux associated with the priors (mean 850 m flux of mJy). Meanwhile, the full F444W Jy population has a mean 850 m flux of mJy. In both cases, we estimated the uncertainties using the bootstrap method.
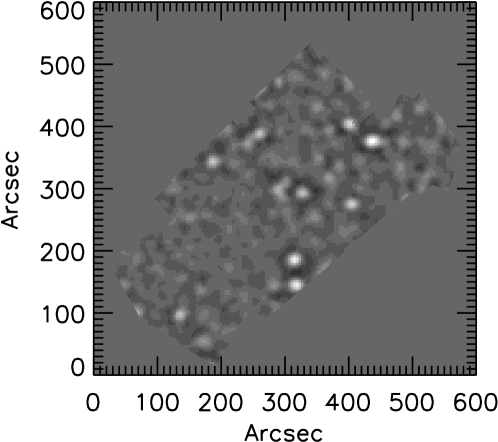
There are 58 850 m sources. Nearly all of these are above 1.1 mJy. However, not all are real, as some are contaminated by the wings of neighboring 850 m sources. In order to deal with contamination and eliminate any double-counting, we adopt the following procedure: We identify the brightest 850 m peak within from a prior. We then measure the flux at the position of this prior, convolve it with the SCUBA-2 matched-filter PSF, and subtract it to form a new cleaned image. We repeat this procedure in order of decreasing 850 m flux, using the cleaned SCUBA-2 image until all of the priors are used. We compare the actual SCUBA-2 850 m image in Figure 8 (left) with the final cleaned image in Figure 8 (right).
This procedure reduces the number of priors with 850 m fluxes above 1.1 mJy to 43. It recovers all 17 of the directly detected SCUBA-2 sources with JWST NIRCam counterparts in Table 2. These 43 sources contain an 850 m extragalactic background light (EBL) of 10.2 Jy deg-2, which is about a quarter of the total EBL (Fixsen et al., 1998). In Figure 9, we show two examples of faint 850 m sources found by using these priors.

Using the same cleaning procedure that Cowie et al. (2022) used for the direct SCUBA-2 search, we now search the cleaned image for additional 850 m sources without priors, finding 21 with 850 m fluxes above 1.1 mJy. We note that both sources 13 and 17 from Table 2 are contained in the 21 sources detected in the residual image. While not all of these 21 sources are necessarily real, combining them with the 43 found with priors gives a fraction of 67% that are picked out by our red galaxy priors.
Before proceeding, we again note that the Paris et al. (2023) catalog contains a small number of cases where a single object is split into multiple components. Replacing these with single objects reduces the priors sample to 148. There are a further 4 objects that appear to be red stars (e.g., Nonino et al., 2023) based on the SExtractor (Bertin & Arnouts, 1996) star classifier and visual inspection. As expected, none of the stars are detected at 850 m.
In summary, of our 144 non-star red galaxy priors, we find 43 with 850 m fluxes above 1.1 mJy. There is one additional prior with a 850 m detection whose flux is below 1.1 mJy. Thus, 30% of the priors have 850 m counterparts. We list these 44 sources in Table 3 in the Appendix.
In % of these, the SCUBA-2 850 m flux could be associated with two priors. In the ALMA covered area, sources 4 and 6 in Table 1 (see Figure 2 for their thumbnails) provide such an example. This percentage is slightly higher than the 13% (68% confidence range 7%–19%) of SCUBA-2 sources with 850 m flux above 2.25 mJy in the GOODS-S that have multiple ALMA counterparts (Cowie et al., 2018). While we assign all of the 850 m flux to the nearest prior, the other prior could be partially contributing. Allowing for this possibility could increase the percentage of the non-star red galaxy priors with 850 m counterparts to 37%.
6 Discussion
In order to see whether we are missing fainter sources in our red galaxy selection, we now extend our sample down to Jy. We combine the small number of multiple component objects from the Paris et al. (2023) catalog into single objects. We also exclude the four red stars in the region. Finally, we exclude any source that lies closer than to a -brighter red galaxy to avoid multiple-counting in the submillimeter. However, we note that none of our subsequent results are significantly affected if we remove this condition.
In Figure 10, we show versus for the full sample in the JWST NIRCam plus SCUBA-2 footprint with Jy (black dots). We denote those with as squares (red if they also have 850 m detections). Consistent with our previous selection, only 2 of the 55 galaxies with between Jy and Jy have a 850 m detection (both are , and their 850 m fluxes are 1.48 mJy and 1.17 mJy).
We see from Figure 10 a strong preference for the -brightest of the red galaxies to be detected at 850 m. There are 47 red galaxies with Jy. Of these, 26 (55%) have 850 m detections. We also see from Figure 10 a strong preference for the reddest of the red galaxies to be detected at 850 m, as might be expected if the extinction is higher in these galaxies. There are 17 with Jy and . Of these, 10 (59%) have 850 m detections.
While these general preferences are clear, we would like to understand in more detail how red galaxies that are not 850 m detected are related to those that are 850 m detected. In order to carry out this analysis, we need redshift estimates and magnifications. Given the extreme colors of these galaxies, only a very small number of them have spectroscopic redshifts, so we must instead rely on photometric redshifts. We use the catalog from Weaver et al. (2023), which includes both photometric redshifts and magnifications. However, as we mentioned in Section 2, it does not fully cover the JWST NIRCam image from Paris et al. (2023).
Our extended sample contains 167 Jy and galaxies with both photometric redshifts and magnifications. All but one have positive measurements in all the NIR bands at and above m, providing six NIR bands for the photometric redshift determinations. All but five have detections in the m and 1.5 m bands, providing well-determined colors. Seven are X-ray sources in the Chandra catalog of Wang et al. (2016a) and appear to be luminous active galactic nuclei (AGNs).
Weaver et al. (2023) provide an extensive discussion of the quality of the photometric redshifts for their entire sample, but photometric redshifts are significantly more uncertain for the red galaxies of the present sample due to the degeneracy between reddening and redshift. Reassuringly, our comparison of the photometric redshifts with the spectroscopic redshifts for the small number with both (see Figure 6) shows good agreement. Although all of these spectroscopic redshifts lie in the range, so, too, do 81% of the photometric redshifts. Thus, for sources in this redshift range, we may have some confidence in the photometric redshifts. Moreover, the uncertainties assigned by the EAZY code are generally small, as we illustrate in Figure 6 (see also the uncertainties on the photometric redshifts for the 850 m detected red galaxies given in Table 3 in the Appendix). Only six of the extended sample sources have . We therefore proceed with the photometric redshifts, while bearing in mind the need to confirm them with spectroscopy.
Weaver et al. (2023) do not provide the extinctions calculated from their photometric redshift fits. We therefore reran EAZY on the 850 m detected red galaxies given in Table 3 in the Appendix. The measured median for these sources is 2.9, which is consistent with them being dusty star-forming galaxies.
We next compute the demagnified fluxes at a rest-frame wavelength of 5000 Å (the longest rest-frame wavelength observed by JWST NIRCam at the highest redshifts), along with the corresponding demagnified luminosities, (5000).
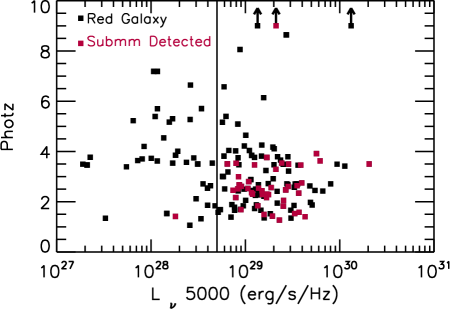
In Figure 11, we plot photometric redshift versus (5000) for our extended sample. Nearly all of the 850 m detected sources (marked in red) have (5000) erg s-1 Hz-1 (vertical black line), which corresponds to (5000) erg s-1. There are 37 sources with (5000) erg s-1 Hz-1, of which only one has a 850 m detection.
In contrast, there are 129 sources with (5000) erg s-1 Hz-1, 44 of which have 850 m detections. The mean demagnified 850 m flux, , of the 129 sources is mJy, where we estimated the uncertainties using the bootstrap method.
However, nearly all of this is concentrated in the low-redshift population. For , the mean is mJy, while for , it has dropped to mJy. This result is not sensitive to the uncertainties in the photometric redshifts. Even placing all of the photometric redshifts at their upper limits only changes the mean to mJy at and at .
Sources with = 1 mJy have a demagnified FIR (8–1000 m) luminosity of erg s-1 at (e.g., Cowie et al., 2017). We now characterize the sources with the parameter
| (1) |
This is the ratio of the FIR luminosity to (5000) at rest-frame 5000 Å. The parameter will vary with extinction and SED, but for a typical ultraluminous infrared galaxy such as Arp 220, computed with the Silva et al. (1998) SED is 20. In contrast, the ratio for the luminosity in the 1000–40000 Å range to (5000) at rest-frame 5000 Å for Arp 220 is 2.4. Thus, % of its light emerges in the FIR.
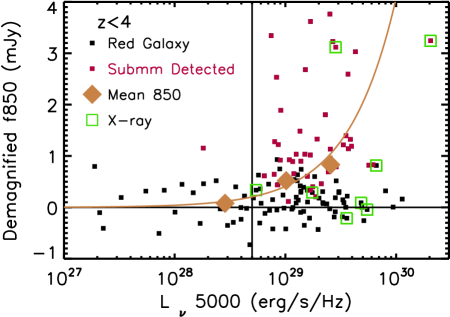
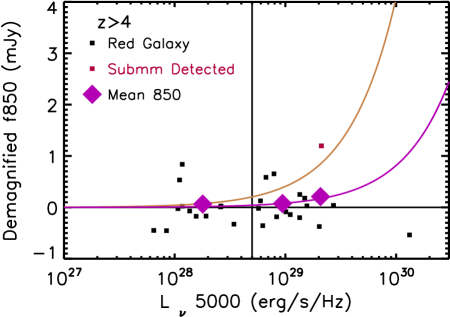
For sources with (5000) erg s-1 Hz-1, the parameter drops from a mean of 54 at to 8 at . A Mann-Whitney test shows only a 0.0016 probability that the two samples are consistent. In Figure 12, we show versus (5000) for the two redshift ranges. We also show the mean in three (5000) ranges (diamonds). We overlay the curves for (gold) and (purple), which provide reasonable fits to these mean values at and , respectively.
The rapid drop in as one moves to higher redshifts may suggest that the high-redshift galaxies have much less dust. However, ultimately, a full understanding of this result requires a more detailed analysis. We leave this analysis to a subsequent paper (McKay et al., 2023), where we will consider the changes in the physical properties of the sources with redshift using size and structure measurements and fits to the SEDs.
From Figure 12, we can also see that the absence of 850 m detections at fainter (5000) is simply a selection effect—the 850 m flux has likely become too faint to detect. At (5000) erg s-1 Hz-1, we expect a mean of 0.1 mJy for , comparable to the minimum value reached in our measurements.
7 Summary
We showed that a JWST NIRCam red selection criteria of Jy and locates all of the known ALMA 1.1 mm and 1.2 mm sources and 17 of the 19 SCUBA-2 850 m () sources in the A2744 cluster field in the JWST NIRCam covered areas based on the images of Paris et al. (2023). Using these red galaxies as priors, we were able to probe deeper in the SCUBA-2 data, finding 44 850 m sources (this procedure recovers the 17 direct detections).
We analyzed an extended sample of 167 sources ( Jy and , where care was taken to combine the small number of multiple component objects from the Paris et al. 2023 catalog into single objects; to exclude the four red stars in the region; and to exclude any source that lies closer than to a -brighter red galaxy to avoid multiple-counting in the submillimeter) using photometric redshifts and gravitational lensing magnifications from the slightly smaller area UNCOVER catalog of Weaver et al. (2023). We found that all but one of the 850 m detections lay at , and all but one had a demagnified luminosity at a rest-frame wavelength of 5000 Å of (5000) erg s-1 Hz-1.
We concluded that the redshift dependence in the 850 m detections may be a result of a significant decrease in the dust content of the galaxies at the higher redshifts. Parameterizing this with the quantity , which is the ratio of the FIR luminosity estimated from the 850 m flux to (5000) at rest-frame 5000 Å, we found a drop of around 5 between and .
In contrast, we found that the (5000) dependence appeared to be a simple sensitivity issue, with the sources erg s-1 Hz-1 being too faint to be detected in the SCUBA-2 850 m image.
ADS/JAO.ALMA#2015.1.01425.S,
ADS/JAO.ALMA#2017.1.01219.S,
and ADS/JAO.ALMA#2018.1.00035.L. ALMA is a partnership of ESO (representing its member states), NSF (USA) ,and NINS (Japan), together with NRC (Canada), MOST and ASIAA (Taiwan), and KASI (Republic of Korea), in cooperation with the Republic of Chile. The Joint ALMA Observatory is operated by ESO, AUI/NRAO and NAOJ. The James Clerk Maxwell Telescope is operated by the East Asian Observatory on behalf of The National Astronomical Observatory of Japan, Academia Sinica Institute of Astronomy and Astrophysics, the Korea Astronomy and Space Science Institute, the National Astronomical Observatories of China and the Chinese Academy of Sciences (Grant No. XDB09000000), with additional funding support from the Science and Technology Facilities Council of the United Kingdom and participating universities in the United Kingdom and Canada. We wish to recognize and acknowledge the very significant cultural role and reverence that the summit of Maunakea has always had within the indigenous Hawaiian community. We are most fortunate to have the opportunity to conduct observations from this mountain.
References
- Alcalde Pampliega et al. (2019) Alcalde Pampliega, B., Pérez-González, P. G., Barro, G., et al. 2019, ApJ, 876, 135
- Barger et al. (2000) Barger, A. J., Cowie, L. L., & Richards, E. A. 2000, AJ, 119, 2092
- Barger et al. (1998) Barger, A. J., Cowie, L. L., Sanders, D. B., et al. 1998, Nature, 394, 248
- Barger et al. (2012) Barger, A. J., Wang, W. H., Cowie, L. L., et al. 2012, ApJ, 761, 89
- Barger et al. (2014) Barger, A. J., Cowie, L. L., Chen, C. C., et al. 2014, ApJ, 784, 9
- Barrufet et al. (2023) Barrufet, L., Oesch, P. A., Weibel, A., et al. 2023, MNRAS, 522, 449
- Bertin & Arnouts (1996) Bertin, E., & Arnouts, S. 1996, A&AS, 117, 393
- Brammer et al. (2008) Brammer, G. B., van Dokkum, P. G., & Coppi, P. 2008, ApJ, 686, 1503
- Cairns et al. (2023) Cairns, J., Clements, D. L., Greenslade, J., et al. 2023, MNRAS, 519, 709
- Caputi et al. (2012) Caputi, K. I., Dunlop, J. S., McLure, R. J., et al. 2012, ApJ, 750, L20
- Casey et al. (2013) Casey, C. M., Chen, C.-C., Cowie, L. L., et al. 2013, MNRAS, 436, 1919
- Casey et al. (2021) Casey, C. M., Zavala, J. A., Manning, S. M., et al. 2021, ApJ, 923, 215
- Castellano et al. (2023) Castellano, M., Fontana, A., Treu, T., et al. 2023, ApJ, 948, L14
- Chapman et al. (2005) Chapman, S. C., Blain, A. W., Smail, I., & Ivison, R. J. 2005, ApJ, 622, 772
- Chapman et al. (2003) Chapman, S. C., Barger, A. J., Cowie, L. L., et al. 2003, ApJ, 585, 57
- Chen et al. (2014) Chen, C.-C., Cowie, L. L., Barger, A. J., Wang, W.-H., & Williams, J. P. 2014, ApJ, 789, 12
- Chen et al. (2015) Chen, C.-C., Smail, I., Swinbank, A. M., et al. 2015, ApJ, 799, 194
- Chen et al. (2022) Chen, C.-C., Gao, Z.-K., Hsu, Q.-N., et al. 2022, ApJ, 939, L7
- Cheng et al. (2022) Cheng, C., Yan, H., Huang, J.-S., et al. 2022, ApJ, 936, L19
- Cheng et al. (2023) Cheng, C., Huang, J.-S., Smail, I., et al. 2023, ApJ, 942, L19
- Cooper et al. (2022) Cooper, O. R., Casey, C. M., Zavala, J. A., et al. 2022, ApJ, 930, 32
- Cowie et al. (2022) Cowie, L. L., Barger, A. J., Bauer, F. E., et al. 2022, ApJ, 939, 5
- Cowie et al. (2017) Cowie, L. L., Barger, A. J., Hsu, L. Y., et al. 2017, ApJ, 837, 139
- Cowie et al. (2018) Cowie, L. L., González-López, J., Barger, A. J., et al. 2018, ApJ, 865, 106
- Daddi et al. (2009) Daddi, E., Dannerbauer, H., Krips, M., et al. 2009, ApJ, 695, L176
- Dunlop et al. (2017) Dunlop, J. S., McLure, R. J., Biggs, A. D., et al. 2017, MNRAS, 466, 861
- Eales et al. (1999) Eales, S., Lilly, S., Gear, W., et al. 1999, ApJ, 515, 518
- Fixsen et al. (1998) Fixsen, D. J., Dwek, E., Mather, J. C., Bennett, C. L., & Shafer, R. A. 1998, ApJ, 508, 123
- Franco et al. (2018) Franco, M., Elbaz, D., Béthermin, M., et al. 2018, A&A, 620, A152
- Fujimoto et al. (2023) Fujimoto, S., Kohno, K., Ouchi, M., et al. 2023, arXiv e-prints, arXiv:2303.01658
- Furtak et al. (2023) Furtak, L. J., Zitrin, A., Weaver, J. R., et al. 2023, MNRAS, 523, 4568
- González-López et al. (2017) González-López, J., Bauer, F. E., Romero-Cañizales, C., et al. 2017, A&A, 597, A41
- Ho et al. (2004) Ho, P. T. P., Moran, J. M., & Lo, K. Y. 2004, ApJ, 616, L1
- Hodge et al. (2013) Hodge, J. A., Karim, A., Smail, I., et al. 2013, ApJ, 768, 91
- Holland et al. (2013) Holland, W. S., Bintley, D., Chapin, E. L., et al. 2013, MNRAS, 430, 2513
- Hughes et al. (1998) Hughes, D. H., Serjeant, S., Dunlop, J., et al. 1998, Nature, 394, 241
- Ivison et al. (2002) Ivison, R. J., Greve, T. R., Smail, I., et al. 2002, MNRAS, 337, 1
- Jones et al. (2021) Jones, L. H., Rosenthal, M. J., Barger, A. J., & Cowie, L. L. 2021, ApJ, 916, 46
- Kohno (2019) Kohno, K. 2019, in ALMA2019: Science Results and Cross-Facility Synergies, 64
- Kokorev et al. (2023) Kokorev, V., Jin, S., Magdis, G. E., et al. 2023, ApJ, 945, L25
- Larson et al. (2011) Larson, D., Dunkley, J., Hinshaw, G., et al. 2011, ApJS, 192, 16
- Lotz et al. (2017) Lotz, J. M., Koekemoer, A., Coe, D., et al. 2017, ApJ, 837, 97
- McKay et al. (2023) McKay, S. J., Barger, A. J., & Cowie, L. L. 2023, ApJ, in preparation
- Nonino et al. (2023) Nonino, M., Glazebrook, K., Burgasser, A. J., et al. 2023, ApJ, 942, L29
- Paris et al. (2023) Paris, D., Merlin, E., Fontana, A., et al. 2023, ApJ, 952, 20
- Silva et al. (1998) Silva, L., Granato, G. L., Bressan, A., & Danese, L. 1998, ApJ, 509, 103
- Smail et al. (1997) Smail, I., Ivison, R. J., & Blain, A. W. 1997, ApJ, 490, L5
- Smail et al. (2000) Smail, I., Ivison, R. J., Owen, F. N., Blain, A. W., & Kneib, J. P. 2000, ApJ, 528, 612
- Stach et al. (2019) Stach, S. M., Dudzevičiūtė, U., Smail, I., et al. 2019, MNRAS, 487, 4648
- Swinbank et al. (2010) Swinbank, A. M., Smail, I., Chapman, S. C., et al. 2010, MNRAS, 405, 234
- Swinbank et al. (2014) Swinbank, A. M., Simpson, J. M., Smail, I., et al. 2014, MNRAS, 438, 1267
- Targett et al. (2013) Targett, T. A., Dunlop, J. S., Cirasuolo, M., et al. 2013, MNRAS, 432, 2012
- Umehata et al. (2018) Umehata, H., Hatsukade, B., Smail, I., et al. 2018, PASJ, 70, 65
- Walter et al. (2012) Walter, F., Decarli, R., Carilli, C., et al. 2012, Nature, 486, 233
- Wang et al. (2016a) Wang, S., Liu, J., Qiu, Y., et al. 2016a, ApJS, 224, 40
- Wang et al. (2016b) Wang, T., Elbaz, D., Schreiber, C., et al. 2016b, ApJ, 816, 84
- Wang et al. (2019) Wang, T., Schreiber, C., Elbaz, D., et al. 2019, Nature, 572, 211
- Wang et al. (2012) Wang, W.-H., Barger, A. J., & Cowie, L. L. 2012, ApJ, 744, 155
- Wang et al. (2011) Wang, W.-H., Cowie, L. L., Barger, A. J., & Williams, J. P. 2011, ApJ, 726, L18
- Wardlow et al. (2011) Wardlow, J. L., Smail, I., Coppin, K. E. K., et al. 2011, MNRAS, 415, 1479
- Weaver et al. (2023) Weaver, J. R., Cutler, S. E., Pan, R., et al. 2023, arXiv e-prints, arXiv:2301.02671
- Wilson et al. (2020) Wilson, G. W., Abi-Saad, S., Ade, P., et al. 2020, in Society of Photo-Optical Instrumentation Engineers (SPIE) Conference Series, Vol. 11453, Society of Photo-Optical Instrumentation Engineers (SPIE) Conference Series, 1145302
- Zavala et al. (2021) Zavala, J. A., Casey, C. M., Manning, S. M., et al. 2021, ApJ, 909, 165
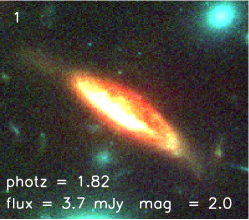
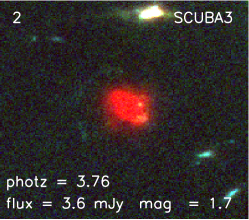
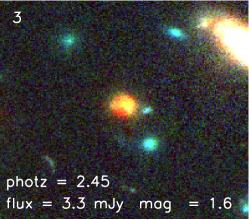
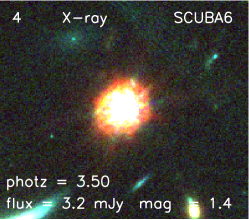
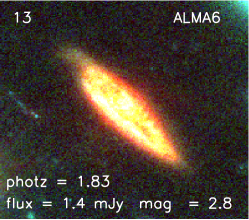
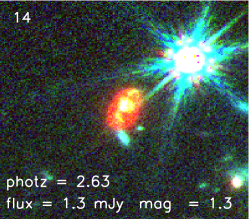
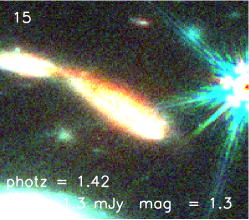
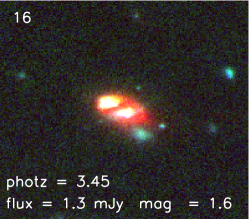
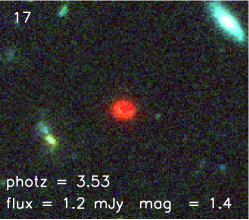
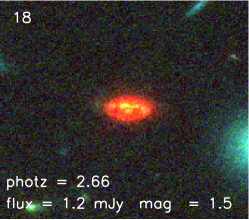
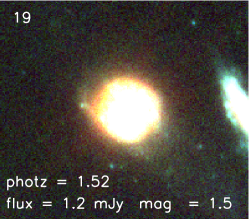
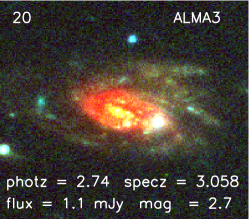
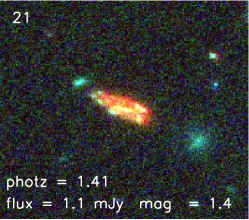
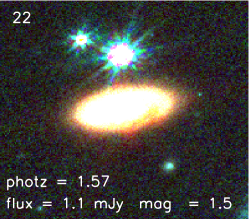
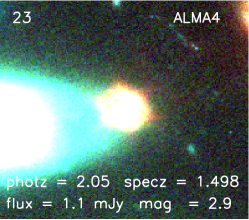
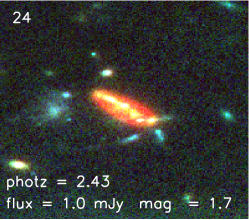
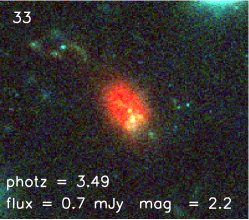
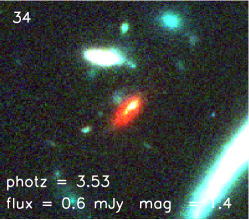
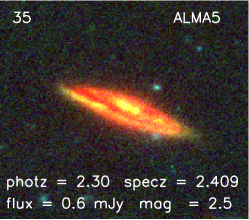
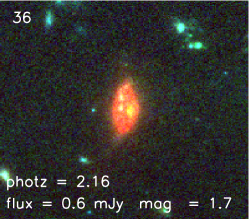
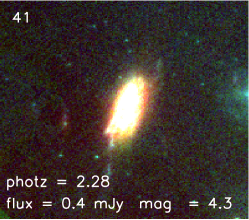
In Table 3, we summarize the properties of the 44 SCUBA-2 850 m detected JWST NIRCam Jy and sources with photometric redshifts.
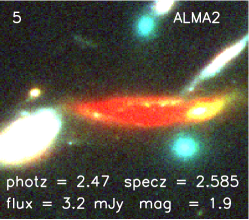
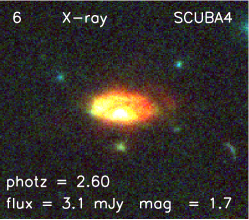
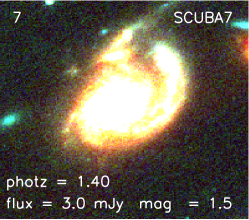
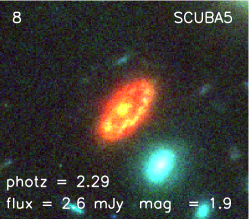
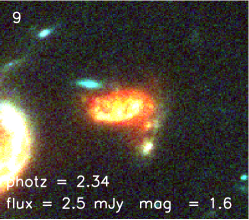
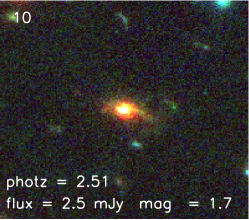
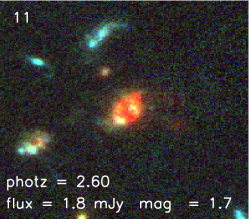
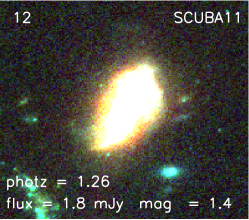
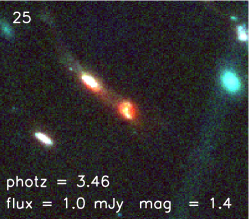
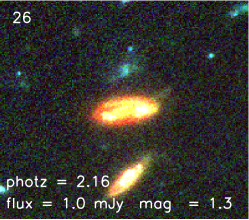
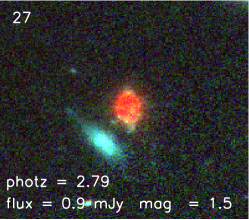
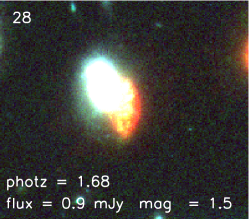
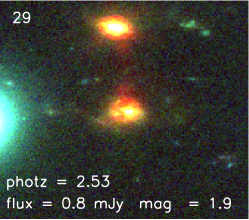
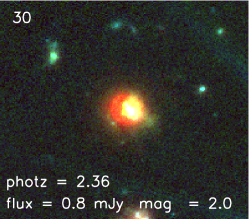
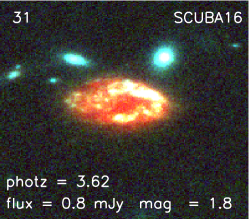
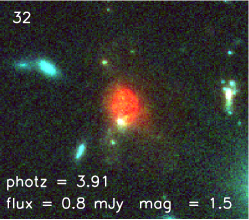
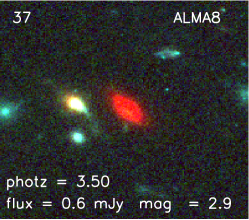
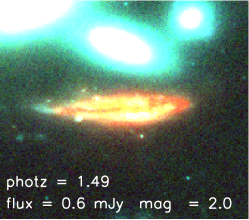
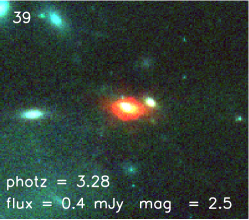
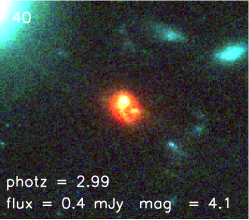
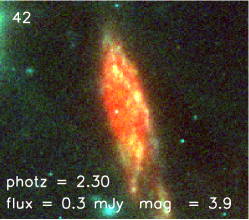
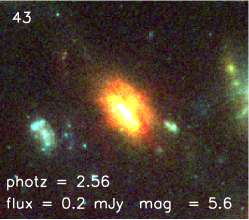
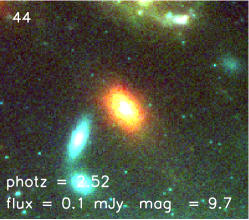
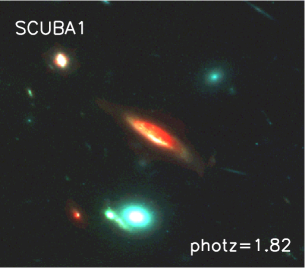
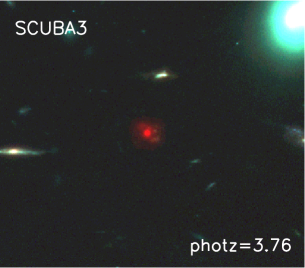
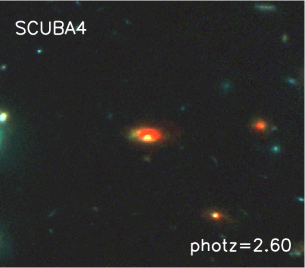
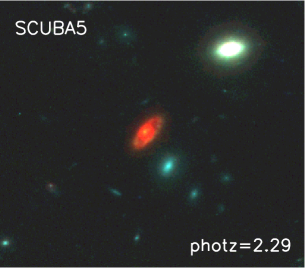
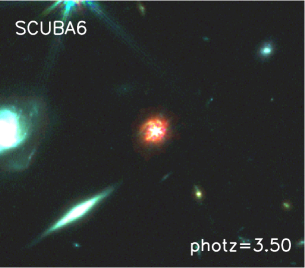
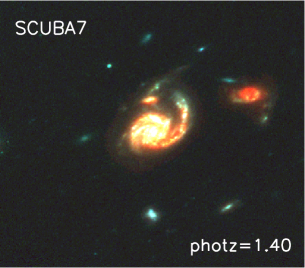
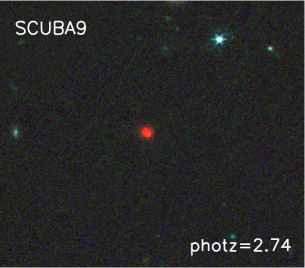
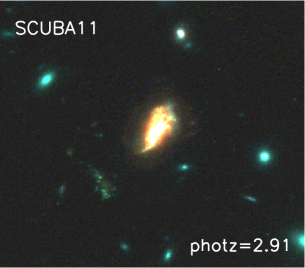
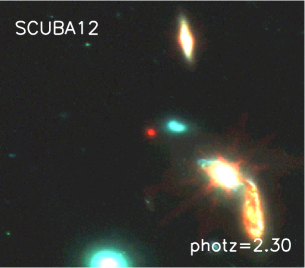
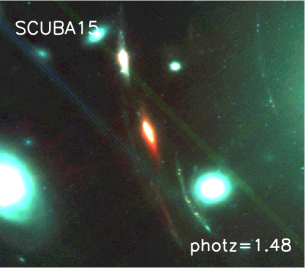
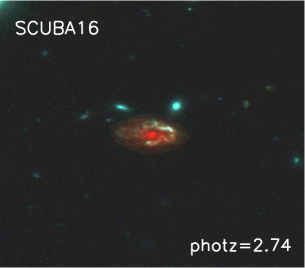
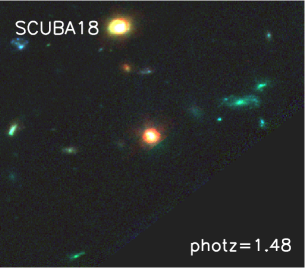
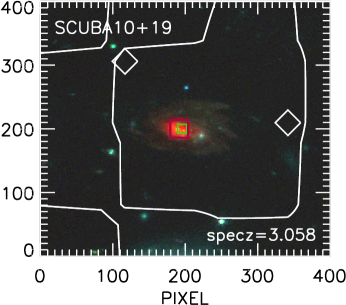
We show the corresponding three-color NIRCam images in Figure 13. The morphological classification of DSFGs is a complex and uncertain process. Based on HST data, some visual analyses have found a high merger fraction (e.g., Chen et al., 2015; Cowie et al., 2018), while some quantitative analyses have instead found them to be massive disks (Targett et al., 2013) and not preferentially major mergers (Swinbank et al., 2010). Chen et al. (2015) argue that quantitative methods can miss many merging or disturbed sources, which are easily distinguished in a visual inspection.
JWST NIRCam data are needed for more reliable analyses of the morphologies of DSFGs (e.g., Chen et al., 2022; Cheng et al., 2022, 2023), and, in particular, those of color selected or dark galaxies (see, e.g., Kokorev et al. 2023, who classified source 5 in Figure 13 as an edge-on spiral galaxy). However, much larger sample sizes than have currently been analyzed are needed to make definitive statements. We leave a more detailed discussion to McKay et al. (2023). Here we note only that the morphologies of the galaxies in Figure 13 are quite heterogeneous, ranging from compact sources, including the quasar of source 4, all the way to large mergers, such as sources 7, 15, and 25. Slightly more than a quarter of the sources show clear evidence of merging.
| No. | R.A. | Decl. | (5000) | Redshift | SFR | Ratio | Match | |||||
|---|---|---|---|---|---|---|---|---|---|---|---|---|
| (J2000.0) | (mJy) | (erg s-1) | (M⊙ yr-1) | (Jy) | (Jy) | |||||||
| (1) | (2) | (3) | (4) | (5) | (6) | (7) | (8) | (9) | (10) | (11 | (12) | (13)) |
| 1 | 3.5362501 | -30.360361 | 3.76(0.18) | 44.18 | 1.82(1.69,1.92) | 2.99 | 1.17 | 2.0 | 43.5 | 7.06 | 6.16 | SCUBA1 |
| 2 | 3.5755835 | -30.424389 | 3.61(0.17) | 44.00 | 3.76(2.64,3.91) | 3.69 | 106. | 1.7 | 5.00 | 0.14 | 34.0 | SCUBA3 |
| 3 | 3.5476665 | -30.352140 | 3.34(0.24) | 43.64 | 2.45(2.24,2.61) | 1.76 | 6.08 | 1.6 | 2.98 | 0.70 | 4.24 | |
| 4 | 3.6172502 | -30.368807 | 3.24(0.26) | 45.08 | 3.50(2.46,3.50) | 2.00 | 177. | 1.4 | 30.3 | 8.35 | 3.62 | SCUBA6 |
| 5 | 3.5761251 | -30.413166 | 3.22(0.13) | 44.20 | 2.585 | 3.40 | 0.04 | 1.9 | 3.11 | 0.15 | 20.5 | ALMA2 |
| 6 | 3.5491250 | -30.352251 | 3.11(0.24) | 44.23 | 2.60(2.43,2.68) | 2.99 | 0.12 | 1.7 | 16.9 | 2.23 | 7.61 | SCUBA4 |
| 7 | 3.5938334 | -30.356609 | 3.03(0.27) | 44.41 | 1.40(1.36,1.87) | 2.50 | 78.7 | 1.5 | 92.2 | 22.5 | 4.09 | SCUBA7 |
| 8 | 3.5474167 | -30.388277 | 2.68(0.15) | 43.95 | 2.29(2.13,2.61) | 3.80 | 52.5 | 1.9 | 19.8 | 1.81 | 10.9 | SCUBA5 |
| 9 | 3.5925832 | -30.356140 | 2.59(0.25) | 44.34 | 2.34(2.13,2.54) | 2.91 | 531. | 1.6 | 15.9 | 3.91 | 4.06 | |
| 10 | 3.5482500 | -30.353277 | 2.53(0.23) | 43.69 | 2.51(2.13,2.64) | 1.46 | 12.5 | 1.7 | 2.76 | 0.73 | 3.75 | |
| 11 | 3.5464168 | -30.353443 | 1.88(0.23) | 43.73 | 2.60(2.17,2.72) | 2.87 | 12.7 | 1.7 | 4.46 | 0.73 | 6.03 | |
| 12 | 3.5990419 | -30.359722 | 1.80(0.27) | 44.13 | 1.26(1.22,1.35) | 2.55 | 31.8 | 1.4 | 60.8 | 15.7 | 3.86 | SCUBA11 |
| 13 | 3.5719585 | -30.382973 | 1.48(0.09) | 43.90 | 1.83(1.55,1.89) | 3.66 | 137. | 2.8 | 44.0 | 5.38 | 8.17 | ALMA6 |
| 14 | 3.5847917 | -30.333166 | 1.39(0.33) | 44.32 | 2.63(2.22,2.84) | 3.05 | 14.4 | 1.3 | 10.2 | 2.71 | 3.79 | |
| 15 | 3.5610831 | -30.330000 | 1.32(0.34) | 44.06 | 1.42(1.43,2.41) | 3.07 | 15.8 | 1.3 | 36.8 | 7.69 | 4.79 | |
| 16 | 3.5641251 | -30.344444 | 1.32(0.29) | 44.36 | 3.45(2.82,3.28) | 2.86 | 33.1 | 1.6 | 6.26 | 1.34 | 4.64 | |
| 17 | 3.6276667 | -30.394249 | 1.28(0.25) | 43.68 | 3.53(3.26,3.60) | 3.09 | 50.4 | 1.4 | 1.86 | 0.07 | 24.6 | |
| 18 | 3.6006250 | -30.362720 | 1.22(0.24) | 43.71 | 2.66(2.31,2.72) | 3.29 | 0.01 | 1.5 | 7.88 | 0.43 | 18.1 | |
| 19 | 3.5211668 | -30.360666 | 1.21(0.25) | 44.30 | 1.52(1.38,1.75) | 2.71 | 92.8 | 1.5 | 62.0 | 13.2 | 4.67 | |
| 20 | 3.5849586 | -30.381777 | 1.18(0.10) | 44.37 | 3.058 | 3.15 | 287. | 2.7 | 20.2 | 4.40 | 4.60 | ALMA3 |
| 21 | 3.6235831 | -30.426777 | 1.15(0.25) | 43.03 | 1.41(1.42,2.52) | 2.97 | 7.00 | 1.4 | 3.84 | 0.89 | 4.31 | |
| 22 | 3.5965416 | -30.358555 | 1.14(0.26) | 44.34 | 1.57(1.49,1.70) | 1.40 | 5.68 | 1.5 | 44.1 | 12.4 | 3.54 | |
| 23 | 3.5732501 | -30.383501 | 1.13(0.09) | 44.18 | 1.498 | 2.81 | 51.3 | 2.9 | 29.2 | 7.34 | 3.97 | ALMA4 |
| 24 | 3.5757084 | -30.426556 | 1.03(0.17) | 43.95 | 2.43(2.14,2.50) | 2.53 | 13.4 | 1.7 | 8.51 | 1.59 | 5.32 | |
| 25 | 3.5137918 | -30.345861 | 1.03(0.32) | 43.87 | 3.46(3.23,3.51) | 2.15 | 35.9 | 1.4 | 1.71 | 0.23 | 7.25 | |
| 26 | 3.6100416 | -30.355389 | 1.01(0.29) | 44.00 | 2.16(2.02,2.69) | 3.28 | 81.7 | 1.3 | 11.2 | 1.84 | 6.06 | |
| 27 | 3.5632915 | -30.418694 | 0.92(0.19) | 43.81 | 2.79(1.67,3.20) | 3.73 | 8.20 | 1.5 | 3.58 | 0.61 | 5.82 | |
| 28 | 3.5102501 | -30.375473 | 0.92(0.27) | 43.73 | 1.68(1.68,1.99) | 2.64 | 23.3 | 1.5 | 11.8 | 2.42 | 4.88 | |
| 29 | 3.5872500 | -30.423056 | 0.89(0.15) | 43.91 | 2.53(2.44,2.63) | 1.59 | 16.2 | 1.9 | 5.52 | 1.31 | 4.21 | |
| 30 | 3.5237501 | -30.371445 | 0.89(0.18) | 43.84 | 2.36(2.09,2.67) | 2.54 | 36.9 | 2.0 | 8.32 | 1.39 | 5.96 | |
| 31 | 3.5863333 | -30.425083 | 0.82(0.16) | 44.57 | 3.62(3.52,3.67) | 2.42 | 142. | 1.8 | 9.83 | 1.93 | 5.08 | SCUBA16 |
| 32 | 3.5126665 | -30.381001 | 0.82(0.26) | 44.53 | 3.91(3.87,3.96) | 2.39 | 131. | 1.5 | 6.46 | 1.30 | 4.95 | |
| 33 | 3.5668333 | -30.394890 | 0.78(0.11) | 44.23 | 3.49(2.74,3.22) | 3.55 | 19.2 | 2.2 | 8.91 | 0.96 | 9.28 | |
| 34 | 3.6214998 | -30.393084 | 0.69(0.22) | 44.16 | 3.53(3.21,3.61) | 2.17 | 45.0 | 1.4 | 3.54 | 0.59 | 5.99 | |
| 35 | 3.5797083 | -30.378389 | 0.65(0.11) | 43.85 | 2.409 | 3.17 | 19.7 | 2.5 | 19.5 | 1.87 | 10.4 | ALMA5 |
| 36 | 3.5996249 | -30.374695 | 0.64(0.19) | 43.67 | 2.16(2.06,2.39) | 3.34 | 6.24 | 1.7 | 8.11 | 1.09 | 7.40 | |
| 37 | 3.5812917 | -30.380220 | 0.61(0.09) | 43.58 | 3.50(3.23,3.53) | 3.40 | 109. | 2.9 | 3.32 | 0.13 | 25.0 | ALMA8 |
| 38 | 3.5312083 | -30.361279 | 0.60(0.18) | 43.97 | 1.49(1.50,1.71) | 3.55 | 0.45 | 2.0 | 30.5 | 7.90 | 3.86 | |
| 39 | 3.5388751 | -30.362278 | 0.45(0.14) | 44.10 | 3.28(3.21,3.38) | 2.15 | 51.9 | 2.5 | 6.21 | 1.10 | 5.64 | |
| 40 | 3.5825000 | -30.385473 | 0.43(0.06) | 43.70 | 2.99(2.92,3.09) | 2.42 | 8.97 | 4.1 | 7.21 | 0.73 | 9.84 | ALMA1 |
| 41 | 3.5582082 | -30.374500 | 0.40(0.07) | 44.02 | 2.28(2.24,2.39) | 2.17 | 70.5 | 4.3 | 21.9 | 5.39 | 4.07 | |
| 42 | 3.5543332 | -30.372002 | 0.33(0.08) | 44.00 | 2.30(2.25,2.68) | 3.20 | 10.8 | 3.9 | 22.5 | 4.42 | 5.08 | |
| 43 | 3.5442917 | -30.368055 | 0.20(0.06) | 44.05 | 2.56(2.40,2.66) | 2.02 | 0.60 | 5.6 | 29.3 | 4.55 | 6.43 | |
| 44 | 3.5430834 | -30.369110 | 0.11(0.03) | 43.80 | 2.52(2.44,2.65) | 1.00 | 0.00 | 9.7 | 18.9 | 5.15 | 3.68 | |
Note. — The columns are (1) source number, (2) and (3) R.A. and decl. of the JWST NIRCam Jy and prior, (4) demagnifed 850 m flux, (5) logarithm of the demagnified luminosity, (6) redshift (see Section 2; spectroscopic has three digits after the decimal point, while photometric has two digits after the decimal point, with the 16th and 84th percentiles of the posterior given in parentheses), (7) from EAZY, (8) SFR from EAZY, (9) magnification from the Weaver et al. (2023) catalog, (10), (11), and (12) observed and (not demagnified; these fluxes are from the Paris et al. 2023 catalog) and their ratio, (13) direct ALMA source match from Table 1, or direct SCUBA-2 source match from Table 2, when available.