Lifted particles from the fast spinning primary of the Near-Earth Asteroid (65803) Didymos
Abstract
An increasing number of Near Earth Asteroids (NEAs) in the range of a few hundred meters to a few kilometres in size have relatively high spin rates, from less than 4 h, down to 2.2 h, depending on spectral type. For some of these bodies, local acceleration near the equator may be directed outwards so that lift off of near-equatorial material is possible. In particular, this may be the case for asteroid Didymos, the primary of the (65803) Didymos binary system, which is the target of the DART (NASA) and Hera (ESA) space missions. The study of the dynamics of particles in such an environment has been carried out —in the frame of the Hera mission and the EC-H2020 NEO-MAPP project— according to the available shape model, known physical parameters and orbital information available before the DART impact. The presence of orbiting particles in the system is likely for most of the estimated range of values for mass and volume. The spatial mass density of ejected material is calculated for different particle sizes and at different heliocentric orbit epochs, revealing that large particles dominate the density distribution and that small particle abundance depends on observation epoch. Estimates of take off and landing areas on Didymos are also reported. Available estimates of the system mass and primary extents, after the DART mission, confirm that the main conclusions of this study are valid in the context of current knowledge.
keywords:
Asteroids – Asteroids, dynamics – Asteroids, rotation – Near-Earth objects – Regoliths.1 Introduction
Many Near Earth Asteroids (NEAs) have been discovered in the last two decades, including at sizes smaller than a few km and fast spin rates. Pravec et al. (2008) showed that an excess of slow rotators (spin period 24 h), as well as fast rotators (2.2 h 2.8 h), is present in the NEA population at size 0.2 km. The former is also found in main belt asteroids, while the excess of fast rotators is not, and it seems to be peculiar to NEAs. It is noteworthy that 2/3 of fast spinning NEAs are binaries (Pravec et al., 2006) and they correspond to the concentration of fast spin rate of primaries of NEA binaries in front of the “spin barrier” at h. The spin state with which asteroids enter the NEA region is mostly affected by non-catastrophic collisions while in the asteroid belt (Holsapple, 2022), and partially by the non-gravitational YORP effect. YORP is also the main driving source for NEAs spin up once in the inner planet region.
1.1 Asteroid stability limits and spin–up
We recall here the spin limits for mass shedding defining an upper threshold on the rotation rate at which a particle at the equator of a spherical body is at neutral equilibrium between gravity and centrifugal force. For a homogeneous sphere, the relation for the critical spin rate is:
| (1) |
where is the bulk density of the object. Spin limit depends on asteroid density: e.g., h is the limit corresponding to a spherical body of density kg/m3, which is typical of S-type gravitational aggregate asteroids; instead, spin limit is h for C-type gravitational aggregate asteroids, with kg/m3. Such densities differ from the density of their meteorite analogues due to macro–porous structure of gravitational aggregates.
As soon as enough spin data were available (Pravec and Harris, 2000), such a spin limit became evident when plotting size vs spin period. Very rarely asteroids larger than 200–300 m in diameter () have been observed with a rotational period smaller than 2.2 h. This has led to interpretations of the internal structure of such asteroids. Fast rotators are instead common at m. Focusing the discussion on the size range 300 m — 10 km, the interpretation of the spin limit leads to two slightly different regimes (Holsapple, 2007). For asteroids larger than 3 km, the spin barrier does not constrain whether these are strength–less objects or just cracked but coherent bodies. In fact, the upper limit on the tensile strength –given by the barrier itself– is higher than a scaled tensile strength of cracked but coherent bodies. Instead, for asteroids smaller than 3 km, the maximum possible tensile strength allowed by the spin barrier is too low for these asteroids to be cracked but coherent bodies, so they should have predominantly cohesion–less structures.
Non–coherent asteroids are aggregates that have re-accumulated fragments by self–gravity right after shattering events. On the contrary, internally cracked objects may arise due to shattering at the threshold energy for fragmentation, with little kinetic energy left to reshuffle fragments. Another way of producing cracked structures is by series of sub–catastrophic collisions summing up similar damage in the overall structure as one single barely shattering event (Housen, 2009). In that case, the object may be coherent allowing for some tensile stress.
Both coherent bodies and gravitational aggregates (GA) (often called rubble piles) may withstand spin rates higher than the critical ones for fluids found by Chandrasekhar (Chandrasekhar, 1969), and spin ideally up to the spin barrier around 2.2 h before failing apart. In the case of coherent –monolithic– structure, that is due to internal solid state forces, which do withstand spin rates beyond that limit. This is especially the case of bodies smaller than 300 m. Instead, non-coherent asteroids (as gravitational aggregates are) may be spun up and undergo shape change corresponding to a minimum energy configuration –led by dissipative forces (e.g., internal friction)– compatible with increasing angular momentum. That is achieved by rotation about the maximum angular inertia axis. As a result, some of those bodies might become top–shaped (Cheng et al., 2021; Sabuwala et al., 2021).
Therefore, shear strength may be present due to friction and interlocking between GA components (Richardson et al., 2002; Holsapple, 2007; Ferrari et al., 2020), as a reaction to the shear stress due to centrifugal force, increasing structural yield. The presence of inter–particle cohesion has also been suggested (Sánchez and Scheeres, 2012; Zhang et al., 2017, 2021), though still a matter of debate. Such shear strength, regardless of its nature, may prevent the whole structure from falling apart when the rotation spin rate exceeds the stability limit for fluid bodies. This mechanism is successful until the spin barrier is reached. At that point, the body is no longer able to adjust the exceeding energy and angular momentum by shape change through energy dissipation by friction. Depending on internal stiffness, fission or mass shedding takes place, eventually leading to asteroid binary or pair/clan formation (Pravec et al., 2019). The mechanisms of formation of NEA binary systems are a matter of debate and are beyond the scope of this study.
1.2 NEA binary systems with fast spinning primary
Many binary systems in the NEA population share a number of common features: (a) small mass ratio ( 0.01) for satellite to primary components; (b) fast spin primary; (c) top-shape primary (Naidu et al., 2020; Roberts et al., 2021; Walsh et al., 2012).
Of all binary systems with fast rotating primary, we identified a handful near the edge of stability, as reported in Table 1 together with a number of single bodies. In this work, we focus on the Didymos system because of its interest as the target of both DART (NASA) and Hera (ESA) space missions. However, the 1996 FG3 binary system also was the former goal of the MarcoPolo-R mission and is now the sample return target of the Chinese (CNSA) Zheng He space mission.
Beyond binary primaries, it is worth mentioning that some lonely top–shape NEAs also show fast spin rates. This is indeed the case of 2008 EV5, which was the target of the un–selected ESA (2014) MarcoPolo-R mission.
| Asteroid name | (km) | (h) | Taxonomy type | |
|---|---|---|---|---|
| (65803) Didymos | 0.78 | 0.21 | 2.26 | S |
| (66063) 1998 RO1 | 0.80 | 0.50 | 2.49 | - |
| (88710) 2001 SL9 | 0.77 | 0.32 | 2.40 | Sr, Q |
| (164121) 2003 YT1 | 1.10 | 0.19 | 2.34 | - |
| (311066) 2004 DC | 0.36 | 0.19 | 2.57 | - |
| (137170) 1999 HF1 | 3.6 | 0.23 | 2.31 | X |
| (1862) Apollo | 1.55 | 0.05 | 3.06 | Q |
| (175706) 1996 FG3 | 1.69 | 0.29 | 3.59 | C |
| (185851) 2000 DP107 | 0.80 | 0.38 | 2.77 | C |
| (276049) 2002 CE26 | 3.5 | 0.09 | 3.29 | C |
1.2.1 The Didymos system
The NEA binary (65803) Didymos is the S-type target of the DART (NASA) and Hera (ESA) space missions. Model predictions may be tested by combined data from those two missions, which makes this a particularly interesting system to study. This asteroid is classified as an Apollo NEA with a semimajor axis of au, and a large eccentricity of (pre-DART impact heliocentric ephemeris solution 181). Its perihelion is therefore well inside the inner asteroid belt, where the asteroid spends 1/3 of its orbital period.
The pre-–impact estimations of the system main physical characteristics were the values available when this research started, and numerical simulations were run. The discussion on how post–DART impact estimation may affect results is carried out in Sec. 5.
Didymos, the primary of the binary, had estimated principal axes extent sizes of km, the last of which is the size along its spin axis. A Didymos shape model has been derived using both radar and optical telescope data, clearly indicating a top–shape (Naidu et al., 2020) before the DART and LICIACube missions imaging. The mass of the system was estimated as kg (Naidu et al., 2020) from the orbital period of the secondary, named Dimorphos, which is known, 11.9216289 2.8 h (S. Naidu and S. Chesley, personal communication). The spin period of Didymos is h (Pravec et al., 2006) and its bulk density was estimated to be kg/m3, with a uncertainty. The size of Dimorphos was estimated to be m, compatible with oblate to prolate shape with axes ratio between 0 and 1.3. No information on the spin rate of Dimorphos is available, though it is assumed to be synchronous to its orbital period. Separation between components is km (Naidu et al., 2020).
Available data do not allow predictions about the internal structure of any of the two bodies. Nevertheless, updated estimates of some physical parameters critical to this study available during the publication process of this work (Daly et al., 2023) confirm L and LL ordinary chondrites as the best meteorite analogues for Didymos. Considering that typical grain density of such meteorite complexes is in the kg/m3 range, the system bulk density is compatible with at least 30% bulk porosity of its components. Therefore, the primary may have a gravitational aggregate structure with unknown size distribution of components.
1.3 Asteroids on the edge of stability
For some NEAs, the centrifugal force acting on surface particles and boulders at near–equatorial latitudes may slightly overcome the gravitational pull of the asteroid itself in the spinning, non–inertial reference frame of the rotating asteroid. In that case, the radial component of acceleration for surface particles is directed outwards, allowing them to leave the surface and undergo corresponding dynamical evolution. Leaving the surface does not mean that particles are lost from the asteroid. In fact, they start their motion at zero velocity but non-zero acceleration, and as soon as they lift off they move under the gravitational field of the asteroid, the non-inertial apparent forces due to rotation, the Sun’s gravity and its radiation, and –in the case of binary systems– the gravitational pull of the secondary. Other forces may act as well on small particles on the surface, like electrostatic or molecular forces (cohesion), with the likely result of sticking them together and potentially undergoing the same dynamical effect as dusty clumps. Moreover, small particles, below 1 mm in size, may be lost from the system under the influence of solar radiation pressure (SRP), but even mm to cm–size particles can have their orbits affected by SRP over a longer span (Yu et al., 2017; Ferrari and Tanga, 2022; Rossi et al., 2022). We may expect, instead, that more massive particles potentially levitate for some time, land on the surface and lift off again, repeating such cycles over and over, or just land at latitudes from which further lift off is not possible. Alternatively, they may enter mostly unstable orbits and even transfer to the secondary.
Fahnestock and Scheeres (2009) studied the effect of particle lofting due to YORP spin up in a binary system, namely 1999 KW4 (Moshup). They found that transferring angular momentum from the primary to the mutual orbit is possible. Regulation of primary spin at the rate for which material lofting takes place may happen so that the orbital angular momentum of the secondary grows steadily. Apparently, lofting occurs in fast transient episodes separated by long periods of slow spin-up. The authors argue that the end state of the system evolution is likely the separation into two asteroids on closely related heliocentric orbits. That may be a potential origin for “asteroid pairs”.
Campo Bagatin (2013) outlined the possibility of mass lifting as a general mechanism of regolith dispersal in fast spinning Near-Earth asteroids forming “dusty” environment around such bodies.
Yu et al. (2019) investigated mass shedding from the surface of the primary of (65803) Didymos by a semi-analytical approach for shedding conditions. They determined unstable surface areas by combining the analyses and numerical results of SSDEM simulations. The authors find a vast majority of the shedding mass is finally transferred to Dimorphos and leads to a cumulative growth which may cause a spiralling–in orbit of the secondary, an effect going in the opposite direction to Fahnestock and Scheeres (2009) finding. Further work on failure modes and mass shedding processes was carried out by Sánchez and Scheeres (2016); Zhang et al. (2021); Ferrari and Tanga (2022); Hirabayashi et al. (2022).
The main goal of this work is to study the general dynamical features of this mechanism that may be acting on some of the NEA binary systems listed in Table 1. We use asteroid Didymos as a case study, assuming the best available knowledge to the time of developing the model. Obviously, the actual shape, volume and mass of that asteroid –as well as other physical parameters of the system– will be constrained in much greater detail only after both the DART and Hera missions will characterize the binary system. Here we analyze the dynamical evolution of lifted particles as well as their preference for take–off and landing areas on Didymos. We provide mass density distributions of the material that may currently be, or may have been present around it, assuming a given emission rate.
The model set up to study particle dynamics in this system and its validation is introduced in Sec. 2; results are presented in Sec. 3 and 4, and conclusions are discussed in Sec. 5.
2 Model description
2.1 Mass loss due to fast spin rate
To study under what conditions particles may leave the Didymos surface, we considered the available radar-based Didymos shape model, made of 1000 vertices and 1996 facets (Naidu et al., 2020) (Future, updated work on this matter shall include the shape model of Didymos available after the DART mission). Test particles were initially assumed to be at rest at the geometric centre of each triangular facet. Particles size distribution follow a differential power law , with index . We sampled the following particle size range values: m, mm, mm and cm. These are central values of the corresponding logarithmic size bins in which the overall size distribution is divided. In this way, we check particle behaviour from micron–size, very sensitive to solar radiation pressure, to cm–size —which are typical values for dust grains ejected from active asteroids (Moreno et al., 2019; Jewitt and Hsieh, 2022)— to multi–cm size, affected only by gravity. Particle density is assumed to be , according to the L and LL meteorite analogue to the Didymos S spectral type (Dunn et al., 2013).
In the case local acceleration is directed outwards, a particle will take off from the surface and will evolve under the gravitational field of Didymos, the gravitational perturbations generated by the secondary and the Sun, and the solar radiation pressure (SRP), according to the corresponding equation of motion. Under this scheme, at the end of a given integration time, we calculate the total mass of ejected particles in each end state. Based on the trajectories of particles, we have defined four possible end states (ES): ES1, particles that lift off and land again on Didymos’ surface; ES2, particles that remain in orbit; ES3, particles that are accreted onto the secondary; and ES4, particles that escape from the system (see Section 2.3 for details). We also estimate the mass density in the Didymos system environment as a function of colatitude, longitude, and distance from the surface of the primary.
2.2 Equation of motion
The equation of motion of a particle in a spinning reference system fixed to the primary body can be written as:
| (2) | ||||
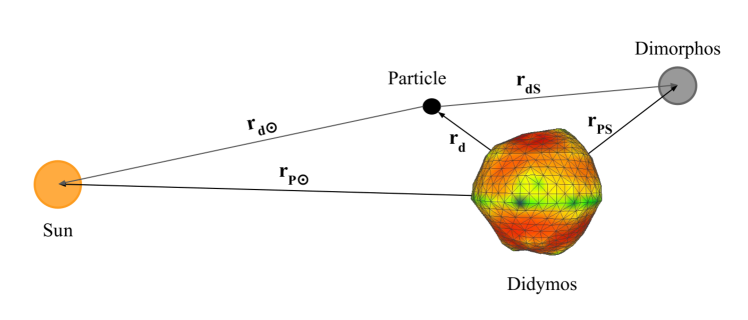
In that expression, bold characters are vectors, is the primary to particle position vector, is the primary to the Sun position vector, is the position vector from the particle to the secondary, and is the primary to the secondary position vector, as shown in Figure 1. Here , where is the vector from the dust grain to the Sun. The first term of Eq. 2 corresponds to the gravitational field per unit mass of the polyhedral shape of the primary, corresponding to the definition in Werner (1994); the second term is the SRP contribution, where , the following terms are the solar and the secondary gravitational perturbations: and ; the last two terms are the centripetal and Coriolis force, respectively. The Euler force can be neglected in this scheme because the spin change is an extremely slow process, lasting orders of magnitude longer than any other change in particle motion. Moreover, is the gravitational constant, is the primary mass, is the secondary mass, is the mass of the Sun, is the efficiency of solar radiation pressure, which is for large absorbing grains (Burns et al., 1979), is the speed of light, W is the total power radiated by the Sun, is the particle diameter and its mass: , where is particle density. is the angular velocity of the primary (, where is the rotational period) and is the velocity of the particle.
2.3 Description of the algorithm
Eq. 2 is integrated numerically using a fourth-order Runge-Kutta method. The primary asteroid can be represented as a sphere or any polyhedral shape. In the first case, the surface of the primary is divided into a grid with colatitude () bins and longitude () bins; this grid is extended radially outwards into space with radii () bins, forming a total of cells. At the beginning, each sample particle is located at the geometrical centre of each surface cell. In the second case, each sample particle is located at the geometrical centre of each triangular facet of the polyhedron, and the space grid is defined outside the body, from the point on the surface farthest from the centre of the body, . The mass and particle density are computed in those cells.
To check the validity of the calculation, the primary asteroid was also modelled as a sphere, and the gravitational field of the corresponding homogeneous sphere was analytically calculated. In the general case, the gravitational field corresponding to the polyhedral model is computed following the guidelines given by Werner (1994) at each point in space. In both cases, a point-mass
secondary body is assumed. Dimorphos follows a circular orbit on the equatorial plane of Didymos. Moreover, the position and orientation of the binary in the heliocentric ecliptic system are rigorously computed at each time step from its available ephemeris and system pole orientation. The position of the Sun, as seen from the primary, is also computed, and the shadow of the primary on the ejected particles is checked at each time step to set the SRP on each particle either on or off. The shadow produced by Dimorphos on Didymos is not taken into account, as it is less than of the Didymos surface, smaller than other sources of uncertainty in the model. Particles are initially at rest on the surface. A detachment condition is applied to check whether any given particle has an outwards component of local acceleration,
which depends strongly on the apparent centrifugal force in the rotating system of the primary. Detachment occurs when , where stands for each force corresponding to the accelerations in Eq. 2, and is the unit vector normal to the surface facet
and directed outwards.
Particles, once ejected from the surface of the primary, move in the gravitational field of the two bodies plus the radiation pressure and gravitational perturbing forces of the Sun.
Based on the trajectories of the particles, we define four final states, as follows:
-
1.
ES1, landing particles: particles with radial distance from the centre is equal to or less than , the particle is checked to be outside or inside the surface defined by the shape model. In the first case, the integration process continues, otherwise, the algorithm finds the intersection between the trajectory of the particle and the facet of the shape model. The collision coordinates are recorded, and the particle is labelled as ES1.
-
2.
ES2, orbiting particles: particles belong to this group if at the end of the integration time they are still in orbit.
-
3.
ES3, particles accreted on Dimorphos: during numerical integration, the position of a given particle with respect to Dimorphos is checked at every time step. The gravitational field of Dimorphos is considered as a point–mass source. The case in which the distance between the particle and the position of Dimorphos is less than its equivalent radius, is considered as a collision, and the particle is labelled as ES3.
-
4.
ES4, escaping particles: particles located beyond m from the centre of mass of Didymos belong to this group. Even if the Hill’s radius of the system is km, the limit is set at km distance from the centre of the system for practical reasons. This is a distance beyond which we found that only a negligible mass density contribution is missed from rare particles orbiting back from outer distance. In fact, mass density, even at the Dimorphos distance, is extremely small, and the density profile keeps decreasing further away. This has the benefit of hugely reducing both the storage load and the computational cost with no effect on the mass density calculation.
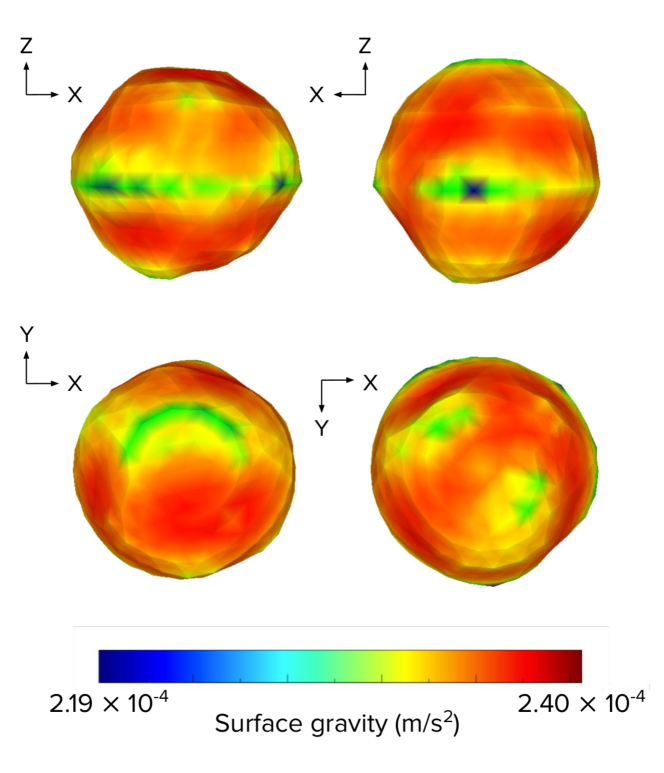
Figure 2 shows the surface gravity map of the Didymos shape model of a non-rotating Didymos, built using a mass of kg with homogeneous density. This is worked out considering that the overall size of Dimorphos, , so that the relationship between masses is close to . Lowest gravity regions are clearly located on the equatorial bulge (blue-green colour in Figure 2).
We assessed the difference between the gravity field of Didymos, taking into account its shape model, against a sphere of equal mass and density, by calculating the radial gravitational field. Obviously, differences are found close to the surface (until approximately 570 m), but both fields converge at larger distances, as expected.
In our model, the difference between the spherical and the polyhedral shape of Didymos is in the definition of spatial cells. Given that the shape model represents an irregular surface, it is not possible to simply define a surface grid and extend it into space in a uniform way. Instead, we set the longitude and latitude grid starting at the vertex of the triangular facet at the maximum distance to the centre (). For the Didymos shape model, this spherical inner grid surface starts at m, which is the smallest distance at which mass density outside the body is calculated. This is the minimum radial distance from which spatial density computation is performed. In other words, this is the spherical surface from which the computation of the mass density is made outside Didymos. The drawback of this approach is that no information is available inside the tiny region in between the shape model surface and the beginning of the 3D grid.
As for the modelling of the shadow cone produced by Didymos, given the moderate depart of the asteroid shape from sphericity, for the sake of simplicity a profile corresponding to a sphere of radius is assumed instead of the shape model itself. That approach has the advantage to save computing time, with a negligible impact on the volume of the projected shadow cone. In addition, in order to save CPU time, the gravity field of the primary is approximated by its corresponding spherical field at m, given the proximity of spherical and polyhedral solutions at that distance. The relative error is less than at that point, decreasing at higher values of r.
The code input data are the orbital and physical parameters of the system extracted from the mentioned Hera Didymos Reference Model (ESA internal document). Further inputs are the perihelion epoch, the dates of start and end of integration, the integration time step used in the Runge-Kutta procedure, the mass loss rate, and particles properties, i.e., particles radii, their density and the exponent of their size frequency distribution (SFD). Other running parameters are also given: the number of particle size bins, which are conveniently spaced logarithmically to be consistent with the power-law distribution, the time bins, the radius limit for mass density computation, and the escaping distance, i.e., the distance at which particles are considered to escape the system and no longer contribute to density in the considered space range. See Sec. 2.3.1 and 2.3.2 for details.
2.3.1 Time integration procedure
When we look at the image of a comet tail, we need to keep in mind that particles were ejected from the comet surface at any time before the time at which the image was taken, let’s call that time . A similar situation can be envisioned in the case of Didymos ejected particles. The following numerical procedure for reproducing such a situation is applied.
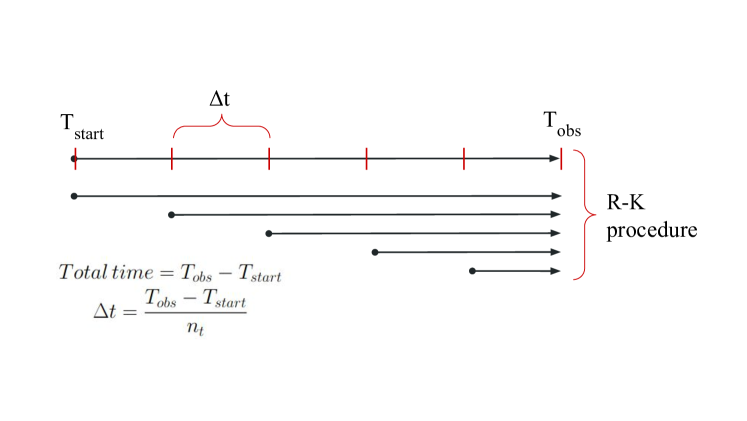
Let’s call the time at which the program checks, for the first time, the particle surface detachment condition at any given surface facet. The final time is instead the time at which the calculation of the particle mass and number density is made (in the analogy above, this corresponds to the time at which the observation of the system environment is made). The total integration time is , which is divided by the number of time intervals , so that is the length of each time integration period. One sample particle of each size is located on every surface facet. At the beginning (), the detachment condition for each particle size is checked, if this is met, the sample particle starts its motion under the action of the corresponding forces by a –order R-K integrator, with an integration time step . This is done for all particle sizes. Many different values for the R-K integration time step were tried, the value finally adopted corresponds to the largest one safely allowing for convergence in the integration. Once integration is over, that is, at , the same procedure is repeated at the initial time (), and so on. This is necessary because we need to consider the evolution of particles potentially leaving their facet at all equally spaced times between and . The same process is carried out for all surface facets. In this way, the emission of sample particles is checked along the whole integration time. At time , the number of particles in orbit (ES2) is counted at each space cell. Instead, particles that hit the surface of the primary or the secondary (ES1, ES3), or reach the escape distance (ES4) at some time, do not contribute to space density (ES2), but their end state is recorded. At the end of the whole integration time for all surface facets, the data corresponding to the end–state of all sample particles are stored, as well as their position in space and mass density as a function of longitude, colatitude and radial distance from the centre of Didymos.
2.3.2 Mass density calculation
Once the end state of sample particles is known, it is necessary to calculate the absolute mass in each end state. Therefore, we face the problem of how to translate sample particle statistics into the corresponding actual mass in each end state. First of all, we need to make assumptions on the mass emission rate; in addition, the mass and number of particles have to be scaled with the adopted SFD.
Active asteroids show a diversity of mass–loss mechanisms including sublimation, impacts, fast rotation, electrostatics, thermal effects, etc. Estimates of rotation mass shedding in fast spinning rubble-pile asteroids range from kg/s, reported for asteroid (101955) Bennu (Lauretta et al., 2019a, b; Hergenrother et al., 2019), to kg/s (Hui et al., 2019), and 35 kg/s (Jewitt et al., 2019; Sanchez et al., 2019) in the case of (6478) Gault. Episodic mass losses ranging from 1 to 10 kg/s have been derived for multi–tailed asteroid P/2013 P5 (PANSTARRS) (Moreno et al., 2014), which can be clearly attributed to mass shedding due to rotational instability (Jewitt et al., 2015). To date, no observation of this kind of activity has been reported for Didymos, so this parameter is unknown. For this reason, we considered a constant reference value of mass production rate for Didymos, that was set arbitrarily to kg/s for the whole asteroid. A suitable fraction of such value is used only for cells for which the lift off condition is met, no particle will be ejected for most surface cells far from the equator though. The contribution of ejected particles to the mass and number density in each space cell is computed as follows. The mass ejected per unit surface area is calculated as , where is the assumed mass production rate on the whole surface, is the Didymos radius, and the mass ejected per surface cell in a time interval is:
| (3) |
where is the area of the surface cell. The total mass is distributed according to the already mentioned SFD in the radius range , . In a given size bin , within such range, the number of particles emitted from each cell in a given time interval is:
| (4) |
and the corresponding emitted mass is:
| (5) |
The mass and the number of particles are updated accordingly in every space cell where sample particles are located at the end of integration. The mass and number of particles are finally divided by the cell volume to get the corresponding mass and number density.
2.4 Model validation
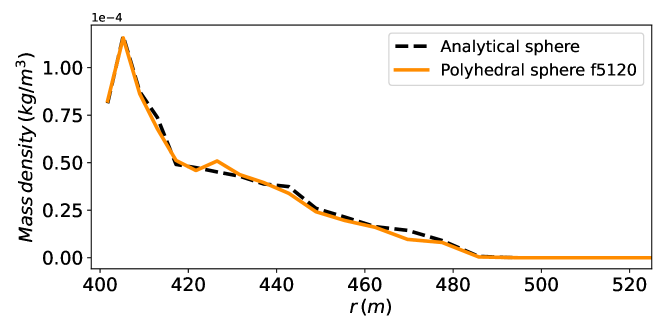
In order to check the validity of our model when applied to the polyhedral representation of solid bodies, we compared the results obtained for the dynamical evolution of particles departing from analytical and polyhedral representations of a spherical body made of 5120 facets (see Figure 5).
In both cases, the same mass and equivalent size of Didymos were used, kg and m, respectively. The density profiles are in very good agreement even at small distances from the body surface. Simulations were run over 30 days.
3 Summary of model simulations
The current Didymos system physical parameters are known with wide uncertainties (see Sec. 1). For this reason, we first mapped the mass–volume parameter space and related each pair of values with the corresponding total orbiting mass obtained by our model. Then, we focused on the nominal parameters for the Didymos mass and size and we performed a detailed analysis of particle detachment and landing process by means of numerical simulations. The wide heliocentric distance of the Didymos system —due to its high eccentricity— led us to study the particle behaviour around very different locations (perihelion and aphelion) of the system, and under the corresponding initial epoch conditions, in the case of full orbit integrations. The whole set of simulations carried out is outlined next.
-
1.
Simulation 1: Conditions for mass lift-off.
The first goal is to study under what conditions it is possible to find mass around the primary. Thus, we combined 7 values of each mass and volume parameters of Didymos within estimated uncertainty. That resulted in 49 numerical runs, one per each corresponding value of bulk density (see Table 3). We let the system evolve during 30 days, near the perihelion epoch, starting on August 28, 2020 and ending on September 26, 2020. Performing simulation runs around perihelion is the worst case for particle survival, as SRP is more efficient in perturbing their motion and taking particles away from the system.
-
2.
Simulation 2: Evolution in one full orbit (starting at perihelion).
Here we used the nominal mass and volume of Didymos in order to set its nominal bulk density. The simulation was run over a full heliocentric orbit of Didymos (770 days), starting and ending around the perihelion epoch (from August 28, 2020 to October 7, 2022). The behaviour of small (, and ) and large () particles were analyzed separately to study the effect of the SRP.
-
3.
Simulation 3: Evolution in one full orbit (starting at aphelion).
We used the same physical parameters as in Simulation 2, but the simulation was run over a full heliocentric orbit of Didymos (770 days), starting and ending around the aphelion epoch (from September 15, 2021 to October 25, 2023). Again, the analysis of small and large particles was done separately.
-
4.
Simulation 4: Short term evolution around perihelion.
Here we report the results of Simulation 1 again for the nominal mass and volume of Didymos primary. The system evolved over 30 days around the perihelion epoch, starting on August 28, 2020 and ending on September 26, 2020.
-
5.
Simulation 5: Short term evolution around aphelion. Analogous to Simulation 4, but over 30 days near the aphelion epoch, starting on September 15, 2021 and ending on October 15, 2021.
We run short term (30 days) simulations to be able to catch the main features of the orbiting mass for the whole set of 49 runs in Simulation 1 and to underline (Simulations 4 and 5) the dependence of the outcome for small particles on the observation epoch. This choice, in the case of Simulation 1, was motivated, on one hand, by the fact that full orbit simulations are very time consuming. On the other hand, the behaviour of particles —as far as mass distribution is concerned— does not change around a given epoch, beyond some 20 days. Therefore, we considered a safe strategy to perform 30–day runs around the least favorable epoch for particle survival.
Orbital parameters used in simulations are shown in Table 2. Table 3 summarizes the volume and mass parameter space ranges, and the system physical parameters are introduced in Table 4.
| Didymos system | ||
| Semimajor axis | au | |
| Eccentricity | - | |
| Inclination | deg | |
| Argument of perihelion | deg | |
| Longitude of ascending node | deg | |
| Perihelion epoch | // | dd/mm/yyyy |
| Dimorphos secondary orbit | ||
| Semimajor axis | m | |
| Orbital period | h | |
| Mass ( kg) | ||||||
| 4.687 | 4.867 | 5.048 | 5.229 | 5.409 | 5.590 | 5.771 |
| Volume ( m3) | ||||||
| 2.209 | 2.301 | 2.393 | 2.485 | 2.584 | 2.684 | 2.783 |
| Parameter | Value | Units |
|---|---|---|
| Didymos rotation period | h | |
| Didymos mass | kg | |
| Didymos volume | m3 | |
| Didymos density | kg/m3 | |
| Dimorphos diameter | m | |
| 50 x 36 x 36 | - | |
| min | ||
| Time integration step () | s | |
| Distance for mass density computation | [, 1500] | m |
| Escaping distance for ES4 | m |
4 Results
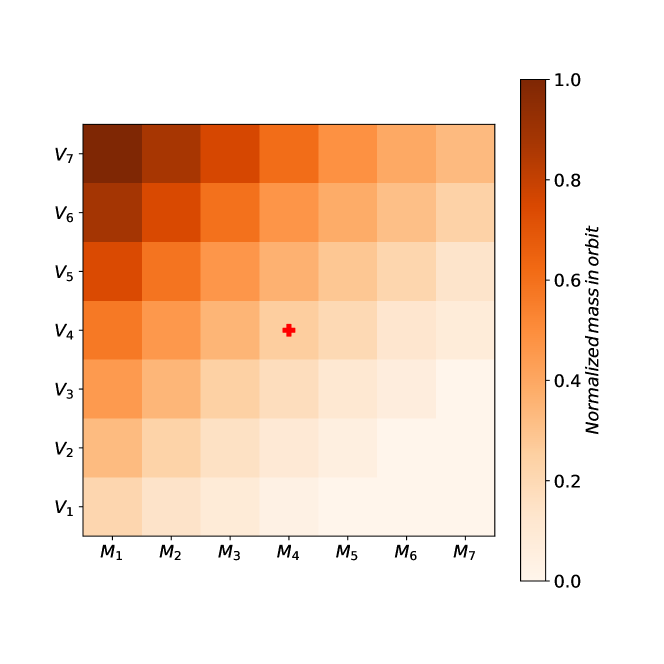
4.1 Conditions for mass lift-off (Simulation 1)
In Figure 6, each square gives the orbiting mass at the end of each simulation after 30 days around perihelion, normalized to the maximum orbiting mass value. The central cross corresponds to the nominal case, which will be analyzed further in the next sections (Simulations 2 to 5). Particle detachment takes place at the nominal spin rate for most values in the chosen Didymos physical parameter space, except for three parameter combinations (see Table 3).
4.2 Particle evolution after one full orbit (Simulations 2 and 3)
In Simulation 2 and 3, we analyze particle end states after they leave the surface and the corresponding lifetimes (Table 5). Depending on size, more than of particles fall back onto the surface of the primary (ES1). The time required to land back also depends on particle size. In general, for any ES, the larger the particle, the longer its lifetime. Particles of radius spend on average h orbiting the asteroid before landing on its surface, while particles may orbit more than 4 hours before landing. In addition, as expected, most particles that escape the system (ES4) correspond to size . However, that end state probability is only . When such particles pass from the shadow cone generated by the asteroid to the illuminated region, they are quickly removed from the system, typically after hours. On the contrary, a small fraction of , and size particles are eliminated, and they are able to survive in the environment of the asteroid between 37 and 600 hours, before they are removed. Instead, particles that are accreted onto the secondary (ES3) are mostly , followed by . Such particles stay in orbit for some 100 and 81 hours, respectively, before reaching Dimorphos. and particles have lower probabilities of reaching the moonlet, taking 2.5 to 4 hours, driven by SRP. At the end of the integration time, there are mostly large particles orbiting the system. size particles are able to stay in orbit about 46 h in Simulation 2 and 74 hours in Simulation 3, and this difference is related to still some weak interaction with SRP at such size range. On the other hand, particles have a median lifetime in orbit of hours and no influence of the SRP is detectable any longer.
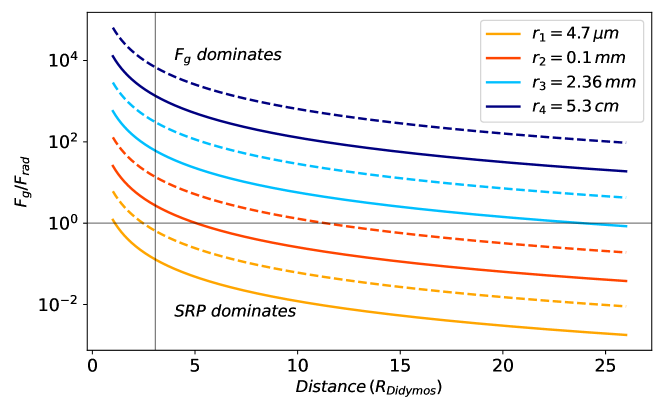
These results can be easily understood by comparing the effect of the gravitational force () due to Didymos on any given particle, with respect to the corresponding solar radiation force (), as a function of the distance to the centre of the asteroid ():
| (6) |
is the solar flux at the heliocentric distance of the asteroid system, and the other parameters are the same as in Section 2.2. The ratio between the two force contributions is plotted in Figure 7. A horizontal gray line separates the distance to Didymos into two regimes, one is dominated by gravity and the other one by solar radiation force. The gray vertical line shows the distance to Dimorphos and the coloured curves represent the relationship between the two mentioned forces for different particle sizes. Solid and dashed curves correspond to motion around perihelion and aphelion, respectively. Particles of size evolve almost completely under the action of SRP, whereas particles of size are affected by both SRP and . Instead, motion of particles of size and are dominated by the force of gravity. That implies that there is no smooth transition between the behaviour of the particles of size and and the corresponding mean lifetimes in ES2. Lifetimes are shorter around perihelion (Simulation 2) than around aphelion (Simulation 3) due to different SRP force values. These results are comparable with the work by Ferrari and Tanga (2022). They also show that, in such low-gravity environment, SRP plays an important role in the dynamics of small dust grains. Instead, particles larger than a few millimetres are mostly affected by the Didymos gravitational force within the orbit of Dimorphos.
| ES1() | (h) | ES2() | (h) | ES3() | (h) | ES4() | (h) | ||
|---|---|---|---|---|---|---|---|---|---|
| Simulation 2 | |||||||||
| Simulation 3 | |||||||||
4.3 Density distribution of orbiting mass
4.3.1 Small particles
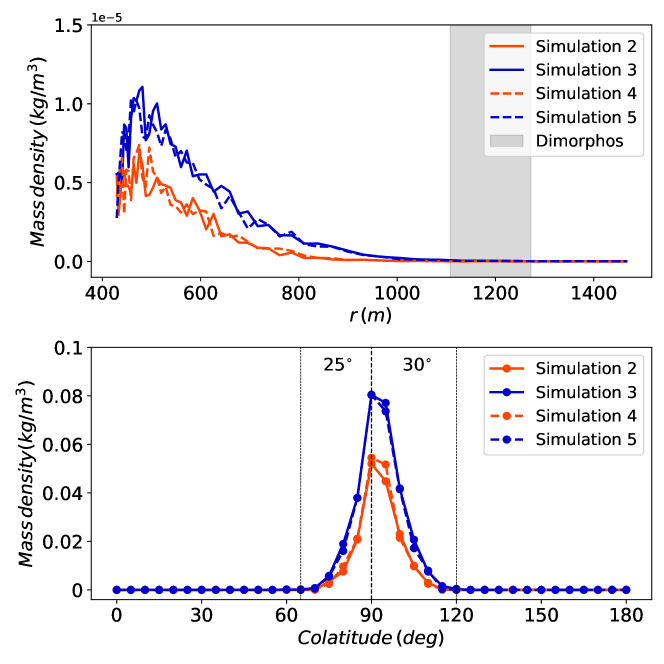
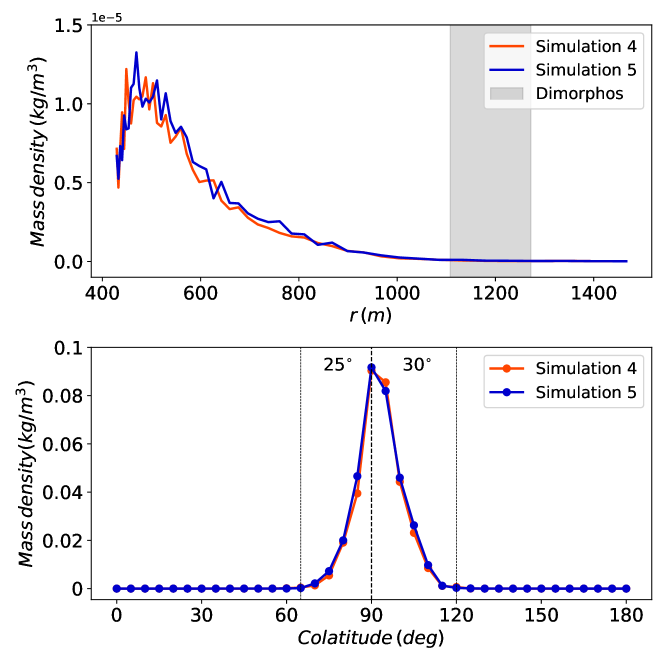
Here, we focus on the analysis of the behaviour of small particles (, and ) that are in ES2 at the end of Simulations 2, 3, 4 and 5. Mass density profiles as a function of radial distance from the asteroid centre are shown in Figure 8 (top). This is obtained by integrating on each cell in colatitude and longitude at any given radial distance. Plots begin at m, the origin of spatial cells. In density profiles, maxima are found at m in the case of Simulations 2 and 4, at m in Simulation 3, and at m in Simulation 5. Therefore, the largest mass density of orbiting particles is 31 to 54 meters above the mentioned reference distance from the centre . Beyond such distance, mass density steadily decreases, as expected. As a result, orbiting mass density in simulation runs around perihelion (Simulation 4) is smaller than for the corresponding simulations around aphelion (Simulation 5). This is due to the strong influence of SRP on small particles. The outcome of density profiles for 30 days integration time are very similar to those obtained integrating over a full orbit of the system around the Sun. This is the case both for perihelion and aphelion epoch starting time. Therefore, the amount of small particles in the system environment at a given time strongly depends on the epoch at which the mass density observation is made.
The colatitude density profile (See Figure 8, bottom), together with the radial density profile, show that orbiting particles are mostly located in a thin disk, with maximum density on the equatorial plane. However, the disk is not symmetrical at north and south of the equator due to Didymos topographical shape model inhomogeneities. On the northern hemisphere, landing location is spread over 25 degrees, between and of colatitude, while, on the southern hemisphere, the distribution extends up to 30 degrees, between and colatitude. The density mass difference between observation about perihelion and aphelion is also shown in the colatitude profile (Figure 8, bottom).
The analysis of particle motion and mass density shows that although most ejected particles return to the surface of the primary with short orbit lifetimes (a few hours), a continuous lift off process supplies them into space.
4.3.2 Large particles
This section extends the analysis of results including particles of radius , not affected by SRP. Figure 9 shows the corresponding radial and colatitude mass distributions. This also applies to any object of size larger than , as they are only affected by gravitational and non–inertial force terms.
When large particles are considered, there is no substantial difference in orbital mass density at aphelion with respect to perihelion, although the radial density profile at aphelion (Simulation 5) is slightly larger than the corresponding density at perihelion (Simulation 4) over the whole considered domain. Large particles are the greatest contributors to orbiting mass density, which is equal around both epochs. Instead, small particles contribute more at aphelion than perihelion, building up the very small difference between densities observed around the two different epochs (see Figure 9).
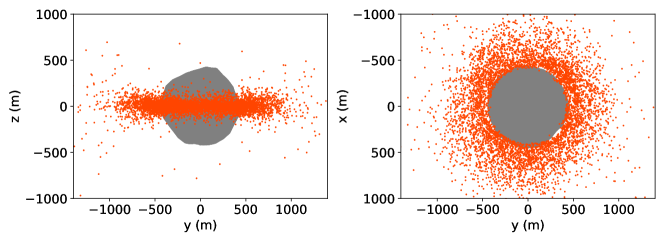
The disk–like distribution of particles in orbit at a given time is shown in Figure 10, in the case of Simulation 4.
It is interesting to notice that the probability () for small particles to have an orbital end state (ES2) is smaller as size decreases (see Table 5). Similarly, duration of orbits is shorter for small particles with respect to large ones (, normalized). Both effects combine in the size frequency distribution of particles found to be in orbit at a given time, that can be described as , with . In summary, the SFD of particles observed in orbit (ES2) looks to be shallower than the original asteroid surface population assumption (, and is therefore skewed towards large particles.
4.4 Distribution of landing particles
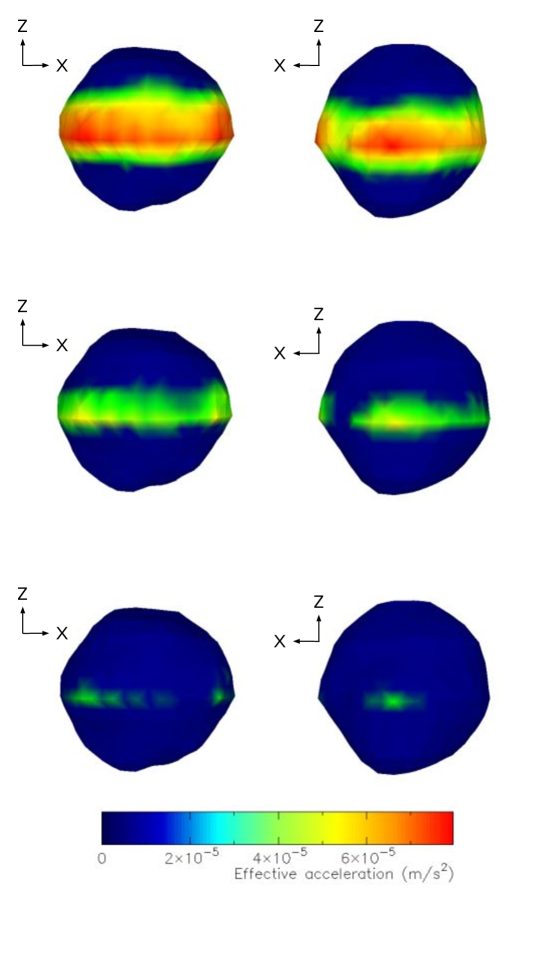
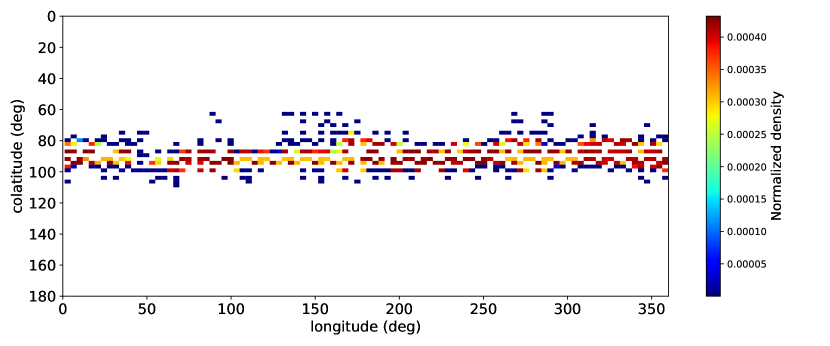
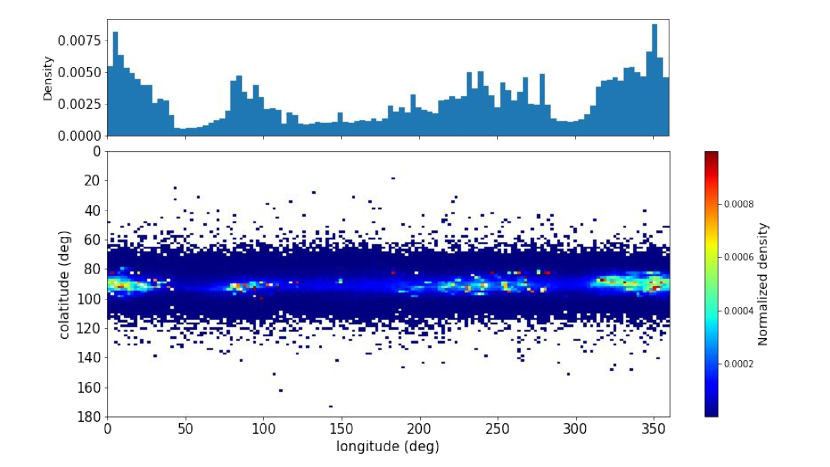
Figure 11 shows —for Simulation 5, as an example— a mass density colour map distribution of the initial position of particles that are able to lift off the surface. At the beginning of any run, particles lie at the geometrical centre of the shape model triangular facets; hence a discrete distribution shows up in Figure 11. The detachment area surrounds the equatorial plane, but it is not symmetrical with respect to it. The maximum detachment latitudes to the north and to the south of the equator are and , respectively, in all the cases, in Simulations 2 to 5. After detachment, most lifted particles (more than ) land back on the surface of the primary. Figure 12 (bottom) shows landing locations after 30 days of evolution. During this time, the gravitational field of Didymos, the gravitational perturbation of Sun and Dimorphos, and SRP, modify particle trajectories, increasing their orbital inclination and allowing them to reach mid and high landing latitudes, typically higher in comparison with the detachment positions. The colour map shows that the density distribution peak in colatitude lies near the equatorial plane. It is important to note that particles landing at low latitudes can likely leave the surface again. Indeed, such particles are a reservoir for later material ejection. Instead, particles falling at mid and high latitudes would not be dynamically able to lift off again from their new location.
However, mass sliding mechanism towards low latitudes are known to have taken place on asteroids Bennu and Ryugu (Sabuwala et al., 2021), such effect may drive mass back to the equatorial region, re–fuelling the take off and landing process. Figure 12 (top) shows non-homogeneous landing distribution in longitude. This behaviour is related to the topography of the asteroid in the equatorial region. Particles flight heights are low, so lifted-particles preferentially land on relatively high terrains around the equator.
5 Discussion and conclusions
Primary fast spin up in NEA binary systems is relatively common. We study the possibility that mass is able to take off the surface of such bodies, taking (65803) Didymos NEA binary system as a study case because it is the DART (NASA) and Hera (ESA) space missions target. The latest available shape model for the asteroid at the time of carrying on this study was used. We set up a model to study the dynamical behaviour of the particles that are able to take off the surface due to the primary fast spin. The gravitational field of the asteroid is taken into account, together with all non–inertial forces in the asteroid rotating frame. Perturbations due to the satellite, Dimorphos, and to the Sun are suitably considered, as well as SRP.
We explored the Didymos primary mass and volume parameter space to assess under what asteroid density conditions particle detachment from the surface is possible. We find that most values in that parameter space allow for particle lift off. In the nominal case, that is possible in a region limited to the latitude interval around the equatorial plane, non–symmetric due to the primary irregular shape. Available range of mass and volume estimates is compatible with the possibility of having a disc of particles of different sizes around Didymos. The actual mass density is hard to predict as the rate of mass emission is unknown. Nevertheless, our model finds the distributions in colatitude and distance from the asteroid according to assumed parameters. Maximum values for the mass density distribution show up at very low latitudes and at some to m away from the average primary equatorial radius, decreasing steadily at larger distance.
Most lifted particles () do land back on the surface, with variable lifetimes depending on size, but typically smaller than 5 h. Small particles have shorter lifetimes than large ones because of SRP. In fact, when small particles take off on the day side of the asteroid, they are quickly pushed back to the surface, and their flight time is shorter the stronger the SRP is. When such particles take off in the night side, they follow ballistic trajectories until they typically land back or, in the case they reach the terminator, they are pushed away from the system by SRP. Particle landing locations are not evenly distributed in longitude, concentrating instead in equatorial morphology highs. This is because most particles only reach low altitudes with respect to their original take off location, and they eventually stumble into such highs on their flight path. It is interesting to notice that the latitude landing range distribution is wider than that of lift off distribution location. As a consequence, some particles may land at latitudes from which they can no longer take off.
SRP has an important effect on small particle dynamics, to the point that, for such particles, mass density in space happens to be a function of the orbital phase at which it is observed (). Didymos has a very eccentric orbit, such that heliocentric distance changes from 1.013 to 2.276 au. This results in very different contributions from the solar tide and SRP at different distance from the Sun. Total mass surrounding Didymos at aphelion is more than double ( 9/4) than at perihelion for sub–cm size particles. Instead, looking at the overall mass in orbit, including large particles —not affected by SRP— no significant difference is found, due to the contribution of large particles to total mass. The size distribution of particles in orbit should be shallower () than their size distribution on the asteroid () due to smaller probability and lifetime in orbit of small particles with respect to large ones.
In conclusion, our model shows that the presence of mass in orbit around Didymos, or similarly shaped fast spinning NEAs, is possible. That includes the potential presence of boulders around the system, that may eventually reach the secondary ( probability) at this stage. In any case, as outlined in Section 1.3, the existence and observability of mass around the system may depend on which primary rotational phase and which secondary orbital phase Didymos is undergoing at the observation time, according to the mechanism described by Fahnestock and Scheeres (2009).
Right after the completion of this study, the DART spacecraft successfully impacted Dimorphos, and first results derived from the images of both the DRACO camera on board DART and the LEIA and LUKE cameras on board the CubeSat LICIACube (ASI: Agenzia Spaziale Italiana) have been published (Daly et al., 2023). Daly et al. (2023) report a set of freshly estimated values for the critical parameters in this study: the mass of the system, kg; the equatorial extents, m on average; the equivalent diameter of both Didymos, m, and Dimorphos, m (uncertainties are given at level). Therefeore, the mass of Didymos can also be easily estimated, assuming equal density for the two bodies. We are conscious that the Didymos shape model is preliminary, however, such set of parameters tends to confirm the possibility of mass lift off from the equatorial region of Didymos. In fact, even in the worst case compatible with available uncertainty ranges (largest system mass, smallest Dimorphos equivalent diameter, largest Didymos equivalent diameter, and smallest Didymos equatorial extent), the ratio between the centripetal and gravitational acceleration at the equator, is larger than 1 (1.07), indicating outwards acceleration. is the driving magnitude here (rather than density), where is the spin rate and is the equatorial radius of Didymos. The nominal values from Daly et al. (2023) give , which is very close to the set, providing more mass in orbit than our nominal case. for m, which is the minimum distance from the spin axis at which lift off is possible, some m smaller than the estimated equatorial radius extent.
It is interesting to notice that the estimated bulk density is reported as kg/m3, a value that would inhibit mass shedding on a sphere spinning at the Didymos spin rate. The bulk density of a body is the critical parameter only in the case in which its shape is fixed. Comparing a sphere with an equal mass oblate spheroid with equatorial axis and shortest axis , the corresponding critical spin rate is
| (7) |
At equal critical spin rate, the relationship between the density of the oblate shaped and the spherical body is . E.g., for an oblate body with (the case of Didymos, as its extent along spin axis is estimated to be m by Daly et al. (2023)), the critical density is kg/m3, while, for an equal mass spherical Didymos, it would be kg/m3.
Indications of the presence of dust around Didymos can be envisioned by looking at the LICIACube images. However, we prefer to avoid speculation at this point, and we delay further interpretation to a forthcoming companion paper. Once further estimate improvement of the main physical parameters and an updated Didymos shape model –pre-Hera mission– will be available, a refined model will be carried out on the “real” Didymos system.
We also plan to study the interplay between mass ejected from Dimorphos by the DART impact and the stationary mass distribution around the system –if any. In fact, that may potentially affect the actual mass density to be estimated by the Hera rendezvous with the Didymos system in 2027 and the calibration of instrumentation on board.
Acknowledgements
NT, ACB and PBL acknowledge funding by the NEO-MAPP project through grant agreement 870377, in the frame of the EC H2020-SPACE-2019. NT acknowledges funding by CONICET. ACB and PBL acknowledge funding by the Ministerio de Ciencia Innovación (PGC 2018) RTI2018-099464-B-I00. FM acknowledges financial supports from grants MCIN/AEI/10.13039/ 501100011033 (GRANT PID2021-123370OB-I00), European Union NextGeneratioEU/PTR, P18-RT-1854 from Junta de Andalucia, and CEX2021-001131-S funded by MCIN/AEI/10.13039/501100011033.
References
- Burns et al. (1979) Burns, J. A., Lamy, P. L., Soter, S. 1979. Radiation forces on small particles in the solar system. Icarus 40, 1–48. doi:10.1016/0019-1035(79)90050-2
- Campo Bagatin (2013) Campo Bagatin, A. 2013. Small Asteroids with “Dusty” Atmospheres? 44th Annual Lunar and Planetary Science Conference.
- Chandrasekhar (1969) Chandrasekhar, S. 1979. Ellipsoidal Figures of Equilibrium. New Haven, Yale University Press.
- Cheng et al. (2021) Cheng, B. and 7 colleagues 2021. Reconstructing the formation history of top-shaped asteroids from the surface boulder distribution. Nature Astronomy 5, 134–138. doi:10.1038/s41550-020-01226-7
- Daly et al. (2023) Daly, R. T. and colleagues 2023. Successful Kinetic Impact into an Asteroid for Planetary Defense. Nature. https://doi.org/10.1038/s41586-023-05810-5
- Dunn et al. (2013) Dunn, T. L., Burbine, T. H., Bottke, W. F., Clark, J. P. 2013. Mineralogies and source regions of near-Earth asteroids. Icarus 222, 273–282. doi:10.1016/j.icarus.2012.11.007
- Fahnestock and Scheeres (2009) Fahnestock, E. G., Scheeres, D. J. 2009. Binary asteroid orbit expansion due to continued YORP spin-up of the primary and primary surface particle motion. Icarus 201, 135–152. doi:10.1016/j.icarus.2008.12.021
- Ferrari et al. (2020) Ferrari, F., Lavagna, M., Blazquez, E. 2020. A parallel-GPU code for asteroid aggregation problems with angular particles. Monthly Notices of the Royal Astronomical Society 492, 749–761. doi:10.1093/mnras/stz3458
- Ferrari and Tanga (2022) Ferrari, F., Tanga, P. 2022. Interior of top-shaped asteroids with cohesionless surface. Icarus 378. doi:10.1016/j.icarus.2022.114914
- Hergenrother et al. (2019) Hergenrother, C. W. and 24 colleagues 2019. The operational environment and rotational acceleration of asteroid (101955) Bennu from OSIRIS-REx observations. Nature Communications 10. doi:10.1038/s41467-019-09213-x
- Hirabayashi et al. (2022) Hirabayashi, M. and 13 colleagues 2022. Double Asteroid Redirection Test (DART): Structural and Dynamic Interactions between Asteroidal Elements of Binary Asteroid (65803) Didymos. The Planetary Science Journal 3. doi:10.3847/PSJ/ac6eff
- Holsapple (2007) Holsapple, K. A. 2007. Spin limits of Solar System bodies: From the small fast–rotators to 2003 EL61. Icarus 187, 500–509. doi:10.1016/j.icarus.2006.08.012
- Holsapple (2022) Holsapple, K. A. 2022. Main belt asteroid collision histories: Cratering, ejecta, erosion, catastrophic dispersions, spins, binaries, tops, and wobblers. Planetary and Space Science 219. doi:10.1016/j.pss.2022.105529
- Housen (2009) Housen, K. 2009. Cumulative damage in strength-dominated collisions of rocky asteroids: Rubble piles and brick piles. Planetary and Space Science 57, 142–153. doi:10.1016/j.pss.2008.07.006
- Hui et al. (2019) Hui, M.-T., Kim, Y., Gao, X. 2019. New active asteroid (6478) Gault. Monthly Notices of the Royal Astronomical Society 488, L143–L148. doi:10.1093/mnrasl/slz112
- Jewitt et al. (2015) Jewitt, D., Agarwal, J., Weaver, H., Mutchler, M., Larson, S. 2015. Episodic Ejection from Active Asteroid 311P/PANSTARRS. The Astrophysical Journal 798. doi:10.1088/0004-637X/798/2/109
- Jewitt et al. (2019) Jewitt, D. and 6 colleagues 2019. Episodically Active Asteroid 6478 Gault. The Astrophysical Journal 876. doi:10.3847/2041-8213/ab1be8
- Jewitt and Hsieh (2022) Jewitt, D., Hsieh, H. H. 2022. The Asteroid-Comet Continuum. arXiv e-prints. doi:10.48550/arXiv.2203.01397
- Lauretta et al. (2019a) Lauretta, D. S. and 29 colleagues 2019. The unexpected surface of asteroid (101955) Bennu. Nature 568, 55–60. doi:10.1038/s41586-019-1033-6
- Lauretta et al. (2019b) Lauretta, D. S. and 57 colleagues 2019. Episodes of particle ejection from the surface of the active asteroid (101955) Bennu. Science 366, 3544. doi:10.1126/science.aay3544
- Moreno et al. (2014) Moreno, F., Licandro, J., Álvarez-Iglesias, C., Cabrera-Lavers, A., Pozuelos, F. 2014. Intermittent Dust Mass Loss from Activated Asteroid P/2013 P5 (PANSTARRS). The Astrophysical Journal 781. doi:10.1088/0004-637X/781/2/118
- Moreno et al. (2019) Moreno, F. and 13 colleagues 2019. Dust properties of double-tailed active asteroid (6478) Gault. Astronomy and Astrophysics 624. doi:10.1051/0004-6361/201935526
- Naidu et al. (2020) Naidu, S. P. and 12 colleagues 2020. Radar observations and a physical model of binary near-Earth asteroid 65803 Didymos, target of the DART mission. Icarus 348. doi:10.1016/j.icarus.2020.113777
- Pravec and Harris (2000) Pravec, P., Harris, A. W. 2000. Fast and Slow Rotation of Asteroids. Icarus 148, 12–20. doi:10.1006/icar.2000.6482
- Pravec et al. (2006) Pravec, P. and 56 colleagues 2006. Photometric survey of binary near-Earth asteroids. Icarus 181, 63–93. doi:10.1016/j.icarus.2005.10.014
- Pravec et al. (2008) Pravec, P. and 30 colleagues 2008. Spin rate distribution of small asteroids. Icarus 197, 497–504. doi:10.1016/j.icarus.2008.05.012
- Pravec et al. (2019) Pravec, P. and 49 colleagues 2019. Asteroid pairs: A complex picture. Icarus 333, 429–463. doi:10.1016/j.icarus.2019.05.014
- Richardson et al. (2002) Richardson, D. C., Leinhardt, Z. M., Melosh, H. J., Bottke, W. F., Asphaug, E. 2002. Gravitational Aggregates: Evidence and Evolution. Asteroids III 501–515.
- Roberts et al. (2021) Roberts, J. H. and 20 colleagues 2021. Rotational states and shapes of Ryugu and Bennu: Implications for interior structure and strength. Planetary and Space Science 204. doi:10.1016/j.pss.2021.105268
- Rossi et al. (2022) Rossi, A. and 12 colleagues 2022. Dynamical Evolution of Ejecta from the DART Impact on Dimorphos. The Planetary Science Journal 3. doi:10.3847/PSJ/ac686c
- Sabuwala et al. (2021) Sabuwala, T., Chakraborty, P., Shinbrot, T. Bennu and Ryugu: diamonds in the sky. Granular Matter 23, 81 (2021). https://doi.org/10.1007/s10035-021-01152-z
- Sánchez and Scheeres (2012) Sánchez, D. P., Scheeres, D. J. 2012. DEM simulation of rotation-induced reshaping and disruption of rubble-pile asteroids. Icarus 218, 876–894. doi:10.1016/j.icarus.2012.01.014
- Sánchez and Scheeres (2016) Sánchez, P., Scheeres, D. J. 2016. Disruption patterns of rotating self-gravitating aggregates: A survey on angle of friction and tensile strength. Icarus 271, 453–471. doi:10.1016/j.icarus.2016.01.016
- Sanchez et al. (2019) Sanchez, J. A. and 6 colleagues 2019. Physical Characterization of Active Asteroid (6478) Gault. The Astrophysical Journal 881. doi:10.3847/2041-8213/ab31ac
- Walsh et al. (2012) Walsh, K. J., Delbo’, M., Mueller, M., Binzel, R. P., DeMeo, F. E. 2012. Physical Characterization and Origin of Binary Near-Earth Asteroid (175706) 1996 FG3. The Astrophysical Journal 748. doi:10.1088/0004-637X/748/2/104
- Werner (1994) Werner, R. A. 1994. The Gravitational Potential of a Homogeneous Polyhedron or Don’t Cut Corners. Celestial Mechanics and Dynamical Astronomy 59, 253–278. doi:10.1007/BF00692875
- Yu et al. (2017) Yu, Y., Richardson, D. C., Michel, P. 2017. Structural analysis of rubble-pile asteroids applied to collisional evolution. Astrodynamics 1, 57–69. doi:10.1007/s42064-017-0005-6
- Yu et al. (2019) Yu, Y., Michel, P., Hirabayashi, M., Richardson, D. C. 2019. The expansion of debris flow shed from the primary of 65803 Didymos. Monthly Notices of the Royal Astronomical Society 484, 1057–1071. doi:10.1093/mnras/sty3515
- Zhang et al. (2017) Zhang, Y. and 9 colleagues 2017. Creep stability of the proposed AIDA mission target 65803 Didymos: I. Discrete cohesionless granular physics model. Icarus 294, 98–123. doi:10.1016/j.icarus.2017.04.027
- Zhang et al. (2021) Zhang, Y. and 7 colleagues 2021. Creep stability of the DART/Hera mission target 65803 Didymos: II. The role of cohesion. Icarus 362. doi:10.1016/j.icarus.2021.114433