Spin-order-dependent magneto-elastic coupling in two dimensional antiferromagnetic MnPSe3 observed through Raman spectroscopy
Abstract
Layered antiferromagnetic materials have emerged as a novel subset of the two-dimensional family providing a highly accessible regime with prospects for layer-number-dependent magnetism. Furthermore, transition metal phosphorous trichalcogenides, MPX3 (M = transition metal; X = chalcogen) provide a platform for investigating fundamental interactions between magnetic and lattice degrees of freedom providing new insights for developing fields of spintronics and magnonics. Here, we use a combination of temperature dependent Raman spectroscopy and density functional theory to explore magnetic-ordering-dependent interactions between the manganese spin degree of freedom and lattice vibrations of the non-magnetic sub-lattice via a Kramers-Anderson super-exchange pathway in both bulk, and few-layer, manganese phosphorous triselenide (MnPSe3). We observe a nonlinear temperature dependent shift of phonon modes predominantly associated with the non-magnetic sub-lattice, revealing their non-trivial spin-phonon coupling below the Néel temperature at 74 K, allowing us to extract mode-specific spin-phonon coupling constants.
Introduction
Devices and structures constructed using two-dimensional (2D) layered materials[1] have garnered an increasing amount of research interest ever since the discovery of isolated monolayers of graphene,[2] transition metal dichalcogenides (TMDs),[3, 4] and beyond.[5, 6] The number of different 2D materials encompassing and driving this area of research is rapidly growing.[6] Most recently, the focus has turned to the discovery of intrinsic long range magnetic ordering in low dimensional van der Waals (vdW) crystals, offering of a highly accessible regime in which to study 2D magnetism.[7, 8, 9, 10, 11, 12, 13, 14, 15] Spin fluctuations are expected to be strongly enhanced in the low dimensional limit,[16, 17, 18, 19, 20] while control and tuning of magnetic states and properties should be easily achieved through engineering perturbations within the system such as strain, alloying, light coupling, gating, proximity effects, and moiré patterns, in a similar manner to conventional 2D materials.[4, 9, 10]
A key challenge however, is the detection of such long range magnetic ordering, along with the underlying domains and associated magnetic fluctuations and excitations. Standard techniques currently employed to detect such occurrences in bulk crystals, thin film and even nanoparticles suspended in solutions, such as superconducting quantum interference device (SQUID) magnetometry and neutron scattering, have limited applicability in 2D magnetic materials due to the reduced volumes.[21]
Optical techniques can offer greater insights due to the increased spacial resolution available. Spectroscopic magnetic circular dichroism,[22, 8, 11, 23] which takes advantage of the Faraday and Kerr effects, can provide an insight into the magnetic behaviour of a few layer sample, such as the strength and sign of the exchange, along with the identification of bands relevant to the magnetic ordering.[22, 23] The first evidence of long range magnetic ordering in a single layer of vdW magnetic material was discovered in FePS3 using Raman spectroscopy. [24, 13] Raman spectroscopy[25, 26] has successfully been used to reveal the magnetic exchange interaction strength via measurements of the two-magnon joint density of states,[27] as well as uncovering novel topology via measurement of fractional spin excitations.[28] In this investigation, we employ high-resolution temperature-dependent Raman spectroscopy in order to probe the magnetic spin-ordering-dependent magneto-elastic interactions of bulk, and few layer, MnPSe3.
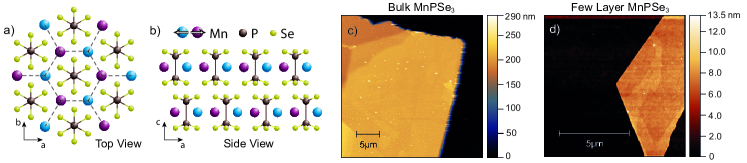
MnPSe3 is a layered vdW magnetic material belonging to the transition metal phosphorus trichalcogenide, MPX3 (M = transition metal; X = chalcogen), family with each layer possessing a symmetry.[29, 30, 31, 32, 33] The unit cell of MnPSe3 can be considered as two distinct atomic groups of Mn2 and P2Se6, formed as a dumbell-like structure of two PSe3 tetrahedrons either end of a vertically (out-of-plane) orientated P-P bond, centred within the ionic bonded Mn hexagonal lattice (see Fig.1a). Below the Néel temperature of 74 K, the Mn2+ ions form inversion-breaking Néel type ordering with S= spins aligned in-plane (spin dimensionality of 1[10]) within an antiferromagnetic Néel type lattice, as shown in Fig.1b.[29, 30, 31, 32, 33] The P2Se6 cluster acts as an intermediary anion for a Kramers-Anderson super-exchange pathway between neighbouring magnetic Mn2+ ions, formed through the spin state of the Mn2+ donor electrons coupling to that of the receiving [P2Se6]4- anion.[34, 35] This effectively couples the magnetic static spin-state correlation function of the manganese sub-lattice to the phonon modes of the phosphorus triselenide.[36, 37, 38, 39, 19]
While 2D magnetic materials are being studied more actively, MnPSe3 remains relatively unexplored. Recent investigations include evidence of phonon-magnon hybridisation, observed between a 2-magnon continuum and the low frequency Raman modes of heavy Mn ions,[40] and is also explored in this work. Using polarisation resolved second harmonic generation, it is possible to observe the different antiferromagnetic domains within a MnPSe3 flake.[33] The Néel vector in AFM domains is seen to reliably switch back and forth as a function of thermal cycle, along with a controllable rotation of the Néel vector via the application of uniaxial strain.[33] The direct Mn-Mn nearest neighbour magnetic exchange interactions, both in-plane and out-of-plane, has been explored using a combination of DFT and neutron scattering techniques.[41] Theoretical investigations into the electronic and magnetic properties of MnPSe3 predict a switching to ferromagnetic ordering when a large ( 1014 cm-2) p- or n-doping is introduced to MnPSe3.[30] Further DFT calculations of MnPSe3/MoS2[42], MnPSe3/WS2[43] and MnPSe3/CrSiTe3[44] heterostructures, with an emphasis on strain tunability and spin-valley physics highlight the potential for MnPSe3-based heterostructures with both TMDs and other 2D magnetic materials.
In this study, a combination of temperature dependent low-frequency Raman spectroscopy and density functional theory (DFT) is used to probe the atomic vibrations of the non-magnetic ions. These phonons are used as a proxy by which to investigate the changing long range antiferromagnetic spin-ordering in MnPSe3, via the aforementioned spin-phonon coupling, as the temperature is increased from 5 K through the Néel temperature (TN) at 74 K, up to room temperature.[36, 37, 38, 39, 19] We also consider the impact of sample thickness on spin-phonon coupling.
Results and Discussion
Flakes of MnPSe3 are prepared via micromechanical exfoliation and thicknesses are determined via atomic force microscopy (AFM). The thinnest flakes measured have a thickness of 7.3 nm (9 layers[33]) (Fig.1d) and 7.9 nm (10 layers[33]), while the thickest flake measured more than 200 nm (Fig.1c), considered here as ‘bulk’ material. Measurements are also taken on 14.1 nm ( 18 layers) and 17.4 nm ( 22 layers) thick MnPSe3 flakes. It has been suggested that MnPSe3 possesses a non-negligible interlayer magnetic coupling[41, 30] such that long range magnetic ordering, as observed in bulk samples at temperatures below the Néel transition, will be modified as we approach the 2D limit. The exact thickness at which the magnetic ordering might begin to weaken is currently unknown, however the results presented here suggest it is not above 9 layers.
Initial observations of the low frequency Raman spectra of MnPSe3 are carried out on three independent bulk samples, all showing a similar temperature dependence of the peak positions. The bulk MnPSe3 Raman response at a temperature of 15 K and 250 K is shown in Figure 2a, and is consistent with previous investigations.[40, 41, 32] The MnPSe3 bulk Raman spectrum typically consists of seven main peaks, labelled here P1 at 84 cm-1, through to P7 at 221 cm-1. Two additional, but much dimmer, peaks can often be observed above the noise level at approximately 50 cm-1 (not shown here), and 160 cm-1 (labelled * in Fig.2a).[40]
Density functional theory is also used to corroborate the identity of these vibrational modes, providing further insight into the characteristics of each mode, which will be discussed in depth later. Each mode consists of contributions from one, or both, of the magnetic, Mn2+, and non-magnetic, [P2Se6]4-, sub-lattices. The two lowest frequency, immediately visible, Raman lines of P1 (84 cm-1) and P2 (109 cm-1), are largely comprised of in-plane lattice vibrations of the heavy manganese Mn2+ ions, with smaller contributions from the non-magnetic phosphorus triselenide ions. Oppositely, the relatively unexplored P4 (148 cm-1), P5 (156 cm-1), P6 (173 cm-1), and P7 (221 cm-1) are formed mostly (or in the case of P4, entirely) due to vibrations of the non-magnetic ions, as detailed later in this study.
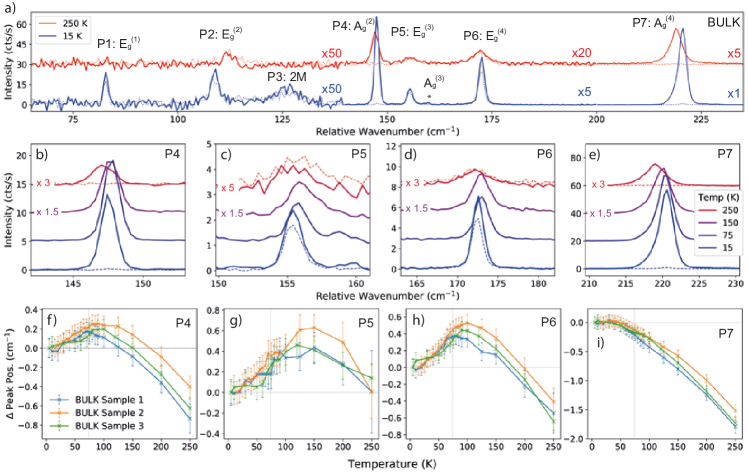
The broad dim peak seen at 126 cm-1, labelled in Figure 2a as P3, is identified as 2-magnon (2M) scattering, hybridising with P1 and P2. Consistent with previous reports,[40, 45] the 2-magnon excitation (P3) is seen to red-shift as the temperature is increased and the magnetic ordering is destabilised with increasing thermal fluctuations. As P3 shifts through the two phonon modes, a broadening of the peak width, along with an associated drop in phonon lifetime, highlights the point of maximum hybridisation (See SI Note 4). The 2-magnon peak is a purely magnetic phenomenon, and therefore disappears when the magnetic ordering is lost at 74 K. As a consequence of such hybridisation, P1 and P2 present atypical temperature dependent behaviour and are seen to be blue-shifted at 250 K, when compared to 15 K, as can be seen in Figure 2a.
In this investigation we concentrate on the previously unstudied phonon modes labelled here P4, P5, P6, and P7. Figure 2b-e details the Raman spectra of these four phonon modes at select temperatures of 15 K, 75 K, 150 K, and 250 K, highlighting the shift of each mode as a function of temperature. Solid lines show the Raman response detected in a co-polarised basis (HH), while the dashed line show the cross-polarised (HV) response, highlighting the polarisation dependence of each mode. We observe a near-unity polarisation degree of P4 (148 cm-1) and P7 (221 cm-1) that is maintained throughout the temperature range measured in each sample, while P5 (156 cm-1) and P6 (173 cm-1) are polarisation independent (observed in both HH and HV).[46, 32, 40]
Figure 2f-i shows the change of peak position of the four phonon modes due to the increasing temperature across three different bulk MnPSe3 samples. The phonon modes are fitted using a Voigt curve, and peak position extracted at each temperature point, before subtracting the peak position at the lowest temperature. Each phonon line displays a distinct nonlinear temperature dependent behaviour that is repeated throughout multiple bulk samples. The most intense peak, P7 (A; 221 cm-1), is seen to initially be constant with temperature increase until the Néel temperature is reached, at which point the peak is observed to start shifting towards lower frequencies. The other three peaks, P4 (A; 148 cm-1), P5 (E; 156 cm-1), and P6 (E; (173 cm-1), initially tend towards higher frequencies until the Néel temperature is reached, when similarly to P7, the trend is inverted and the peak position is observed to shift to lower frequencies. P4 is seen to reach a maximum peak shift, 0.2 cm-1, close to the Néel transition, while P5 and P6 both continue slightly beyond TN reaching 0.4 cm-1. A specific change in trend observed around the Néel temperature is indicative of a magnetic ordering origin of this phenomena, as we discuss below.
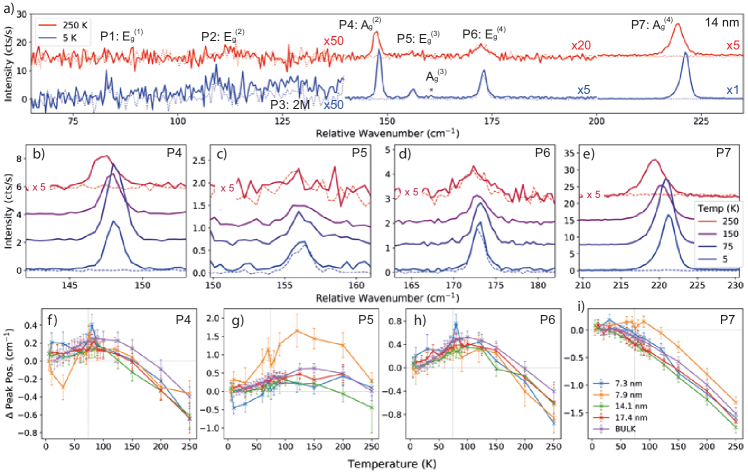
Moving towards thinner samples, we investigate a range of sample thicknesses down to 9 layers[33] (7.3 nm), as determined by atomic force microscopy. As the thicknesses of the sample is decreased, we note a corresponding reduction in overall intensity of the Raman signal which can be clearly seen in the signal to noise ratio observed in Figure 3a-e. To compensate this drop in collected intensity, the acquisition exposure time is increased accordingly. The Raman signal obtained from a 14 nm (18 layer[33]) MnPSe3 sample at low (5 K) and high (250 K) temperature is shown in Figure 3a-e. Similarly to the bulk samples, a Voigt fit is applied at each temperature increment and change in peak position is extracted and displayed in Figure 3f-i. The temperature dependent Raman response is very similar to that of the bulk samples. For reference, the data for bulk sample 2 shown in Figure 2 is also shown here in Figure 3f-i. It should be noted that the accuracy of fitting is reduced as the signal to noise ratio in the thinner samples is diminished, producing noisier dependencies in Figure 3f-i for the thinnest two samples (9 and 10 layers, respectively)[33]. Even so, they generally match well with the bulk data, suggesting any out of plane inter-layer magnetic coupling component that could disrupt the antiferromagnetic ordering[41] is not significant for the range of thicknesses studied here.
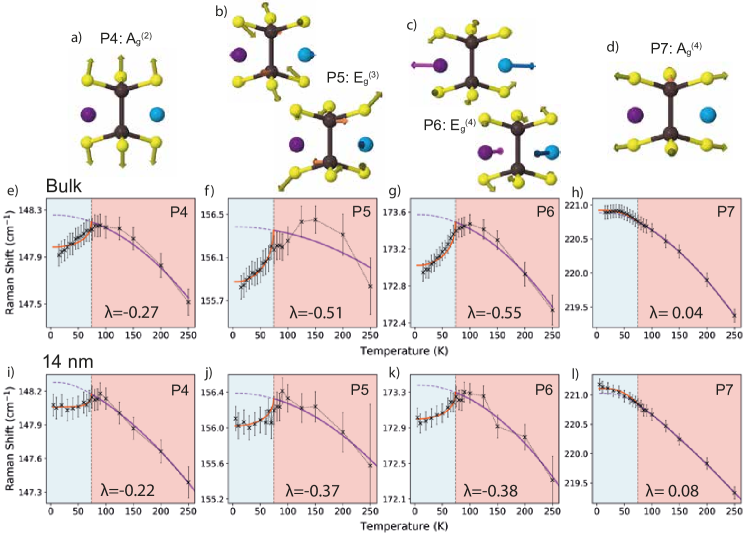
In order to fully analyse the temperature dependence of the Raman modes we identify a key figure of merit, the spin-phonon coupling strength, ,[37, 38, 39, 19] which represents how strongly the magnetic spin-ordering within the Mn sub-lattice influences the atomic vibrations of the non-magnetic sub-lattice via the super-exchange pathway. In this case, manifests as the difference between the observed Raman shift at T 0 K, and that expected by the temperature dependence without magnetic coupling (See SI Note 2 for a detailed interpretation). As such, the temperature dependent peak positions of each phonon mode, and flake thickness, are fitted using a combination of Brillouin function,[47, 31, 19, 37] and anharmonic phonon model. The Brillouin function is used to define the overall magnetisation state of our 2D system as a function of temperature and is defined by the material properties. Figure 4 displays the results of this combined anharmonic phonon plus Brillouin function fitting applied to bulk and few-layer (14 nm, 18 layers[33]) MnPSe3 samples, with emphasis on the transition from ordered antiferromagnetism below 74 K (pale blue regions) to the disordered paramagnetism above 74 K (red regions). The experimental data can be seen as black crosses obtained via Voigt peak fitting of each Raman mode. The error bars shown are derived from a combination of errors associated with fitting the phonon modes and spectrometer resolution. The anharmonic temperature dependence, which defines the non-magnetic temperature dependent behaviour of the phonon modes, is applied to the experimental data above the Néel temperature (solid purple line).[48, 49, 19] The magnetic dependence of the phonon modes, is defined as the difference between the anharmonic fitting extended below TN (dashed purple line), and the experimentally obtained data points (black crosses). This magnetisation dependence is recreated in each phonon mode (solid orange line) using the MnPSe3 reduced magnetism, defined by the Brillouin function normalised to 0 at TN and 1 at T = 0 K, multiplied by the spin-phonon coupling, .[47, 31, 37, 38, 39, 19, 49, 48]
| Sample Thickness | Spin-phonon coupling, | |||
|---|---|---|---|---|
| Raman Mode | P4 (148 cm-1) | P5 (156 cm-1) | P6 (173 cm-1) | P7 (221 cm-1) |
| 7.3 nm (9 L) | -0.19 | -0.45 | -0.57 | -0.07 |
| 7.9 nm (10 L) | -0.23 | -0.99 | -0.43 | -0.18 |
| 14.1 nm (18 L) | -0.17 | -0.37 | -0.38 | 0.08 |
| 17.4 nm (22 L) | -0.17 | -0.37 | -0.42 | 0.11 |
| Bulk 1 | -0.21 | -0.38 | -0.39 | 0.06 |
| Bulk 2 | -0.27 | -0.51 | -0.55 | 0.04 |
| Bulk 3 | -0.31 | -0.53 | -0.57 | 0.00 |
Fitting parameters of all sample thicknesses, along with a full description of the fitting process is available in SI Note 2. Table 1 lists the spin-phonon coupling strength, , of all thicknesses measured. The variation in , for a given phonon mode, between samples does not show any obvious trend with respect to sample thicknesses. Therefore, we attribute these discrepancies to a combination of random variations in sample strain and reduced signal-to-noise ratio in the thinner samples. It can be seen, however, that each sample measured, regardless of sample thickness, shows the same overall trends with P5 and P6 displaying the largest spin-phonon coupling strength, with P7 the lowest providing an overall consistency between all samples measured.
Density functional theory provides extra insight into the atomic vibrational composition of the phonon modes (See Figs.4a-d) and is used here to qualitatively analyse the relationship between magnetic spin-ordering and atomic movements via the super-exchange. A specific consideration is made to the Mn-Se-Mn ionic bond lengths and bond angle, which provides the greatest influence over the strength of the super-exchange pathway between neighbouring manganese atoms.[45, 41] Full details are given in SI Note 1 but, briefly, we used both frozen phonon[50] and perturbation theory[51] approaches within density functional theory at the generalised gradient approximation level[52, 53] including the local spin-density approximation and taking into account a possible on-site Hubbard [54, 55] term whose value was determined as part of this work. A frozen phonon approach calculates the inter-atomic forces with zero vibrations to construct a force constant matrix by which the normal modes at a given wave-vector can be calculated, essentially forming the phonon dispersion. Density functional perturbation theory goes a step further by introducing perturbations to the system in order to measure the response in spin and charge densities, as well as polarizability. In order to account for non-homogeneity of spin and charge densities, a generalized gradient approximation is added, while the Hubbard parameter accounts for electron localisation and hopping.[51]
Figure 4a shows that the atomic vibrational composition of P4 (148 cm-1) is entirely due to the Se atoms shifting out-of-plane, with zero contribution from the manganese sub-lattice. This leads to the conclusion that the spin-phonon coupling, , observed in P4 is entirely due to the Mn-Se-Mn super-exchange pathway, with a significant variation in both pathway length and ionic bond angle leading to a large spin-phonon coupling, , as shown in Table 1.
The atomic vibrational calculations suggest P5 (156 cm-1) should possess a relatively low spin-phonon coupling due to the low vibrational contribution from the Mn sub-lattice. Experimental evidence however, indicates a large spin-phonon coupling, as shown in Table 1. Further investigations (See SI Note 3) show a merging with a close by mode (labelled * in Figs. 1a and 2a) which has the effect of broadening the observed peak near the Néel temperature where the two separate modes are closest, and shifting the fitted peak centre to higher relative wavenumbers. When applying the temperature dependent Brillouin fitting to P5 we therefore obtain a higher experimental spin-phonon coupling from the experimental results than expected via DFT. Taking this into account with a multiple peak analysis reduces the extracted spin-phonon coupling to a value more compatible with DFT results, as explored in SI Note 3. Since this multiple peak fitting can only be applied to samples with large signal (i.e. Bulk samples with large excitation powers), the results presented in Table 1 are without taking this mode merging into account.
P6 (173 cm-1) is expected to show the largest spin-phonon coupling due to the large contribution from the Mn sub-lattice, along with a large change in both Mn-Se-Mn bond length and angle. This expectation is fulfilled by the experimental data displayed in Figs.4 and 1. The thinner samples generally have a reduced spin-phonon coupling strength, , compared to the bulk samples.
Finally, P7 (221 cm-1) is observed to have a near-zero spin-phonon coupling, as shown by Figure 4. Considering the atomic shifts of this vibrational mode, it can be seen that the Mn-Se-Mn bond angle is not perturbed, while the change in bond lengths are symmetrical and small when compared to the other modes. Combined with zero magnetic sub-lattice contribution, this provides little framework for neither spin-phonon coupling through a super-exchange path, nor direct coupling.
Conclusions
This work represents an investigation into an overlooked area of the opto-mechanical properties of MnPSe3. The higher frequency phonon modes, predominantly attributed to the non-magnetic sub-lattice of MnPSe3, have now been thoroughly explored through a combination of density functional theory and Raman spectroscopy. A previous investigation detailing the temperature dependent mode shifts of MnPSe3[46] suggested a linear dependence of peak position towards lower frequencies in both bulk and few layer MnPSe3 samples. Our observations deviate significantly from that conclusion. We believe that the higher resolution grating used here, as well as pursuing a lower temperature region allows us to obtain a more accurate picture of the temperature dependent magnetic ordering than has previously been reported. Furthermore, we also note that significantly more samples are measured here, all repeating the same nonlinear temperature dependence. Our analytical approach is, likewise, more complete. We use a combination of anharmonic temperature dependent shift and magnetic specific Brillouin-like function to extract a spin-phonon coupling strength, , from each phonon resonance.
Methods
Temperature dependent Raman spectroscopy. Ultra-low frequency Raman spectroscopy is performed using a custom-built free-space micro-Raman setup. Flakes of MnPSe3 are placed within a flow cryostat (MicrostatHiRes, Oxford Instruments) and cooled to K. A flow controller and heater is used to control the sample temperature as required. The phonon modes of MnPSe3 are excited using a 532 nm diode pumped solid state laser (model 04-01, Cobalt) with linewidth 1 MHz. The excitation beam is focused onto the samples via a high (0.55) NA 50x microscope objective (M Plan Apo 50X, Mitutoyo). Back-scattered light is collected using the same objective lens. The laser line is rejected using three 10 cm-1 Bragg notch filters (BragGrate™, Optigrate). The Raman signal is analysed using a 0.75 cm monochromater (SP750, Princeton Instruments) with a 1800 g/mm holographic grating and a nitrogen cooled charge-coupled device camera with a pixel size of 20 m x 20 m (PyLon:100BR, Princeton Instruments) providing spectral resolution of cm-1 per pixel. The linewidths of the phonons studied here are larger than one pixel, allowing for sub-pixel precision when finding peak position, see SI Note 2. Polarisation optics are configured as, quarter wave plate - motorised linear polariser - Sample - motorised linear polariser - motorised half wave plate, to allow for linear polarisation excitation of arbitrary polarisation angle without loss of power, selection of co- and cross- polarisation detection without loss of signal to the holographic grating. Laser power at the sample is typically 0.5 mW (Power density of 6.37 W/cm2) unless stated otherwise. We observe no effect from laser heating in our data (No shift in Néel temperature towards lower temperatures), thanks in part to the large cooling power of the flow cryostat. The spectral resolution of this system is 0.4 cm-1, with spatial resolution of 1 m. A schematic of the experimental setup is available in SI Note 7.
Density Functional Theory. We used both frozen phonon and perturbation theory approaches within density functional theory at the generalised gradient approximation level of approximation including the local spin-density approximation and taking into account a possible on-site Hubbard term whose value was determined as part of this work. A full description of the DFT analysis is provided in SI Note 1.
Acknowledgments
We acknowledge IT services at the Universities of Sheffield and Bath for the provision of services for High Performance Computing (HPC). Computational work in Bath was supported by the EU Horizon 2020 OCRE project “Cloud funding for research”. D. J. G., O. H., and A. I. T. acknowledge support from the European Graphene Flagship Project under grant agreement number 881603 and EPSRC grants EP/S030751/1, EP/V006975/1, and EP/V026496/1.
Author Contributions
D.J.G. and O.H. carried out micro-mechanical exfoliation of the MnPSe3 flakes and performed experimental observations using Raman spectroscopy. D.W. performed density functional theory of MnPSe3. D.W. provided insight into the analytical model used to fit the temperature dependent Raman response while D.J.G. performed the fitting procedures. D.J.G., D.W., O.M., and A.I.T. had ongoing analytical discussions regarding the experimental and DFT data throughout the project. D.J.G., D.W., and A.I.T. managed various aspects of the project. A.I.T. conceived of, and supervised the project. D.J.G. wrote the manuscript with major contributions from DW and further contributions from all co-authors.
Data Availability
The data that support the plots within this paper and other findings of this study are available from the corresponding author upon reasonable request.
Code availability
The codes that support the findings of this study are available from
https://www.quantum-espresso.org/. Inputs to these codes are available free of charge at https://doi.org/10.15125/BATH-01218
Competing interests
The authors declare no competing interests.
References
- [1] A.. Geim and I.. Grigorieva “Van der Waals heterostructures” In Nature 499.7459 Nature Publishing Group, 2013, pp. 419–425 DOI: 10.1038/nature12385
- [2] K.. Novoselov “Electric field in atomically thin carbon films” In Science 306.5696, 2004, pp. 666–669 DOI: 10.1126/science.1102896
- [3] Kin Fai Mak, Changgu Lee, James Hone, Jie Shan and Tony F. Heinz “Atomically Thin MoS2: A new Direct-Gap Semiconductor” In Phys. Rev. Lett. 105.13, 2010, pp. 136805 DOI: 10.1103/PhysRevLett.105.136805
- [4] Sajedeh Manzeli, Dmitry Ovchinnikov, Diego Pasquier, Oleg V Yazyev and Andras Kis “2D transition metal dichalcogenides” In Nat. Rev. Mater. 2.8, 2017, pp. 17033 DOI: 10.1038/natrevmats.2017.33
- [5] Wonbong Choi “Recent development of two-dimensional transition metal dichalcogenides and their applications” In Mater. Today 20.3 The Author(s), 2017, pp. 116–130 DOI: 10.1016/j.mattod.2016.10.002
- [6] Domenica Scarano and Federico Cesano “Graphene and Other 2D Layered Nanomaterials and Hybrid Structures: Synthesis, Properties and Applications” In Materials 14.23, 2021, pp. 7108 DOI: 10.3390/ma14237108
- [7] Je-Geun Park “Opportunities and challenges of 2D magnetic van der Waals materials: magnetic graphene?” In J. Phys.: Condens. Matter 28.30 IOP Publishing, 2016, pp. 301001 DOI: 10.1088/0953-8984/28/30/301001
- [8] Cheng Gong “Discovery of intrinsic ferromagnetism in two-dimensional van der Waals crystals” In Nature 546.7657 Nature Publishing Group, 2017, pp. 265–269 DOI: 10.1038/nature22060
- [9] Kenneth S. Burch, David Mandrus and Je Geun Park “Magnetism in two-dimensional van der Waals materials” In Nature 563.7729 Springer US, 2018, pp. 47–52 DOI: 10.1038/s41586-018-0631-z
- [10] M. Gibertini, M. Koperski, A.. Morpurgo and K.. Novoselov “Magnetic 2D materials and heterostructures” In Nat. Nanotechnol. 14.5 Springer US, 2019, pp. 408–419 DOI: 10.1038/s41565-019-0438-6
- [11] Bevin Huang “Layer-dependent ferromagnetism in a van der Waals crystal down to the monolayer limit” In Nature 546.7657 Nature Publishing Group, 2017, pp. 270–273 DOI: 10.1038/nature22391
- [12] Zaiyao Fei “Two-dimensional itinerant ferromagnetism in atomically thin Fe3GeTe2” In Nat. Mater. 17.9 Springer US, 2018, pp. 778–782 DOI: 10.1038/s41563-018-0149-7
- [13] Jae Ung Lee “Ising-Type Magnetic Ordering in Atomically Thin FePS3” In Nano Lett. 16.12, 2016, pp. 7433–7438 DOI: 10.1021/acs.nanolett.6b03052
- [14] M. Kim “Micromagnetometry of two-dimensional ferromagnets” In Nat. Electron. 2.10, 2019, pp. 457–463 DOI: 10.1038/s41928-019-0302-6
- [15] T P Lyons et al. “Interplay between spin proximity effect and charge-dependent exciton dynamics in MoSe2/CrBr3 van der Waals heterostructures” In Nat. Commun. 11.1 Springer US, 2020, pp. 6021 DOI: 10.1038/s41467-020-19816-4
- [16] Bevin Huang “Electrical control of 2D magnetism in bilayer CrI3” In Nat. Nanotechnol. 13.7, 2018, pp. 544–548 DOI: 10.1038/s41565-018-0121-3
- [17] Nitin Samarth “Magnetism in flatland” In Nature 546.7657, 2017, pp. 216–217 DOI: 10.1038/546216a
- [18] J.. Lado and J. Fernández-Rossier “On the origin of magnetic anisotropy in two dimensional CrI3” In 2D Mater. 4.3 IOP Publishing, 2017, pp. 035002 DOI: 10.1088/2053-1583/aa75ed
- [19] M.. Prosnikov “Magnetic dynamics and spin-phonon coupling in the antiferromagnet Ni2NbBO6” In Phys. Rev. B 98.10 American Physical Society, 2018, pp. 104404 DOI: 10.1103/PhysRevB.98.104404
- [20] Kangwon Kim et al. “Antiferromagnetic ordering in van der Waals 2D magnetic material MnPS3 probed by Raman spectroscopy” In 2D Mater. 6.4 IOP Publishing, 2019, pp. 041001 DOI: 10.1088/2053-1583/ab27d5
- [21] Frances Hellman et al. “Interface-induced phenomena in magnetism” In Rev. Mod. Phys. 89.2, 2017, pp. 025006 DOI: 10.1103/RevModPhys.89.025006
- [22] K. Ando, K. Takahashi, T. Okuda and M. Umehara “Magnetic circular dichroism of zinc-blende-phase MnTe” In Phys. Rev. B 46.19, 1992, pp. 12289–12297 DOI: 10.1103/PhysRevB.46.12289
- [23] K.. Burch, D.. Awschalom and D.. Basov “Optical properties of III-Mn-V ferromagnetic semiconductors” In J. Magn. Magn. Mater. 320.23, 2008, pp. 3207–3228 DOI: 10.1016/j.jmmm.2008.08.060
- [24] Xingzhi Wang “Raman spectroscopy of atomically thin two-dimensional magnetic iron phosphorus trisulfide (FePS3) crystals” In 2D Mater. 3.3 IOP Publishing, 2016, pp. 031009 DOI: 10.1088/2053-1583/3/3/031009
- [25] C.. Raman and K.. Krishnan “The Negative Absorption of Radiation” In Nature 122.3062, 1928, pp. 12–13 DOI: 10.1038/122012b0
- [26] Daniel Wolverson “Chapter 17 - Raman Spectroscopy” In Characterization of Semiconductor Heterostructures and Nanostructures (Second Edition) Oxford: Elsevier, 2013, pp. 753–802 DOI: https://doi.org/10.1016/B978-0-444-59551-5.00017-0
- [27] L.. Sandilands “Stability of exfoliated Bi2Sr2DyxCa1-xCu2O8+δ studied by Raman microscopy” In Phys. Rev. B 82.6, 2010, pp. 064503 DOI: 10.1103/PhysRevB.82.064503
- [28] J. Nasu, J. Knolle, D.. Kovrizhin, Y. Motome and R. Moessner “Fermionic response from fractionalization in an insulating two-dimensional magnet” In Nat. Phys. 12.10, 2016, pp. 912–915 DOI: 10.1038/nphys3809
- [29] V. Grasso and L. Silipigni “Optical absorption and reflectivity study of the layered MnPSe3 seleniophosphate” In J. Opt. Soc. Am. B 16.1, 1999, pp. 132–136 DOI: 10.1364/JOSAB.16.000132
- [30] Bheema Lingam Chittari “Electronic and magnetic properties of single-layer MPX3 metal phosphorous trichalcogenides” In Phys. Rev. B 94.18, 2016, pp. 184428 DOI: 10.1103/PhysRevB.94.184428
- [31] A Wiedenmann, J. Rossat-Mignod, A Louisy, R Brec and J Rouxel “Neutron diffraction study of the layered compounds MnPSe3 and FePSe3” In Solid State Commun. 40.12, 1981, pp. 1067–1072 DOI: 10.1016/0038-1098(81)90253-2
- [32] C Makimura, T Sekine, Y Tanokura and K Kurosawa “Raman scattering in the two-dimensional antiferromagnet MnPSe3” In J. Phys.: Condens. Matter 5.5, 1993, pp. 623–632 DOI: 10.1088/0953-8984/5/5/013
- [33] Zhuoliang Ni “Imaging the Néel vector switching in the monolayer antiferromagnet MnPSe3 with strain-controlled Ising order” In Nat. Nanotechnol. 16.7, 2021, pp. 782–787 DOI: 10.1038/s41565-021-00885-5
- [34] H.A Kramers “L’interaction Entre les Atomes Magnétogènes dans un Cristal Paramagnétique” In Physica 1.1-6, 1934, pp. 182–192 DOI: 10.1016/S0031-8914(34)90023-9
- [35] P W Anderson “Antiferromagnetism. Theory of Superexchange Interaction” In Phys. Rev. 79.2, 1950, pp. 350–356 DOI: 10.1103/PhysRev.79.350
- [36] D.. Lockwood and M.. Cottam “The spin‐phonon interaction in FeF2 and MnF2 studied by Raman spectroscopy” In J. Appl. Phys. 64.10, 1988, pp. 5876–5878 DOI: 10.1063/1.342186
- [37] Anudeepa Ghosh “Spin-phonon coupling and magnon scattering in few-layer antiferromagnetic FePS3” In Phys. Rev. B 103.6 American Physical Society, 2021, pp. 064431 DOI: 10.1103/PhysRevB.103.064431
- [38] L.. Casto “Strong spin-lattice coupling in CrSiTe3” In APL Mater. 3.4, 2015, pp. 041515 DOI: 10.1063/1.4914134
- [39] A Fainstein, P. Etchegoin, H.. Trodahl and J.. Tallon “Spin-order-dependent Raman scattering in RuSr2GdCu2O8” In Phys. Rev. B 61.22, 2000, pp. 15468–15473 DOI: 10.1103/PhysRevB.61.15468
- [40] Thuc T. Mai “Magnon-phonon hybridization in 2D antiferromagnet MnPSe3” In Sci. Adv. 7.44, 2021, pp. eabj3106 DOI: 10.1126/sciadv.abj3106
- [41] S. Calder, A.. Haglund, A.. Kolesnikov and D. Mandrus “Magnetic exchange interactions in the van der Waals layered antiferromagnet MnPSe3” In Phys. Rev. B 103.2 American Physical Society, 2021, pp. 024414 DOI: 10.1103/PhysRevB.103.024414
- [42] Qi Pei, Yan Song, Xiaocha Wang, Jijun Zou and Wenbo Mi “Superior Electronic Structure in Two-Dimensional MnPSe3/MoS2 van der Waals Heterostructures” In Sci. Rep. 7.1, 2017, pp. 9504 DOI: 10.1038/s41598-017-10145-z
- [43] Durgesh Kumar Sharma, Sudhir Kumar and Sushil Auluck “Strain induced optoelectronic properties of two dimensional MnPSe3/WS2 heterostructure” In J. Phys.: Condens. Matter 32.31 IOP Publishing, 2020, pp. 315501 DOI: 10.1088/1361-648X/ab7f6d
- [44] Qi Pei, Xiaocha Wang, Jijun Zou and Wenbo Mi “Efficient band structure modulations in two-dimensional MnPSe3/CrSiTe3 van der Waals heterostructures” In Nanotechnology 29.21, 2018, pp. 214001 DOI: 10.1088/1361-6528/aab5ab
- [45] Diana Vaclavkova “Magnetoelastic interaction in the two-dimensional magnetic material MnPS3 studied by first principles calculations and Raman experiments” In 2D Mater. 7.3, 2020, pp. 035030 DOI: 10.1088/2053-1583/ab93e3
- [46] Ping Liu “Exploring the magnetic ordering in atomically thin antiferromagnetic MnPSe3 by Raman spectroscopy” In J. Alloy. Compd. 828 Elsevier B.V, 2020, pp. 154432 DOI: 10.1016/j.jallcom.2020.154432
- [47] M.. Darby “Tables of the Brillouin function and of the related function for the spontaneous magnetization” In Br. J. Appl. Phys. 18.10, 1967, pp. 1415–1417 DOI: 10.1088/0508-3443/18/10/307
- [48] M. Balkanski, R.. Wallis and E. Haro “Anharmonic effects in light scattering due to optical phonons in silicon” In Phys. Rev. B 28.4, 1983, pp. 1928–1934 DOI: 10.1103/PhysRevB.28.1928
- [49] Tian Lan, Xiaoli Tang and Brent Fultz “Phonon anharmonicity of rutile TiO2 studied by Raman spectrometry and molecular dynamics simulations” In Phys. Rev. B 85.9, 2012, pp. 094305 DOI: 10.1103/PhysRevB.85.094305
- [50] M.. Yin and Marvin L. Cohen “Theory of static structural properties, crystal stability, and phase transformations: Application to Si and Ge” In Phys. Rev. B 26.10, 1982, pp. 5668–5687 DOI: 10.1103/PhysRevB.26.5668
- [51] Stefano Baroni, Stefano Gironcoli, Andrea Dal Corso and Paolo Giannozzi “Phonons and related crystal properties from density-functional perturbation theory” In Rev. Mod. Phys. 73.2 American Physical Society, 2001, pp. 515–562 DOI: 10.1103/RevModPhys.73.515
- [52] John P Perdew, Kieron Burke and Matthias Ernzerhof “Generalized Gradient Approximation Made Simple” In Phys. Rev. Lett. 77.18 APS, 1996, pp. 3865–3868 DOI: 10.1103/PhysRevLett.77.3865
- [53] Lucian A. Constantin, John P. Perdew and J.. Pitarke “Exchange-correlation hole of a generalized gradient approximation for solids and surfaces” In Phys. Rev. B 79.7, 2009, pp. 075126 DOI: 10.1103/PhysRevB.79.075126
- [54] Iurii Timrov, Nicola Marzari and Matteo Cococcioni “Self-consistent Hubbard parameters from density-functional perturbation theory in the ultrasoft and projector-augmented wave formulations” In Phys. Rev. B 103.4 American Physical Society, 2021, pp. 045141 DOI: 10.1103/PhysRevB.103.045141
- [55] Iurii Timrov, Nicola Marzari and Matteo Cococcioni “Hubbard parameters from density-functional perturbation theory” In Phys. Rev. B 98.8 American Physical Society, 2018, pp. 085127 DOI: 10.1103/PhysRevB.98.085127