Point Cloud Classification Using Content-based Transformer via Clustering in Feature Space
Abstract
Recently, there have been some attempts of Transformer in 3D point cloud classification. In order to reduce computations, most existing methods focus on local spatial attention, but ignore their content and fail to establish relationships between distant but relevant points. To overcome the limitation of local spatial attention, we propose a point content-based Transformer architecture, called PointConT for short. It exploits the locality of points in the feature space (content-based), which clusters the sampled points with similar features into the same class and computes the self-attention within each class, thus enabling an effective trade-off between capturing long-range dependencies and computational complexity. We further introduce an Inception feature aggregator for point cloud classification, which uses parallel structures to aggregate high-frequency and low-frequency information in each branch separately. Extensive experiments show that our PointConT model achieves a remarkable performance on point cloud shape classification. Especially, our method exhibits 90.3% Top-1 accuracy on the hardest setting of ScanObjectNN. Source code of this paper is available at https://github.com/yahuiliu99/PointConT.
Index Terms:
point cloud classification, local attention, content-based Transformer, feature aggregator, deep learning.I Introduction
3D point cloud analysis has gained tremendous popularity in many fields, including scene understanding[1, 2, 3], robotics and self-driving vehicles[4, 5, 6]. Compared with 2D images, 3D point clouds can provide sufficient spatial and geometric information, but they are not arranged in any particular order. Due to its irregular structure, the convolutional neural networks cannot be directly applied to point cloud processing, while Transformer[7] architecture is inherently permutation-invariant and natural-suited for point cloud learning.
Recently, some explorations have been made on the Transformer architecture in point cloud analysis [8, 9, 10, 11, 12, 13, 14]. However, a common downside of these models, the high computational cost, has caught the attention of researchers and motivated them to consider the trade-off between accuracy and inference speed. The two main approaches to reduce the computational complexity are downsampling points and local self-attention[8, 13, 11, 12]. Points downsampling algorithms, such as farthest point sampling (FPS)[15], provide uniform coverage of the entire point cloud. Local self-attention computes the relationship within a subset of points (patch or cubic window) that is partitioned in 3D space. Although local spatial attention significantly improves efficiency, it still faces difficulty in capturing interactions among distant but similar points.
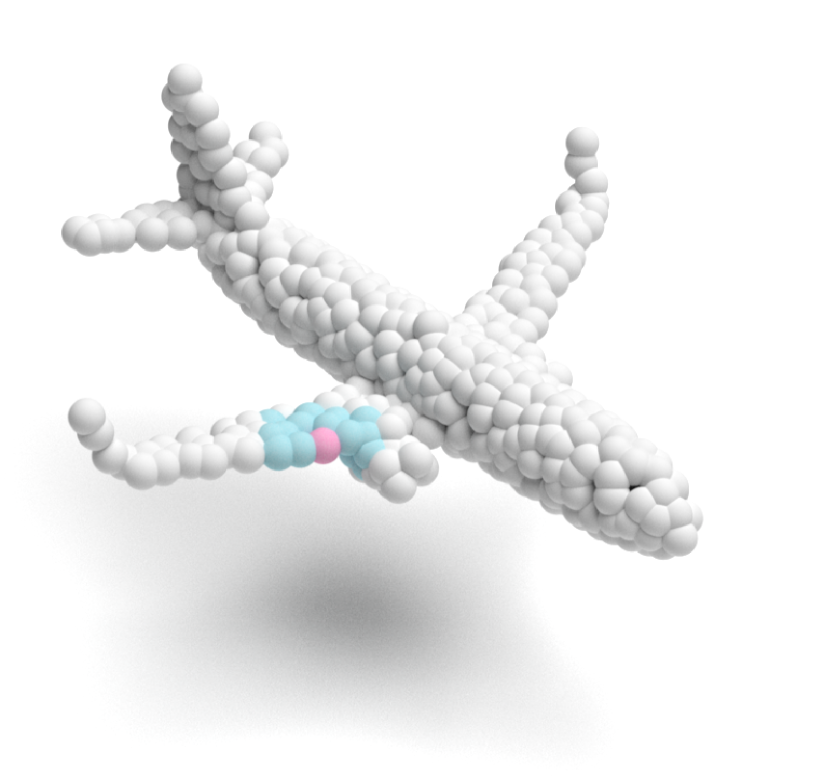
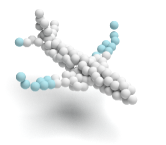
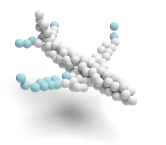
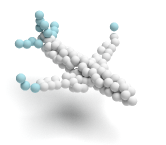
Therefore, we propose a simple yet powerful architecture for point cloud classification, named point content-based Transformer (PointConT), which exploits local self-attention in the feature space (content-based) instead of the 3D space, as visualized in Fig. 1. Starting from the content of the point cloud, we cluster the sampled points into classes based on their similarity, and compute the self-attention within each class, which preserves the ability of the global self-attention mechanism to capture long-range feature dependencies, while significantly reducing computational complexity. Specifically, it dynamically divides all queries into multiple clusters according to their contents (i.e., features) in each block, and selects the corresponding keys and values to compute local self-attention. The clustering varies accordingly at each stage and each head in the Transformer, adequately reflecting the content dynamics. Note that unlike the k-nearest neighborhood (kNN), the clusters are non-overlapping, which further reduces the computational complexity.
Moreover, we complement the point cloud feature aggregation from a frequency standpoint. Recent studies[16, 17] found that max-pooling amplifies high-frequency features while average pooling and Transformer reduce high-frequency components, which also accords with the observations in our ablation experiments. \addIn order to aggregate high-frequency and low-frequency features, we design an Inception feature aggregator composed of two branches, where the name of “Inception” is derived from the Inception module[18, 19]. The high-frequency aggregation branch consists of a max-pooling operation and a residual MLP module, while the low-frequency aggregation branch is implemented by an average pooling operation and the content-based Transformer block.
The main contributions of this paper are summarized as follows.
-
•
We propose the point content-based Transformer (PointConT) to cluster points according to their content and compute self-attention within each cluster, establishing long-range feature dependencies while significantly reducing computations.
-
•
We design an Inception feature aggregator for point cloud classification, using parallel structures to aggregate high-frequency and low-frequency information in each branch separately.
- •
II Related Work
II-A Point Cloud Processing
There are mainly two branches of methods for processing the point clouds. One is to convert point clouds into a regular grid structure that can be directly consumed by convolutional neural networks, such as volumetric representation[22, 23, 24] (through voxelization) or images[25, 26] (through projection or rendering). The other is point-based modeling, where the raw point clouds are directly fed into deep networks without any conversion. This paper focuses on point-based methods.
PointNet is a pioneering work that successfully applies deep architecture on raw point sets [27]. It is constructed as a symmetric function using shared \addmulti-layer perceptrons (MLP\add) and max-pooling, which guarantees its permutation-invariance. However, PointNet only learns either single-point or global features, and thus is limited in capturing interactions among points. PointNet++ is built on top of the PointNet, which learns hierarchical point cloud features and is able to aggregate features in local geometric neighbors using set abstraction [15] .
Following them, some works have extended the point-based methods to various local aggregation operators. The explorations of local aggregation operators can be categorized into three groups: convolution-based[28, 29, 30, 31, 32, 33, 34, 35], graph-based[36, 37, 38, 39], and attention-based[40, 9, 8, 41, 42] methods.
Convolution-based methods
[31] and [32] learn the kernel within a local region through predefined geometric priors. Another type of point convolutions, KPConv[34], relates the weight matrices with predefined kernel points in 3D space. However, the fixed kernel points may not be optimal for modeling the complicated 3D position variations. PAConv constructs a position adaptive convolution operator with a dynamic kernel [35], which assembles basic weight matrices in Weight Bank. The assembling coefficients are learned from relative point positions by MLPs.
Graph-based methods
The rise of the graph-based methods began with DGCNN[37], which learns on graphs dynamically updated at each layer. It proposes a local feature aggregation operator, named EdgeConv, which generates edge features that describe the semantic relationships between key points and their neighbors in the feature space. Besides, CurveNet explores geometric information by taking guided walks to group contiguous segments of points as curves [39].
Attention-based methods
Point Cloud Transformer designs offset attention for extracting global features and uses a neighbor embedding strategy to augment local feature representation[9]. Point Transformer proposes a modified Transformer architecture that aggregates local features with vector attention and relative position encoding [8]. Stratified Transformer[12], inspired by Swin Transformer[43], partitions the 3D space into non-overlapping cubic windows, and proposes a stratified strategy for sampling keys.
In addition, PointASNL[44] leverages non-local network[45] and adaptive sample module to enhance the long-dependency correlation learning. Recently, PointNeXt[46] explores more advanced training and data augmentation strategies with the PointNet++ backbone to further improve the accuracy and efficiency.
II-B Vision Transformer
In recent years, compared to familiar convolutional networks, Transformer architectures have shown great success in 2D images understanding. Vision Transformer(ViT)[47] is the first paper that successfully applies a Transformer encoder on images. It divides an image into non-overlapping patches (tokens), which are then linearly embedded. Further, Pyramid ViT (PVT)[48, 49] proposes a hierarchical structure into Transformer framework. Transformer in Transformer (TNT)[50] extends the ViT baseline with sub-patch-wise attention within patches. More recently, Methods of [43, 51, 52, 53] compute attentions within local windows. Swin[43] is a representative approach, which employs two key concepts to improve the original ViT — hierarchical feature maps and shifted window attention. Beyond image-space hand-crafted window, DGT[54] and BOAT[55] exploit feature-space locality. DGT[54] dynamically divides queries into multiple groups and selects the most relevant keys/values for each group to compute the attention. BOAT[55] supplements the existing window-based local attention with the feature space local attention module, which enables the modeling ability for long-range feature dependencies to be significantly improved.
Although Transformer is highly capable of establishing long-range dependencies, recent studies present intuitive visual explanations that Transformer lacks the ability to capture high frequencies that predominantly convey local information [16, 17]. In other words, Transformer is a low-pass filter. To address this issue, Inception Transformer (iFormer)[17] designs \adda channel splitting mechanism to adopt parallel convolution path and self-attention path as high-frequency and low-frequency mixers.
Inspired by the concepts of feature space local attention and features in different frequencies, we adopt content-based Transformer and Inception feature aggregator for 3D point cloud classification.
III Methodology
III-A Overall Architecture
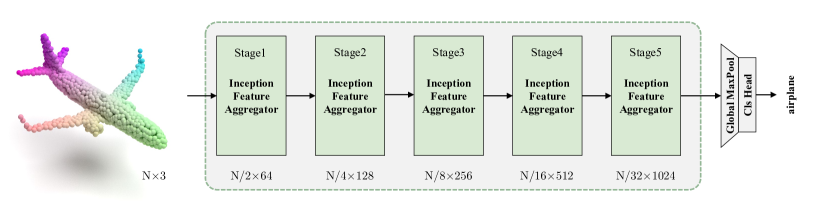
An overview of the proposed PointConT architecture is shown in Fig. 2. The backbone structure consists of five hierarchical stages of Inception feature aggregator blocks.
Given an input point cloud , containing points in 3-dimensional space. \addThe “Stage 1” Inception feature aggregator block partitions the point cloud into overlapping patches and then embeds the input coordinates into a new feature space (dimension denoted as ). It halves the number of points and doubles the number of feature dimensions stage by stage. Consequently, the output contains points and feature dimensions at the -th stage. For classification, the final classifier head is a global max-pooling followed by two linear layers.
III-B Inception Feature Aggregator
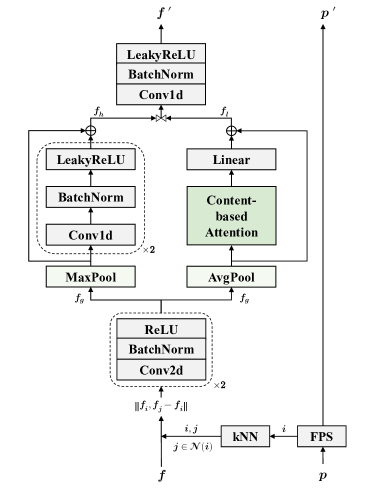
As shown in Fig. 3, take the -th stage as an example. Given the point coordinates and point features from the last stage, the Inception feature aggregator block first downsamples center points at 2 rates from via FPS, then the kNN algorithm is performed to group local patches. \addWe regard as the center point and as a patch surrounding it. We further use an EdgeConv designed in DGCNN[37] shown as Eq. (1), which extracts the relationship between center point feature and its neighbors ( denotes the number of neighbors) within each patch.
| (1) |
Where denotes that minus to obtain the neighboring features relative to the centroid , is the concatenation operation and MLP is a simple network that includes a point-wise convolutional layer, a batch normalization layer, and an activation function. Note that unlike DGCNN, which defines its kNN in the feature space, we adopt neighbor search in the 3D space.
Next, we propose a mix pooling strategy to aggregate the features of local patches. In most previous works, max-pooling has been verified as effective in aggregating the local feature\adds, for the reason that it can capture high frequencies that predominantly convey local information. Instead of directly combining max-pooling and Transformer block in a serial manner, in our PointConT, we use a parallel structure composed of a high-frequency aggregation branch and a low-frequency aggregation branch. The max-pooling operation aggregates high-frequency signals, while the average pooling operation filters low-frequency representations.
High-frequency aggregation branch
This branch can be defined as
| (2) |
where MaxPool and ResMLP denote max-pooling operation and residual MLP block, respectively.
Low-frequency aggregation branch
We simply utilize an average pooling layer (AvgPool) before the content-based Transformer (ConT), and this design allows the content-based Transformer to focus on embedding low-frequency information. This branch can be defined as
| (3) |
In the end, we concatenate the features from the high-frequency aggregation branch and the low-frequency aggregation branch, and then feed them to an MLP block as the Inception aggregator output \addfeatures .
| (4) |
III-C Content-based Transformer
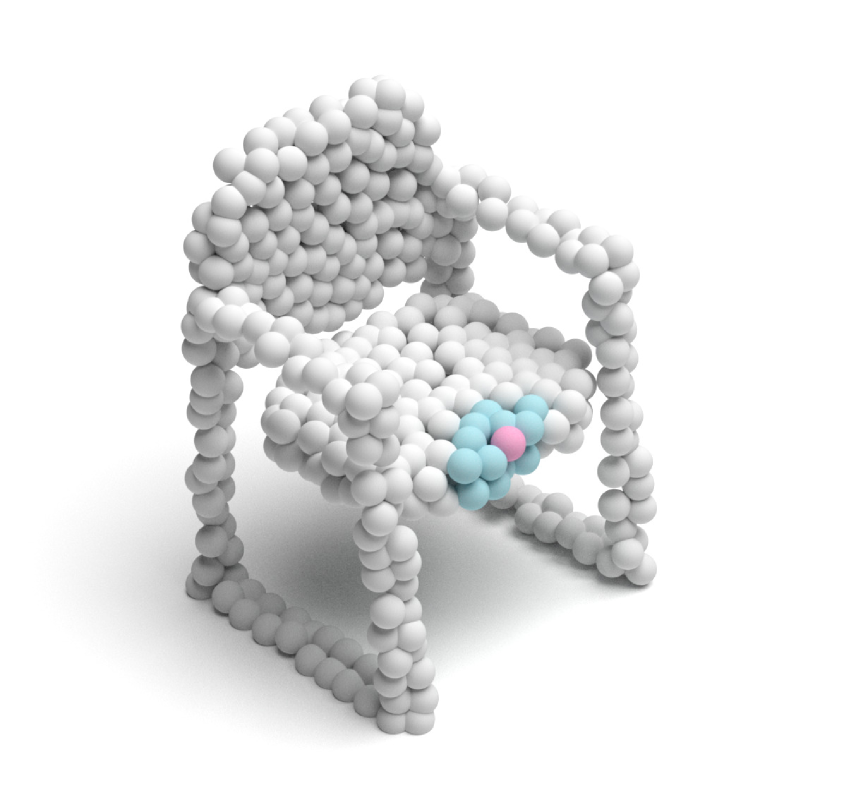
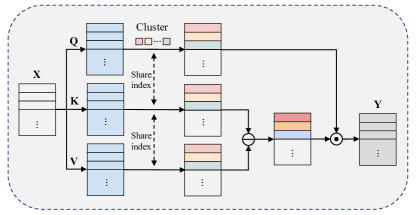
Differently from Point Transformer[8], which computes self-attention among local spatial neighbors, we propose a content-based attention, as visualized in Fig. 4. It dynamically divides all queries into multiple clusters according to their content (i.e., features) at each block, and selects the corresponding keys and values to compute local self-attention.
Let ( is the feature space dimension, denotes the length of features) be a set of feature vectors. Furthermore, we get embeddings , and to represent the queries, keys and values, respectively.
Then we use the clustering algorithm so that the queries are scattered in different clusters. K-means clustering algorithm is a classic method for clustering problems. However, K-means clustering generally enables each cluster to contain varying numbers of queries, and therefore this algorithm cannot be implemented in a parallel way by using GPUs. To address this issue, we refer to the balanced binary clustering algorithm proposed in BOAT[55], which equally divides a set of queries into two clusters hierarchically.
Through clustering, the queries are grouped into subsets , where each subset has equal size . Subsequently, keys and values are separated into and by the same index. The self-attention (SA) in each subset is formulated as
| (5) |
where is the output of each subset. Lastly, all subsets are merged into the output in keeping with their original order.
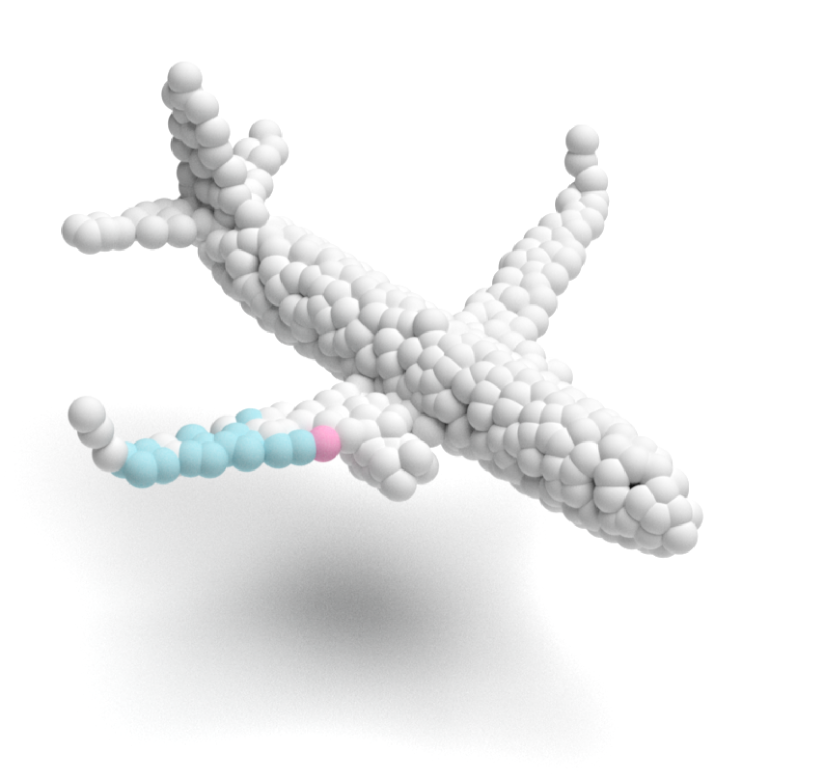
Multi-head configuration is a standard practice in Transformer, we expand multiple heads and each head performs query/key/value embeddings and clustering independently. This setting brings clustering diversity to a great extent, as visualized in Fig. 5.
Hierarchical binary clustering
Similarly to K-means clustering that the cluster assignment relies on the distance between all cluster centroids and each sample, our binary clustering starts with a random division of queries into two clusters and then calculates the two cluster centroids, denoted as and , respectively. After that, we compute the distance ratio to perform the hard assignment. Above operations can be summarized as
| (6) |
where means the Euclidean distance in feature space, and represent the two equal size clusters through balanced binary clustering. After performing iterations () of binary clustering, we obtain subsets with the same size.
Choice of SA
In Point Transformer, the choice of the self-attention has a crucial influence on the properties of Transformer block. One choice of SA is the standard scalar attention as
| (7) |
Complexity Analysis
Given a set of feature vectors with a size , for standard multi-head self-attention (MSA), the computational complexity of a local MSA module is , where is the number of points in a local neighborhood. Unlike scalar attention, vector attention further reduces the complexity to . In our PointConT, hierarchical binary clustering algorithm divides the feature vectors in a non-overlapping manner, dramatically reducing the complexity to .
| (9) |
IV Experiments
In this section, we show experimental results of the proposed model on the shape classification task. All the experiments are performed on one Tesla V100 GPU.
Implementation details. We \addimplement the PointConT in PyTorch framework and \addtrain the network using the SGD optimizer (momentum and weight decay set to 0.9 and 0.0001, respectively), cosine learning rate schedule starting at 0.001 (warm up steps set to 10), and cross-entropy with label smoothing. We \addfix the random seed in all experiments to eliminate the influence of randomness.
For shape classification training, we only \adduse 1024 uniformly sampled points as network inputs. Moreover, we \adduse RSMix[57] in addition to random scaling and translation as data augmentation. We \addtrain PointConT on ModelNet40 and ScanObjectNN with a batch size of 32 and 64 for 300 and 400 epochs, respectively. For testing, batch size \addis set to 16 and 32 on ModelNet40 and ScanObjectNN, respectively.
IV-A Classification on ModelNet40
We evaluate the model on the ModelNet40[20] shape classification benchmark. There are 12,308 computer-aided design (CAD) models of point clouds from 40 common categories. The dataset is divided as 9840 models for training and 2468 models for testing.
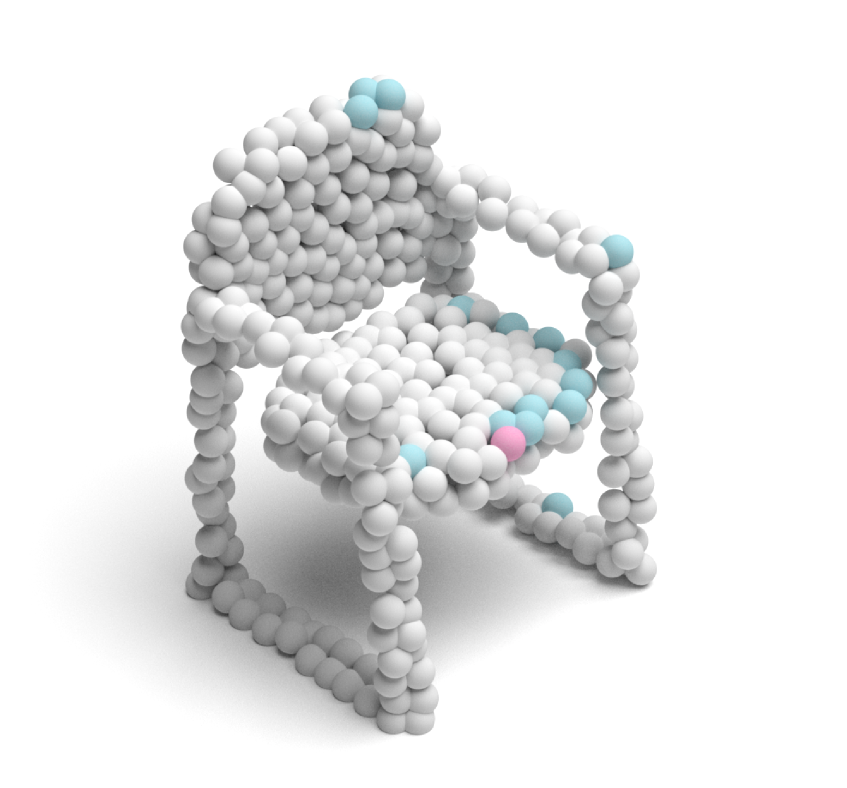
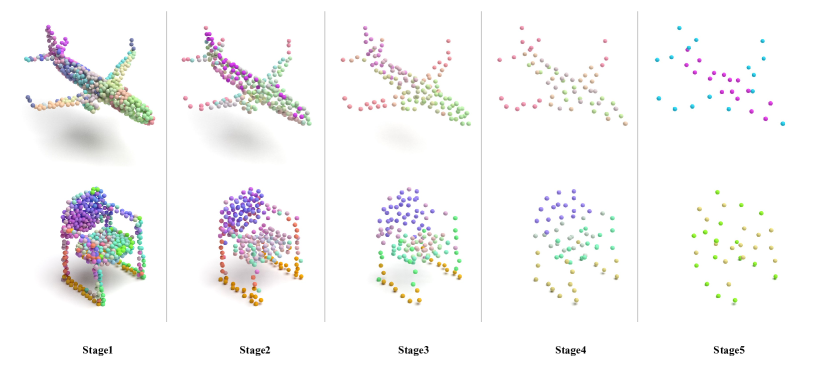
The results are presented in Table I. The overall accuracy of PointConT on ModelNet40 is 93.5%, which is a competitive result in attention-based models. Besides, our PointConT presents a high inference speed (166 samples/second in training and 279 samples/second in testing), which is 3.5 faster than the original PointMLP[58] paper and 1.4 faster than the lightweight version PointMLP-elite. We visualize the clustering results at each stage in Fig. 6. The clusters are able to cover long-range dependencies.
\addOA: Overall accuracy.
| Method | Model | Input | OA(%) |
|---|---|---|---|
| MLP | PointNet[27] | 1K points+normal | 89.2 |
| PointNet++[15] | 1K points | 90.7 | |
| PointNet++[15] | 5K points+normal | 91.9 | |
| PointMLP[58] | 1K points | 94.1 | |
| Conv | PointCNN[28] | 1K points | 92.5 |
| PointWeb[30] | 1K points+normal | 92.3 | |
| PointConv[29] | 1K points+normal | 92.5 | |
| RS-CNN[31] | 1K points | 92.9 | |
| KPConv[34] | 1K points | 92.9 | |
| PosPool[32] | 5K points | 93.2 | |
| PAConv[35] | 1K points | 93.6 | |
| Graph | DGCNN[37] | 1K points | 92.9 |
| CurveNet[39] | 1K points | 93.8 | |
| Non-Local | PointASNL[44] | 1K points | 92.9 |
| Attention | GDANet[40] | 1K points | 93.4 |
| PCT[9] | 1K points | 93.2 | |
| Point Trans.[8] | 1K points | 93.7 | |
| PointConT(ours) | 1K points | 93.5 |
IV-B Classification on ScanObjectNN
We furthermore perform experiments on a recent real-world point cloud classification dataset — ScanObjectNN[21], which consists of 15k objects from 15 categories. We only report the heavy permutations from rigid transformations PB_T50_RS dataset. Unlike sampled virtual point clouds in ModelNet40, objects in ScanObjectNN are obtained from real-world scans. Therefore, the point clouds in ScanObjectNN are noisy (background, occlusions) and not axis-aligned, which brings a significant challenge to existing point cloud analysis methods.
Table II shows the classification results on ScanObjectNN. PointConT outperforms prior models with 88.0% overall accuracy without voting[31] and reaches Top-1 90.3% when averages 10 prediction votes. This suggests that the PointConT is effective in real world point clouds.
denotes method evaluated with voting strategy[31].
\addmAcc: mean class accuracy; OA: overall accuracy.
| Model | mAcc(%) | OA(%) |
|---|---|---|
| PointNet[27] | 63.4 | 68.2 |
| SpiderCNN[33] | 69.8 | 73.7 |
| PointNet++[15] | 75.4 | 77.9 |
| PointCNN[28] | 75.1 | 78.5 |
| DGCNN[37] | 73.6 | 78.1 |
| GBNet[59] | 77.8 | 80.5 |
| SimpleView[26] | - | 80.5 |
| PRANet[60] | 79.1 | 82.1 |
| Point-BERT[61] | - | 83.1 |
| Point-MAE[62] | - | 85.2 |
| PointMLP[58] | 84.4 | 85.7 |
| PointNeXt[46] | 86.8 | 88.2 |
| PointConT(ours) | 86.0 | 88.0 |
| PointConT(ours)* | 88.5 | 90.3 |
IV-C Ablation Study
We perform ablation studies for the key designs of our methods on the shape classification task. All experiments are conducted under the same training settings.
Component ablation study
Table III reports the classification results of removing each component in PointConT. Comparing Exp.III and Exp.IV, we notice that with the content-based Transformer, the model improves with 0.6% on ModelNet40 and 1.7% on ScanObjectNN. This demonstrates that the content Transformer can enhance the representation power of point clouds. Remarkably, the result of Exp.V drops a lot. In the absence of the average pooling, Exp.V means that the content-based Transformer follows after max-pooling and residual MLP in a serial manner, which indicates that the mix pooling strategy plays an important role in PointConT. Observably, by combining all these components, we obtain the best results on ModelNet40 and ScanObjectNN, which implies the effectiveness of content-based Transformer and Inception feature aggregator in point cloud classification.
Metric: OA(%).
| ID | MP | Res | AP | ConT | ModelNet40 | ScanObjectNN |
| I | 93.2 | 86.5 | ||||
| II | 93.1 | 87.3 | ||||
| III | 92.9 | 86.3 | ||||
| IV | 93.5 | 88.0 | ||||
| V | 92.8 | 87.2 | ||||
| VI | 92.8 | 87.2 | ||||
| VII | 93.0 | 81.0 |
The number of stages
In Table IV, we ablate different number of stages in PointConT. We gradually increase the depth of PointConT on ModelNet40 and ScanObjectNN datasets to test the effectiveness of greater depth. We find that the stage number of 5 is sufficient for full exploitation. A deeper model will bring redundant information and performance decline.
| \addThe number of stages | \addModelNet40 | \addScanObjectNN |
|---|---|---|
| \add3 | \add91.9 | \add84.9 |
| \add4 | \add92.7 | \add86.8 |
| \add5 | \add93.5 | \add88.0 |
| \add6 | \add92.8 | \add86.3 |
Local cluster size
We investigate the setting of the local cluster size and show the result in Table V. The best performance is achieved when the local cluster size is set to 16.
| Local cluster size | ModelNet40 | ScanObjectNN |
|---|---|---|
| \add8 | \add92.9 | \add87.7 |
| 16 | 93.5 | 88.0 |
| 32 | 92.8 | 87.7 |
Similarity metric
We compare two important measures of similarity for clustering: the cosine similarity and the Euclidean distance. The cosine similarity is proportional to the dot product of two vectors. Hence, vectors with a high cosine similarity lied in the close direction from the origin, while the Euclidean distance corresponds to the L2-norm of a difference between vectors. Vectors with a small Euclidean distance are located in the close region of a vector space. The result in Table VI shows that clustering according to Euclidean distance is better than cosine similarity in the classification task.
| Similarity metric | ModelNet40 | ScanObjectNN |
|---|---|---|
| cosine similarity | 92.9 | 87.8 |
| Euclidean distance | 93.5 | 88.0 |
Attention type
Finally, we compare the scalar attention and the vector attention \addintroduced in Sec. III-C The results are shown in Table VII. It is obvious that the attention module is more effective than the no-attention, and vector attention slightly outperforms scalar attention. As described in Point Transformer, vector attention supports adaptive modulation of individual feature channels, rather than just the entire feature vector, which can be beneficial in 3D point cloud analysis.
| Attention type | ModelNet40 | ScanObjectNN |
|---|---|---|
| no attention | 92.9 | 86.3 |
| scalar attention | 92.9 | 87.9 |
| vector attention | 93.5 | 88.0 |
V Conclusion
In this paper, we propose Point Content-based Transformer (PointConT), a simple yet powerful architecture, adopting content-based Transformer, which clusters the sampled points with similar features into the same class and computes the self-attention within each class. Content-based Transformer can establish long-range feature dependencies compared to local spatial attention. Moreover, we design an Inception feature aggregator to combine high-frequency and low-frequency information in a parallel manner. The max-pooling operation aggregates high-frequency signals, while the average pooling operation and Transformer filter low-frequency representations. We hope that this study will provide valuable insights into the point cloud Transformer designs.
It is noticed that the balanced clustering algorithm generates clusters with the same size, which limits generality and flexibility of the proposed PointConT. Advanced clustering approaches and CUDA can be used to implement cluster-wise matrix multiplication in future work.
References
- [1] O. Schumann, J. Lombacher, M. Hahn, C. Wöhler, and J. Dickmann, “Scene understanding with automotive radar,” IEEE Trans. Intell. Veh., vol. 5, no. 2, pp. 188–203, 2020.
- [2] L. Li, M. Yang, L. Guo, C. Wang, and B. Wang, “Hierarchical neighborhood based precise localization for intelligent vehicles in urban environments,” IEEE Trans. Intell. Veh., vol. 1, no. 3, pp. 220–229, 2016.
- [3] X. Sun, S. Shen, H. Cui, L. Hu, and Z. Hu, “Geographic, geometrical and semantic reconstruction of urban scene from high resolution oblique aerial images,” IEEE/CAA J. Autom. Sinica., vol. 6, no. 1, pp. 118–130, 2019.
- [4] Z. Chen, J. Zhang, and D. Tao, “Progressive LiDAR adaptation for road detection,” IEEE/CAA J. Autom. Sinica., vol. 6, no. 3, pp. 693–702, 2019.
- [5] T.-H. Chen and T. S. Chang, “RangeSeg: Range-aware real time segmentation of 3D LiDAR point clouds,” IEEE Trans. Intell. Veh., vol. 7, no. 1, pp. 93–101, 2022.
- [6] C. Zhao, C. Fu, J. M. Dolan, and J. Wang, “L-shape fitting-based vehicle pose estimation and tracking using 3D-LiDAR,” IEEE Trans. Intell. Veh., vol. 6, no. 4, pp. 787–798, 2021.
- [7] A. Vaswani, N. Shazeer, N. Parmar, J. Uszkoreit, L. Jones, A. N. Gomez, L. Kaiser, and I. Polosukhin, “Attention is all you need,” in Proc. Conf. Neural Information Processing Systems (NeurIPS), 2017, pp. 5998–6008.
- [8] H. Zhao, L. Jiang, J. Jia, P. Torr, and V. Koltun, “Point transformer,” in Proc. IEEE Int. Conf. Computer Vision (ICCV), 12 2021, pp. 16 239–16 248.
- [9] M.-H. Guo, J.-X. Cai, Z.-N. Liu, T.-J. Mu, R. R. Martin, and S.-M. Hu, “PCT: Point cloud transformer,” Computational Visual Media, vol. 7, pp. 187–199, 2021.
- [10] X. Pan, Z. Xia, S. Song, L. E. Li, and G. Huang, “3D object detection with Pointformer,” in Proc. IEEE Conf. Computer Vision and Pattern Recognition (CVPR), 2021, pp. 7463–7472.
- [11] C. Park, Y. Jeong, M. Cho, and J. Park, “Fast point transformer,” in Proc. IEEE Conf. Computer Vision and Pattern Recognition (CVPR), 12 2022, pp. 16 949–16 958.
- [12] X. Lai, J. Liu, L. Jiang, L. Wang, H. Zhao, S. Liu, X. Qi, and J. Jia, “Stratified transformer for 3D point cloud segmentation,” in Proc. IEEE Conf. Computer Vision and Pattern Recognition (CVPR), 3 2022, pp. 8500–8509.
- [13] C. Zhang, H. Wan, X. Shen, and Z. Wu, “PVT: Point-voxel transformer for point cloud learning,” arXiv preprint arXiv:2108.06076, 8 2021.
- [14] Z. Yang, L. Jiang, Y. Sun, B. Schiele, and J. Jia, “A unified query-based paradigm for point cloud understanding,” in Proc. IEEE Conf. Computer Vision and Pattern Recognition (CVPR), 2022, pp. 8541–8551.
- [15] C. R. Qi, L. Yi, H. Su, and L. J. Guibas, “PointNet++: Deep hierarchical feature learning on point sets in a metric space,” in Proc. Neural Information Processing Systems (NeurIPS), 6 2017, pp. 5100–5109.
- [16] N. Park and S. Kim, “How do vision transformers work?” in Proc. Int. Conf. Learning Representations (ICLR), 2 2022.
- [17] C. Si, W. Yu, P. Zhou, Y. Zhou, X. Wang, and S. Yan, “Inception transformer,” in Proc. Conf. Neural Information Processing Systems(NeurIPS), 2022.
- [18] C. Szegedy, W. Liu, Y. Jia, P. Sermanet, S. Reed, D. Anguelov, D. Erhan, V. Vanhoucke, and A. Rabinovich, “Going deeper with convolutions,” in Proc. IEEE Conf. Computer Vision and Pattern Recognition (CVPR), 6 2015, pp. 1–9.
- [19] C. Szegedy, S. Ioffe, V. Vanhoucke, and A. A. Alemi, “Inception-v4, Inception-ResNet and the impact of residual connections on learning,” in Proc. AAAI Conf. Artificial Intelligence (AAAI), 2017, pp. 4278–4284.
- [20] Z. Wu, S. Song, A. Khosla, F. Yu, L. Zhang, X. Tang, and J. Xiao, “3D ShapeNets: A deep representation for volumetric shapes,” in Proc. IEEE Conf. Computer Vision and Pattern Recognition (CVPR), 2015, pp. 1912–1920.
- [21] M. A. Uy, Q.-H. Pham, B.-S. Hua, D. T. Nguyen, and S.-K. Yeung, “Revisiting point cloud classification: A new benchmark dataset and classification model on real-world data,” in Proc. IEEE Int. Conf. Computer Vision (ICCV), 2019, pp. 1588–1597.
- [22] Y. Zhou and O. Tuzel, “VoxelNet: End-to-end learning for point cloud based 3D object detection,” in Proc. IEEE Conf. Computer Vision and Pattern Recognition (CVPR), 2018, pp. 4490–4499.
- [23] D. Maturana and S. Scherer, “VoxNet: A 3D convolutional neural network for real-time object recognition,” in Proc. IEEE/RSJ Int. Conf. Intelligent Robots and Systems (IROS), 2015, pp. 922–928.
- [24] G. Riegler, A. O. Ulusoy, and A. Geiger, “OctNet: Learning deep 3d representations at high resolutions,” in Proc. IEEE Conf. Computer Vision and Pattern Recognition (CVPR), 2017, pp. 6620–6629.
- [25] H. Su, S. Maji, E. Kalogerakis, and E. Learned-Miller, “Multi-view convolutional neural networks for 3D shape recognition,” in Proc. IEEE Int. Conf. Computer Vision (ICCV), 2015, pp. 945–953.
- [26] A. Goyal, H. Law, B. Liu, A. Newell, and J. Deng, “Revisiting point cloud shape classification with a simple and effective baseline,” in Proc. Int. Conf. Machine Learning (ICML), 2021, pp. 3809–3820.
- [27] C. R. Qi, H. Su, K. Mo, and L. J. Guibas, “PointNet: Deep learning on point sets for 3D classification and segmentation,” in Proc. IEEE Conf. Computer Vision and Pattern Recognition (CVPR). Institute of Electrical and Electronics Engineers Inc., 7 2017, pp. 652–660.
- [28] Y. Li, R. Bu, M. Sun, W. Wu, X. Di, and B. Chen, “PointCNN: Convolution on x-transformed points,” in Proc. Conf. Neural Information Processing Systems(NeurIPS), S. Bengio, H. Wallach, H. Larochelle, K. Grauman, N. Cesa-Bianchi, and R. Garnett, Eds., vol. 31. Curran Associates, Inc., 2018, pp. 828–838.
- [29] W. Wu, Z. Qi, and L. Fuxin, “PointConv: Deep convolutional networks on 3D point clouds,” in Proc. IEEE Conf. Computer Vision and Pattern Recognition (CVPR), 2019, pp. 9621–9630.
- [30] H. Zhao, L. Jiang, C.-W. Fu, and J. Jia, “PointWeb: Enhancing local neighborhood features for point cloud processing,” in Proc. IEEE Conf. Computer Vision and Pattern Recognition (CVPR), 2019, pp. 5565–5573.
- [31] Y. Liu, B. Fan, S. Xiang, and C. Pan, “Relation-shape convolutional neural network for point cloud analysis,” in Proc. IEEE Conf. Computer Vision and Pattern Recognition (CVPR), 2019, pp. 8895–8904.
- [32] Z. Liu, H. Hu, Y. Cao, Z. Zhang, and X. Tong, “A closer look at local aggregation operators in point cloud analysis,” in Proc. European Conf. Computer Vision (ECCV), 7 2020, pp. 326–342.
- [33] Y. Xu, T. Fan, M. Xu, L. Zeng, and Y. Qiao, “SpiderCNN: Deep learning on point sets with parameterized convolutional filters,” in Proc. European Conf. Computer Vision (ECCV), 2018, pp. 90–105.
- [34] H. Thomas, C. R. Qi, J.-E. Deschaud, B. Marcotegui, F. Goulette, and L. J. Guibas, “KPConv: Flexible and deformable convolution for point clouds,” in Proc. IEEE Int. Conf. Computer Vision (ICCV), 4 2019, pp. 6410–6419.
- [35] M. Xu, R. Ding, H. Zhao, and X. Qi, “PAConv: Position adaptive convolution with dynamic kernel assembling on point clouds,” in Proc. IEEE Conf. Computer Vision and Pattern Recognition (CVPR), 2021, pp. 3172–3181.
- [36] J. Li, B. M. Chen, and G. H. Lee, “SO-Net: Self-organizing network for point cloud analysis,” in Proc. IEEE Conf. Computer Vision and Pattern Recognition (CVPR), June 2018, pp. 9397–9406.
- [37] Y. Wang, Y. Sun, Z. Liu, S. E. Sarma, M. M. Bronstein, and J. M. Solomon, “Dynamic graph CNN for learning on point clouds,” ACM Trans. Graphics, vol. 38, pp. 1–12, 10 2019.
- [38] C. Wang, B. Samari, and K. Siddiqi, “Local spectral graph convolution for point set feature learning,” in Proc. European Conf. Computer Vision (ECCV), 9 2018, pp. 56–71.
- [39] T. Xiang, C. Zhang, Y. Song, J. Yu, and W. Cai, “Walk in the cloud: Learning curves for point clouds shape analysis,” in Proc. IEEE Int. Conf. Computer Vision (ICCV), 5 2021, pp. 895–904.
- [40] M. Xu, J. Zhang, Z. Zhou, M. Xu, X. Qi, and Y. Qiao, “Learning geometry-disentangled representation for complementary understanding of 3D object point cloud,” in Proc. AAAI Conf. Artificial Intelligence (AAAI), 2021, pp. 3056–3064.
- [41] H. Ran, W. Zhuo, J. Liu, and L. Lu, “Learning inner-group relations on point clouds,” in Proc. IEEE Int. Conf. Computer Vision (ICCV), 2021, pp. 15 457–15 467.
- [42] S. Fan, Q. Dong, F. Zhu, Y. Lv, P. Ye, and F.-Y. Wang, “SCF-Net: Learning spatial contextual features for large-scale point cloud segmentation,” in Proc. IEEE Conf. Computer Vision and Pattern Recognition (CVPR), 2021, pp. 14 499–14 508.
- [43] Z. Liu, Y. Lin, Y. Cao, H. Hu, Y. Wei, Z. Zhang, S. Lin, and B. Guo, “Swin Transformer: Hierarchical vision transformer using shifted windows,” in Proc. IEEE Int. Conf. Computer Vision (ICCV), 2021, pp. 10 012–10 022.
- [44] X. Yan, C. Zheng, Z. Li, S. Wang, and S. Cui, “PointASNL: Robust point clouds processing using nonlocal neural networks with adaptive sampling,” in Proc. IEEE Conf. Computer Vision and Pattern Recognition (CVPR), 3 2020, pp. 5588–5597.
- [45] X. Wang, R. Girshick, A. Gupta, and K. He, “Non-local neural networks,” in Proc. IEEE Conf. Computer Vision and Pattern Recognition (CVPR), 2018, pp. 7794–7803.
- [46] G. Qian, Y. Li, H. Peng, J. Mai, H. A. A. K. Hammoud, M. Elhoseiny, and B. Ghanem, “PointNeXt: Revisiting PointNet++ with improved training and scaling strategies,” in Proc. Conf. Neural Information Processing Systems(NeurIPS), 6 2022.
- [47] A. Dosovitskiy, L. Beyer, A. Kolesnikov, D. Weissenborn, X. Zhai, T. Unterthiner, M. Dehghani, M. Minderer, G. Heigold, S. Gelly, J. Uszkoreit, and N. Houlsby, “An image is worth 16x16 words: Transformers for image recognition at scale,” in Proc. Int. Conf. Learning Representations (ICLR), 2021.
- [48] W. Wang, E. Xie, X. Li, D.-P. Fan, K. Song, D. Liang, T. Lu, P. Luo, and L. Shao, “Pyramid vision transformer: A versatile backbone for dense prediction without convolutions,” in Proc. IEEE Int. Conf. Computer Vision (ICCV), 2021, pp. 568–578.
- [49] W. Wang, E. Xie, X. Li, D.-P. Fan, K. Song, D. Liang, T. Lu, P. Luo, and L. Shao, “PVTv2: Improved baselines with pyramid vision transformer,” Computational Visual Media, vol. 8, no. 3, pp. 1–10, 2022.
- [50] K. Han, A. Xiao, E. Wu, J. Guo, C. Xu, and Y. Wang, “Transformer in transformer,” in Proc. Conf. Neural Information Processing Systems (NeurIPS), 2 2021, pp. 15 908–15 919.
- [51] X. Dong, J. Bao, D. Chen, W. Zhang, N. Yu, L. Yuan, D. Chen, and B. Guo, “CSWin transformer: A general vision transformer backbone with cross-shaped windows,” in Proc. IEEE Conf. Computer Vision and Pattern Recognition (CVPR), 2022, pp. 12 124–12 134.
- [52] A. Hassani, S. Walton, J. Li, S. Li, and H. Shi, “Neighborhood attention transformer,” arXiv preprint arXiv:2204.07143, 2022.
- [53] Z. Huang, Y. Ben, G. Luo, P. Cheng, G. Yu, and B. Fu, “Shuffle transformer: Rethinking spatial shuffle for vision transformer,” arXiv preprint arXiv:2106.03650, 2021.
- [54] K. Liu, T. Wu, C. Liu, and G. Guo, “Dynamic group transformer: A general vision transformer backbone with dynamic group attention,” in Proc. Int. Joint Conf. Artificial Intelligence (IJCAI), 3 2022, pp. 1187–1193.
- [55] T. Yu, G. Zhao, P. Li, and Y. Yu, “BOAT: Bilateral local attention vision transformer,” arXiv preprint arXiv:2201.13027, 2022.
- [56] H. Zhao, J. Jia, and V. Koltun, “Exploring self-attention for image recognition,” in Proc. IEEE Conf. Computer Vision and Pattern Recognition (CVPR), 2020, pp. 10 073–10 082.
- [57] D. Lee, J. Lee, J. Lee, H. Lee, M. Lee, S. Woo, and S. Lee, “Regularization strategy for point cloud via rigidly mixed sample,” in Proc. IEEE Conf. Computer Vision and Pattern Recognition (CVPR). IEEE Computer Society, 2 2021, pp. 15 895–15 904.
- [58] X. Ma, C. Qin, H. You, H. Ran, and Y. Fu, “Rethinking network design and local geometry in point cloud: A simple residual MLP framework,” in Proc. Int. Conf. Learning Representations (ICLR), 2 2022.
- [59] S. Qiu, S. Anwar, and N. Barnes, “Geometric back-projection network for point cloud classification,” IEEE Trans. Multimedia, vol. 24, pp. 1943–1955, 2022.
- [60] S. Cheng, X. Chen, X. He, Z. Liu, and X. Bai, “PRA-Net: Point relation-aware network for 3d point cloud analysis,” IEEE Trans. Image Processing, vol. 30, pp. 4436–4448, 2021.
- [61] X. Yu, L. Tang, Y. Rao, T. Huang, J. Zhou, and J. Lu, “Point-BERT: Pre-training 3D point cloud transformers with masked point modeling,” in Proc. IEEE Conf. Computer Vision and Pattern Recognition (CVPR), 11 2022, pp. 19 313–19 322.
- [62] Y. Pang, W. Wang, F. E. H. Tay, W. Liu, Y. Tian, and L. Yuan, “Masked autoencoders for point cloud self-supervised learning,” in Proc. European Conf. Computer Vision (ECCV), 2022.