A Meta-Evaluation of Faithfulness Metrics
for Long-Form Hospital-Course Summarization
Abstract
Long-form clinical summarization of hospital admissions has real-world significance because of its potential to help both clinicians and patients. The faithfulness of summaries is critical to their safe usage in clinical settings. To better understand the limitations of abstractive systems, as well as the suitability of existing evaluation metrics, we benchmark faithfulness metrics against fine-grained human annotations for model-generated summaries of a patient’s Brief Hospital Course. We create a corpus of patient hospital admissions and summaries for a cohort of HIV patients, each with complex medical histories. Annotators are presented with summaries and source notes, and asked to categorize manually highlighted summary elements (clinical entities like conditions and medications as well as actions like "following up") into one of three categories: “Incorrect,” “Missing,” and “Not in Notes.” We meta-evaluate a broad set of proposed faithfulness metrics and, across metrics, explore the importance of domain adaptation (e.g. the impact of in-domain pre-training and metric fine-tuning), the use of source-summary alignments, and the effects of distilling a single metric from an ensemble of pre-existing metrics. Off-the-shelf metrics with no exposure to clinical text correlate well yet overly rely on summary extractiveness. As a practical guide to long-form clinical narrative summarization, we find that most metrics correlate best to human judgments when provided with one summary sentence at a time and a minimal set of relevant source context.
1 Introduction
A significant factor for clinician burnout is the Electronic Health Record (EHR), the information overload it produces, and the documentation burden it requires (Shanafelt et al., 2016; Moy et al., 2021). A study of US physicians revealed that doctors spent 27% of working hours with patients and nearly 50% of their time on EHR and desk work, in addition to 1-2 hours at night, spent mostly on documentation (Sinsky et al., 2016). Clinician burnout can have damaging consequences not only for clinicians (National Academies of Sciences, 2019), due to, among other factors, increased rates of depression (Maslach and Leiter, 2016) and interrupted work-life balance (Kroth et al., 2019)), but also patients, due to increased risk of clinical errors (Salvagioni et al., 2017; Panagioti et al., 2018).
In the inpatient setting, the Discharge Summary (Kind and Smith, 2008) is a particularly tedious and time-consuming note to write (Chan et al., 2014). Yet, it is a critical piece of documentation. Written at the end of a patient’s hospital admission, the Discharge Summary ensures continuity of care (Kripalani et al., 2007; O’Leary et al., 2009). Its timely availability has been shown to have a direct impact on patient quality of care, including the rate of hospital readmission (Van Walraven et al., 2002). A key mandatory section of the Discharge Summary is the “Brief Hospital Course,” which, in a paragraph of variable-length, recounts in a narrative form the events occurred during the patient stay, and why they happened. Composing the hospital-course summary is a cognitively difficult task for clinicians. They must review a high number of clinical notes and reports entered during the patient stay and synthesize them into a long paragraph. It is even more challenging when an admission is complex, which is often the case for patients with comorbidities or chronic conditions.
Automated summarization techniques can support clinicians in this difficult task. An automatically generated hospital course summary can act as a first draft for a clinician and ensure that the critical elements of the patient stay are not missed in the potentially overwhelmingly large amount of notes produced during the patient stay. Generating a high-quality hospital course narrative is difficult and ensuring its faithfulness is paramount: this requires synthesizing and fusing information from diverse note types, while remaining consistent: adhering to temporal constraints, providing sufficient context to avoid misleading patient characterizations, and even resolving source note errors.
Long-form abstractive summarization is an active topic of research in the general domain (Guo et al., 2021; Phang et al., 2022), yet most faithfulness metrics have been developed on shorter datasets Kryscinski et al. (2020a); Durmus et al. (2020); Wang et al. (2020); Deng et al. (2021a); Yuan et al. (2021); Laban et al. (2022); Ribeiro et al. (2022). In the clinical domain, there are additional open questions, including the performance of modern summarization models and whether existing evaluation metrics are truly reflective of clinical quality. In this paper, we examine the performance of an established long-form abstractive summarization model on the task of hospital course summarization, as well as the quality of existing faithfulness metrics when compared to clinicians’ judgments.
To this end, we fine-tune a long-range transformer (Longformer Encoder-Decoder (LED) (Beltagy et al., 2020) on a large dataset of Hospital Course summaries, pertaining to all in-patient hospital admissions at a large healthcare institution (Columbia University Irving Medical Center in New York City) from 2010-2014 (Adams et al., 2021). On a held-out set of admissions for patients from the HIV clinic (Levy-Fix et al., 2020), we rely on expert (clinicians) to collect fine-grained faithfulness annotations of LED summaries based on the clinical notes written before discharge.
We then meta-evaluate a large set of existing summarization evaluation metrics (including BARTScore (Yuan et al., 2021), BERTScore (Zhang et al., 2019), Entailment-based CTC (Deng et al., 2021b) and SummaC (Laban et al., 2022)) by measuring their correlation to human annotations. Since these metrics were mostly developed on single document general-domain corpora, we identify three key dimensions pertinent to adaptation to long-form clinical summarization: domain adapation (pre-training and metric fine-tuning), length of inputs, and length of outputs. For length-based dimensions, we explore the impact of source-summary alignments and summary granularity (sentence-level versus summary-level). We find that metrics tend to correlate best with human annotations when provided summary sentences one at a time, and when only the most relevant content (high precision source-summary alignments) is provided. We see limited benefits from domain adaptation with respect to simple correlation analysis, yet we attribute much of this to the abstractiveness of the references on which metrics are tuned. When filtering for abstractive subsets of the annotation set, domain adaptation starts to outperform off-the-shelf variants. In-domain adaptation of metrics will likely be critical given the observed abstractiveness of summaries from LLMs (Goyal et al., 2022).
Rather than adapt metrics to clinical text by training on references, we find it advantageous to learn directly from system summaries. We use an ensemble of our baseline metrics to produce a pseudo faithfulness score on system summaries and distill a metric from these noisy ground-truth labels. Our distilled metric has a higher correlation than baseline metrics to expert annotation labels.
Our contributions are: (1) We collect fine-grained faithfulness annotations for the the task of hospital-course summarization, which contains substantially longer inputs than previous clinical annotation efforts; (2) We benchmark existing faithfulness metrics against these annotations, as well as explore practical considerations of adapting general domain metrics to long-form clinical narratives; (3) We analyze the confounding role of extractiveness and show how a simple statistic (unigram coverage) can be complementary to other metrics, including a metric distilled from an ensemble of other metrics.
2 Related Work
Faithfulness Metrics.
Metrics to assess faithfulness can be roughly distilled into the following categories: QA-based (Wang et al., 2020; Fabbri et al., 2022; Durmus et al., 2020), entailment based metrics from NLI (Falke et al., 2019) or synthetic data (Kryscinski et al., 2020b; Deng et al., 2021a; Utama et al., 2022), fact-based, reference-free overlap (Goodrich et al., 2019), and those which directly learn from human judgments (Ribeiro et al., 2022) (similar to BLEURT (Sellam et al., 2020) approach for machine translation). Most of these metrics have been developed on single document news summarization datasets, such as CNN / DailyMail (Hermann et al., 2015; See et al., 2017) and Xsum (Narayan et al., 2018). Faithfulness metrics proposed for clinical summary evaluation have typically come from the overlap category and focus on concept alignment between summaries and the source input (Zhang et al., 2020; Tang et al., 2022).
Human Faithfulness Evaluation.
Assessing faithfulness is a challenging task to automate with metrics (Bhandari et al., 2020), which underscores the importance of collecting high-quality human evaluation annotations (Lux et al., 2020; Wang et al., 2020; Kryscinski et al., 2020b; Maynez et al., 2020; Huang et al., 2020; Fabbri et al., 2021b; Pagnoni et al., 2021; Goyal and Durrett, 2021; Cao and Wang, 2021a; Cao et al., 2022). Additionally, given the relatively small size of each separate evaluation, it can be useful for training and/or meta-evaluation to aggregate them into larger benchmark datasets (Fabbri et al., 2021b; Laban et al., 2022).
Based on low inter-annotator agreements for summary-level faithfulness annotations (Lebanoff et al., 2019a; Kryscinski et al., 2020a), recent work has focused more on fine-grained annotations at the entity (Cao and Wang, 2021b; Cao et al., 2022), sentence (Pagnoni et al., 2021), and span level (Maynez et al., 2020). These studies tend to have higher annotator agreement and allow for a better understanding of the typology of error distributions across datasets and systems. Sophisticated error taxonomies are generally formulated by examining system outputs (e.g., card-sorting exercises (Lux et al., 2020)) and tend to demarcate error types on two fronts: where the error is located (broken down by syntactic roles) and where it likely comes from (intrinsic or extrinsic). Zhang et al. (2022) challenges the notion that extractive summaries are consistent by analyzing inter-sentence discourse.
Evaluation of Clinical Note Summarization.
Moen et al. (2014) evaluate extractively generated Discharge Summaries based on content criteria guidelines and benchmark ROUGE against these coverage-focused annotations. Much of the recent work on human evaluation of clinical summarization has focused on self-contained, single-document tasks: including radiology report summarization (MacAvaney et al., 2019; Zhang et al., 2020) and echocardiogram conclusions (Tang et al., 2022). For these shorter tasks, summary-level assessments are collected, in the form of pairwise ranking (Tang et al., 2022) or point-wise assessments (MacAvaney et al., 2019) on a Likert Scale. Moramarco et al. (2021) examine brief descriptions of SOAP notes for mock patient encounters (MTSamples111https://mtsamples.com, and compare fact-based overlap between reference and system-generated summaries.
Most closely related to our work, Moramarco et al. (2022) perform a human evaluation on a more self-contained, conditional clinical note generation task: generating a SOAP note from consultation transcripts. They rely on a dataset of mock patient-doctor conversations and corresponding SOAP notes from Korfiatis et al. (2022). Annotators were asked to post-edit notes to correct errors, as well as manually highlight spans with incorrect or omitted information. Automatic metrics were then benchmarked against post-editing time, as well as the number of incorrect and omitted spans. Our work differs as we define a typology of errors with more categories, consider more diverse faithfulness metrics, and, because our data includes much longer clinical narratives, explore the impact of using source-summary alignments and different summary granularities (sentence-level versus full).
| Split | # | Source | Reference | ||
| Notes | Tokens | Sents | Tokens | ||
| Train - Full | 82k | 41 | 18.4k | 11.6 | 207 |
| Train - HIV | 2.7k | 40 | 19.1k | 12.5 | 243 |
| Eval - HIV | 29 | 24 | 11.7k | 12.1 | 211 |
3 Data
The data is comprised of clinical notes from the Electronic Health Record (EHR) for in-patient admissions between 2010 and 2014 at a large metropolitan hospital (Adams et al., 2021).
Training Data.
We show training data statistics in the first row of Table 1. We delineate between the full training set, which is used to train the summarization models and the subset of the training set which is used for fine-tuning evaluation metrics in-domain. The subset filters for HIV patients which mirrors the filtering done to produce the human evaluation cohort (discussed directly below).
Human Evaluation Cohort.
The training set comprises both HIV and non-HIV patients while the human annotation test set is solely HIV. We choose HIV patients as they typically have multiple co-morbidities and, concomitantly, complex hospital courses (Gallant et al., 2017). We first filter the test set for patients admitted to the HIV clinic (10k to 339 admissions) (Levy-Fix et al., 2020). From this HIV-specific cohort, we remove outliers: the top and bottom ten percent by number of source notes, and do the same for the summary reference length. The admissions with the fewest notes tend to cover cases in which notes are missing and, as such, are difficult to annotate. Removing the longest examples (source notes and reference length) filters out a long tail of examples for which obtaining human annotations would be too time consuming. After filtering, we end up with 212 admissions. From this set, we bin the summaries by extractiveness (density) into deciles, similarly to Bhandari et al. (2020), and sample an equal number from each decile to ensure diversity in summaries for annotation. We sample from each bin and end up with 29 summaries for annotation (245 sentences), based on a total of 703 source notes.
Generating Summaries for Annotation.
At a high-level, we fine-tune a Transformer Encoder-Decoder with sparse attention (Longformer Encoder-Decoder (LED) (Beltagy et al., 2020)). The LED handles inputs up to 16,384 tokens. To fit all inputs (the average input length from Table 1 is ), we train a simple bi-LSTM model to rank each sections and, during inference, retain the top 100 sections. Filtering and fine-tuning details and hyper-parameters are provided in Appendix A.
4 Collecting Annotations
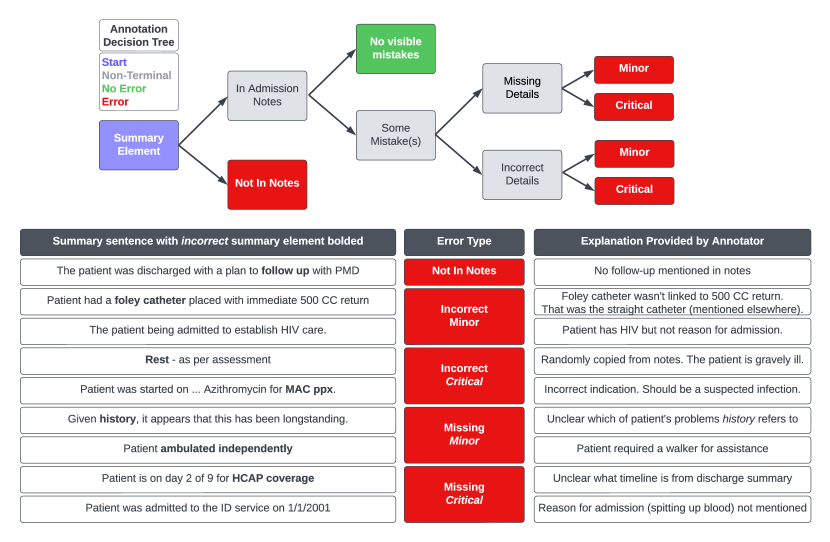
At a high-level, the annotation task consisted of assigning an error category (or No Error) to each Summary Element (defined below) in a system output, based solely on clinical knowledge and all patient’s clinical notes from the hospital admission.
Summary Elements.
As in other faithfulness work (Goyal and Durrett, 2021), we decided to collect fine-grained annotations and experimented with different granularities while piloting the study. We found that entities (used in Cao et al. (2022)) were too granular, noisy, and incomplete on clinical notes. Syntactic parses were unreliable on our text as well. On the other hand, sentence-level annotation (Wang et al., 2020; Durmus et al., 2020; Pagnoni et al., 2021) was insufficiently fine-grained given the length and information density of many sentences. As such, the authors of the paper manually extracted Summary Elements (SE), which consist of standard medical concepts and actions, as well as compound concepts. Standard medical concepts included Disorders, Medications, Procedures, and Treatments, while actions encapsulate phrases such as “discharged to home” and “plans to follow up”. When sensible, we merged compound entities into a single SE: “alkanization of urine”.
Error Categories.
For each SE, annotators were asked to identify and categorize errors. As represented as a decision tree in Figure 1, annotators were first asked to confirm whether or not the summary element is “hallucinated”: Not in Notes. If the SE can be found in the notes, they either deem it correct: No visible mistakes or denote an inconsistency in its usage. For these intrinsic-focused errors, we delineate between Incorrect Details and Missing Details. A SE has Incorrect Details if it can be found in the source notes yet contains information that does not reflect what is written in the notes. This category encapsulates numerical errors (dosages, dates), mis-representations of symptoms (“afebrile” is incorrect if patient had a fever), fusion errors (an incorrect indication for a drug), among others. An SE has a Missing Details error if the summary omits important information about the SE, which could lead to misleading conclusions being formed about the patient’s true hospital course. Missing Details is grounded on a specific SE and thus less open-ended than previously defined “omission” errors (Huang et al., 2020; Moramarco et al., 2022).
Severity of Errors.
For Incorrect and Missing, as in Moramarco et al. (2022), we ask annotators to distinguish between Minor and Critical errors. We provide annotators with examples of both kinds of errors and define Critical as a mistake which could negatively impact the patient’s present and future treatment. Minor is an exclusionary category defined as “Not Critical”.
Annotators.
We recruited clinical practitioners, with IRB-approved access to the patient data, to annotate the summaries in Eval - HIV. Each annotator was compensated at a rate of $30 / hour. of the annotators self-identify as female, with the other two as male. self-identify as “White”, and each as “Black or African” and “Other”. annotators are attending physicians, are in medical residency, and is a fellow. They have a combined 25 years of medical practice. Each expert annotated summaries for a minimum of one hour at the same computer and location with the guidance of the authors of the paper, who were available for technical guidance and clarification questions regarding the annotation protocol. Collectively, the task was carried out over hours across 4 days.
Description of Interface.
We develop a custom annotation interface within Prodigy (Prodigy, ). The interface presented each annotator with one summary at a time. For viewing ease, summaries were split such that one sentence was shown per line. Summary Elements (SE) were highlighted and annotation of non-SE spans prohibited. For each SE, annotators would select the appropriate erorr category (or No Error) and then either double click or highlight the SE span. On a separate browser page, we displayed the source notes for the patient visit, which were hosted locally on a custom, light-weight app. The left-hand side of the full-text notes display showed section headers and free text for each note. Notes were sorted by date and annotators could search for a note by its title on a drop-down menu. Section headers were indexed and searchable to allow for efficient navigation of long notes. On the right hand side of the webpage, we enabled free-text search across notes. Each note was pre-indexed such that all mentions of matching search terms across notes could be quickly surfaced. We extracted all concepts with CLAMP NLP, highlighted them in the interface, and allowed for annotators to trigger a concept-based search query by double-clicking on the concept span in the note.
5 Error Analysis
| Per Summary | Per Sent | % of All SE | |
| All Summary Elements (SE) | 27.10 | 3.21 | - |
| Incorrect SE | 2.86 | 0.34 | 11% |
| Missing SE | 0.93 | 0.11 | 3% |
| Not In Notes SE | 1.03 | 0.12 | 4% |
| Any Mistake SE | 4.83 | 0.57 | 18% |

Distribution of Errors.
Table 2 shows the number of SE per summary and per sentence, as well as the breakdown of SE into each error category. of SEs are marked as having Any mistake, of which the predominant category is Incorrect ( versus and for Missing and Not in Notes). In Table 2, Minor and Critical are lumped together and contribute equally to the counts.
Qualitative Analysis.
As shown in Figure 1, incorrect errors often result from improper fusion of concepts: (“foley catheter” with “500 CC return”, “Azithromycin” with “MAC ppx”, and “admitted” with “HIV care”). Incorrect errors can also be perfectly extractive. “Rest - as per assessment” is copied verbatim from a previous note, yet is incorrect because, at the time of discharge, the patient is actually gravely ill, which contradicts the recommendation. Missing Errors are also quite extractive (see analysis in §7.5) and tend to occur from the reverse problem: insufficient fusion. The model fails to fuse related concepts when they appear in different contexts. Specifically, the model fails to make the following links: use of a “walker” is relevant to his “ambulat[ion]”, that the “HCAP coverage” duration should be related to the note timestamp, and that “admitted to ID service” should be linked to the reason for admission—“spitting up blood”.
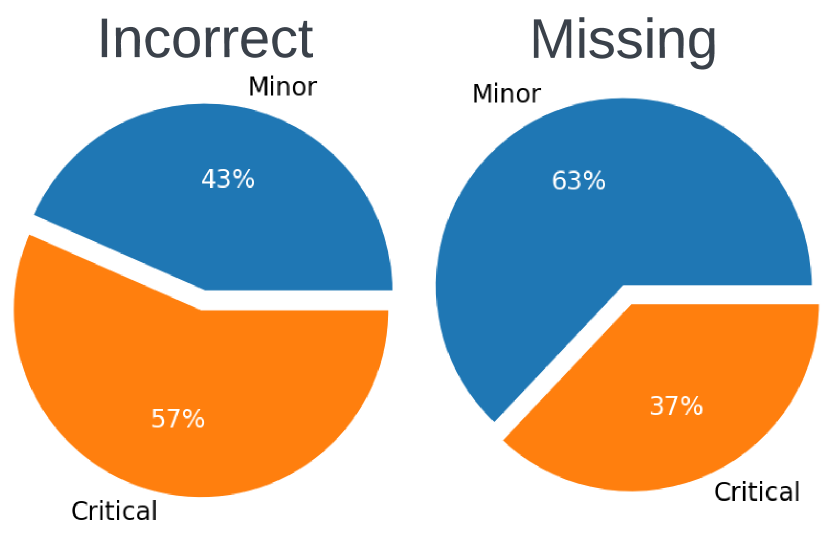
Severity of Errors.
Figure 2 breaks down error severity for Incorrect and Missing. The majority of Incorrect errors were marked as Critical (), whereas a minority for Missing (). As implicated by Figure 1, the difference between Critical and Minor errors is very subtle. Typically, the justifications for each, as provided by the annotators, were highly specific to the patient in question. This is interesting as it represents a non-standard definition of faithfulness, one which is more tightly connected to salience, and is grounded on a more holistic view of the patient journey.
Impact of Position in Summary.
Similarly to degeneration in unconditional generation tasks (Holtzman et al., 2019). we can measure whether or not quality (as measured by faithfulness) declines at different summary positions. Figure 3 plots the percentage of SE marked with any error by the sentence position in the summary. A clear trend emerges of an increasing error rate as summaries grow longer. This may point to a task-agnostic factor: scaling limitations from full self-attention within the decoder, or task-specific factors: a shift in topics. Figure 3 shows the overall number of SEs decreasing by sentence position. From qualitative analysis, we, in fact, observe a topic shift: from dense history of present illness history recounting (diagnosis-heavy) to concise descriptions of procedures and, finally, any post-discharge instructions.
6 Evaluation Metrics
6.1 Task-Specific Concerns.
Broadly speaking, we identify three high-level challenges for evaluating long-form clinical summaries, which are distinct from those faced when evaluating single-document new summaries: (1) Domain Adaptation, (1) Long Outputs, (3) Long Inputs.
Domain Adaptation.
The first challenge relates to adapting metrics, typically trained and used on general domain data, to clinical text. We cannot adapt all metrics, especially metrics (Sellam et al., 2020; Ribeiro et al., 2022) which directly learn from news summary annotation benchmarks (Wang et al., 2020; Pagnoni et al., 2021; Fabbri et al., 2021a; Laban et al., 2022). Domain-specific pre-training can improve performance of downstream models on many tasks (Gururangan et al., 2020), including clinical (Alsentzer et al., 2019a), yet the impact of in-domain exposure is less studied when meta-evaluating faithfulness metrics. As such, we implement three versions of each metric with increasing levels of domain adaptation: Off-The-Shelf (fully out-of-domain), Tuned In-Domain (pre-trained out-of-domain, tuned-in-domain), and Double In-Domain (pre-trained and tuned in-domain). For in-domain pre-training, we rely on existing models pre-trained on clinical or biomedical corpora, specific to each dataset. For in-domain metric tuning, we use the Train - HIV data from Table 1. Training details are provided as part of each metric description in §6.2.
Output Lengths.
Given previous work (Adams et al., 2021) detailing the lack of inter-sentence discourse markers in clinical narratives, we evaluate each sentence independently. Performing meta-evaluation of metrics at the sentence-level also increases the level of support ( vs ) when computing instance-level correlations. This choice also enables us to explore the impact of sentence-level partitioning of summaries on metric performance.
Input Lengths.
Our inputs contain 30,000 tokens. Conditioning evaluation on the entire source is computationally expensive and often undesirable (e.g., entailment models are trained on short premises). Modern faithfulness metrics tend to struggle with long inputs (Honovich et al., 2022), likely due to the fact that only a handful of sentences from the source text are relevant to a given summary sentence (Lebanoff et al., 2019a).
Yet, computing source-summary alignments (Ernst et al., 2021) is particularly challenging for clinical text because 1) massive redundancy from copy-and-paste (Hirschtick, 2006); 2) lexical variation in discussing semantically identical concepts (abbreviations, acronyms, etc.) (Adams et al., 2020); 3) the need for complete context when assessing missing or misleading information. To explain 3), if a summary includes an outdated lab measurement, simply returning that single lab value as the alignment would provide a false sense of clinical correctness. The full chronology is needed.
Given this complexity, we separately evaluate the impact of alignment granularity (2-3 sentences to the whole input) on metric tuning and inference.
| Alignment Method | Number of Source Sents |
| ROUGE-Gain | 1.1 |
| BS-Gain | 1.8 |
| ROUGE-TopK | 5.0 |
| BERT-TopK | 5.0 |
| Top Section | 13.2 |
| Entity Chain | 15.3 |
| Full | 921.2* |
Each method aligns a summary sentence to a subset of sentences from the source. Duplicate source sentences are removed. Table 3 shows the average number of aligned sentences by method.
Alignments - Granular.
ROUGE-TopK takes the highest ROUGE-aligned sentences (average of R1, R2, RL F-1), while ROUGE-Gain follows Lebanoff et al. (2019b) and maximizes the relative ROUGE gain of adding each additional sentence to the current set of aligned sentences. To account for lexical variation and noise, we also build alignments with BERTScore (BS) from in-domain weights (see description of BERTScore model used in §6.2). BS-TopK selects the source sentences with the highest F-1 BS vis-a-vis the summary sentence. BS-Gain follows the approach in (Adams et al., 2022b) in which a coverage weight is assigned to each token in the summary sentence and updated based on the maximal alignment so far.
Alignments - Entity-Chain.
Given a summary sentence, we define an alignment method based on Entity-Chains (Barzilay and Elhadad, 1997; Narayan et al., 2021) as the set of sentences in the source with at least one medical concept (a CUI from the Unified Medical Language System (UMLS) aligned to any of the CUIs in the summary sentence. Appendix B details how entities are extracted, linked to the UMLS, and aligned. Alignment is based on manually annotating pairs of mentions and learning a light-weight classifier on features which include mention similarity (using contextualized from SapBERT (Liu et al., 2021), TF-IDF overlap, and Levenshtein distance), CUI similarity (using a custom CUI2Vec model trained on MIMIC-III on our CUI vocabulary), and other UMLS-based features (TUI and semantic group).
Alignments - Section-Level.
To avoid fragmented alignments pulled from different notes, we also consider the Top-1 most aligned section as its own alignment. In particular, we select the section with the highest average ROUGE-{1, 2, L} overlap vis-a-vis each sentence in the summary.
Alignments - Full Input.
The conventional approach is to pass the whole source as input. Most of our inputs surpass both short and long transformer token limits. As needed for each metric, then, for Full Input alignments for each summary sentence, we select the source sentences with the highest ROUGE-{1, 2} overlap vis-a-vis summary sentence until a target token limit is reached.
6.2 Metrics
We describe each metric at a high-level and then detail domain adaptation. In Appendix D, we introduce 2 additional metrics as part of the meta-evaluation: ReDRESS and FactScore, for which we only implement in-domain variants.
BERTScore.
High-Level. BERTScore (Zhang et al., 2019) computes a greedy soft-alignment, based on BERT hidden state similarities, between a reference and a hypothesis text. As in Pagnoni et al. (2021), we compute a reference-free BERTScore: in our case, the hypothesis is a summary sentence and the reference its aligned source sentences. We only report BERTScore-Precision because it has the highest correlation with human judgment on our data. Domain-Adaptation. For Off-The-Shelf, we use RoBERTA-Large. There is no task-specific training for BERTScore so we report a single In-Domain variant. Specifically, we use a RoBERTA-Large model pre-trained from scratch with a custom BPE tokenizer on biomedical (PubMed and PubMed Central (PMC)), as well as clinical text (MIMIC-III) (Lewis et al., 2020a)222The model weights (RoBERTa-large-PM-M3-Voc-large) can be downloaded from GitHub and used with HuggingFace. For all variants, given that alignments can exceed the RoBERTA context window of 512, we separately encode sentences from the same section and concatenate them (similarly to the paragraph chunking method from Liu and Lapata (2019)).
BARTScore.
High-Level. BARTScore (Yuan et al., 2021) computes the length-normalized log likelihood of a summary conditioned on the input. We measure BARTScore for each sentence based on its aligned source inputs. Domain Adaptation. For Off-The-Shelf, we use a BART-Large model fine-tuned on CNN/DailyMail news summaries333facebook/bart-large-cnn from HuggingFace.. For Tuned In-Domain and Double In-Domain, we fine-tune BART-based models on Train - HIV corpus. The targets are single summary sentences and the inputs are their aligned source sentences. We fine-tune a separate model for each alignment method from §6.1. For Double In-Domain, we initialize fine-tuning on Train - HIV with the BART-based ReDRESS model from Adams et al. (2022b) 444ReDRESS is pre-trained on a novel entity-based de-noising objective on unlabeled clinical text (MIMIC-III discharge summaries). The model weights are accessible on HuggingFace as “griffin/redress-clinical-hallucination-generator”.. For Tuned In-Domain, we initialize fine-tuning from BART-Base (to match ReDRESS). Using the Trainer from the Transformers library (Wolf et al., 2020), we fine-tune each model in batches of for steps with a learning rate of ( warmup steps followed by linear decay). We use a label smoothing factor of .
CTC.
High-Level. Compression, Transduction, Creation (CTC) (Deng et al., 2021b) defines a unified series of weakly supervised methods to evaluate system outputs on several NLG tasks. For summary faithfulness, the CTC Score represents the average number of tokens predicted as “fake” given the source. To train the CTC model, spans from reference summaries are masked-and-filled with a separate language model: the generator. Domain Adaptation. For Off-The-Shelf, we use D-cnndm, a RoBERTA-Large model fine-tuned for CTC consistency discrimination on the CNN/Dailymail dataset. For domain adapation, we corrupt summary sentences from Train - HIV and learn to discriminate based on source alignments. As in BARTScore, we fine-tune a separate discriminator for each alignment method from §6.2. To generate fake tokens (the generator), we first train a mask-infiller (BART-base) on all discharge summaries in MIMIC-III. We use the same span mask procedure from CTC (based on a dependency parse) to align the training objective with its usage. We discuss generator training details and example outputs in Appendix C. For Double In-Domain, we initialize the CTC Discriminator from the same biomedical RoBERTA model used for the In-Domain BERTScore (Lewis et al., 2020a). For Tuned In-Domain, we initialize tuning from RoBERTA-Large (to match the initialization for Off-The-Shelf). We use the CTC codebase555https://github.com/tanyuqian/ctc-gen-eval to train the discriminator with two modifications: we do not augment the data with paraphrasing666Existing paraphrase tools perform very poorly on clinical text and introduce many factual inconsistencies., and we train for 5 epochs (not 1).
Entailment.
High-Level. Faithful summaries should be entailed by the source text. Domain Adaptation. For Off-The-Shelf, we use a state-of-the-art entailment consistency model: SummaC (Laban et al., 2022). SummaC computes a faithfulness score for a summary sentence by computing separate entailment scores for each source-summary pair and then aggregating (either with a greedy argmax–as in BERTScore–in a zero-shot setting, or with a learned 1D convolution777Falke et al. (2019) demonstrated that off the shelf NLI (Bowman et al., 2015) models, trained on sentence-to-sentence data, do not transfer well to summary faithfulness task (document-sentence(s)). We use the latter: SummaC-Conv, which is tuned using news summary human annotations. For In-Domain, we do not have enough annotations on which to tune a SummaC-Conv model. Rather, we rely on the zero-shot setting, in which an off-the-shelf in-domain entailment model is used to score summary sentences. Specifically, we use the SciFIVE Model888The weights can be downloaded from the HuggingFace Transformers library via the following model card: razent/SciFive-large-Pubmed_PMC-MedNLI. with SOTA performance on the MedNLI dataset (Romanov and Shivade, 2018)–clinician-annotated entailment corpus whose premises come from MIMIC-III. SciFive is provided the summary sentence and its aligned source text as input, and generates a label: {contradiction, neutral, entailment}. For meta-evaluation, we convert each class label to an integer in the set .
7 Meta-Evaluation of Metrics
Separately for each sentence of each summary in the human annotation set (), we compute a human error rate HErr: defined as the fraction of summary elements (SE) in the sentence marked as either Not In Notes, Incorrect, or Missing. Unless explicitly stated, we do not distinguish between error type or severity (Minor, Critical) for the meta-evaluation. For the following analysis, we report the instance-level Pearson (Cohen et al., 2009) correlation coefficient between HErr and metric scores (two length vectors).
| Method | # Sent | Correlations | |||
| Avg | Max | Min | Std | ||
| ROUGE-Gain | 1.1 | .46 | .52 | 0.31 | .06 |
| BS-Gain | 1.8 | .42 | .50 | .07 | .07 |
| ROUGE-TopK | 5.0 | .43 | .52 | .20 | .07 |
| BERT-TopK | 5.0 | .41 | .53 | .16 | .09 |
| Top Section | 13.2 | .40 | .54 | .14 | .10 |
| Entity Chain | 15.3 | .36 | .48 | .04 | .10 |
| Full | 921.2* | .09 | .46 | -.17 | .16 |
7.1 Finding the Optimal Source Granularity
Research Question.
How much of the source input (averaging tokens across notes) is necessary to achieve high correlation with humans?
Experimental Setup.
To answer this question, we vary the number of source sentences provided to every metric and variant from §6.2 and analyze its impact on performance (instance-level Pearson correlation with the Human Error Rate, HErr).
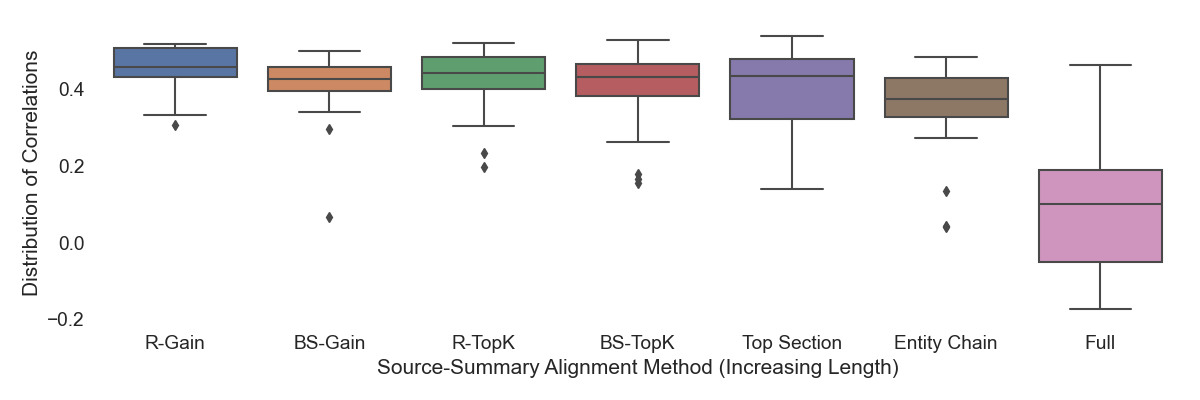
Findings.
Figure 4 and Table 3 reveal that, on average, metrics have higher correlations to human judgment when the inputs to the metric are shorter (with ROUGE-Gain being the shortest and having highest average Pearson Correlation of ). The standard deviation of average instance-level correlations grows monotonically as alignments grow longer. Also, using the entire source is the most volatile (minimum of ) and the maximum correlation is lower than the maximum correlation using a source-alignment (Top Section). These findings strongly suggest that scoring summaries based on the full source input is detrimental.
| Usage Alignment | ||||||||
| R-Gain | BS-Gain | R-TopK | BS-TopK | Top Section | Entity Chain | Tune Avg | ||
| Tune Alignment | R-Gain | .467 | .449 | .458 | .449 | .397 | .344 | .427 |
| BS-Gain | .458 | .387 | .427 | .382 | .396 | .351 | .400 | |
| R-TopK | .449 | .440 | .442 | .446 | .408 | .387 | .428 | |
| BS-TopK | .460 | .411 | .435 | .407 | .416 | .387 | .419 | |
| Top Section | .469 | .440 | .463 | .446 | .427 | .379 | .437 | |
| Entity Chain | .452 | .450 | .469 | .438 | .407 | .379 | .432 | |
| Usage Avg | .459 | .429 | .449 | .428 | .408 | .371 | ||
7.2 Optimal Alignments for Metric Tuning
Research Question.
§7.1 reveals that shorter source alignments are preferable when using metrics. Is the story the same when tuning metrics? And should the alignment method used for metric tuning match the method used during inference?
Experimental Setup.
To answer this question, we breakdown metric performance (correlation to HErr) by the alignment method used for metric tuning and, separately, for usage. We consider 4 metrics (Tuned In-Domain and Double In-Domain variants for BARTScore and CTC). Each training instance is a summary sentence from Train - HIV and its aligned source context.
Findings.
Each cell in Table 5999Full is not shown because it was not implemented for CTC due to token context restrictions for RoBERTA of 512. represents an average of instance-level correlations to HErr across 4 metric variants (2 for BARTScore, 2 for CTC). Looking at the row-wise maximum values (cells), we notice that involve using the shortest alignment (R-Gain) for metric usage. This aligns with our analysis above in §7.1. Yet, the optimal alignment method for metric tuning is much less clear. If anything, we notice that of the column-wise maximum values (cells) come from models tuned models from one of the two longest alignment methods (Top Section and Entity Chain). Additionally, on average, the diagonal values (shaded in gray) do not outperform the non-shaded regions. Taken together, at a high-level, this analysis suggests that additional context may be helpful when learning metrics (to make the task more difficult), yet, when using a metric, providing shorter, higher precision contexts are preferable.
7.3 Effect of Summary Granularity
Research Question.
For our meta-analysis, we measure faithfulness at the summary sentence level. As such, we have been scoring summaries sentence-by-sentence (Sentence-Level). Yet, for some metrics with localized predictions, alternatively, we can process the entire summary and then post-hoc extract sentence-level scores (Summary-Level). Which method leads to higher metric correlations?
We separately consider BARTScore and BERTScore to answer this research question.
BARTScore Experimental Setup.
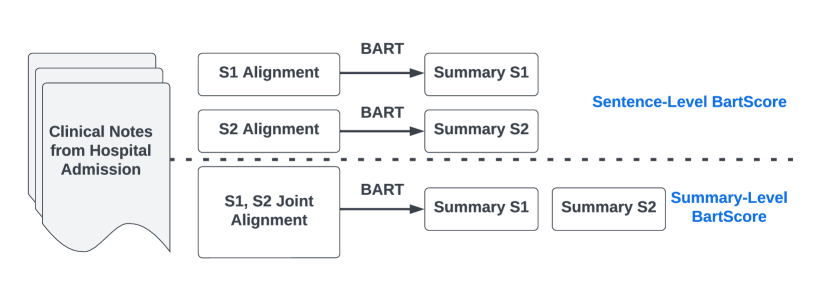
Sentence-Level is the default approach for all metrics, as detailed in §6.2. Summary-Level BARTScore involves processing the full summary conditioned on aligned source sentences. For this setting, we simply treat the summary as a “single sentence” and align it to the source sentences. Yet, these source alignments often exceed the BART context window ( tokens). To handle longer inputs, we replace BART with an LED model (which scales up BART with sparse attention). We fine-tune for 10,000 steps on HIV - Train) (as in Sentence-Level) using the same LED hyper-parameters from Appendix A. For both sets of experiments, we consider two alignment methods: ROUGE-Gain and ROUGE-TopK. for Sentence-Level and for aligning to full summaries, . During inference, we pass the same alignment granularity on which the model was fine-tuned. Summary-Level and Sentence-Level are contrasted in Figure 5.
| Summary Granularity | Source Alignment | Pearson Correlation |
| Summary Level | ROUGE-Gain | .438 |
| ROUGE-TopK | .424 | |
| Sentence Level | ROUGE-Gain | .516 |
| ROUGE-TopK | .481 |
BARTScore Findings.
Table 6 reveals that Sentence-Level BARTScore (with separate alignments computed per sentence) is preferable to processing Summary-Level ( / versus ). This relates to the previous finding in §7.1. In both cases, tighter alignment between the inputs and outputs passed to a metric is preferable.
| Summary Granularity | Source Alignment | Pearson Correlation |
| Summary Level | Full | .357 |
| Sentence Level | Full | .464 |
BERTScore Experimental Setup.
We evaluate In-Domain BERTScore variants (Lewis et al., 2020a) which use the entire source (Full alignment method). Specifically, we compare our baseline BERTScore approach (Sentence-Level), which encodes each summary sentence independently, with a Summary-Level variant, which involves encoding the entire summary before computing a separate BERTScore for each sentence101010Since we report BERTScore precision, we can compute the full similarity matrix before segmenting by sentence.. The latter is typically how BERTScore is used.
BERTScore Findings.
Table 7 shows that encoding sentences independently (Sentence-Level) leads to higher correlation with human assessments ( versus ). Given how choppy clinical notes are, including neighboring sentences can add substantial noise to contextual embeddings of summary sentences.
7.4 Curious Case of In-Domain Training
Research Question.
There is a wealth of evidence to demonstrate the beneficial impact of in-domain pre-training on clinical (Alsentzer et al., 2019b; Lehman et al., 2023) and biomedical (Gu et al., 2021) downstream tasks. Yet, to our knowledge, no previous work examines the benefits of in-domain pre-training on clinical evaluation metrics. Is domain adaptation: at the pre-training level, and at the task-specific fine-tuning level, necessary for developing clinical faithfulness metrics?
Experimental Setup.
We breakdown instance-level metric correlations by the level of domain adaptation: Off-The-Shelf, Tuned In-Domain, and Double In-Domain. We consider BARTScore, CTC, and Entailment111111We report correlations for best performing variants with respect to the alignment method used for tuning and inference.. Please see 6.2 for specific in-domain and out of domain weights used.
| Domain Adaptation | Metric | Pearson Correlation |
| Off The Shelf | BARTScore | .539 |
| CTC | .507 | |
| Entailment | .453 | |
| Average | .501 | |
| Tuned In-Domain | BARTScore | .522 |
| CTC | .462 | |
| Entailment* | .450 | |
| Average | .478 | |
| Double In-Domain | BARTScore | .516 |
| CTC | .439 | |
| Entailment* | .450 | |
| Average | .468 |
Findings.
Table 8 shows a curious trend: that increasing levels of metric domain adaptation is associated with lower correlation to faithfulness annotations at the metric-level and across systems (average declines ). Below, we link this outcome to summary extractiveness.
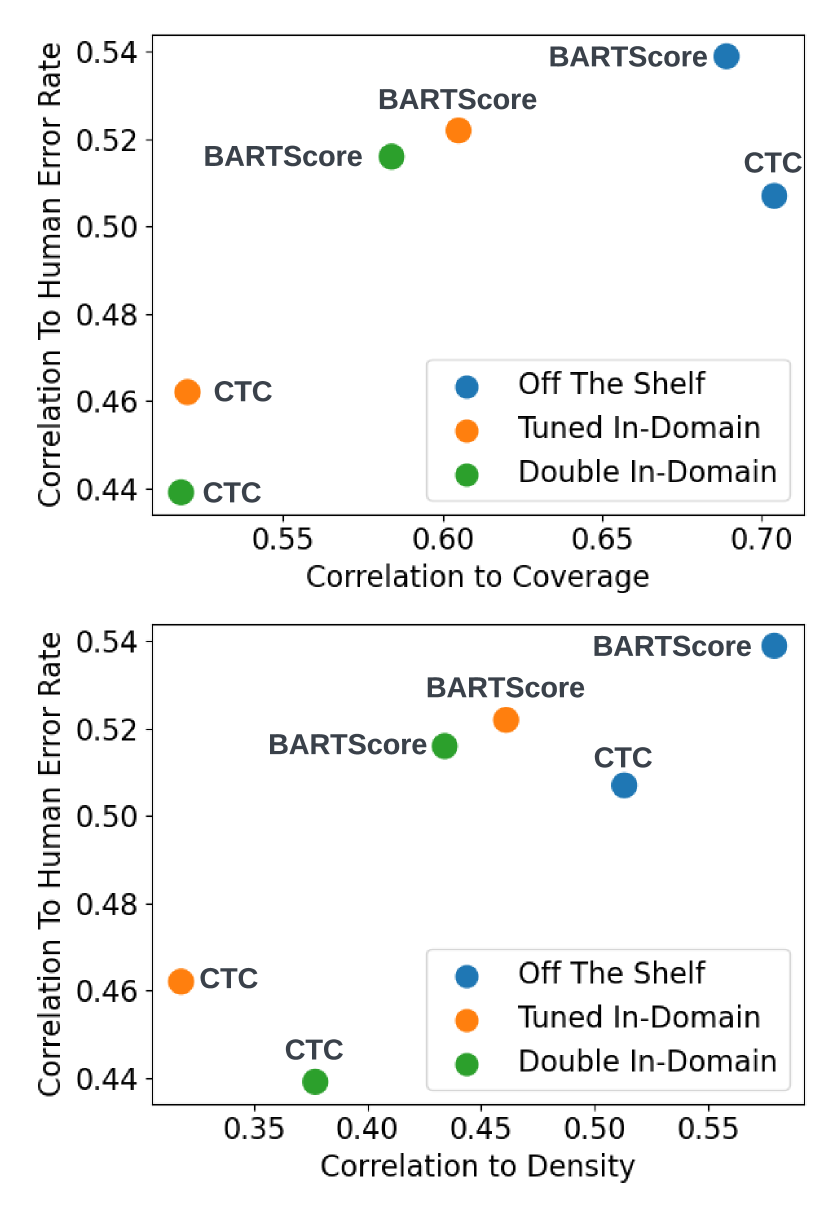

Spurious Correlates Hypothesis.
Durmus et al. (2022) find that reference-free metrics over rely on spurious correlates: variables which are highly correlated to human annotations on a biased test set, yet less correlated on a more realistic, diverse data distribution. Identifying such correlates is important because it suggests a metric brittleness which may not be captured by simple correlation analysis. As in their work, we focus on summary extractiveness (Grusky et al., 2018) as the potentially spurious correlate. In Figure 6, we reveal a clear pattern between metric correlation to extractiveness and correlation to the human error rate. In particular, across Coverage (top) and Density (bottom), high correlations to extractiveness are positively related to the correlation with the human error rate. Additionally, we see that in-domain training de-correlates metrics to extractiveness (Tuned-In-Domain and Double In-Domain. To examine why this might be the case, we examine the extractiveness of reference versus system summaries and a clear bias emerges.
| Summary | Coverage | Density |
| Reference | 0.88 | 12.04 |
| Model-Generated | 0.95 | 39.12 |
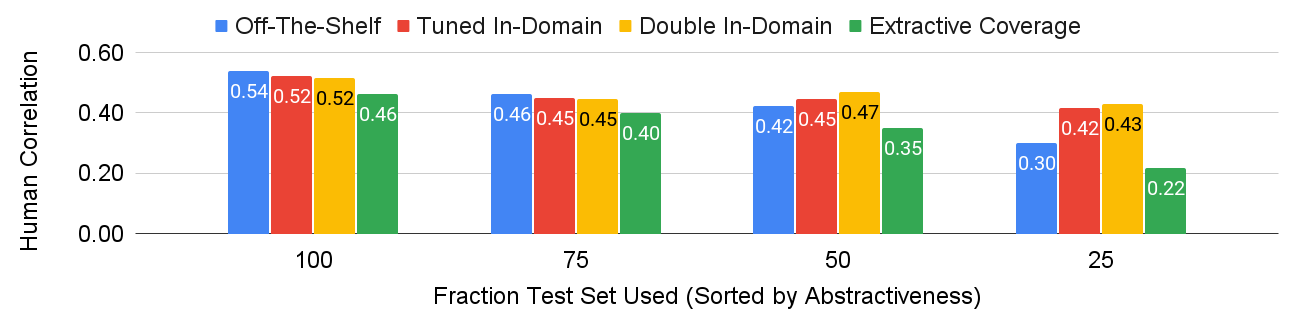
Table 9 shows that references are substantially more extractive in terms of both coverage (percentage of unigrams copied from the source) and density (average squared length of copied fragments) (Grusky et al., 2018). In other words, clinicians write more abstractive summaries than the Longformer. To more closely approximate more abstractive, clinician-authored summaries, we examine changes in correlations to human judgments as we filter for more abstractive subsets of the test set. We sort system summary sentences in the test set by coverage and filter for smaller and smaller subsets (making the average coverage lower). Figure 7 reveals that in-domain BARTScore metrics start to outperform when summaries are more abstractive ( for the smallest bucket, i.e., the top 25% most abstractive sentences in the eval set).
Domain-Adapted Metrics are Complementary to Coverage.
Recent work demonstrates the efficacy of ensembling de-correlated metrics (Kasai et al., 2022; Colombo et al., 2022). In light of our previous analysis, we can normalize each metric variant from Figure 6 and ensemble it with a normalized score for extractiveness (e.g., coverage). To make this explicit, given raw metric score and raw coverage , we create a combined metric
where and represent mean and standard deviations for and across all summary sentences. We can then insert each metric in Figure 6 as into this equation and compare correlations to HErr.
| Domain Adaptation | Metric | Pearson Correlation |
| Coverage (Cov) | .457 | |
| Off The Shelf | BARTScore + Cov | .542 |
| CTC + Cov | .522 | |
| Entailment + Cov | .524 | |
| Average | .529 | |
| Tuned In-Domain | BARTScore + Cov | .547 |
| CTC + Cov | .523 | |
| Entailment + Cov | .535 | |
| Average | .535 | |
| Double In-Domain | BARTScore | .547 |
| CTC + Cov | .514 | |
| Entailment + Cov | .535 | |
| Average | .532 |
Table 10 reveals that when combining metrics with coverage, In-Domain adaptation slightly helps. Off-The-Shelf averages across three metrics (+ Cov) are versus and for Tuned In-Domain and Double In-Domain, respectively. Yet, the differences are still relatively minor.
Adapting to System Outputs with Knowledge Distillation.
Despite modest gains, domain adaptation does not help much, which may be due in part to differences in reference summaries versus system outputs. The above metrics are all trained solely on gold-standard references yet meta-evaluated on system outputs. To bridge this gap, we can learn a metric from system outputs. Yet, our annotation set is too small to use for this task.
Instead, we leverage the fact that metrics, when ensembled, achieve relatively high correlation with human judgments, to create soft pseudo-targets on a larger set of system outputs (from Train - HIV). The goal, then, is to distill a single metric from the combined “knowledge” of multiple metrics121212This kind of distillation is distinct yet related to conventional knowledge distillation (Hinton et al., 2015), which typically involves using a large teacher to train a smaller student.. To do this, we first generate summaries with our LED model on the Train - HIV subset and segment into sentences. To produce pseudo targets, as shown in Figure 8, we identify a subset of In-Domain metrics with desired attributes: high-correlation to human labels and relatively low correlation to coverage. We then score each summary sentence with each metric in the ensemble, normalize the scores on a per-metric basis, and then average them to produce pseudo-target for each training instance. We then train a student model, which receives as input a concatenation of a model-generated summary sentence and its aligned source context, and outputs a scalar: using the [CLS] hidden state. The student is trained with a standard MSE loss: and is initialized from clinical/biomedical RoBERTA (Lewis et al., 2020a). We train in batches of for steps with a learning rate of ( warmup steps, followed by linear decay). For usage, we can optionally combine the distilled score with the coverage score.
Via distillation of metrics which are relatively de-correlated with coverage, the goal is two-fold: to learn a single model that achieves a higher correlation on its own to other single-metric variants, and is complementary to coverage when combined.
| Metric | Pearson Correlation |
| Best Single Metric | .539 |
| Best Single Metric + Cov | .547 |
| Distilled Metric | .564 |
| Distilled + Cov | .573 |
Table 11 reveals that the Distilled metric outperforms the best baseline metric variant ( vs ) and, because it is distilled from metrics which are relatively de-correlated with coverage, can be combined at inference with coverage to achieve an even higher correlation (). We ran a one-sided Williams Test (Graham and Baldwin, 2014) to estimate the significance of increase in correlation to human labels from Best Single Metric + Cov to Distilled + Cov. The p-value was . As such, we cannot state that the impact of distillation is statistically significant at . But, we note that the sample size is small ().
| Metric | Pearson Correlation | |
| Single | Avg In Ensemble | |
| Coverage (Cov) | .457 | .544 |
| BARTScore | .539 | .550 |
| CTC | .507 | .546 |
| Entailment | .453 | .539 |
| BERTScore | .482 | .535 |
| Reviser | .324 | .528 |
| FactScore | .444 | .536 |
| Distilled | .564 | .556 |
| Best Ensemble | N/A | .583 |
Multi-Metric Ensembles.
Previously, we reported promising performance of our proposed Distilled metric–both on its own and combined with an extractiveness statistic. Yet, ideally, we would also want a metric that improves correlation when ensembled with other metrics. To this end, we enumerate all possible ensembles from a set which includes the coverage statistic and 7 metrics: our distilled model and our 6 implemented metrics (BARTScore, BERTScore, CTC, Entailment, FactScore, ReDRESS)131313We report the best performing variant across in-domain pre-training / tuning and source-summary alignment methods.. This provides us with unique ensembles, of which each metric takes part in . Table 12 shows correlation of metrics to HErr for metrics on their own (Single), as well as the average correlation to HeRR for metric ensembles which include a given metric (In Ensemble). Firstly, the metric rankings induced by Single and In Ensemble are mostly in agreement. Distilled outperforms all baselines on its own () as well as its average correlation when used in an ensemble (). The last row of Table 12 shows the correlation of the ensemble with the highest correlation to HErr: Coverage, BARTScore, and Distilled. To test significance of the In Ensemble results, we bootstrap confidence intervals (CI) for each metric’s average In Ensemble correlation ( samples with replacement from vectors of size ) and find that the average correlation when Distilled is a part of an ensemble is significantly higher () than the average correlation of any of the other 6 metrics (when part of an ensemble).
These results demonstrate that Distilled is useful on its own and is complementary to other metrics. More broadly speaking, the relative out-performance of ensembling (In Ensemble over Single) supports the notion that, when developing a metric, it is more useful to focus on its complementarity to existing metrics, rather than its performance in isolation (Colombo et al., 2022).
7.5 Correlation by Metric Type
Previously, we meta-evaluated metrics against the percentage of summary elements (SE) with any error. In this section, we breakdown metric correlations separately by error category: Incorrect, Missing, and Not in Notes. We analyze metrics at the sentence-level against the percentage of Summary Elements in the sentence marked with a certain error. To provide more granular insights, we breakdown error type correlations by Domain Adaptation, Source-Summary Alignment methods, and metric classes (BARTScore vs CTC, etc).
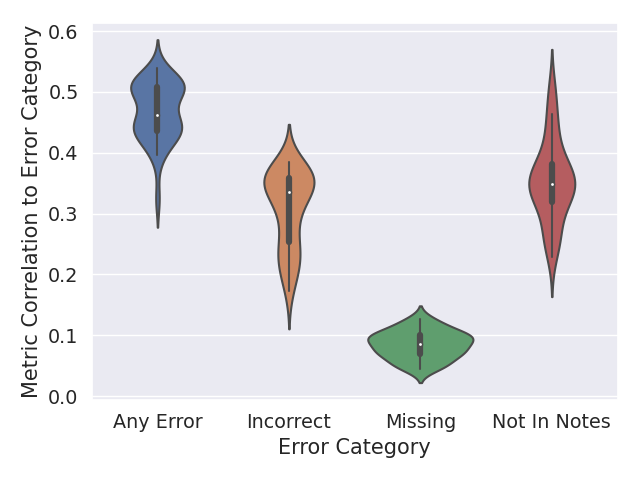
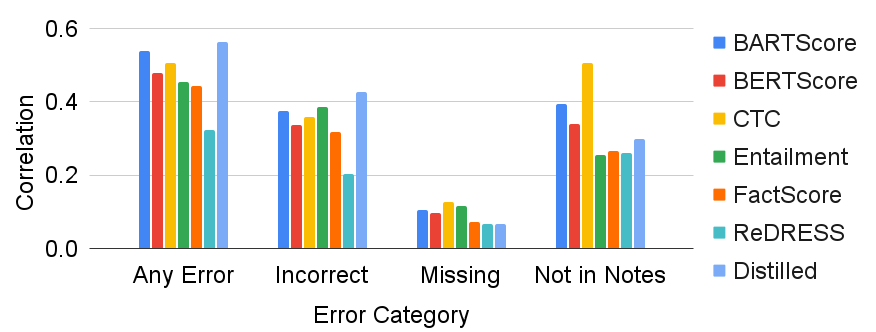
Figure 9 shows that Missing is the hardest for metrics (the instance-level correlations of metrics to fraction Missing across metric variants), which makes sense given its negligible correlation with Coverage (). Not in Notes are the simplest as they tend to be most associated with lexical overlap: Pearson correlation between coverage and fraction of SE’s in a sentence identified as Not in Notes. Incorrect errors can be subtle and are less correlated to coverage than Missing: . More generally, the over-reliance of these metrics on the level of copy-and-paste obfuscates their actual ability to reason over clinical narratives.
Metric-Wise.
Figure 10 breaks down correlations to human judgments by metric and errory category. The primary take-away is that metric performance (here, correlation) does not exhibit monotonicity across error categories. Excluding Distilled, BARTScore is best at identifying Any Error, while Entailment outperforms on Incorrect Errors, and CTC performs best on Not in Notes. As discussed before, all metrics perform poorly on identifying missing content. CTC learns to identify extrinsic hallucinations so its strong performance on Not in Notes makes sense. Entailment metrics are trained on NLI datasets, which target the kinds of logic and inconsistency errors found in Incorrect. All metrics struggle with Missing. Taken together, these findings reveal that there is no one-size fits all solution to evaluation and we believe that metrics should be designed to fit the particular needs of a system and dataset (Pagnoni et al., 2021). Reporting a single score for meta-evaluation obscures important differences across categories, as well as ignores the potential complementarity of different metrics. Given the potential of ensembling, targeted metrics–which out-perform on one category–may be more valuable to real-world use cases than “jack of all trades, master of none”-type metrics.
8 Conclusion
We collect fine-grained faithfulness annotations of Hospital Course summaries from clinicians and benchmark metrics against them. For each metric, we consider dimensions relevant to long-form clinical summarization: domain adaptation, input lengths, and output lengths. We find that metrics over-rely on the level of copy-and-paste in summaries. We can exploit this by computing a score which combines normalized extractiveness (coverage) with a new metric, which is distilled from a subset of the metrics most de-correlated with coverage. Moreover, metrics struggle with errors which require deep clinical knowledge (such as missingness, identification of mistakes from the source notes, etc.). While semi-supervised learning from synthetic datasets could help, learning from explicit human feedback will likely be necessary for deployment in real-world, human-in-the-loop clinical settings in order to more tightly align metric behavior with clinical reasoning (Wei et al., 2022).
Acknowledgements
This research was supported by the National Library of Medicine (NLM) and National Institute of Allergy and Infectious Diseases (NIAID) of the National Institutes of Health (NIH) under Award Number T15LM007079. The content is solely the responsibility of the authors and does not represent the official views of the NIH.
References
- Adams et al. (2021) Griffin Adams, Emily Alsentzer, Mert Ketenci, Jason Zucker, and Noémie Elhadad. 2021. What’s in a summary? laying the groundwork for advances in hospital-course summarization. In Proceedings of the 2021 Conference of the North American Chapter of the Association for Computational Linguistics: Human Language Technologies, pages 4794–4811, Online. Association for Computational Linguistics.
- Adams et al. (2020) Griffin Adams, Mert Ketenci, Shreyas Bhave, Adler Perotte, and Noémie Elhadad. 2020. Zero-shot clinical acronym expansion via latent meaning cells. In Machine Learning for Health, pages 12–40. PMLR.
- Adams et al. (2022a) Griffin Adams, Bichlien Nguyen, Jake Smith, Yingce Xia, Shufang Xie, Anna Ostropolets, Budhaditya Deb, Kali Frost, Yuan-Jyue Chen, Tristan Naumann, et al. 2022a. What are the desired characteristics of calibration sets? identifying correlates on long form scientific summarization. OpenReview preprint.
- Adams et al. (2022b) Griffin Adams, Han-Chin Shing, Qing Sun, Christopher Winestock, Kathleen McKeown, and Noémie Elhadad. 2022b. Learning to revise references for faithful summarization. In Findings of the Association for Computational Linguistics: EMNLP 2022, pages 4009–4027, Abu Dhabi, United Arab Emirates. Association for Computational Linguistics.
- Alsentzer et al. (2019a) Emily Alsentzer, John Murphy, William Boag, Wei-Hung Weng, Di Jindi, Tristan Naumann, and Matthew McDermott. 2019a. Publicly available clinical BERT embeddings. In Proceedings of the 2nd Clinical Natural Language Processing Workshop, pages 72–78, Minneapolis, Minnesota, USA. Association for Computational Linguistics.
- Alsentzer et al. (2019b) Emily Alsentzer, John R Murphy, Willie Boag, Wei-Hung Weng, Di Jin, Tristan Naumann, and Matthew McDermott. 2019b. Publicly available clinical bert embeddings. arXiv preprint arXiv:1904.03323.
- Barzilay and Elhadad (1997) Regina Barzilay and Michael Elhadad. 1997. Using lexical chains for text summarization. Proceedings of Intelligent Scalable Text Summarization Workshop.
- Beltagy et al. (2020) Iz Beltagy, Matthew E Peters, and Arman Cohan. 2020. Longformer: The long-document transformer. arXiv preprint arXiv:2004.05150.
- Bhandari et al. (2020) Manik Bhandari, Pranav Narayan Gour, Atabak Ashfaq, Pengfei Liu, and Graham Neubig. 2020. Re-evaluating evaluation in text summarization. In Proceedings of the 2020 Conference on Empirical Methods in Natural Language Processing (EMNLP), pages 9347–9359, Online. Association for Computational Linguistics.
- Bodenreider (2004) Olivier Bodenreider. 2004. The unified medical language system (umls): integrating biomedical terminology. Nucleic acids research, 32(suppl_1):D267–D270.
- Bowman et al. (2015) Samuel R. Bowman, Gabor Angeli, Christopher Potts, and Christopher D. Manning. 2015. A large annotated corpus for learning natural language inference. In Proceedings of the 2015 Conference on Empirical Methods in Natural Language Processing, pages 632–642, Lisbon, Portugal. Association for Computational Linguistics.
- Cao et al. (2022) Meng Cao, Yue Dong, and Jackie Cheung. 2022. Hallucinated but factual! inspecting the factuality of hallucinations in abstractive summarization. In Proceedings of the 60th Annual Meeting of the Association for Computational Linguistics (Volume 1: Long Papers), pages 3340–3354, Dublin, Ireland. Association for Computational Linguistics.
- Cao and Wang (2021a) Shuyang Cao and Lu Wang. 2021a. CLIFF: Contrastive learning for improving faithfulness and factuality in abstractive summarization. In Proceedings of the 2021 Conference on Empirical Methods in Natural Language Processing, pages 6633–6649, Online and Punta Cana, Dominican Republic. Association for Computational Linguistics.
- Cao and Wang (2021b) Shuyang Cao and Lu Wang. 2021b. CLIFF: Contrastive learning for improving faithfulness and factuality in abstractive summarization. In Proceedings of the 2021 Conference on Empirical Methods in Natural Language Processing, pages 6633–6649, Online and Punta Cana, Dominican Republic. Association for Computational Linguistics.
- Chan et al. (2014) Samuel Chan, Andrew P Maurice, Clifford W Pollard, Stephen J Ayre, Darren L Walters, and Helen E Ward. 2014. Improving the efficiency of discharge summary completion by linking to preexisiting patient information databases. BMJ Open Quality, 3(1):u200548–w2006.
- Cohen et al. (2009) Israel Cohen, Yiteng Huang, Jingdong Chen, Jacob Benesty, Jacob Benesty, Jingdong Chen, Yiteng Huang, and Israel Cohen. 2009. Pearson correlation coefficient. Noise reduction in speech processing, pages 1–4.
- Colombo et al. (2022) Pierre Colombo, Maxime Peyrard, Nathan Noiry, Robert West, and Pablo Piantanida. 2022. The glass ceiling of automatic evaluation in natural language generation. arXiv preprint arXiv:2208.14585.
- Dai et al. (2019) Zihang Dai, Zhilin Yang, Yiming Yang, Jaime Carbonell, Quoc V Le, and Ruslan Salakhutdinov. 2019. Transformer-xl: Attentive language models beyond a fixed-length context. arXiv preprint arXiv:1901.02860.
- Deng et al. (2021a) Mingkai Deng, Bowen Tan, Zhengzhong Liu, Eric Xing, and Zhiting Hu. 2021a. Compression, transduction, and creation: A unified framework for evaluating natural language generation. In Proceedings of the 2021 Conference on Empirical Methods in Natural Language Processing, pages 7580–7605, Online and Punta Cana, Dominican Republic. Association for Computational Linguistics.
- Deng et al. (2021b) Mingkai Deng, Bowen Tan, Zhengzhong Liu, Eric Xing, and Zhiting Hu. 2021b. Compression, transduction, and creation: A unified framework for evaluating natural language generation. In Proceedings of the 2021 Conference on Empirical Methods in Natural Language Processing, pages 7580–7605, Online and Punta Cana, Dominican Republic. Association for Computational Linguistics.
- Durmus et al. (2020) Esin Durmus, He He, and Mona Diab. 2020. FEQA: A question answering evaluation framework for faithfulness assessment in abstractive summarization. In Proceedings of the 58th Annual Meeting of the Association for Computational Linguistics, pages 5055–5070, Online. Association for Computational Linguistics.
- Durmus et al. (2022) Esin Durmus, Faisal Ladhak, and Tatsunori Hashimoto. 2022. Spurious correlations in reference-free evaluation of text generation. In Proceedings of the 60th Annual Meeting of the Association for Computational Linguistics (Volume 1: Long Papers), pages 1443–1454, Dublin, Ireland. Association for Computational Linguistics.
- Ernst et al. (2021) Ori Ernst, Ori Shapira, Ramakanth Pasunuru, Michael Lepioshkin, Jacob Goldberger, Mohit Bansal, and Ido Dagan. 2021. Summary-source proposition-level alignment: Task, datasets and supervised baseline. In Proceedings of the 25th Conference on Computational Natural Language Learning, pages 310–322, Online. Association for Computational Linguistics.
- Fabbri et al. (2021a) Alexander Fabbri, Simeng Han, Haoyuan Li, Haoran Li, Marjan Ghazvininejad, Shafiq Joty, Dragomir Radev, and Yashar Mehdad. 2021a. Improving zero and few-shot abstractive summarization with intermediate fine-tuning and data augmentation. In Proceedings of the 2021 Conference of the North American Chapter of the Association for Computational Linguistics: Human Language Technologies, pages 704–717, Online. Association for Computational Linguistics.
- Fabbri et al. (2022) Alexander Fabbri, Chien-Sheng Wu, Wenhao Liu, and Caiming Xiong. 2022. QAFactEval: Improved QA-based factual consistency evaluation for summarization. In Proceedings of the 2022 Conference of the North American Chapter of the Association for Computational Linguistics: Human Language Technologies, pages 2587–2601, Seattle, United States. Association for Computational Linguistics.
- Fabbri et al. (2021b) Alexander R. Fabbri, Wojciech Kryściński, Bryan McCann, Caiming Xiong, Richard Socher, and Dragomir Radev. 2021b. SummEval: Re-evaluating summarization evaluation. Transactions of the Association for Computational Linguistics, 9:391–409.
- Falke et al. (2019) Tobias Falke, Leonardo F. R. Ribeiro, Prasetya Ajie Utama, Ido Dagan, and Iryna Gurevych. 2019. Ranking generated summaries by correctness: An interesting but challenging application for natural language inference. In Proceedings of the 57th Annual Meeting of the Association for Computational Linguistics, pages 2214–2220, Florence, Italy. Association for Computational Linguistics.
- Gallant et al. (2017) Joel Gallant, Priscilla Y Hsue, Sanatan Shreay, and Nicole Meyer. 2017. Comorbidities among us patients with prevalent hiv infection—a trend analysis. The Journal of infectious diseases, 216(12):1525–1533.
- Goodrich et al. (2019) Ben Goodrich, Vinay Rao, Peter J Liu, and Mohammad Saleh. 2019. Assessing the factual accuracy of generated text. In Proceedings of the 25th ACM SIGKDD International Conference on Knowledge Discovery & Data Mining, pages 166–175.
- Goyal and Durrett (2021) Tanya Goyal and Greg Durrett. 2021. Annotating and modeling fine-grained factuality in summarization. In Proceedings of the 2021 Conference of the North American Chapter of the Association for Computational Linguistics: Human Language Technologies, pages 1449–1462, Online. Association for Computational Linguistics.
- Goyal et al. (2022) Tanya Goyal, Junyi Jessy Li, and Greg Durrett. 2022. News summarization and evaluation in the era of gpt-3. arXiv preprint arXiv:2209.12356.
- Graham and Baldwin (2014) Yvette Graham and Timothy Baldwin. 2014. Testing for significance of increased correlation with human judgment. In Proceedings of the 2014 Conference on Empirical Methods in Natural Language Processing (EMNLP), pages 172–176, Doha, Qatar. Association for Computational Linguistics.
- Grusky et al. (2018) Max Grusky, Mor Naaman, and Yoav Artzi. 2018. Newsroom: A dataset of 1.3 million summaries with diverse extractive strategies. In Proceedings of the 2018 Conference of the North American Chapter of the Association for Computational Linguistics: Human Language Technologies, Volume 1 (Long Papers), pages 708–719, New Orleans, Louisiana. Association for Computational Linguistics.
- Gu et al. (2021) Yu Gu, Robert Tinn, Hao Cheng, Michael Lucas, Naoto Usuyama, Xiaodong Liu, Tristan Naumann, Jianfeng Gao, and Hoifung Poon. 2021. Domain-specific language model pretraining for biomedical natural language processing. ACM Transactions on Computing for Healthcare (HEALTH), 3(1):1–23.
- Guo et al. (2021) Mandy Guo, Joshua Ainslie, David Uthus, Santiago Ontanon, Jianmo Ni, Yun-Hsuan Sung, and Yinfei Yang. 2021. Longt5: Efficient text-to-text transformer for long sequences. arXiv preprint arXiv:2112.07916.
- Gururangan et al. (2020) Suchin Gururangan, Ana Marasović, Swabha Swayamdipta, Kyle Lo, Iz Beltagy, Doug Downey, and Noah A. Smith. 2020. Don’t stop pretraining: Adapt language models to domains and tasks. In Proceedings of the 58th Annual Meeting of the Association for Computational Linguistics, pages 8342–8360, Online. Association for Computational Linguistics.
- Hermann et al. (2015) Karl Moritz Hermann, Tomás Kociský, Edward Grefenstette, Lasse Espeholt, Will Kay, Mustafa Suleyman, and Phil Blunsom. 2015. Teaching machines to read and comprehend. In NIPS, pages 1693–1701.
- Hinton et al. (2015) Geoffrey Hinton, Oriol Vinyals, and Jeff Dean. 2015. Distilling the knowledge in a neural network. arXiv preprint arXiv:1503.02531.
- Hirschtick (2006) Robert E Hirschtick. 2006. Copy-and-paste. Jama, 295(20):2335–2336.
- Holtzman et al. (2019) Ari Holtzman, Jan Buys, Li Du, Maxwell Forbes, and Yejin Choi. 2019. The curious case of neural text degeneration. arXiv preprint arXiv:1904.09751.
- Honovich et al. (2022) Or Honovich, Roee Aharoni, Jonathan Herzig, Hagai Taitelbaum, Doron Kukliansy, Vered Cohen, Thomas Scialom, Idan Szpektor, Avinatan Hassidim, and Yossi Matias. 2022. TRUE: Re-evaluating factual consistency evaluation. In Proceedings of the 2022 Conference of the North American Chapter of the Association for Computational Linguistics: Human Language Technologies, pages 3905–3920, Seattle, United States. Association for Computational Linguistics.
- Huang et al. (2020) Dandan Huang, Leyang Cui, Sen Yang, Guangsheng Bao, Kun Wang, Jun Xie, and Yue Zhang. 2020. What have we achieved on text summarization? In Proceedings of the 2020 Conference on Empirical Methods in Natural Language Processing (EMNLP), pages 446–469, Online. Association for Computational Linguistics.
- Kasai et al. (2022) Jungo Kasai, Keisuke Sakaguchi, Ronan Le Bras, Lavinia Dunagan, Jacob Morrison, Alexander Fabbri, Yejin Choi, and Noah A. Smith. 2022. Bidimensional leaderboards: Generate and evaluate language hand in hand. In Proceedings of the 2022 Conference of the North American Chapter of the Association for Computational Linguistics: Human Language Technologies, pages 3540–3557, Seattle, United States. Association for Computational Linguistics.
- Kind and Smith (2008) Amy JH Kind and Maureen A Smith. 2008. Documentation of mandated discharge summary components in transitions from acute to subacute care. Advances in patient safety: new directions and alternative approaches (Vol. 2: culture and redesign).
- Korfiatis et al. (2022) Alex Papadopoulos Korfiatis, Francesco Moramarco, Radmila Sarac, and Aleksandar Savkov. 2022. Primock57: A dataset of primary care mock consultations. arXiv preprint arXiv:2204.00333.
- Kripalani et al. (2007) Sunil Kripalani, Frank LeFevre, Christopher O Phillips, Mark V Williams, Preetha Basaviah, and David W Baker. 2007. Deficits in communication and information transfer between hospital-based and primary care physicians: implications for patient safety and continuity of care. Jama, 297(8):831–841.
- Kroth et al. (2019) Philip J Kroth, Nancy Morioka-Douglas, Sharry Veres, Stewart Babbott, Sara Poplau, Fares Qeadan, Carolyn Parshall, Kathryne Corrigan, and Mark Linzer. 2019. Association of electronic health record design and use factors with clinician stress and burnout. JAMA network open, 2(8):e199609–e199609.
- Kryscinski et al. (2020a) Wojciech Kryscinski, Bryan McCann, Caiming Xiong, and Richard Socher. 2020a. Evaluating the factual consistency of abstractive text summarization. In Proceedings of the 2020 Conference on Empirical Methods in Natural Language Processing (EMNLP), pages 9332–9346, Online. Association for Computational Linguistics.
- Kryscinski et al. (2020b) Wojciech Kryscinski, Bryan McCann, Caiming Xiong, and Richard Socher. 2020b. Evaluating the factual consistency of abstractive text summarization. In Proceedings of the 2020 Conference on Empirical Methods in Natural Language Processing (EMNLP), pages 9332–9346, Online. Association for Computational Linguistics.
- Laban et al. (2022) Philippe Laban, Tobias Schnabel, Paul N. Bennett, and Marti A. Hearst. 2022. SummaC: Re-visiting NLI-based models for inconsistency detection in summarization. Transactions of the Association for Computational Linguistics, 10:163–177.
- Lebanoff et al. (2019a) Logan Lebanoff, John Muchovej, Franck Dernoncourt, Doo Soon Kim, Seokhwan Kim, Walter Chang, and Fei Liu. 2019a. Analyzing sentence fusion in abstractive summarization. In Proceedings of the 2nd Workshop on New Frontiers in Summarization, pages 104–110, Hong Kong, China. Association for Computational Linguistics.
- Lebanoff et al. (2019b) Logan Lebanoff, Kaiqiang Song, Franck Dernoncourt, Doo Soon Kim, Seokhwan Kim, Walter Chang, and Fei Liu. 2019b. Scoring sentence singletons and pairs for abstractive summarization. In Proceedings of the 57th Annual Meeting of the Association for Computational Linguistics, pages 2175–2189, Florence, Italy. Association for Computational Linguistics.
- Lehman et al. (2023) Eric Lehman, Evan Hernandez, Diwakar Mahajan, Jonas Wulff, Micah J Smith, Zachary Ziegler, Daniel Nadler, Peter Szolovits, Alistair Johnson, and Emily Alsentzer. 2023. Do we still need clinical language models? arXiv preprint arXiv:2302.08091.
- Levy-Fix et al. (2020) Gal Levy-Fix, Jason Zucker, Konstantin Stojanovic, and Noémie Elhadad. 2020. Towards patient record summarization through joint phenotype learning in hiv patients. arXiv preprint arXiv:2003.11474.
- Lewis et al. (2020a) Patrick Lewis, Myle Ott, Jingfei Du, and Veselin Stoyanov. 2020a. Pretrained language models for biomedical and clinical tasks: Understanding and extending the state-of-the-art. In Proceedings of the 3rd Clinical Natural Language Processing Workshop, pages 146–157, Online. Association for Computational Linguistics.
- Lewis et al. (2020b) Patrick Lewis, Ethan Perez, Aleksandra Piktus, Fabio Petroni, Vladimir Karpukhin, Naman Goyal, Heinrich Küttler, Mike Lewis, Wen-tau Yih, Tim Rocktäschel, et al. 2020b. Retrieval-augmented generation for knowledge-intensive nlp tasks. Advances in Neural Information Processing Systems, 33:9459–9474.
- Liu et al. (2021) Fangyu Liu, Ehsan Shareghi, Zaiqiao Meng, Marco Basaldella, and Nigel Collier. 2021. Self-alignment pretraining for biomedical entity representations. In Proceedings of the 2021 Conference of the North American Chapter of the Association for Computational Linguistics: Human Language Technologies, pages 4228–4238, Online. Association for Computational Linguistics.
- Liu and Lapata (2019) Yang Liu and Mirella Lapata. 2019. Hierarchical transformers for multi-document summarization. In Proceedings of the 57th Annual Meeting of the Association for Computational Linguistics, pages 5070–5081, Florence, Italy. Association for Computational Linguistics.
- Lux et al. (2020) Klaus-Michael Lux, Maya Sappelli, and Martha Larson. 2020. Truth or error? towards systematic analysis of factual errors in abstractive summaries. In Proceedings of the First Workshop on Evaluation and Comparison of NLP Systems, pages 1–10, Online. Association for Computational Linguistics.
- MacAvaney et al. (2019) Sean MacAvaney, Sajad Sotudeh, Arman Cohan, Nazli Goharian, Ish Talati, and Ross W Filice. 2019. Ontology-aware clinical abstractive summarization. In Proceedings of the 42nd International ACM SIGIR Conference on Research and Development in Information Retrieval, pages 1013–1016.
- Maslach and Leiter (2016) Christina Maslach and Michael P Leiter. 2016. Understanding the burnout experience: recent research and its implications for psychiatry. World psychiatry, 15(2):103–111.
- Maynez et al. (2020) Joshua Maynez, Shashi Narayan, Bernd Bohnet, and Ryan McDonald. 2020. On faithfulness and factuality in abstractive summarization. In Proceedings of the 58th Annual Meeting of the Association for Computational Linguistics, pages 1906–1919, Online. Association for Computational Linguistics.
- Moen et al. (2014) Hans Moen, Juho Heimonen, Laura-Maria Murtola, Antti Airola, Tapio Pahikkala, Virpi Terävä, Riitta Danielsson-Ojala, Tapio Salakoski, and Sanna Salanterä. 2014. On evaluation of automatically generated clinical discharge summaries. In PAHI, pages 101–114.
- Moramarco et al. (2021) Francesco Moramarco, Damir Juric, Aleksandar Savkov, and Ehud Reiter. 2021. Towards objectively evaluating the quality of generated medical summaries. In Proceedings of the Workshop on Human Evaluation of NLP Systems (HumEval), pages 56–61, Online. Association for Computational Linguistics.
- Moramarco et al. (2022) Francesco Moramarco, Alex Papadopoulos Korfiatis, Mark Perera, Damir Juric, Jack Flann, Ehud Reiter, Anya Belz, and Aleksandar Savkov. 2022. Human evaluation and correlation with automatic metrics in consultation note generation. In Proceedings of the 60th Annual Meeting of the Association for Computational Linguistics (Volume 1: Long Papers), pages 5739–5754, Dublin, Ireland. Association for Computational Linguistics.
- Moy et al. (2021) Amanda J Moy, Jessica M Schwartz, RuiJun Chen, Shirin Sadri, Eugene Lucas, Kenrick D Cato, and Sarah Collins Rossetti. 2021. Measurement of clinical documentation burden among physicians and nurses using electronic health records: a scoping review. Journal of the American Medical Informatics Association, 28(5):998–1008.
- Narayan et al. (2018) Shashi Narayan, Shay B. Cohen, and Mirella Lapata. 2018. Don’t give me the details, just the summary! topic-aware convolutional neural networks for extreme summarization. In Proceedings of the 2018 Conference on Empirical Methods in Natural Language Processing, pages 1797–1807, Brussels, Belgium. Association for Computational Linguistics.
- Narayan et al. (2021) Shashi Narayan, Yao Zhao, Joshua Maynez, Gonçalo Simões, Vitaly Nikolaev, and Ryan McDonald. 2021. Planning with learned entity prompts for abstractive summarization. Transactions of the Association for Computational Linguistics, 9:1475–1492.
- National Academies of Sciences (2019) & Medicine & others National Academies of Sciences, Engineering. 2019. Taking action against clinician burnout: a systems approach to professional well-being. National Academies Press.
- O’Leary et al. (2009) Kevin J O’Leary, David M Liebovitz, Joseph Feinglass, David T Liss, Daniel B Evans, Nita Kulkarni, Matthew P Landler, and David W Baker. 2009. Creating a better discharge summary: improvement in quality and timeliness using an electronic discharge summary. Journal of Hospital Medicine: An Official Publication of the Society of Hospital Medicine, 4(4):219–225.
- Pagnoni et al. (2021) Artidoro Pagnoni, Vidhisha Balachandran, and Yulia Tsvetkov. 2021. Understanding factuality in abstractive summarization with FRANK: A benchmark for factuality metrics. In Proceedings of the 2021 Conference of the North American Chapter of the Association for Computational Linguistics: Human Language Technologies, pages 4812–4829, Online. Association for Computational Linguistics.
- Panagioti et al. (2018) Maria Panagioti, Keith Geraghty, Judith Johnson, Anli Zhou, Efharis Panagopoulou, Carolyn Chew-Graham, David Peters, Alexander Hodkinson, Ruth Riley, and Aneez Esmail. 2018. Association between physician burnout and patient safety, professionalism, and patient satisfaction: a systematic review and meta-analysis. JAMA internal medicine, 178(10):1317–1331.
- Phang et al. (2022) Jason Phang, Yao Zhao, and Peter J Liu. 2022. Investigating efficiently extending transformers for long input summarization. arXiv preprint arXiv:2208.04347.
- (74) Prodigy. 2020. Prodigy: an annotation tool for ai, machine learning.
- Ribeiro et al. (2022) Leonardo Ribeiro, Mengwen Liu, Iryna Gurevych, Markus Dreyer, and Mohit Bansal. 2022. FactGraph: Evaluating factuality in summarization with semantic graph representations. In Proceedings of the 2022 Conference of the North American Chapter of the Association for Computational Linguistics: Human Language Technologies, pages 3238–3253, Seattle, United States. Association for Computational Linguistics.
- Romanov and Shivade (2018) Alexey Romanov and Chaitanya Shivade. 2018. Lessons from natural language inference in the clinical domain. In Proceedings of the 2018 Conference on Empirical Methods in Natural Language Processing, pages 1586–1596, Brussels, Belgium. Association for Computational Linguistics.
- Salvagioni et al. (2017) Denise Albieri Jodas Salvagioni, Francine Nesello Melanda, Arthur Eumann Mesas, Alberto Durán González, Flávia Lopes Gabani, and Selma Maffei de Andrade. 2017. Physical, psychological and occupational consequences of job burnout: A systematic review of prospective studies. PloS one, 12(10):e0185781.
- See et al. (2017) Abigail See, Peter J. Liu, and Christopher D. Manning. 2017. Get to the point: Summarization with pointer-generator networks. In Proceedings of the 55th Annual Meeting of the Association for Computational Linguistics (Volume 1: Long Papers), pages 1073–1083, Vancouver, Canada. Association for Computational Linguistics.
- Sellam et al. (2020) Thibault Sellam, Dipanjan Das, and Ankur Parikh. 2020. BLEURT: Learning robust metrics for text generation. In Proceedings of the 58th Annual Meeting of the Association for Computational Linguistics, pages 7881–7892, Online. Association for Computational Linguistics.
- Shanafelt et al. (2016) Tait D Shanafelt, Lotte N Dyrbye, Christine Sinsky, Omar Hasan, Daniel Satele, Jeff Sloan, and Colin P West. 2016. Relationship between clerical burden and characteristics of the electronic environment with physician burnout and professional satisfaction. In Mayo Clinic Proceedings, volume 91, pages 836–848. Elsevier.
- Sinsky et al. (2016) Christine Sinsky, Lacey Colligan, Ling Li, Mirela Prgomet, Sam Reynolds, Lindsey Goeders, Johanna Westbrook, Michael Tutty, and George Blike. 2016. Allocation of physician time in ambulatory practice: a time and motion study in 4 specialties. Annals of internal medicine, 165(11):753–760.
- Soysal et al. (2018) Ergin Soysal, Jingqi Wang, Min Jiang, Yonghui Wu, Serguei Pakhomov, Hongfang Liu, and Hua Xu. 2018. Clamp–a toolkit for efficiently building customized clinical natural language processing pipelines. Journal of the American Medical Informatics Association, 25(3):331–336.
- Tang et al. (2022) Liyan Tang, Shravan Kooragayalu, Yanshan Wang, Ying Ding, Greg Durrett, Justin F. Rousseau, and Yifan Peng. 2022. EchoGen: Generating conclusions from echocardiogram notes. In Proceedings of the 21st Workshop on Biomedical Language Processing, pages 359–368, Dublin, Ireland. Association for Computational Linguistics.
- Utama et al. (2022) Prasetya Utama, Joshua Bambrick, Nafise Moosavi, and Iryna Gurevych. 2022. Falsesum: Generating document-level NLI examples for recognizing factual inconsistency in summarization. In Proceedings of the 2022 Conference of the North American Chapter of the Association for Computational Linguistics: Human Language Technologies, pages 2763–2776, Seattle, United States. Association for Computational Linguistics.
- Van Walraven et al. (2002) Carl Van Walraven, Ratika Seth, Peter C Austin, and Andreas Laupacis. 2002. Effect of discharge summary availability during post-discharge visits on hospital readmission. Journal of general internal medicine, 17:186–192.
- Vaswani et al. (2017) Ashish Vaswani, Noam Shazeer, Niki Parmar, Jakob Uszkoreit, Llion Jones, Aidan N Gomez, Łukasz Kaiser, and Illia Polosukhin. 2017. Attention is all you need. Advances in neural information processing systems, 30.
- Wadden et al. (2020) David Wadden, Shanchuan Lin, Kyle Lo, Lucy Lu Wang, Madeleine van Zuylen, Arman Cohan, and Hannaneh Hajishirzi. 2020. Fact or fiction: Verifying scientific claims. In Proceedings of the 2020 Conference on Empirical Methods in Natural Language Processing (EMNLP), pages 7534–7550, Online. Association for Computational Linguistics.
- Wadden et al. (2022) David Wadden, Kyle Lo, Lucy Wang, Arman Cohan, Iz Beltagy, and Hannaneh Hajishirzi. 2022. MultiVerS: Improving scientific claim verification with weak supervision and full-document context. In Findings of the Association for Computational Linguistics: NAACL 2022, pages 61–76, Seattle, United States. Association for Computational Linguistics.
- Wang et al. (2020) Alex Wang, Kyunghyun Cho, and Mike Lewis. 2020. Asking and answering questions to evaluate the factual consistency of summaries. In Proceedings of the 58th Annual Meeting of the Association for Computational Linguistics, pages 5008–5020, Online. Association for Computational Linguistics.
- Wang et al. (2022) Xuezhi Wang, Jason Wei, Dale Schuurmans, Quoc Le, Ed Chi, and Denny Zhou. 2022. Self-consistency improves chain of thought reasoning in language models. arXiv preprint arXiv:2203.11171.
- Wei et al. (2022) Jason Wei, Xuezhi Wang, Dale Schuurmans, Maarten Bosma, Ed Chi, Quoc Le, and Denny Zhou. 2022. Chain of thought prompting elicits reasoning in large language models. arXiv preprint arXiv:2201.11903.
- Wolf et al. (2020) Thomas Wolf, Lysandre Debut, Victor Sanh, Julien Chaumond, Clement Delangue, Anthony Moi, Pierric Cistac, Tim Rault, Remi Louf, Morgan Funtowicz, Joe Davison, Sam Shleifer, Patrick von Platen, Clara Ma, Yacine Jernite, Julien Plu, Canwen Xu, Teven Le Scao, Sylvain Gugger, Mariama Drame, Quentin Lhoest, and Alexander Rush. 2020. Transformers: State-of-the-art natural language processing. In Proceedings of the 2020 Conference on Empirical Methods in Natural Language Processing: System Demonstrations, pages 38–45, Online. Association for Computational Linguistics.
- Yuan et al. (2021) Weizhe Yuan, Graham Neubig, and Pengfei Liu. 2021. Bartscore: Evaluating generated text as text generation. Advances in Neural Information Processing Systems, 34:27263–27277.
- Zaheer et al. (2020) Manzil Zaheer, Guru Guruganesh, Kumar Avinava Dubey, Joshua Ainslie, Chris Alberti, Santiago Ontanon, Philip Pham, Anirudh Ravula, Qifan Wang, Li Yang, et al. 2020. Big bird: Transformers for longer sequences. Advances in Neural Information Processing Systems, 33:17283–17297.
- Zhang et al. (2022) Shiyue Zhang, David Wan, and Mohit Bansal. 2022. Extractive is not faithful: An investigation of broad unfaithfulness problems in extractive summarization. arXiv preprint arXiv:2209.03549.
- Zhang et al. (2019) Tianyi Zhang, Varsha Kishore, Felix Wu, Kilian Q Weinberger, and Yoav Artzi. 2019. Bertscore: Evaluating text generation with bert. arXiv preprint arXiv:1904.09675.
- Zhang et al. (2020) Yuhao Zhang, Derek Merck, Emily Tsai, Christopher D. Manning, and Curtis Langlotz. 2020. Optimizing the factual correctness of a summary: A study of summarizing radiology reports. In Proceedings of the 58th Annual Meeting of the Association for Computational Linguistics, pages 5108–5120, Online. Association for Computational Linguistics.
Appendix A LED Training Details
Coarse Filtering.
The average length of the inputs ( 30,000 tokens) exceeds the maximum sequence length even for transformer models with sparse attention mechanisms designed for long input sequences (Dai et al., 2019; Zaheer et al., 2020; Guo et al., 2021). Similarly to Liu and Lapata (2019), we learn a simple bi-LSTM model which learns the relevance of each section, to predict the average ROUGE-1 and ROUGE-2 recall of each section vis-a-vis the reference. In particular, we pass a bi-LSTM over the tokens in each section and compute a soft cross-entropy loss between the gold-standard ROUGE-2 recall and the predicted logit (sigmoid(score)). Then, we score each section and filter for the top-K sections. The top 100 sections are provided by an oracle during training and by the model for evaluation.
Fine-Tuning.
We fine-tune the Longformer Encoder-Decoder (LED) for 10 epochs with a batch size of 1 and gradient accumulation steps of 16. We set the maximum learning rate to (tuned in range the range of to ) with a warmup of steps with linear decay. The maximum input size was set to 16,384 and outputs were produced with minimum length of 64, maximum length of 1,024, trigam-blocking, and a beam size of 4 with length penalty 4.0. Training took 8 days on 1 NVIDIA RTX 3090 GPU (24GB).
Appendix B Entity Extraction
We extract and link entities to the Unified Medical Language System (UMLS (Bodenreider, 2004)) with CLAMP (Soysal et al., 2018) and embed each entity mention with SapBERT (Liu et al., 2021) and first merge all entity mentions which share the same CUI from the UMLS. Exact match of two entities by CUI is far too strict given the size of the UMLS vocabulary as well as extraction noise from abbreviations, acronyms, etc. (Adams et al., 2020). Then, we treat two distinct CUIs as synonyms based on a random forest classifier. The authors of this paper manually labeled 1,000 pairs of entities sampled from 10 different admissions, from a held-out set. The labels were Unrelated, Related, Synonyms. Ceftriaxone is Related to antibiotics since it is in the class of antibiotic, while it is a synonym of Rocephin, its brand name. We split the 1,000 manually labeled examples into an 80-20 train-test split and compute features for all pairs of unique CUIs. They include similarity scores (cosine similarity) between CUIs, where CUI embeddings are provided by a pre-trained section-level CUI2Vec model on our corpus, as well as maximum pairwise alignments between mentions from different CUI sets: cosine similarity between SapBERT mention embeddings and lexical similarity (IDF overlap and string levenshtein distance), and finally, binary indicators for TUI and semantic group status from the UMLS.
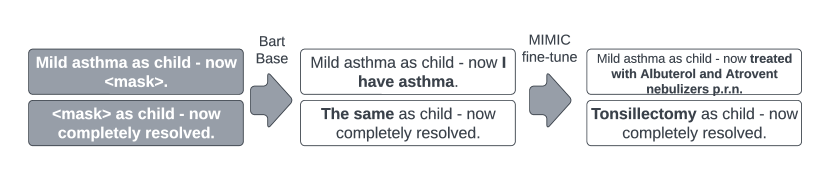
Appendix C CTC Generator Details
We use the same masking procedure used to train the CTC model to align the pre-training with the use case and use a BART-Base model to train for 500,000 steps with a batch size of and maximum learning rate of , linearly decaying after warmup steps. We show an example of the improvement in Mask-Infilling in Figure 11.
Appendix D Other In-Domain Metrics
ReDRESS.
ReDRESS (Adams et al., 2022b) uses a novel hybrid approach that incorporates entity-swapping into a de-noising framework to generate synthetic corruptions on clinical text. Contrastive learning is used to teach another model to reverse the synthetic hallucinations. We adapt it as a faithfulness metric by revising model outputs conditioned on aligned source context and then measuring the revision intensity, e.g., how much was each summary edited to become faithful. We return the BERTScore F-1 between revised and un-revised summaries as the ReDRESS-Score: a higher score suggests fewer edits are necessary to re-write the summaries such that they are faithful.
FactScore.
As in Adams et al. (2022a), FactScore is based on the state of the art model (MultiVERS (Wadden et al., 2022)) trained on the SciFact dataset (Wadden et al., 2020). SciFact is an expert-annotated dataset of 1,409 sentence-level scientific claims. Each summary sentence is scored conditioned on its aligned source sentences (which are varied according to the methods described in §6.1). The FactScore is the probability that the MultiVERS assigns to the SUPPORTED label.
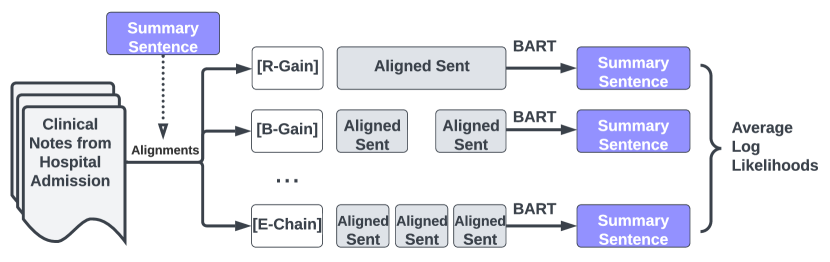
| Source-Alignment | Pearson Correlation |
| ROUGE-Gain | .516 |
| BERT-Gain | .427 |
| ROUGE-TopK | .481 |
| Top Section | .499 |
| Entity Chain | .380 |
| Average - Single Method | .461 |
| Alignment-Controlled Mixture | .496 |
Appendix E Mixture of Alignment Controlled BARTScores
Complementarity of Alignments.
In a sense, each source-summary alignment can be viewed as its own hard attention head. Inspired by the success of Multi-Head Attention (Vaswani et al., 2017), as well as the success of ensembling de-correlated metrics (Kasai et al., 2022), we propose a new BARTScore variant, MACS: “Mixture-of-Alignment-Controlled-BARTScores”. At a high-level, we fine-tune a single BART model on our Train - HIV examples, in which the dataset consists of source alignment-summary sentence pairs (using each algorithm in §6.1). In other words, for each summary sentence, we create 6 training instances: the input is a special code indicating the alignment, the aligned source text, and the target output is the summary sentence. Then, during inference, we separately compute a BARTScore for each alignment and average the BARTScores (mean token-level log-likelihood of generating a predicted sentence). We show the procedure for MACS in Figure 12. Table 13 demonstrates BARTScore variants trained and evaluated on different alignments. The results show that while our proposed extension–Alignment-Controlled Mixture, outperforms the average single alignment correlation to human annotations ( versus ), it does not outperform the top performing single alignment method: ROUGE - Gain ( versus ). We leave more sophisticated mixing for future work, which could involve learning a dynamic mixture during training (Lewis et al., 2020b) or enforcing self-consistency (Wang et al., 2022) on the decoder across each alignment.