DEDGAT: Dual Embedding of Directed Graph Attention Networks for Detecting Financial Risk
Abstract.
Graph representation plays an important role in the field of financial risk control, where the relationship among users can be constructed in a graph manner. In practical scenarios, the relationships between nodes in risk control tasks are bidirectional, e.g., merchants having both revenue and expense behaviors. Graph neural networks designed for undirected graphs usually aggregate discriminative node or edge representations with an attention strategy, but cannot fully exploit the out-degree information when used for the tasks built on directed graph, which leads to the problem of a directional bias. To tackle this problem, we propose a Direc-ted Graph ATtention network called DGAT, which explicitly takes out-degree into attention calculation. In addition to having directional requirements, the same node might have different representations of its input and output, and thus we further propose a dual embedding of DGAT, referred to as DEDGAT. Specifically, DEDGAT assigns in-degree and out-degree representations to each node and uses these two embeddings to calculate the attention weights of in-degree and out-degree nodes, respectively. Experiments performed on the benchmark datasets show that DGAT and DEDGAT obtain better classification performance compared to undirected GAT. Also. the visualization results demonstrate that our methods can fully use both in-degree and out-degree information.
1. Introduction
Financial risk control is the core of Internet financing and one of the main applications of artificial intelligence (li2009network, ; aziz2019machine, ; ma2019financial, ; yang2020construction, ). In risk control scenarios, there are often various relationships between entities, such as transfer relationship, device relationship, regional connection, etc. Using graph structure to modeling the relationship can help us discover abnormal objects in the financial system.
Graph-based methods can often be divided into shallow graph methods and graph neural network (GNN) methods. The shallow methods represented by DeepWalk (perozzi2014deepwalk, ), node2vec (grover2016node2vec, ), LINE (tang2015line, ) can only learn the shallow represetation information of the graph, so the classification performance is limited. Different from shallow methods, GNN can automatically learn high-level features of graphs in a supervised manner and utilize the features of nodes and edges to improve the performance of downstream tasks such as node or edge classification. Graph Convolutional Network (GCN) (kipf2016semi, ) uses convolution to aggregate node information. GraphSage (hamilton2017inductive, ) uses neighbor sampling to aggregate the neighborhood information of nodes, making training on large-scale graph data possible. Graph Attention Network (GAT) (velivckovic2017graph, ) aggregates the information of each node and its neighbor nodes according to the weighted attention, which is widely used in the task of graph node classification. While these methods achieve a better performance compared to shallow methods (weber2019anti, ), most of them are designed for undirected graphs. Accordingly, the direction information of the graph cannot be fully exploited. DGCN (ma2019spectral, ) extends graph convolution from undirected graphs to directed graphs by introducing the concepts of 1-st neighbors and 2-nd neighbors to compute Lapalacian matrix. MagNet (zhang2021magnet, ) adopts Hermitian magnetic Laplacian to decouple the direction of the graph. These methods are explicitly represented for directed graphs in a transductive way, but do not fully consider the distinction between in-degree and out-degree information.
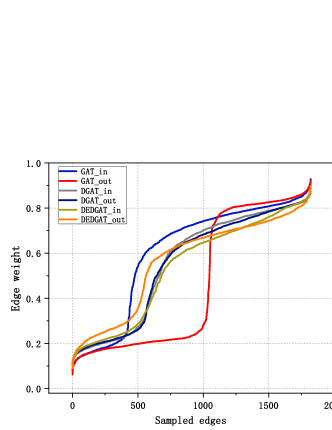
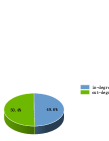
In financial risk control, the distinction between in-degree and out-degree information is very important. For example, the information transmitted from bank account A to account B and B to A are significantly different. In addition, although the transfer from A to B is one-way, the transfer relationship implies a two-way social relationship between A and B. Therefore, the graph network for financial risk control should explicitly distinguish in-degree and out-degree information, and adequately aggregate their information in a balanced manner. However, GAT has a strong directinal bias as shown in Fig. 1, where the out-degree weights are far less important than the in-degree ones. This limits the performance on financial risk control tasks.
To tackle this problem, we propose a directed graph attention network (called DGAT), which calculates the in-degree and out-degree information separately during the feature aggregation process. To better distinguish the in/out-degree represetation on directed graph, we further propose a dual embedding of directed attention network (referred to as DEDGAT) to sovle the directional bias. Specifially, a graph node is divided to in-degree and out-degree nodes respectively and then graph representation is sepratedly computed for in/out-degree nodes. The proposed models achieve SOTA performance on three financial risk control datasets by reducing directional bias verified by GNNExplainer (ying2019gnnexplainer, ).
2. Proposed Models
As shown in Fig. 2(a), the undirected GAT can only aggregate in-degree information, resulting in insufficient out-degree information. This leads to the problem of directional bias as shown in Fig. 1. To explicitly exploit directed information of graph nodes, we propose a directed graph attention network (DGAT) to calculate both in-degree and out-degree attentions, respectively, as shown in Fig. 2(b). To further distinguish in-degree and out-degree informaton, we propose a dual embedding in terms of DGAT (as referred to DEDGAT) to extract discriminative features for different directions of graph nodes, as shown in Fig. 2(c).
2.1. Directed Graph Attention Networks (DGAT)
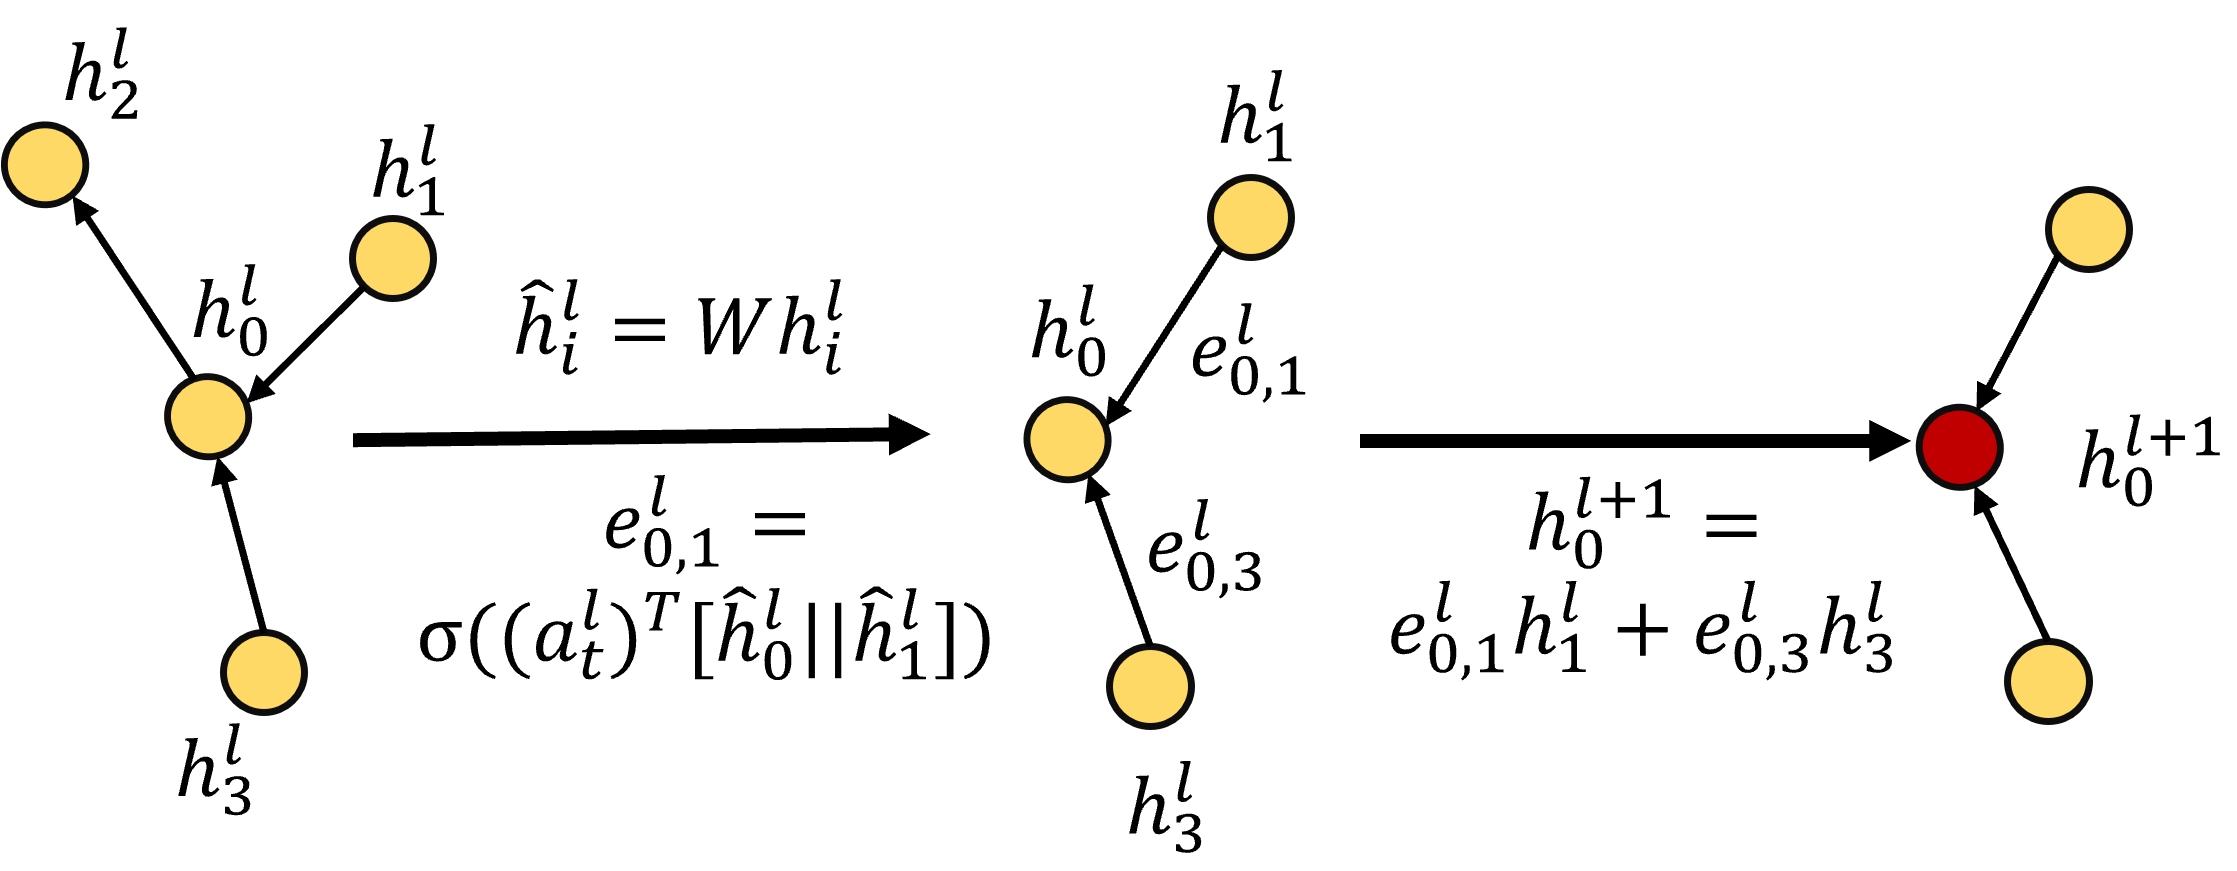
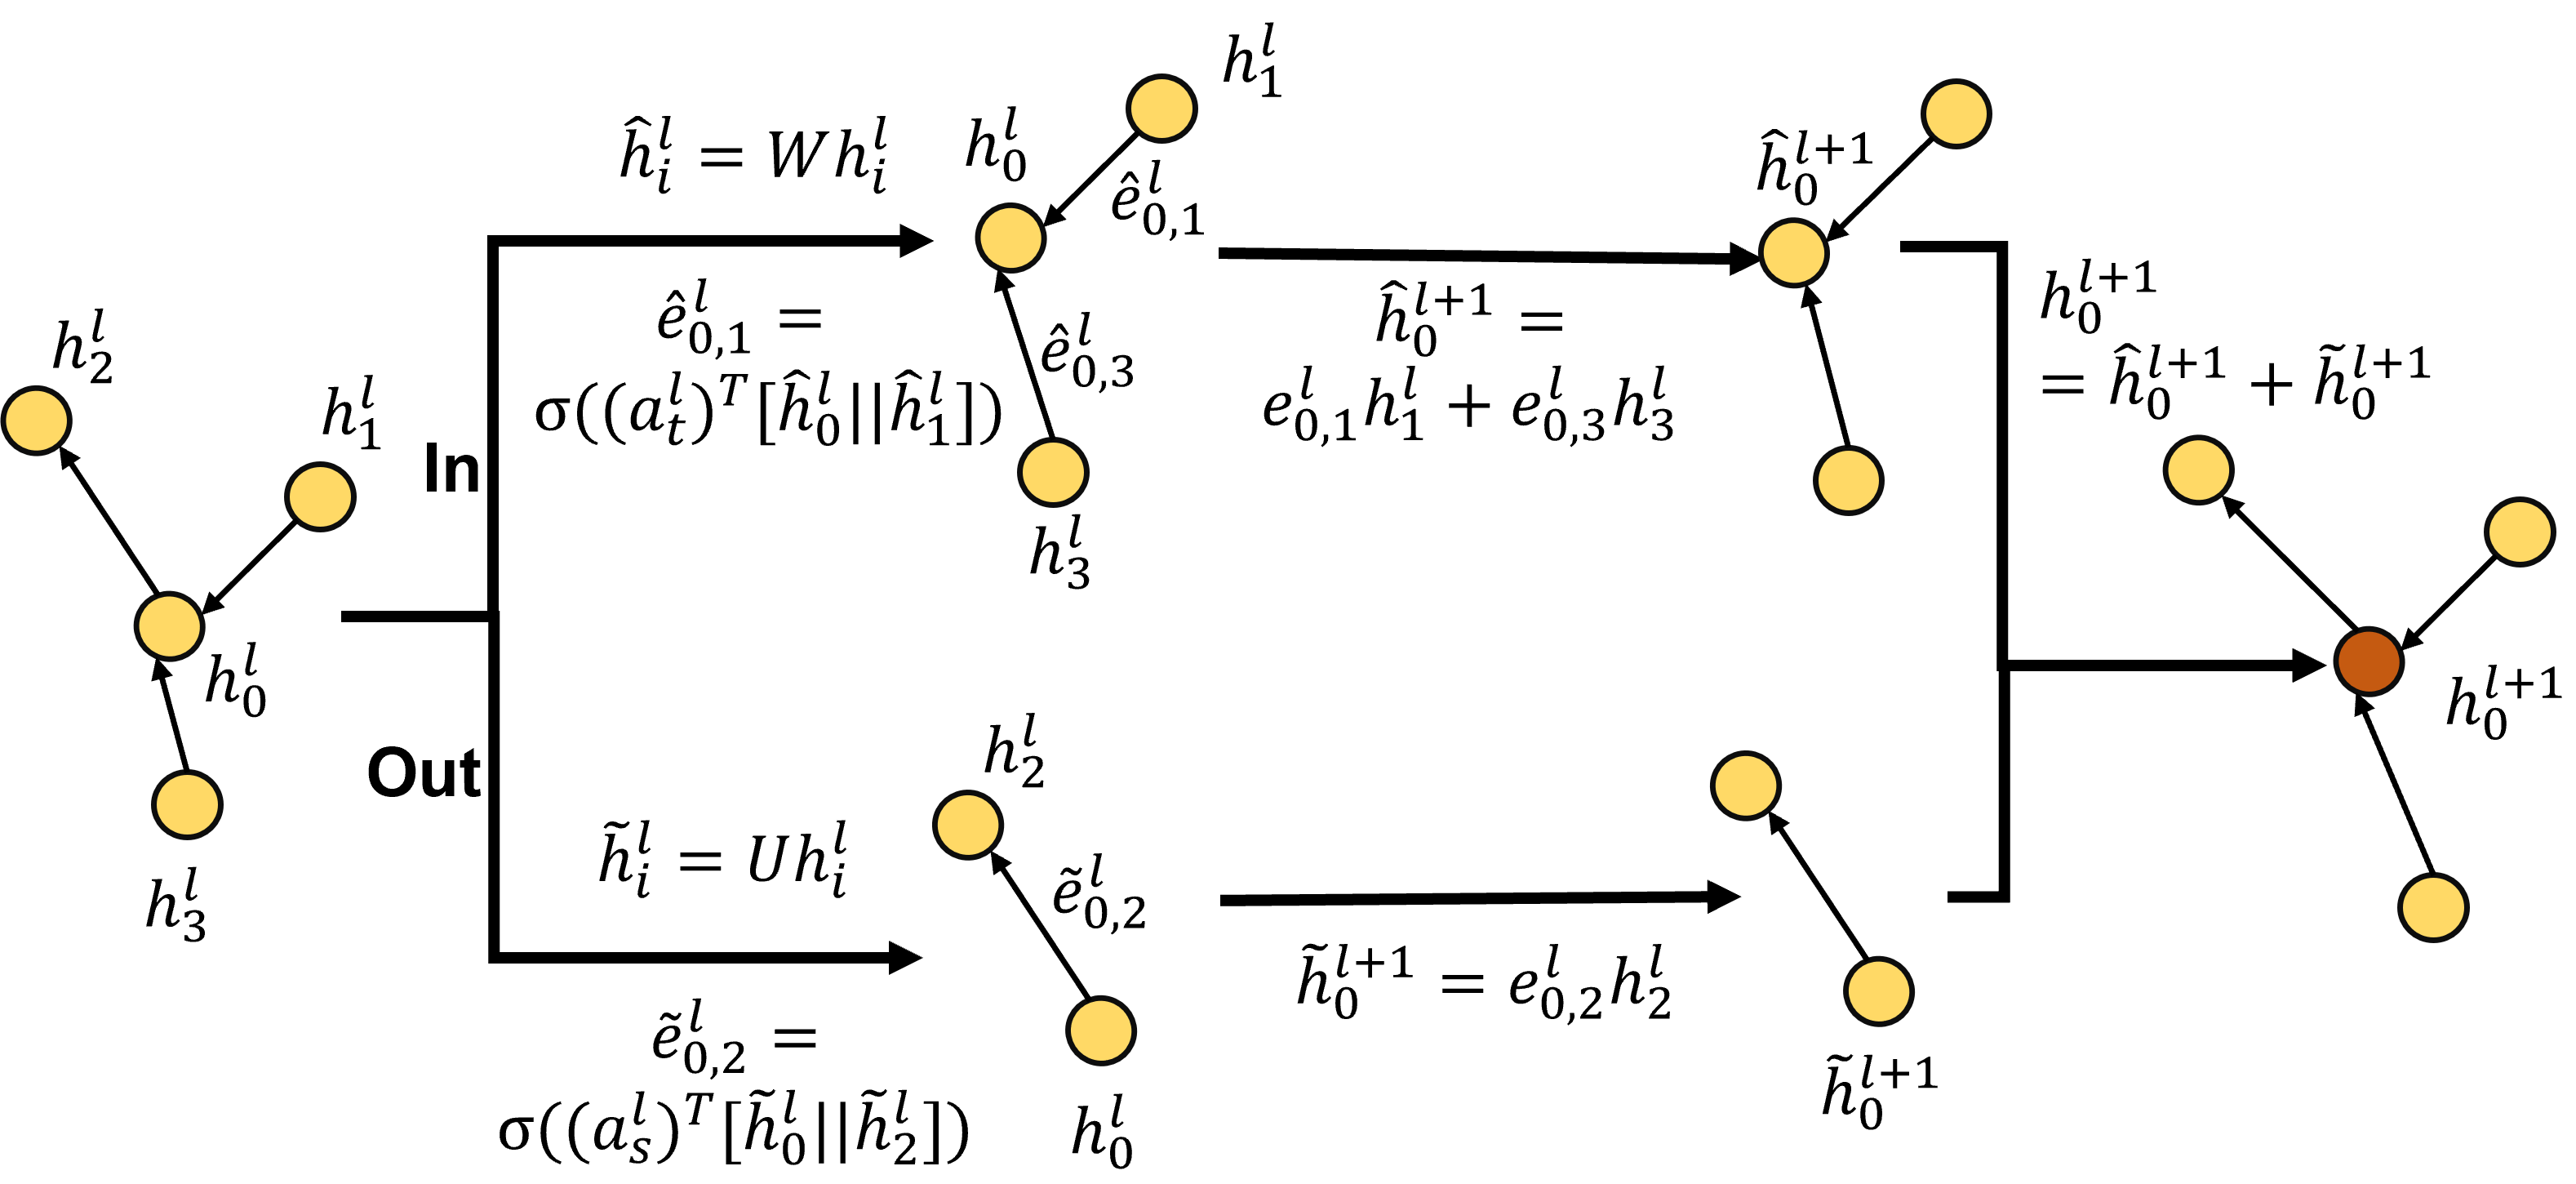
Given the representation of the node at the layer , the representation of its neighbors is , and the linear transformation before propagation is given by and for in-degree and out-degree respectively. Then, two map functions and are used to calculate the attention weights of the neighbors as follows,
| (1) |
| (2) |
where represents the concatenation operator, represents the softmax function, and and are the parameters of the inner and outer neighbor attention mechanisms. After softmaxing the attention weights of neighbors, the representation of node at level is given by Eq. 3, where and represent the set of inner and outer neighbors, respectively.
| (3) |
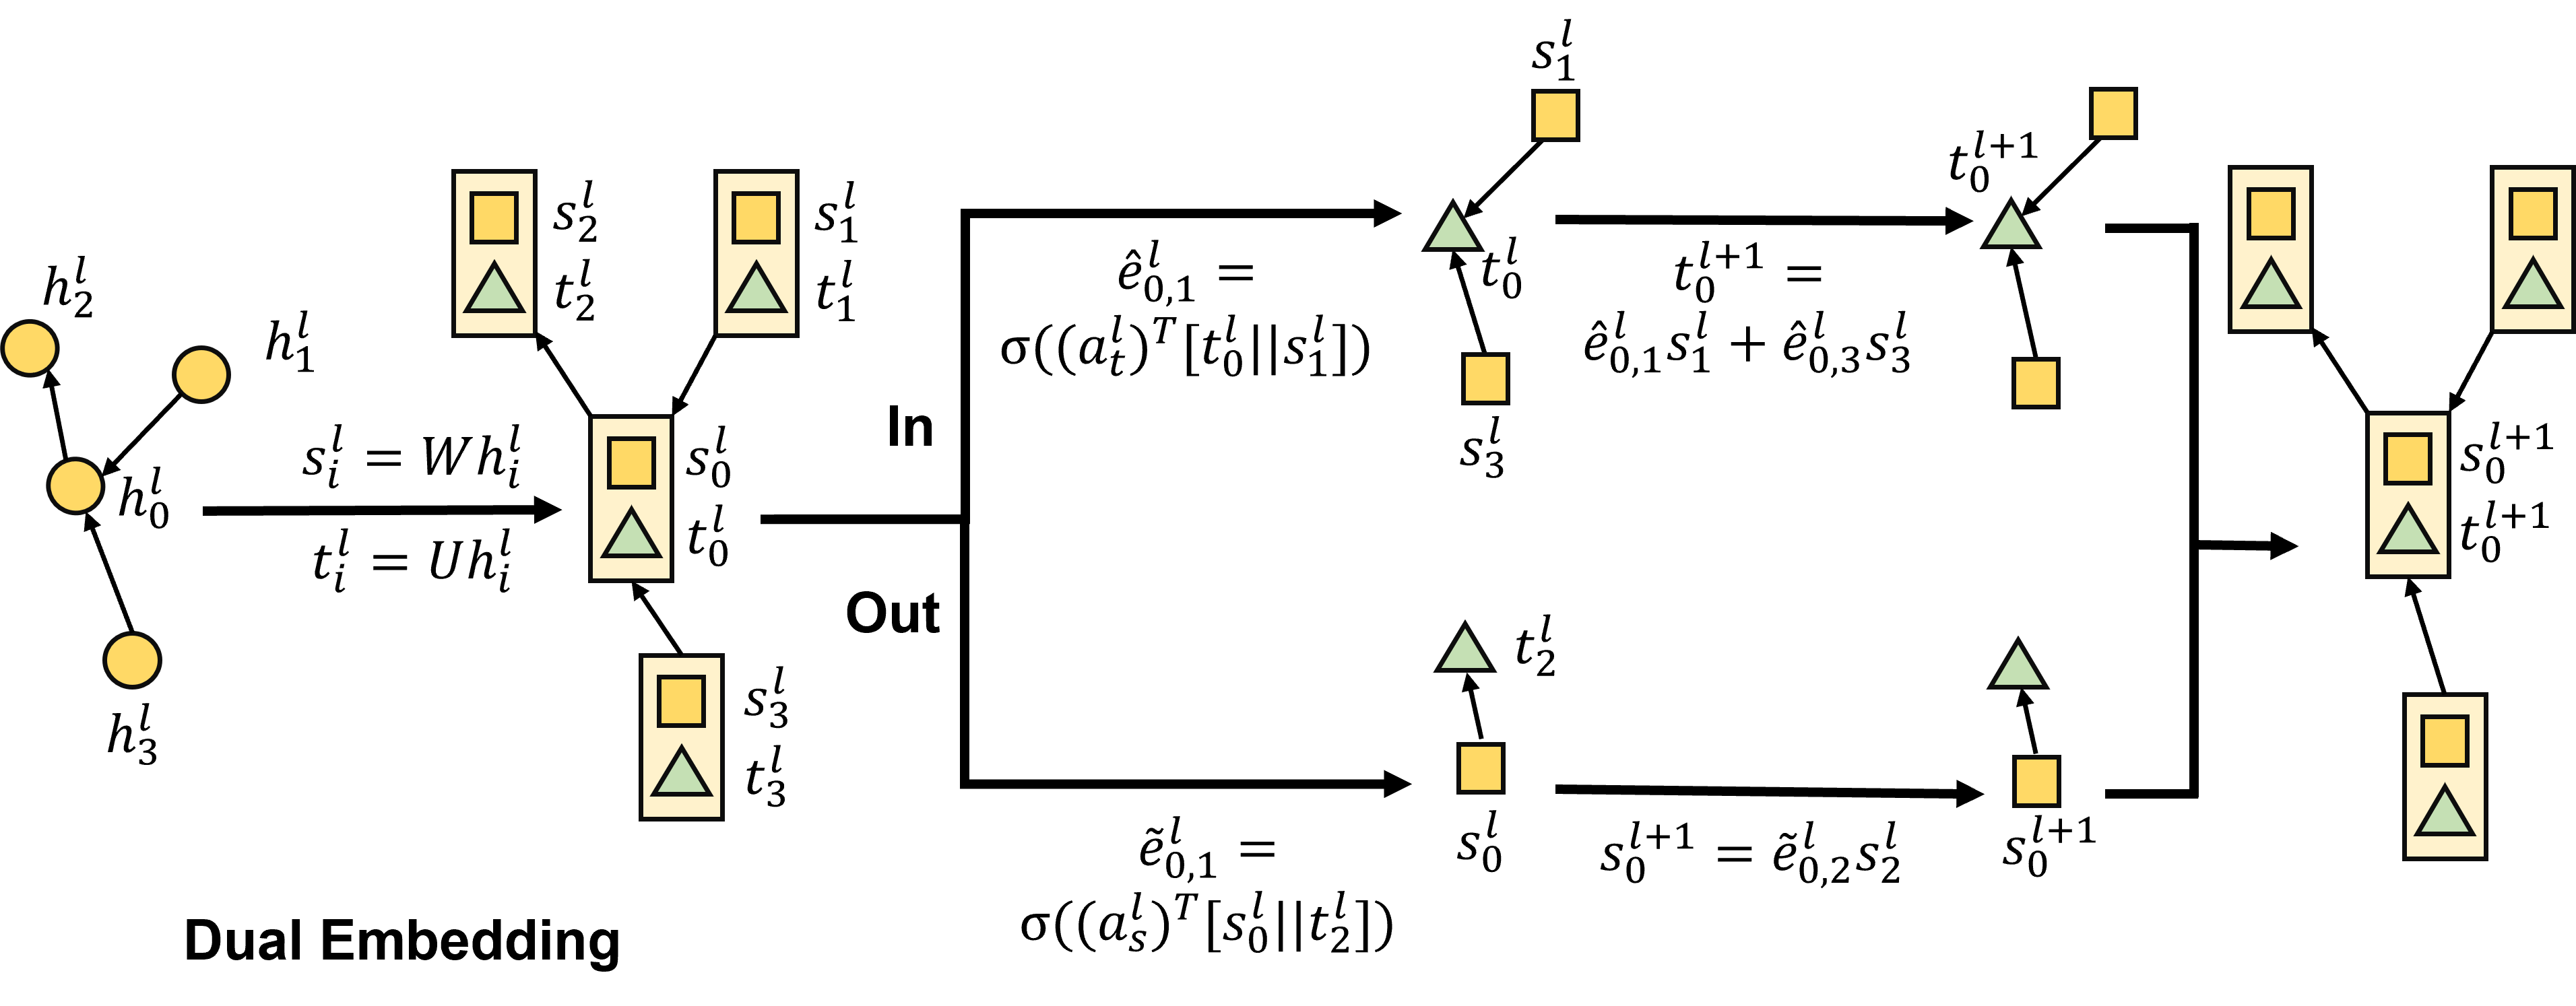
2.2. Dual Embedding of DGAT (DEDGAT)
DGAT adequately adopts in-degree and out-degree information. Nevertheless, the directivity of feature is still not taken into account. We argue that single feature cannot fully reflect the difference between input and output information. Therefore, we propose a directed attention with dual embedding model DEDGAT. As shown in Fig. 2(c) , each node consists of two representations and to extract node features of in-degree and out-degree, respectively. Before computing attention, there are two linear transformation defined as and for where and are the weights of linear layer. Second, the attention weights of in-degree and out-degree are calculated based on Eq.(4-5), where and are the parameters of the inner and outer neighbor attention mechanisms.
| (4) | ||||
| (5) |
Then, the two branches of the in-degree and out-degree attentions are aggregated respectively to generate two representations for the next layer. On the last layer , the in-degree representation and the out-degree representation are added to generate the representation of node . The added features are used to predict the network output.
2.3. Node Classification
We use two DEDGAT layer following a linear layer to conduct node classification on three financial graph datasets. Given the embedding generated by the last DEDGAT layer , the prediction for node classification is given by:
| (6) |
where denote the final linear layer.
3. Experiments
3.1. Datasets
We evaluate our approach on three directed graph datasets. Among them, the Elliptic dataset(weber2019anti, ) is to detect money laundering from transaction data, the Ant dataset is to detect financial fraud from transfer records, the DGraphFin dataset (huang2022dgraph, ) is to detect financial fraud from social networks. The Ant dataset is self-collected and others are open-sourced. Each dataset contains two categories, 0 represents normal nodes and 1 represents abnormal nodes. Optimizing node classification tasks on these datasets can help us detect financial risk. Table. 1 shows the statistics of three datasets.
| - | Elliptic | Ant | DGraphFin |
|---|---|---|---|
| Nodes | 203,769 | 1,296,486 | 3,700,550 |
| Edges | 234,355 | 1,785,844 | 4,300,999 |
| Labeled Nodes | 203,769 | 1,296,486 | 1,225,601 |
| Features | 93 | 59 | 17 |
| Classes | 2 | 2 | 2 |
3.2. Baselines and Parameter Settings
We select GAT(velivckovic2017graph, ), GCN(kipf2016semi, ), GraphSage(hamilton2017inductive, ), DGCN(ma2019spectral, ), MagNet(zhang2021magnet, ) methods for comparison. Among them, GAT, GCN and GraphSage are basic graph models, DGCN, MagNet are latest graph models designed for directed graphs.
To compare openly and transparently, we provide Tab. 2 which shows the network parameters of each GNN model used in our experiments.
| Elliptic | Ant | DGraphFin | |
| GCN | 98,306 | 63,490 | 20,482 |
| GAT | 113,696 | 78,880 | 35,872 |
| SAGE | 98,818 | 64,002 | 20,094 |
| DGCN | 620,82 | 57,730 | 52,354 |
| MagNet | 134,917 | 121,861 | 89,842 |
| DGAT | 57,892 | 40,484 | 89,160 |
| DEDGAT | 114,756 | 79,940 | 88,200 |
3.3. Implementations
We use AGL (aglpaper, ), a scalable, fault-tolerance and integrated system, with fully-functional training and inference for GNNs to train our networks. The AGL system consists of three parts, i.e., GraphFlat, GraphTrainer, GraphInfer, respectively. GraphFlat is an efficient and distributed generator based on message passing to generate K-hop neighborhoods that contains information complete subgraphs of each targeted nodes. GraphTrainer combines pipeline, pruning, and edge-partition modules to alleviate the overhead on I/O and optimize the floating point calculations during the training of GNN models. GraphInfer is a distributed inference module that splits K layer GNN models into K slices, and applies the message passing K times based on MapReduce. The three computing logics above are built on the distributed file system, CPU cluster, and MapReduce computing framework. Our AGL system, implemented on mature infrastructures, can finish the training of a 2-layer graph attention network on a directed graph with billions of nodes and hundred billions of edges in 14 hours.
3.4. Classification performance
Table. 3 shows the experimental results of each method on the node classification task. Our DEDGAT effectively improves the classification performance, achieves the best results on all three datasets.
| Elliptic | Ant | DGraphFin | |
| GCN | 91.09±0.28 | 85.18±0.57 | 70.78±0.23 |
| GAT | 95.06±0.45 | 97.43±0.24 | 76.24±0.81 |
| SAGE | 95.79±0.33 | 97.49±0.19 | 77.61±0.18 |
| DGCN | 94.48±0.60 | 94.71±0.85 | 79.58±0.15 |
| MagNet | 92.84±1.01 | 91.95±0.20 | 79.71±0.27 |
| DGAT | 95.79±0.43 | 97.92±0.31 | 80.72±0.11 |
| DEDGAT | 96.18±0.23 | 98.16±0.09 | 81.37±0.06 |
(a) GAT
(b) DGAT
(c) DEDGAT
3.5. Visualization results
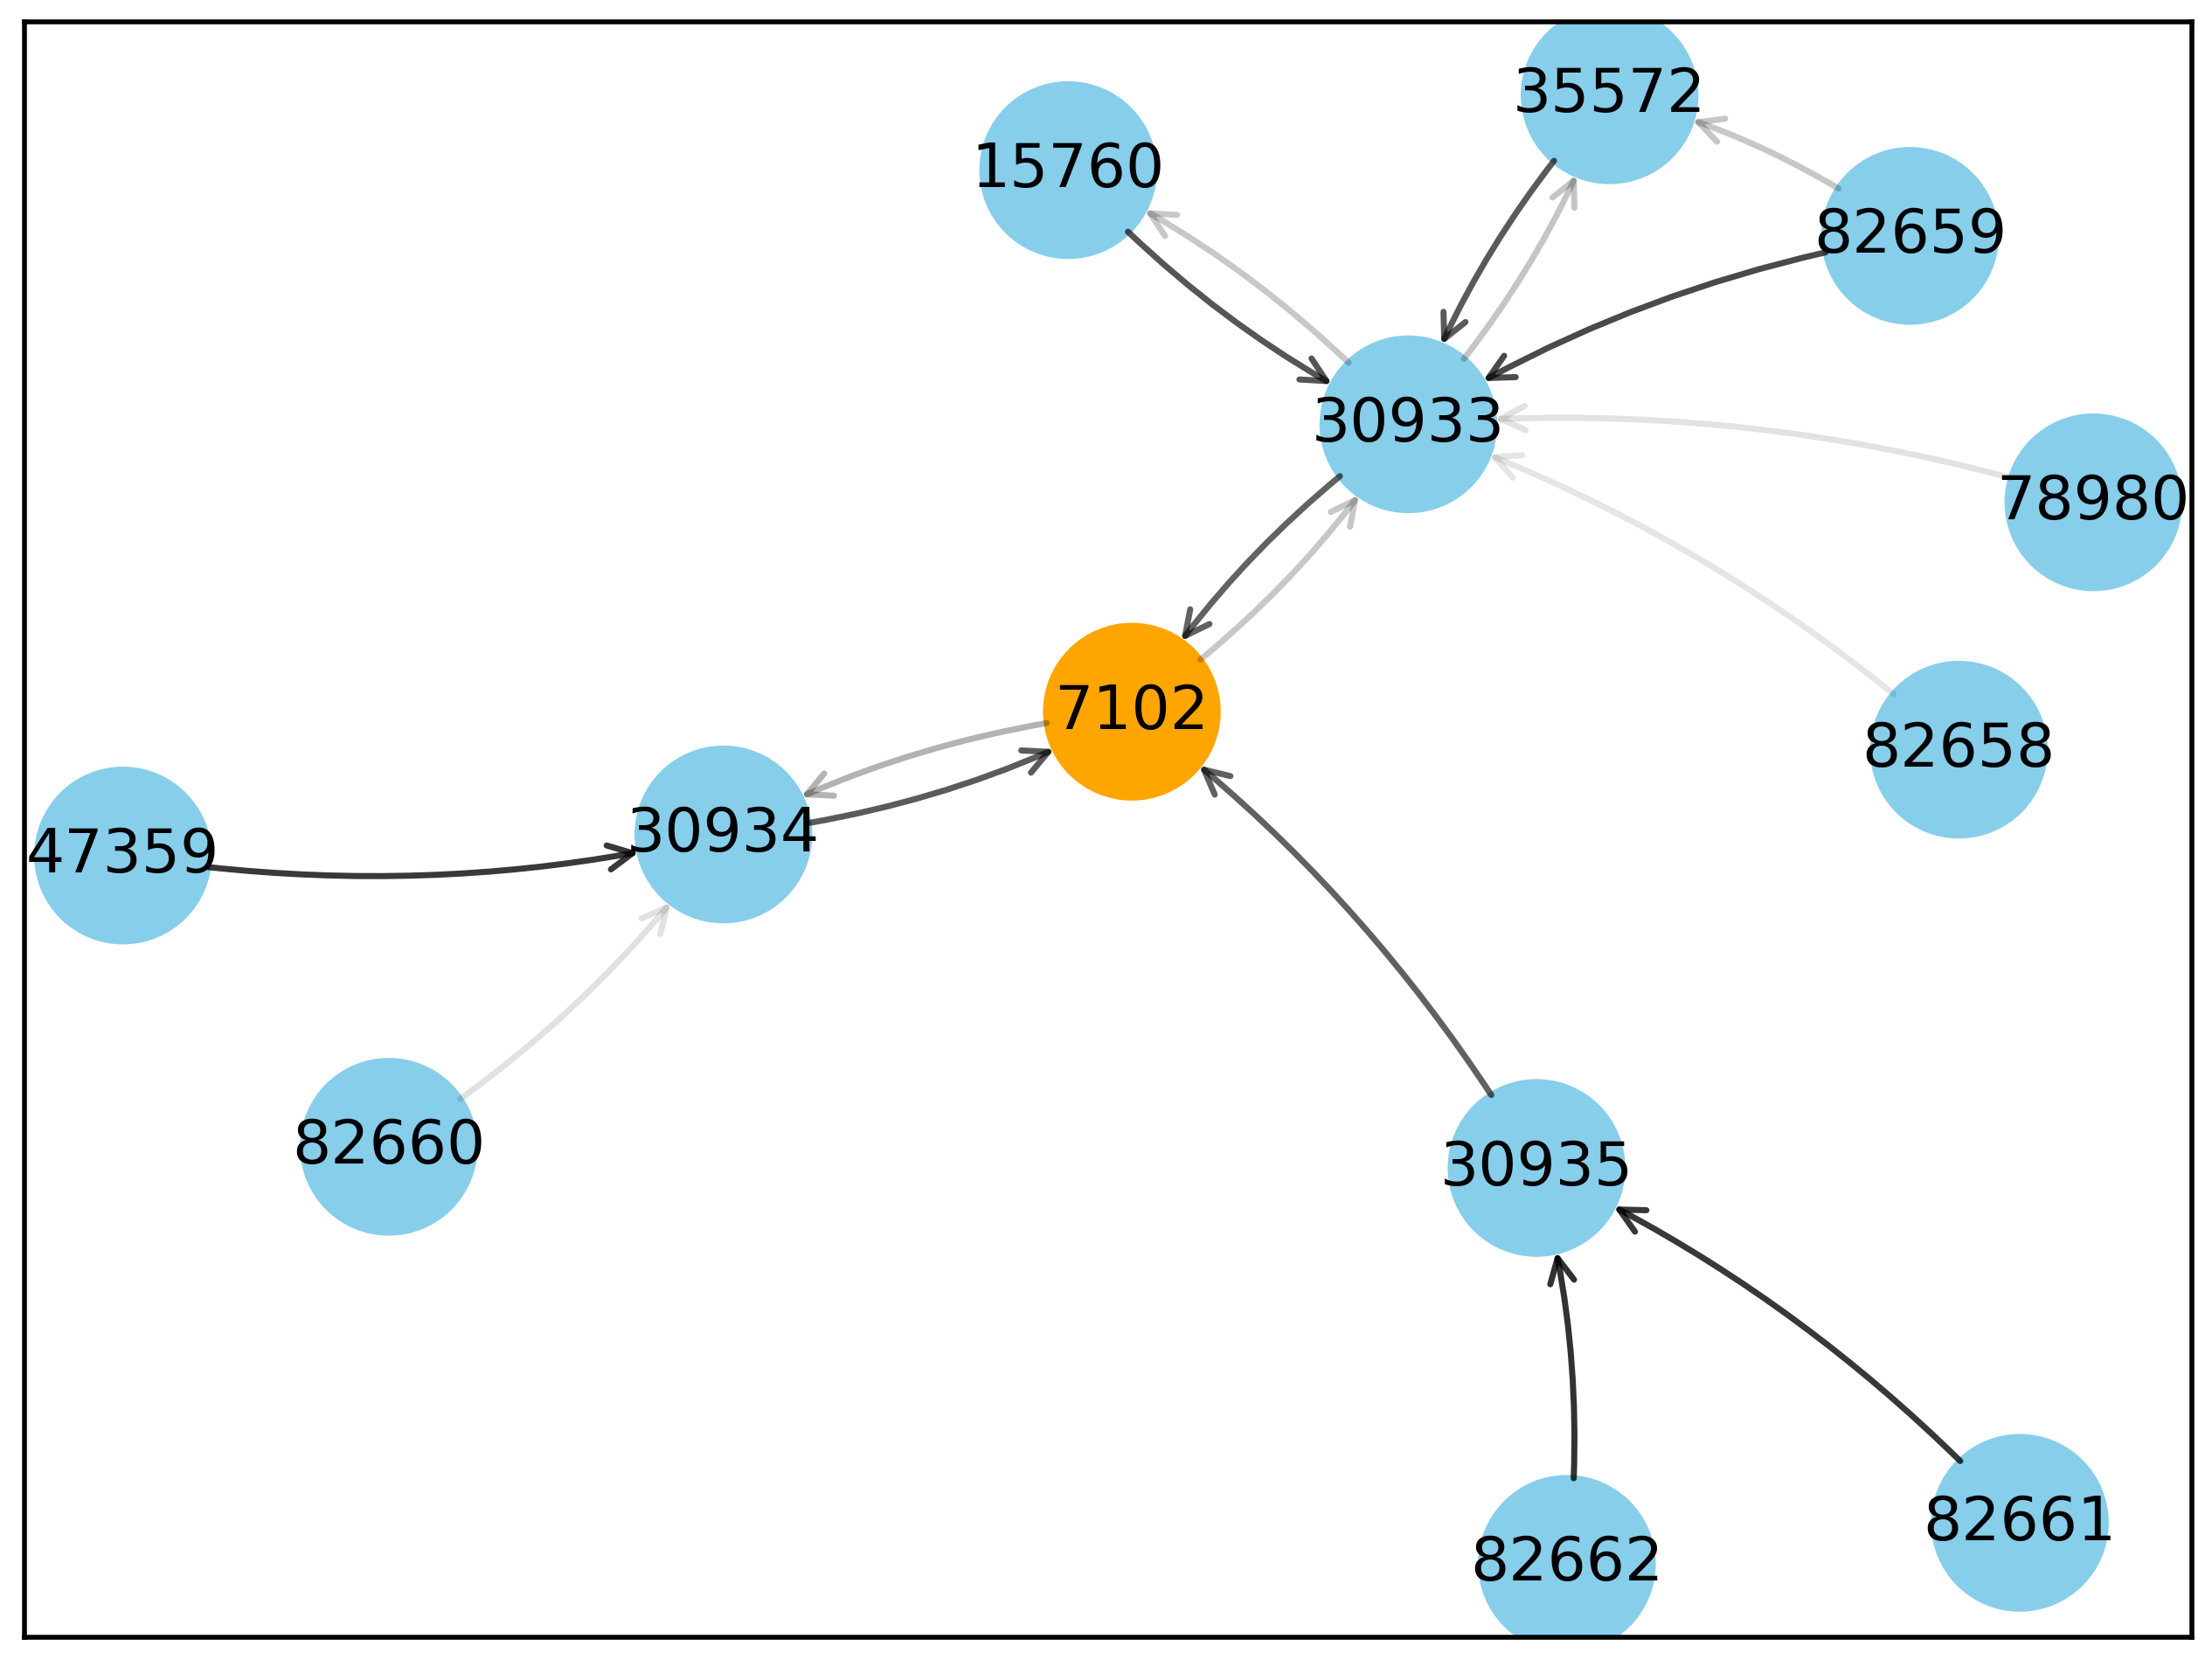
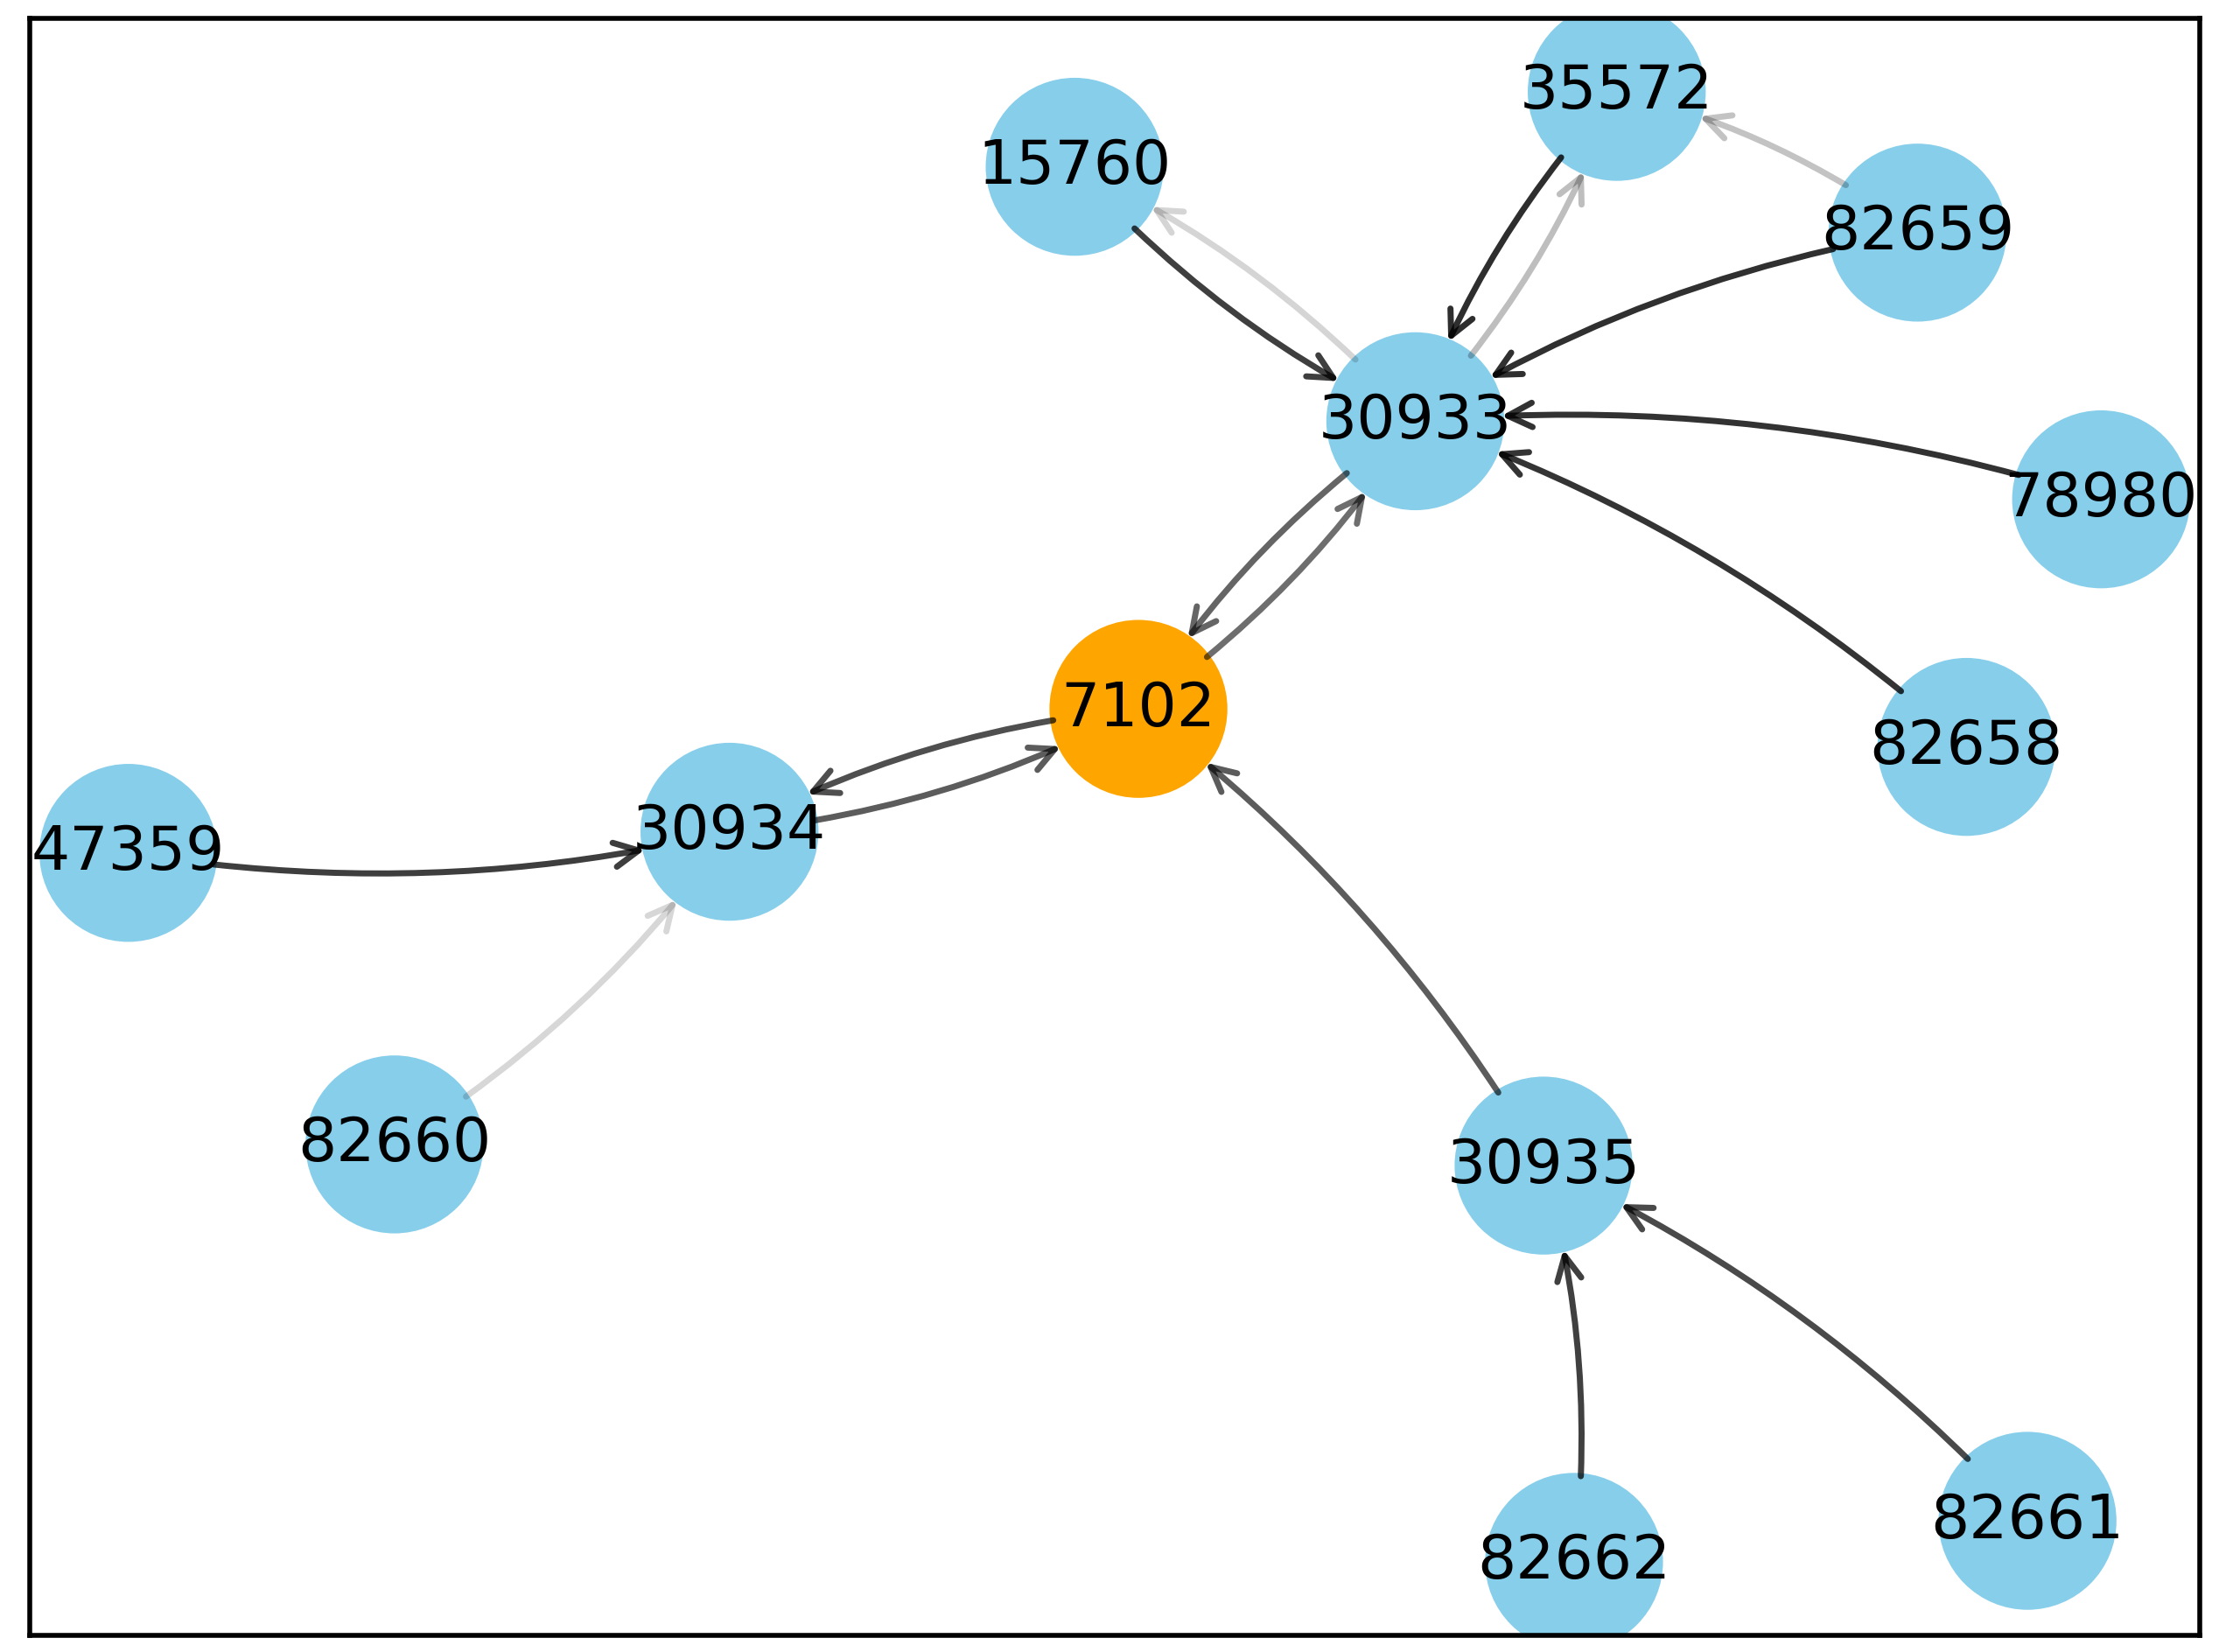
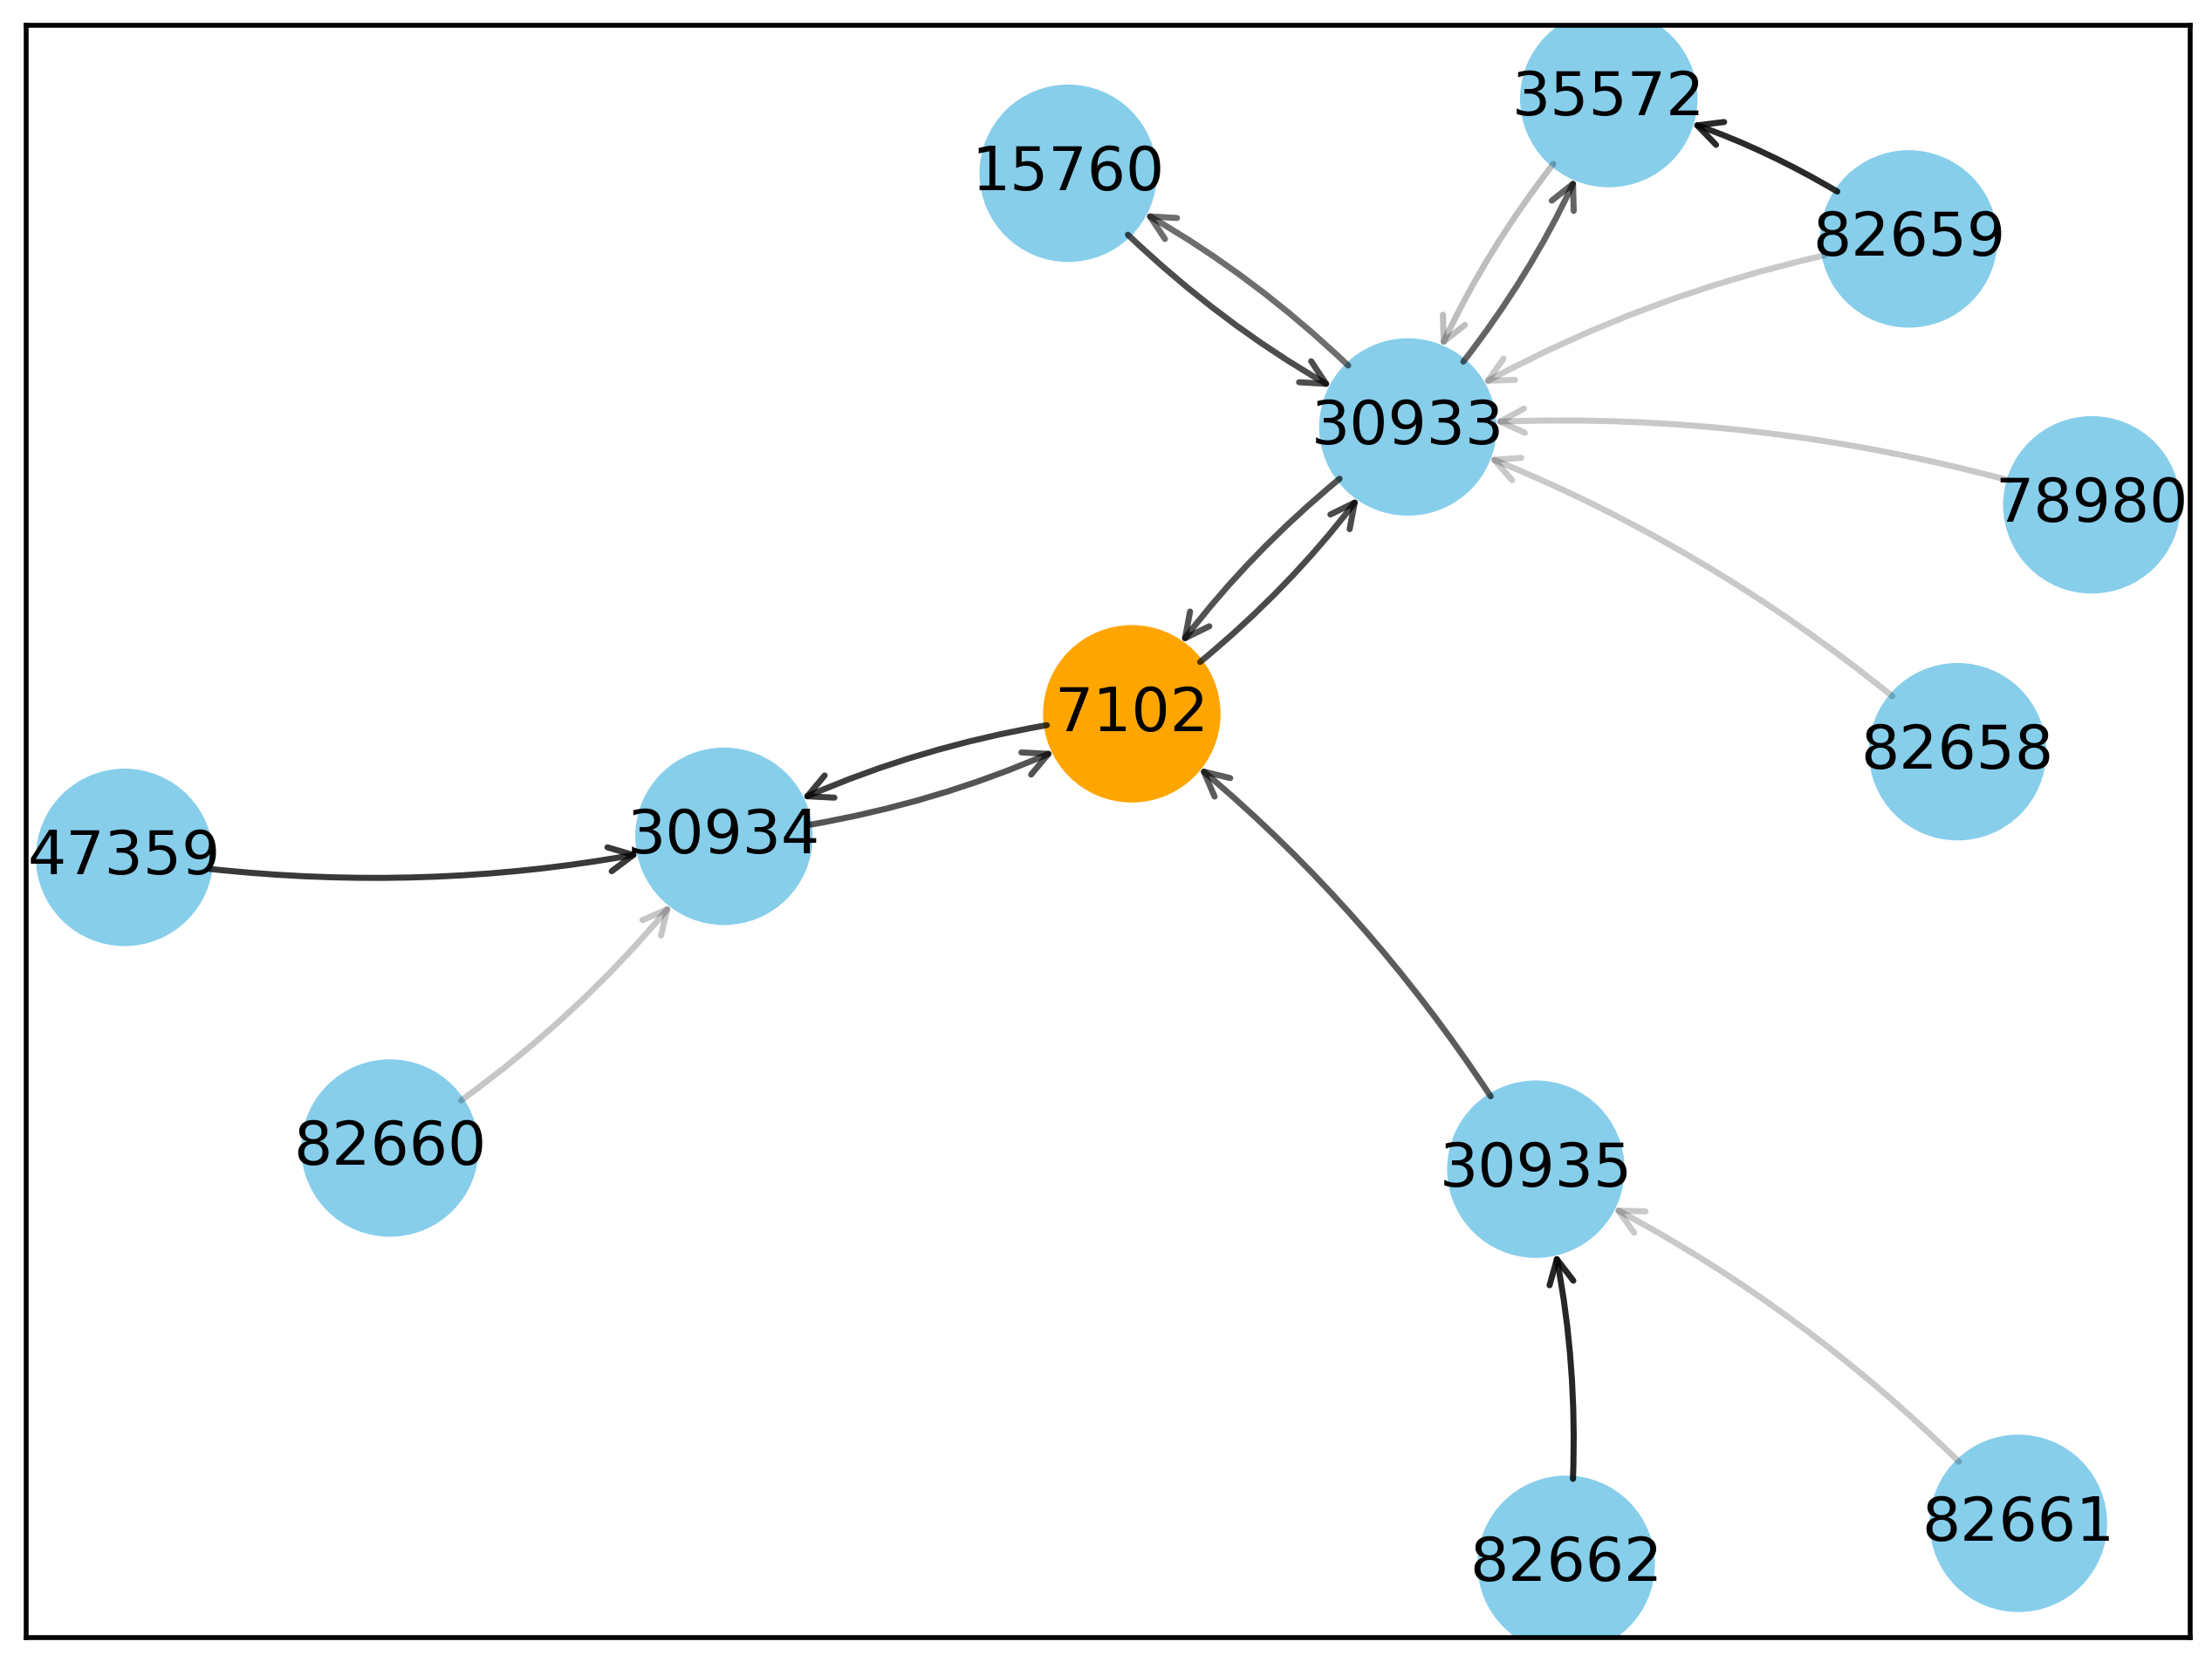
When GAT (velivckovic2017graph, ) is applied to undirected graphs, the nodes only aggregate information from the in-degree direction. In a directed graph, edge represent the out-degree edge of node i and the in-degree edge of node j. GAT implicitly uses out-degree information based on the directional symmetry. In the directional context of digraph, GAT-like methods which implicitly fuse out-degree information cannot generalize well to the recognition scene of directed graphs. However, Our method explicitly separates the out-degree and in-degree information for calculation, and introduces dual embedding in DEDGAT to emphasize the idea of separation. The purpose of discrete modeling is to alleviate the in-degree bias that exists in GAT.
GNNExplainer (ying2019gnnexplainer, ) is a graph interpreter, it outputs the importance score of each edge in graph model. To verify the validity of the directionality we introduced, we use GNNExplainer to visualize the aggregation process of three methods : GAT, DGAT and DEDGAT. As Fig. 3 shows (Darker edges mean higher importance): GAT underutilizes the four out-degree edges 7102 30934, 7102 30933 , 30933 1576 and 30933 35572; In contrast, our DGAT resorts to two out-degree edges 7102 30934 and 7102 30933 ; DEDGAT steps futher and leverages all four edges which ignored by GAT.
We traverse the Ant dataset to provide global statistics result(Fig. 1) for and ,where and are defined as follows:
| (7) |
where represents the number of hops from node i to the central risk node. S is defined as , where is from GNNExplainer, i.e., . Here, is the indicative function
| (8) |
where A is the adjacency matrix of the directed graph G.
(a) GAT
(b) DGAT
(c) DEDGAT
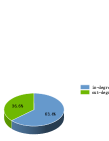
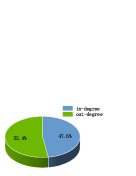
As shown in Fig. 1, GAT relies excessively on the in-degree information, but out-degree edges are under exploited; Benefiting from DGAT and DEDGAT’s separate calculation of in-degree and out-degree, both in-edges and out-edges are assigned approximate weights. We set threshold to 0.5 and count those in-degree and out-degree edges whose weights are larger than the threshold(these edges are important in the graph convolution). Statistics results are shown in Fig. 4: GAT emerges a sharp in-degree information bias. But DGAT and DEGAT keep the in-degree and out-degree information on a balance level.
4. Conclusion
In this paper, we have proposed a directed graph attention network (referred to as DGAT) to explicitly calculate in-degree and out-degree representation of a directed graph to tackle the problem of directional bias, such as the weight important distribution shown in Fig. 2(a) for graph attention network (GAT) (velivckovic2017graph, ). In order to better distinguish the in-degree and out-degree node representation of the directed graph, we split each node into in-degree and out-degree nodes. A dual embedding of DGAT model (named as DEDGAT) is further proposed to separately calculate the node representations of the incoming and outgoing degrees, respectively. Both DGAT and DEDGAT can effectively solve the problem of the directional bias of GAT. Also, DEDGAT achieves the best performance on the three financial risk control datasets. Visualization results by GNNExplainer (ying2019gnnexplainer, ) demonstrate the importance of directionality for financial risk control tasks.
References
- (1) Hamilton, William L and Ying, Rex and Leskovec, Jure. Inductive representation learning on large graphs.. Proceedings of the 31st International Conference on Neural Information Processing Systems, 1025–1035, 2017.
- (2) Yang, Bo. Construction of logistics financial security risk ontology model based on risk association and machine learning.. Safety Science. Vol123, pages 104437, 2020.
- (3) Ma, Xiaomeng and Lv, Shuliang. Financial credit risk prediction in internet finance driven by machine learning.. Neural Computing and Applications. Vol 31, pages 8359–8367, 2019.
- (4) Aziz, Saqib and Dowling, Michael. Machine learning and AI for risk management.. Disrupting finance. pages 33–50, 2019.
- (5) Li, Nan and Liang, Xun and Li, Xinli and Wang, Chao and Wu, Desheng Dash. Network environment and financial risk using machine learning and sentiment analysis.. Human and Ecological Risk Assessment. vol15, pages 227–252, 2009.
- (6) Perozzi, Bryan and Al-Rfou, Rami and Skiena, Steven. Deepwalk: Online learning of social representations.. Proceedings of the 20th ACM SIGKDD international conference on Knowledge discovery and data mining, pages 701–710, 2014.
- (7) Grover, Aditya and Leskovec, Jure. node2vec: Scalable feature learning for networks.. Proceedings of the 22nd ACM SIGKDD international conference on Knowledge discovery and data mining, pages 855–864, 2016.
- (8) Tang, Jian and Qu, Meng and Wang, Mingzhe and Zhang, Ming and Yan, Jun and Mei, Qiaozhu. Line: Large-scale information network embedding.. Proceedings of the 24th international conference on world wide web, pages 1067–1077, 2015.
- (9) Weber, Mark and Domeniconi, Giacomo and Chen, Jie and Weidele, Daniel Karl I and Bellei, Claudio and Robinson, Tom and Leiserson, Charles E. Anti-money laundering in bitcoin: Experimenting with graph convolutional networks for financial forensics.. arXiv preprint arXiv:1908.02591, 2019.
- (10) Ma, Yi and Hao, Jianye and Yang, Yaodong and Li, Han and Jin, Junqi and Chen, Guangyong. Spectral-based graph convolutional network for directed graphs.. arXiv preprint arXiv:1907.08990, 2019.
- (11) Zhang, Xitong and He, Yixuan and Brugnone, Nathan and Perlmutter, Michael and Hirn, Matthew. Magnet: A neural network for directed graphs.. Advances in Neural Information Processing Systems, vol 34, pages 27003–27015, 2021.
- (12) Veličković, Petar and Cucurull, Guillem and Casanova, Arantxa and Romero, Adriana and Lio, Pietro and Bengio, Yoshua. Graph attention networks.. arXiv preprint arXiv:1710.10903, 2017.
- (13) Kipf, Thomas N and Welling, Max. Semi-supervised classification with graph convolutional networks.. arXiv preprint arXiv:1609.02907, 2016.
- (14) Ying, Zhitao and Bourgeois, Dylan and You, Jiaxuan and Zitnik, Marinka and Leskovec, Jure. Gnnexplainer: Generating explanations for graph neural networks.. Advances in neural information processing systems, vol 32, 2019.
- (15) Huang, Xuanwen and Yang, Yang and Wang, Yang and Wang, Chunping and Zhang, Zhisheng and Xu, Jiarong and Chen, Lei and Vazirgiannis, Michalis. DGraph: A Large-Scale Financial Dataset for Graph Anomaly Detection.. Thirty-sixth Conference on Neural Information Processing Systems Datasets and Benchmarks Track, 2022.
- (16) Zhang, Dalong and Huang, Xin and Liu, Ziqi and Zhou, Jun and Hu, Zhiyang and Song, Xianzheng and Ge, Zhibang and Wang, Lin and Zhang, Zhiqiang and Qi, Yuan. AGL: A Scalable System for Industrial-Purpose Graph Machine Learning.. Proc. VLDB Endow. pages 3125–3137, 2020.