X-ray Unveiling Events in a Active Galactic Nucleus in the 7 Ms Chandra Deep Field-South
Abstract
We investigate the extreme X-ray variability of a active galactic nucleus in the 7 Ms Chandra Deep Field-South (XID 403), which showed two significant X-ray brightening events. In the first event, XID 403 brightened by a factor of in rest-frame days in the observed-frame 0.5–5 keV band. The event lasted for –7.3 days, and then XID 403 dimmed by a factor of in days. After –2.5 years in the rest frame (including long observational gaps), it brightened again with the 0.5–5 keV flux increasing by a factor of . The second event lasted over 251 days and the source remained bright until the end of the 7 Ms exposure. The spectrum is a steep power law (photon index ) without obscuration during the second outburst, and the rest-frame 2–10 keV luminosity reaches ; there is no significant spectral evolution within this epoch. The infrared-to-UV spectral energy distribution of XID 403 is dominated by the host galaxy. There is no significant optical/UV variability and -band (rest-frame Å) brightening contemporaneous with the X-ray brightening. The extreme X-ray variability is likely due to two X-ray unveiling events, where the line of sight to the corona is no longer shielded by high-density gas clumps in a small-scale dust-free absorber. XID 403 is probably a high-redshift analog of local narrow-line Seyfert 1 galaxies, and the X-ray absorber is a powerful accretion-disk wind. On the other hand, we cannot exclude the possibility that XID 403 is an unusual candidate for tidal disruption events.
1 Introduction
X-ray emission appears ubiquitous from active galactic nuclei (AGNs), and it is considered largely to originate from the accretion-disk corona in the vicinity of the central supermassive black hole (SMBH). X-ray photons are produced from inverse-Compton scattering of the optical and ultraviolet (UV) accretion-disk photons by the coronal relativistic electrons (e.g., Liang & Price, 1977; Sunyaev & Titarchuk, 1980; Haardt & Maraschi, 1991; Done, 2010; Gilfanov & Merloni, 2014; Fabian et al., 2017). Observations find that the X-ray radiation of radio-quiet AGNs is related to their optical/UV radiation, and the relation is typically expressed as a negative correlation between the optical-to-X-ray power-law slope parameter ()111, where and are the rest-frame 2 keV and 2500 Å flux densities. and monochromatic luminosity () across a broad range of AGN luminosities (e.g., Steffen et al., 2006; Just et al., 2007; Grupe et al., 2010; Lusso & Risaliti, 2016; Pu et al., 2020; Timlin et al., 2020b).
X-ray variability is also a characteristic property of AGNs. Observations of X-ray variability in large samples of AGNs have revealed that the typical long-term X-ray variability amplitude is (e.g., Grupe et al., 2001; Paolillo et al., 2004; Vagnetti et al., 2011; Gibson & Brandt, 2012; Yang et al., 2016; Falocco et al., 2017; Maughan & Reiprich, 2019) with significant dependencies upon luminosity and other factors. Such X-ray variability is generally attributed to disk/corona instabilities or small fluctuations of the SMBH accretion rate. Strong X-ray variability events with flux varying by factors of are rare (Yang et al., 2016; Timlin et al., 2020b), and they require additional mechanisms for interpretation. Possible scenarios include change of accretion rate (e.g., LaMassa et al., 2015; MacLeod et al., 2016, 2019), change of obscuration (e.g., Matt et al., 2003; Ni et al., 2020), and tidal disruption events (TDEs; e.g., Gezari 2021), and they correspond to three different types of phenomena, i.e., substantial intrinsic variability of the disk/corona, variability of an external X-ray absorber, and transient events.
AGN radiation strength is directly linked to the accretion rate. Thus a large change of the accretion rate naturally results in strong optical/UV and X-ray continuum variability. Such variability is often accompanied by broad emission-line variability (e.g., ) and the X-ray spectrum generally shows no signs of obscuration. An example is SDSS J015957.64003310.5 reported by LaMassa et al. (2015), which displayed an optical spectral transition from a type 1 quasar to a type 1.9 AGN (no broad line) from 2000 to 2010. The corresponding Eddington ratio ()222/, where is the bolometric luminosity, is the Eddington luminosity, and is the SMBH mass. dropped from to . The serendipitous X-ray observations by XMM-Newton in 2000 and Chandra in 2005 revealed that the 2–10 keV flux dropped by a factor of with no clear evidence of X-ray obscuration (LaMassa et al., 2015).
In the scenario of change of obscuration, the X-ray absorber has variable covering factor and/or column density, resulting in strong X-ray variability. Such changes are usually identified by characteristic changes of the X-ray spectral shape along with the strong flux variations (e.g., Turner & Miller, 2009; Yang et al., 2016; Li et al., 2019). Previously, most of these events were found in type 2 AGNs (e.g., Guainazzi, 2002; Risaliti et al., 2002; Puccetti et al., 2004; Risaliti et al., 2010; Rivers et al., 2011; Braito et al., 2013; Markowitz et al., 2014; Marinucci et al., 2016; Hickox & Alexander, 2018; Jana et al., 2022), where the variable absorber might be the gas “clumps” in the dusty torus or the broad-line region (BLR). More recently, there have also been reports of type 1 AGNs and quasars with strong X-ray obscuration variability (e.g., Miniutti et al., 2009; Saez et al., 2012; Nanni et al., 2018; Liu et al., 2019; Ni et al., 2020; Timlin et al., 2020a, b; Liu et al., 2021, 2022). There was no contemporaneous strong optical/UV continuum or emission-line variability, and these AGNs generally have high accretion rates (e.g., Liu et al., 2019, 2021; Ni et al., 2020). One interpretation is that the dust-free absorber is a clumpy accretion-disk wind launched via radiation pressure (e.g., Baskin et al., 2014; Matthews et al., 2016; Giustini & Proga, 2019).
TDEs may cause strong X-ray variability in both AGNs and inactive galaxies (e.g., Komossa, 2015; Saxton et al., 2021; Gezari, 2021; Zabludoff et al., 2021). The transient accretion process of a TDE could produce luminous X-ray emission that decays roughly following the mass fallback rate of the stellar debris with a typical timescale of months-to-years (e.g., Saxton et al., 2021). TDEs are generally found in inactive galaxies. There are only a few AGN TDE candidates proposed (e.g., Brandt et al., 1995; Merloni et al., 2015; Zhang et al., 2019; Liu et al., 2020; Ricci et al., 2020; Zhang, 2021), as it is generally more difficult to identify TDEs in AGNs due to the luminous persistent AGN radiation (e.g., Zabludoff et al., 2021).
In this paper, we present X-ray and multiwavelength analyses of an unusual source that showed extreme X-ray variability (0.5–2 keV flux variation factor ) in the 7 Ms Chandra Deep Field-South (CDF-S). It was identified as XID 403 in the Luo et al. (2017) X-ray source catalog. This paper is organized as follows. The basic source properties and the X-ray data are described in Section 2. Section 3 presents the X-ray light curve, X-ray spectral analysis, optical/UV variability analysis, and multiwavelength properties. In Section 4, we discuss possible explanations for the extreme X-ray variability of XID 403. We summarize our results in Section 5. Throughout this paper, we use a Galactic hydrogen column density of (HI4PI Collaboration et al., 2016) toward the direction of XID 403. Uncertainties and upper/lower limits are quoted at 1 and 90% confidence levels, respectively. We adopt a cosmology with , , and (Planck Collaboration et al., 2020).
2 Basic object properties and X-ray Data
2.1 Basic source properties and classification
XID 403 was first reported by Luo et al. (2014) as a TDE candidate due to its X-ray brightening and previous non-detection. Its basic X-ray properties were then presented in the 7 Ms CDF-S source catalog (Luo et al., 2017). The J2000 X-ray position is , with a positional uncertainty of 0.38″. The off-axis angle is 6.80′, and the number of net source counts over the entire exposure is in the 0.5–7 keV band. The source appears soft, as it was not detected in the 2–7 keV band considering the entire exposure (net counts at a 90% confidence level).
The extreme X-ray variability of XID 403 has also been noted in other previous studies. Its X-ray light curve was presented in Zheng et al. (2017), and it was considered a TDE candidate. In Paolillo et al. (2017), it was reported to have an extremely large excess variance () compared to other CDF-S sources with similar X-ray counts.
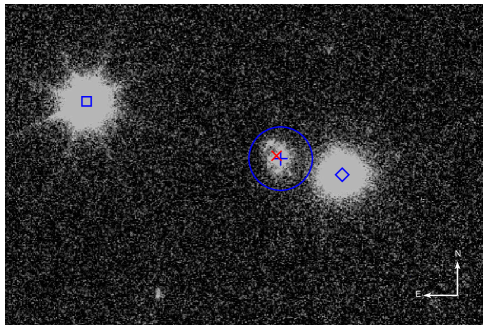
The optical counterpart of XID 403 is a galaxy (centroid , ) that is 0.16″ away from the X-ray position. A Hubble Space Telescope (HST) -band image is shown in Figure 1, and the host galaxy is slightly extended. Considering the X-ray position uncertainty of 0.38″, XID 403 is consistent with being located at the center of the host galaxy. The host has AB magnitudes of , , and . To the southwest, there is a brighter galaxy at with a separation of only 1.9″; its -band flux is 5.7 times higher than that of the XID 403 host (Straatman et al., 2016). This nearby galaxy is not an X-ray source, but it may affect the optical or near-infrared (NIR) measurements of the host properties.
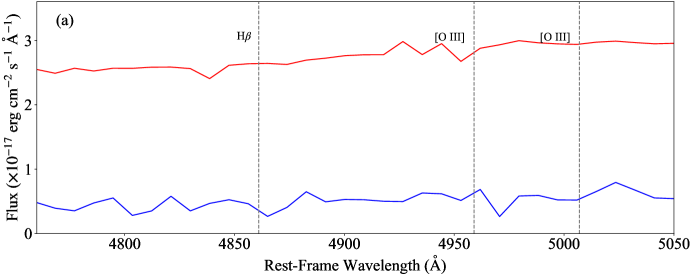
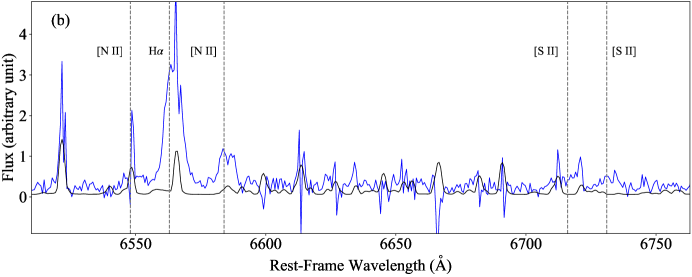
From a Keck/MOSFIRE NIR spectrum of the host galaxy, which shows clear H, [N II], and [S II] narrow emission lines, Trump et al. (2013) identified a spectroscopic redshift of . Combining this spectrum and a NIR spectrum from the HST Wide Field Camera 3 (WFC3) G141 slitless grism observation obtained as a part of the 3D-HST survey (Brammer et al., 2012; Momcheva et al., 2015), which covers the H and [O III] lines, Trump et al. (2013) also proposed that the object is a Seyfert 2 galaxy based on the classic “BPT” and “VO87” emission-line diagnostics (Baldwin et al., 1981; Veilleux & Osterbrock, 1987). The 3D-HST spectrum (Momcheva et al., 2015) and the Keck/MOSFIRE spectrum (Trump et al., 2013) are plotted in Figure 2. The 3D-HST spectrum has a low spectral resolution (), and it is severely contaminated by the overlapping spectrum of the nearby galaxy. Therefore, the H and [O III] measurements are highly uncertain. Thus, the Seyfert 2 classification proposed by Trump et al. (2013) is unreliable.
We examine the Keck/MOSFIRE spectrum for AGN signatures. We fit this spectrum using the the Python package PyQSOFit (e.g., Guo et al., 2019; Shen et al., 2019; Wang et al., 2019). The best-fit full width at half-maximum (FWHM) of the H line profile is , significantly smaller than the broad-line criteria (e.g., ). The best-fit [N II]/H value is , consistent with the measurement () in Trump et al. (2013). The rest-frame equivalent width of H is Å. These do not satisfy the AGN criterion based on the versus [N II]/H (WHAN) diagnostics ([N II]/H and Å; e.g., Cid Fernandes et al. 2011). Therefore, there is no clear AGN signature in the available NIR spectra of this high-redshift faint galaxy.
Nevertheless, XID 403 appears to be a luminous X-ray source. At , its rest-frame 0.5–7 keV luminosity reaches over the entire 7 Ms exposure (Luo et al. 2017; updated to the spectroscopic redshift). Such a large amount of power should originate from SMBH accretion. Thus XID 403 is either an AGN or associated with TDEs.
2.2 X-ray Data
With a co-added Chandra depth of 7 Ms, the CDF-S is the deepest X-ray survey to date (Luo et al., 2017; Xue, 2017). The X-ray data consist of 102 observations collected by the Chandra Advanced CCD Imaging Spectrometer imaging array (ACIS-I; Garmire et al., 2003). We use the cleaned event files from Luo et al. (2017) for data analyses. For a given observation or observational epoch (described below), we use ACIS Extract (AE; Broos et al. 2010) to extract the X-ray source counts in the full band (0.5–5 keV), soft band (0.5–2 keV), and hard band (2–5 keV). We adopt an upper energy bound of 5 keV because the X-ray spectrum of XID 403 is very soft and the keV spectrum is dominated by background. In the source rest frame, the full band corresponds to the 1.3–13 keV band, probing the hard X-rays. We use the binomial no-source probability ( ; e.g., Broos et al. 2007; Xue et al. 2011; Luo et al. 2013, 2015; Xue et al. 2016) calculated by AE to determine the significance of the source signal in each band. We adopt = 0.01 as the detection threshold; this is appropriate for a source with a pre-specified position. If , we consider the source detected and provide measurements of the source counts. The 1 uncertainties of the counts are computed following the Gehrels (1986) approach. If , we consider the source undetected and provide a 90% confidence-level upper limit on the source counts using the Bayesian approach described in Kraft et al. (1991).
XID 403 was significantly detected in the latest 3 Ms exposure of the 7 Ms CDF-S. To investigate if the source was detected in any of the previous observations, we examine the values in each observation of the first 4 Ms exposure. We find one observation (observation ID 8595) in the second Ms exposure, in which XID 403 was significantly detected in both the full and soft bands with corresponding values of 0.001 and 0.0004, respectively. The first 4 Ms exposure consists of 54 individual observations, and the expected number of false detections with is estimated to be . Therefore, we consider the source marginally detected (at a significance level) in this observation. We also check the observations adjacent to observation ID 8595. Although they do not provide individual detections, we find that combining the two observations prior to observation ID 8595 (observations IDs 8593 and 8597) leads to a more robust detection. XID 403 was significantly detected in all three bands in the combined observation, with values of , , and 0.009 in the full, soft, and hard bands, respectively. The expected number of false detections with from such a combined observation (combined from three consecutive observations) is estimated to be [], corresponding to a significance level.333We also investigate via simulations whether the significance enhancement (from to ) is due to background fluctuations in the two additional observations. We assume that these two observations contain only background counts, and we simulate the extracted counts by drawing randomly from their respective Poisson distributions (similar to the method described in Section 3.1 below). The resulting fraction of cases where the full-band value in the combined observations reaches is only 0.0049. This indicates that the significance enhancement is unlikely due to background fluctuations. The probability of XID 403 not being detected in either observation ID 8595 or the combined observation is thus (the former term for the detection in observation ID 8595 being spurious plus the significance enhancement from the combined observation being also spurious and the latter term for the detection in the combined observation being spurious), still corresponding to detection significance. This combined observation is thus used in our following analyses.
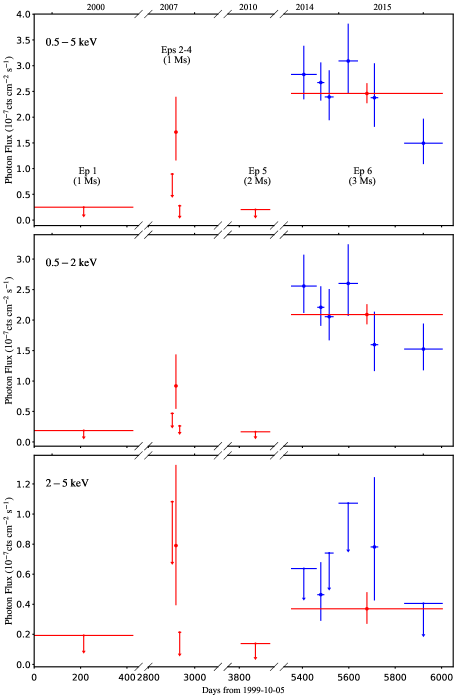
In order to investigate X-ray variability, we group the X-ray data into 6 epochs according to the X-ray flux states and observational dates. The 11 observations in the first Ms exposure are combined as epoch 1. In the second Ms exposure, the three observations before observation ID 8593 are combined as epoch 2, observation IDs 8593, 8597, and 8595 are combined as epoch 3, and the six observations after observation ID 8595 are combined as epoch 4. We note that the second Ms exposure was performed within months, and thus epoch 2–4 are close in time, allowing us to investigate the rapid variability for epoch 3 (see Section 3.1 below). The 31 observations in the third and fourth Ms exposures are combined as epoch 5. The 48 observations in the latest 3 Ms of exposure are combined as epoch 6. In epochs 1, 2, 4, and 5, XID 403 was not detected in any of the three bands in either the individual observations or the combined observations. In epochs 3 and 6, the source was detected in all three bands. The basic information and X-ray photometric properties for the six epochs are listed in Table 1. To investigate shorter-term X-ray variability in epoch 6, we further divide epoch 6 into six subepochs with comparable exposure times. The subepoch information is shown in Table 2.
To assess the spectral shapes, we derive for epoch 3, epoch 6, and the subepochs of epoch 6. Assuming a simple power-law spectrum that is modified by the Galactic absorption, we derive values from the band ratios, defined as the ratio between the hard-band and soft-band net counts, following the approach described in Section 4.4 of Luo et al. (2017). XSPEC (v12.11.1; Arnaud 1996) and the spectral response files are used in this procedure. For the epochs/subepochs where XID 403 is detected in both the soft and hard bands, the uncertainties were propagated from the uncertainties of the net counts. If XID 403 is detected in only the soft band but not the hard band, we derive a lower limit on from the upper limit on the band ratio. The constraints are listed in Tables 1 and 2.
XID 403 has been covered by other Chandra and XMM-Newton surveys. We match the position of XID 403 to the Ms depth XMM deep survey in the CDF-S (XMM-CDFS) source catalog (Ranalli et al., 2013), the 250 ks depth Chandra extended CDF-S (E-CDF-S) catalog (Lehmer et al., 2005; Xue et al., 2016), and the ks depth XMM-Spitzer Extragalactic Representative Volume Survey (XMM-SERVS) catalog (Ni et al., 2021), and XID 403 was not detected in any of these surveys. The XMM-CDFS consists of 33 observations. The first 8 observations have a total exposure of Ms, and they were performed between epochs 1 and 2. The latter 25 observations with a total exposure of Ms were performed between epochs 4 and 5. The flux upper-limit constraints from the Ms and Ms XMM-Newton exposures are not as stringent as those of epoch 1 and epoch 5, which have Ms and Ms Chandra exposures, respectively. The E-CDF-S observations were performed between epochs 1 and 2, and the effective exposure time is lower than those of epochs 1 and 2. Thus, the non-detection is not constraining either. XID 403 probably remained in a low state during the E-CDF-S and XMM-CDFS observations, and thus it was not detected. The XMM-SERVS observations were carried out after epoch 6. The non-detection of XID 403 indicates a 0.5–10 keV flux upper limit of , which is times larger than the epoch 6 flux (derived from the epoch 6 spectral fitting; see Section 3.2 below). Thus the XMM-SERVS survey does not provide useful constraints either due to its shallower depth. We do not use these X-ray data in the following analyses.
3 X-ray and Multiwavelength Properties
3.1 X-ray Light Curve
| Full Band (0.5–5 keV) | Soft Band (0.5–2 keV) | Hard Band (2–5 keV) | |||||||||
|---|---|---|---|---|---|---|---|---|---|---|---|
| Epoch | Obs. ID | Obs. Date | Time | Exposure | Net | Photon | Net | Photon | Net | Photon | |
| Number | Range | Range | Interval | Time (ks) | Counts | Flux | Counts | Flux | Counts | Flux | |
| (1) | (2) | (3) | (4) | (5) | (6) | (7) | (8) | (9) | (10) | (11) | (12) |
| 1 | 441–2409 | 1999-10-15–2000-12-16 | 0–428 | 931 | – | ||||||
| 2 | 8591–9718 | 2007-09-20–2007-10-03 | 2897–2910 | 138 | – | ||||||
| 3 | 8593–8597 | 2007-10-06–2007-10-19 | 2913–2926 | 222 | |||||||
| 4 | 8592–9596 | 2007-10-22–2007-11-04 | 2929–2942 | 600 | – | ||||||
| 5 | 12043–12234 | 2010-03-18–2010-07-22 | 3807–3933 | 1956 | – | ||||||
| 6 | 16176–18730 | 2014-06-09–2016-03-24 | 5351–6005 | 2881 | |||||||
Note. — Column (1): epoch number. Column (2): range of the Chandra observation IDs; the observations were not carried out following strictly the order of the observation IDs, and thus a later epoch might contain smaller observation IDs. Column (3): range of the observation start date. Column (4): time interval in units of days, starting from the beginning of the CDF-S observations. Column (5): total exposure time in units of ks. Columns (6), (8), and (10): full-, soft-, and hard-band net source counts; for non-detections, 90% confidence-level upper limits are given. Columns (7), (9), and (11): full-, soft-, and hard-band photon fluxes in units of ; for non-detections, 90% confidence-level upper limits are given.
| Full Band (0.5–5 keV) | Soft Band (0.5–2 keV) | Hard Band (2–5 keV) | |||||||||
|---|---|---|---|---|---|---|---|---|---|---|---|
| Subepoch | Obs. ID | Obs. Date | Time | Exposure | Net | Photon | Net | Photon | Net | Photon | |
| Number | Range | Range | Interval | Time (ks) | Counts | Flux | Counts | Flux | Counts | Flux | |
| (1) | (2) | (3) | (4) | (5) | (6) | (7) | (8) | (9) | (10) | (11) | (12) |
| 1 | 16180–17417 | 2014-06-09–2014-09-28 | 5351–5462 | 445 | |||||||
| 2 | 16175–17542 | 2014-10-01–2014-10-31 | 5465–5495 | 826 | |||||||
| 3 | 16186–17556 | 2014-11-02–2014-12-09 | 5497–5534 | 513 | |||||||
| 4 | 16179–17573 | 2014-12-31–2015-03-24 | 5556–5639 | 295 | |||||||
| 5 | 16191–16461 | 2015-05-19–2015-06-20 | 5695–5727 | 304 | |||||||
| 6 | 16185–18730 | 2015-10-10–2016-03-24 | 5839–6005 | 496 | |||||||
Note. — The same as Table 1, but for the six subepochs in epoch 6.
To construct X-ray light curves of XID 403, we calculate the X-ray photon flux (PF) in each band and each epoch/subepoch as follows (e.g., Yang et al., 2016; Ding et al., 2018):
| (1) |
The uncertainty of PF is computed as:
| (2) |
In the above formulas, and are the numbers of background-subtracted counts (i.e., net counts) and its uncertainty (Tables 1 and 2). is the effective area calculated by AE, and it is the product of the mirror geometric area, reflectivity, off-axis vignetting, and detector quantum efficiency. is the exposure time. is the PSF fraction of the source region (). For the non-detections, the corresponding PF upper limits are computed. The PF constraints are listed in Tables 1 and 2.
Figure 3 displays the full-, soft- and hard-band light curves. In the full and soft bands, XID 403 was only detected in epoch 3, epoch 6, and all the subepochs of epoch 6. In epochs 1 and 2, it was in a low state. In epoch 3, the source brightened to an intermediate state; the separation between the median dates of epochs 2 and 3 is 6.1 days in the rest frame. XID 403 then returned to a low state in epoch 4; the separation between epochs 3 and 4 is also 6.1 rest-frame days. The duration of the outburst is to 7.3 rest-frame days, where the lower bound is derived from the epoch 3 exposure time and the upper bound is computed from the end time of epoch 2 to the start time of epoch 4. We note that the duration is constrained directly from the epoch 2–4 light curve (Figure 3), and it does not necessarily represent the actual timescale of the outburst.444For example, epoch 2 could potentially belong to the rise phase of a longer-duration outburst but the X-ray non-detection hampers its identification. In epoch 5, XID 403 was still in a low state. In epoch 6, XID 403 brightened to a high state; the start time of the brightening is uncertain, which could be as early as the end time of epoch 5. The source remains bright until the end of epoch 6; thus, the epoch 6 outburst has a duration of rest-frame days. We also estimate the time separation between the epoch 3 and epoch 6 outbursts, which has a range of to 2.5 rest-frame years, where the lower bound is computed from the start time of epoch 4 to the end time of epoch 5 and the upper bound is from the end time of epoch 3 to the start time of epoch 6. Considering the long observational gaps between epochs 4 and 5 and between epochs 5 and 6, there could have been additional outbursts missed by the 7 Ms CDF-S, and thus the separation between the epoch 3 and epoch 6 outbursts does not necessarily reflect the separation of outbursts in general. The outburst properties are summarized in Table 3.
To compare the PF measurements to the upper limits in different epochs, we adopt a Monte Carlo approach. For each epoch, we generate the probability density function (PDF) for the net source counts via Monte Carlo simulations of Poisson distributions for the extracted source and background counts. The counts PDFs are then converted to the PF PDFs, and the 90% confidence-level lower limit on the flux variation factor between two epochs is then determined from the PDF of the ratio of the two PFs. Compared to epoch 2, the epoch 3 full- and soft-bands PF increased by factors of and , respectively. In the hard-band, the epoch 3 PF is not larger than the epoch 2 PF at the 90% confidence level. Compared to epoch 3, the epoch 4 full-, soft-, and hard-bands PF decreased by factors of , , and , respectively. Compared to epoch 5, the epoch 6 PF increased by factors of , , in the full, soft, and hard bands, respectively. The brightening is more significant if considering subepoch 1 compared to epoch 5, with the PF increasing by a factor of in the full band ( in the soft band). The full-band variability factors are summarized in Table 3. Such large X-ray flux variability factors are rare among typical AGN populations (e.g., Yang et al., 2016; Timlin et al., 2020b), making XID 403 an exceptional object.
| Rise Time | Duration | Decay Time | Flux State | Var. Factor aa Full-band PF variability factor. For the epoch 3 outburst, it is for the decay phase. | |
|---|---|---|---|---|---|
| Epoch 3 | days | –7.3 daysbbThe duration of the epoch 3 outburst is constrained directly from the epoch 2–4 light curve (Figure 3), and it does not necessarily represent the actual timescale of the outburst (e.g., see Footnote 4). | days | Intermediate | |
| Separation: yearscc Separation between epochs 3 and 6, there could have been additional outbursts missed by the 7 Ms CDF-S. | |||||
| Epoch 6 | – | days | – | High | |
We examine if there is significant flux variability within epoch 6. We utilize the approach (e.g., Young et al. 2012; Yang et al. 2016; Paolillo et al. 2017; Ding et al. 2018) to quantify the X-ray variability. The values of the epoch 6 light curves are calculated as follows :
| (3) |
where is the combined epoch 6 PF. The full-band value is 6.6 and the soft-band value is 5.1. To determine the significance of any PF variability, we use Monte Carlo simulations to estimate the probability () that the computed value is generated from the PF distribution of a constant intrinsic PF () modified by Poisson noise (e.g., Paolillo et al., 2004; Ding et al., 2018). Given the value, we compute the model source and background counts in each subepoch. Then we simulate the observed source and background counts by drawing randomly from their respective Poisson distributions (see detailed description in Section 3.1 of Ding et al. 2018). We derive the simulated net counts and their uncertainties following the same procedure described in Section 2.2, and calculate the corresponding PF and values. We perform 10 000 simulations and obtain 10 000 simulated values. The probability is computed as the fraction of the simulations where the simulated value is larger than the observed value. We obtain the values of 0.21 () and 0.33 () for the full and soft bands, respectively. These indicate that the observed values are likely due to Poisson fluctuations, and there is no significant flux variability within epoch 6.
In epoch 6, the spectral shape is very soft, with a value of . We investigate if there is variability of the X-ray spectral shape within epoch 6. We compare the constraints in the six subepochs. The two measurements in subepochs 2 and 5 are consistent with each other within the uncertainties, and they also agree with the upper-limit constraints in the other subepochs. Thus there is no apparent spectral shape evolution within epoch 6.
3.2 X-ray Spectral Analysis
| Epoch | Model | ||||||||
|---|---|---|---|---|---|---|---|---|---|
| Number | (keV) | ||||||||
| 3 | phabs*zpowerlw | – | – | – | 22/17 | ||||
| 6 | phabs*zpowerlw | – | – | – | 132/141 | ||||
| 6 | phabs*zbbody | – | – | – | 142/141 | ||||
| 6 | phabs*(zbbody+zpowerlw) | 2.0 (fixed) | – | 129/140 | |||||
| 3 | phabs*zphabs*zpowerlw | (fixed) | 7.4 (fixed) | – | – | – | – | 24/18 | |
| 3 | phabs*zpowerlw | (fixed) | – | – | – | 25/18 |
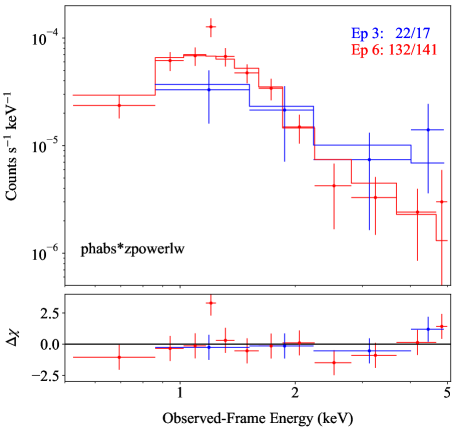
We perform spectral analysis for the epoch 3 and epoch 6 data using XSPEC (v12.11.1; Arnaud 1996). The source and background spectra of individual observations are extracted with AE, and they are then merged into the epoch 3 and epoch 6 spectra. The spectra are grouped using grppha so that each bin contains at least one count. We use the XSPEC W statistic555https://heasarc.gsfc.nasa.gov/docs/xanadu/xspec/manual/XSappendixStatistics.html. for spectral fitting. We use a simple power-law model modified by the Galactic absorption (phabs*zpowerlaw) to fit the keV spectra. The best-fit results and the derived luminosities are listed in Table 4. The X-ray spectra with the best-fit models are displayed in Figure 4. The best-fit results are overall acceptable, considering the fitting statistics ( in Table 4) and the fitting residuals.
In epoch 3, the spectral shape and normalization have large uncertainties due to the limited number of counts. The best-fit is ; such a small value might indicate the presence of X-ray obscuration. The resulting is , and the rest-frame 2–10 keV luminosity () is . The luminosity uncertainties are propagated from the uncertainty of the power-law normalization.
In epoch 6, the best-fit photon index is in the rest-frame 1.3–13 keV band. The resulting value is . The best-fit is larger than those commonly observed in type 1 AGNs (a mean value of ; e.g., Scott et al. 2011; Liu et al. 2017). It is even larger than those of typical super-Eddington accreting AGNs (e.g., Marlar et al., 2018; Huang et al., 2020), suggesting a high accretion rate (e.g., Shemmer et al., 2008). The steep spectral shape also indicates that the X-ray emission in epoch 6 is likely unobscured. Adding an intrinsic absorption component (zphabs) does not improve the fit, and we obtain an upper limit of for the intrinsic . We also try to fit the epoch 6 spectrum with a cutoff power-law model (phabs*zcutoffpl) and examine if the photon index becomes smaller. The cutoff energy is loosely constrained. The value is still large (), even if we fix the cutoff energy to a small value of 15 keV.
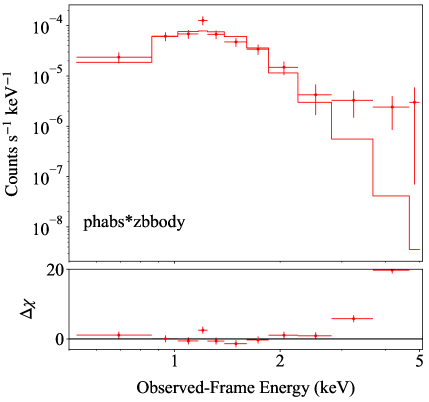
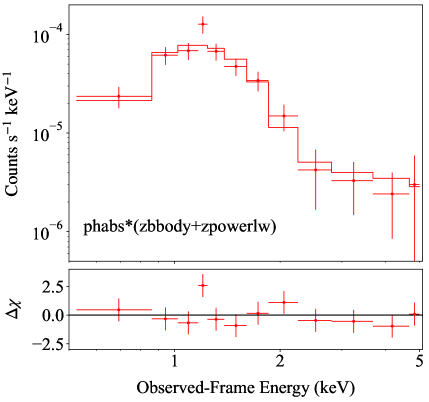
The X-ray spectra of typical TDEs can be described with a simple black-body model with temperatures of eV (e.g., Saxton et al., 2021). We thus test a black-body model (phabs*zbbody) to fit the epoch 6 spectrum. The best-fit temperature is keV with a value of 142/141. The best-fit results are shown in Table 4 and the left panel of Figure 5. This model describes well the observed-frame keV spectrum, but there is significant excess emission above observed-frame keV energies. We then add an additional power-law component [phabs*(zbbody+zpowerlw)] to fit the high-energy excess. The best-fit results are overall acceptable (), with a temperature of and of . Since is loosely constrained, we fix it to 2.0, and the best-fit temperature becomes . The best-fit results are shown in Table 4 and the right panel of Figure 5. Nevertheless, the best-fit temperatures () from these models are times larger than typical TDE temperatures ( eV; Saxton et al. 2021).
We also break the epoch 6 spectrum into two segments to investigate if there is any spectral evolution. The first segment consists of the first three subepochs and the second segment consists of the last three subepochs. We fit the two spectra with the simple power-law model. The best-fit parameters are and norm = for segment 1 with , and they are and norm = for segment 2 with . Thus there is no apparent spectral evolution. This result is consistent with the lack of variability determined from the photometric analysis in Section 3.1.
3.3 Optical Variability and R-band Light Curve
We first search several multi-epoch optical photometric catalogs for any optical variability of XID 403, including the PAN-STARRS1 (DR2; Chambers et al. 2016), the Dark Energy Survey (DES DR2; Abbott et al. 2021), the Zwicky Transient Facility (ZTF DR9; Masci et al. 2019), the Catalina Real-Time Transient Survey (CRTS DR2; Drake et al. 2012), and the Hubble Catalog of Variables (HCV; Bonanos et al. 2019). XID 403 is only present in the HCV. The HCV light curves of XID 403 cover a period from 2002 to 2012, and they show only mild potential optical variability in the , , , and F814W bands. We apply the Villforth et al. (2010) method (similar to the method used for the X-ray data in Section 3.1) and investigate if we can identify XID 403 as an AGN based on the variability. The resulting values and the corresponding null-hypothesis probabilities (ranging from ) for the HCV light curves are not sufficiently high to meet the AGN selection criterion (e.g., as in Villforth et al. 2010). Thus, the optical variability in the HCV light curves is not significant.
The CDF-S was also monitored by OmegaCAM (Kuijken, 2011) on the VLT Survey Telescope (VST) in the , , , and bands. Falocco et al. (2015) used these data to perform variability selection of AGNs. XID 403 was not included in this study due to its low -band flux. We reduce and process the -band data ranging from 2012 to 2013, following the same method in De Cicco et al. (2019), and there is no significant variability in the resulting light curve.
Since the HCV and VST light curves do not overlap with the epoch 6 observations, we further search the European Southern Observatory (ESO) archive666http://archive.eso.org/cms/eso-data.html. for imaging data to construct a longer-term light curve. To obtain reliable photometric measurements, we require the pointing position of the imaging observation to be within 15′ of the XID 403 position and the exposure time to be larger than 100 s. We also require the optical band to have imaging data after June 2014, the start of the epoch 6 observations. Only 189 band images obtained by the Very Large Telescope using the Visible MultiObject Spectrograph (VIMOS; Le Fèvre et al. 2003) satisfy this requirement. The observation dates range from November 2003 to July 2015.
To construct an -band light curve from the VLT/VIMOS -band images, we perform aperture photometry using the Python package photutils (Bradley et al., 2020). A nearby star J033223.18274139.1 (hereafter J0332; blue square in Figure 1), which is 6.6″ to the northeast from XID 403, is used for flux calibration. The star is 23.4 times brighter than XID 403 in the band (Straatman et al., 2016), and based on its HCV data, it is not variable. We perform source detection in the region centered on the star J0332, adopting a 2.0″-radius circular aperture and a detection threshold. XID 403 is detected in 87 of the 189 images. The other images typically have short exposure times; the upper limits on the source fluxes from these images are not constraining compared to the measurements, and thus we do not use these images in the following analysis. Besides XID 403 and J0332, there are typically 1–4 sources detected in the source searching region. One of the sources is the nearby brighter galaxy, which is not variable either based on the HCV data.
To obtain the -band flux of XID 403 in each image, we first determine the background photon counts per pixel from the region described above. All detected sources are masked out with a 4.0″-radius circular aperture. We subtract the background from the image to produce a background-subtracted image. Then we extract the net source counts of XID 403 and J0332 with a 1″-radius circular aperture and a 1.5″-radius circular aperture, respectively. A smaller aperture is used for XID 403 to reduce contamination from the nearby galaxy.777One caveat is that the source is slightly extended in the HST images (e.g., see Figure 1), and the extension might also depend upon seeing for VLT/VIMOS observations. Thus the 1″-radius circular aperture likely underestimates the total galaxy flux and might also cause seeing-dependent fluctuations. However, since we are searching for AGN related strong variability and we do not find any in the end, this approach appears sufficiently robust for our purposes. Since the star J0332 is not variable, we calculate the relative flux of XID 403 as the ratio of its net source counts to that of J0332. The 1 uncertainties of the relative fluxes are calculated by propagating the 1 uncertainties of the source counts.
To assess the contamination from the nearby brighter galaxy in the above extraction, we estimate the fraction of counts in the 1″-radius extraction aperture that is likely from this galaxy. We use an image of the star J0332 to approximate the point spread function (PSF) of the VLT/VIMOS imaging. The images of the brighter galaxy do not show any clear extension, and we also verify that it does not vary between the observations. Thus we simulate two point sources with a separation of 1.9″ and a flux ratio of 5.7. The contamination (fraction of counts) from the brighter source in the 1″-radius aperture of the fainter source is . Thus we consider that the nearby brighter galaxy does not affect the derived relative fluxes significantly, nor does it affect our assessment of the -band variability.
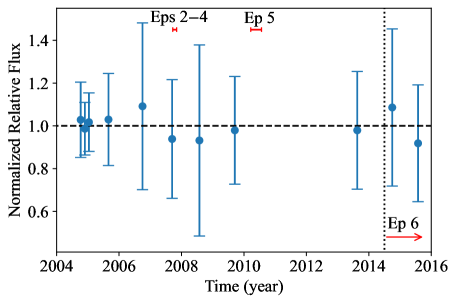
Using the derived relative fluxes, we construct an -band light curve for XID 403. There are 87 flux measurements. We group flux measurements within one month, and adopt the weighted average of the relative flux for each group. The 1 uncertainty of each grouped flux is the combination of the weighted average of measurement uncertainties and the weighted standard deviation of the measurements. The light curve is shown in Figure 6, including 11 grouped data points normalized to their weighted average. There are two data points within epoch 6, and the other points spread in the gaps between the epochs. Considering the uncertainties, there is no significant -band variability, and there is no -band brightening contemporaneous to the X-ray brightening in epoch 6. We also use the method (Villforth et al., 2010) to assess the significance of the variability, and the null hypothesis probability is very small (), indicating that it is not variable.
Since there is no detectable variability, we place an upper limit on the -band brightening factor in epoch 6. We assume that the -band fluxes prior to epoch 5 are dominated by the host galaxy, and we group all these data points (the left eight data points) in Figure 6 and compared their average relative flux () to that of the two data points after the start date of epoch 6 (). We simulate the two average relative fluxes using the Monte Carlo approach described in Section 3.1, assuming they follow Gaussian distributions. The resulting 90% confidence-level upper limit on the variability factor is 1.33. Therefore, if there is an optical/UV flare contemporaneous to the epoch 6 X-ray outburst from an AGN or TDE, its -band flux is of that from the host galaxy.
3.4 Spectral Energy Distribution
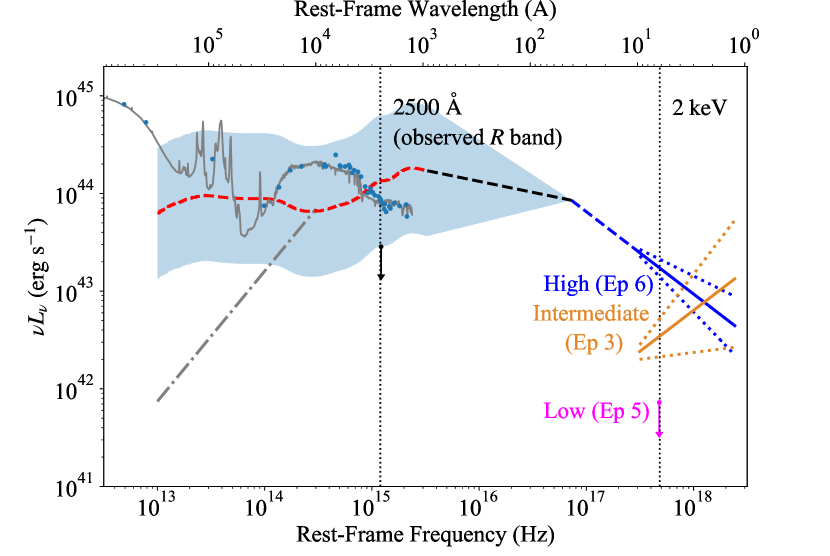
The CDF-S has superb multiwavelength coverage, allowing construction of a broad band spectral energy distribution (SED) for XID 403. We adopt the UV-to-infrared (IR) photometric data from Straatman et al. (2016), which include 41 bands ranging from 3686 Å to 160 m and have been corrected for Galactic extinction. XID 403 was not detected in the sensitive Very Large Arrary (VLA) 1.4 GHz survey of the CDF-S (Luo et al., 2017). We plot the SED in Figure 7. There is no apparent AGN component in the optical/UV SED. The strong far-IR (FIR) radiation suggests a high star-formation rate of the host galaxy. All the observation dates of the UV-to-IR photometric data are before epoch 6, and thus the SED in Figure 7 does not necessarily represent the SED of XID 403 during its high X-ray state (epoch 6). However, given its stable -band (rest-frame 2461 Å) light curve (Figure 6), we do not consider that an AGN component would have emerged in its high-state SED.
We also add X-ray constraints to the SED. For epochs 3 and 6, we plot in Figure 7 the best-fit power-law spectra (dark orange and blue solid lines) in the rest-frame 1.3–10 keV band, where the rest-frame 1.3 keV corresponds to the observed-frame 0.5 keV. The uncertainties for are represented with the corresponding dotted lines. For the low states, epoch 5 has the longest exposure, providing the most stringent upper-limit constraint on the low-state luminosities. We convert the upper limit on the full-band counts to a 2 keV flux upper limit using the spectral response files and a power-law spectrum. The derived upper limit is and it is shown as the gray arrow in Figure 7.
To obtain basic properties of the host galaxy, including its stellar mass () and star-formation rate (SFR), we perform SED fitting using the Python package cigale (e.g., Boquien et al., 2019; Yang et al., 2020, 2022). A set of SED templates are generated based on five modules, including a delayed star-formation history with an optional exponential burst component (sfhdelayed), a library of simple stellar populations (bc03; Bruzual & Charlot 2003), a nebular emission component (nebular), a dust attenuation law with values ranging from 0 to 0.4 mag (dustatt_calzleit; Calzetti et al. 2000), a dust emission component (dale2014; Dale et al. 2014), and a fixed redshifting. The Chabrier (2003) stellar initial mass function (IMF) is used. The best-fit SED model, shown in Figure 7, describes well the FIR-to-UV SED of XID 403 with a reduced value of 0.95. An AGN component is not required in the above SED fitting, and adding such a component (skirtor2016; Stalevski et al. 2012, 2016) does not improve the fit.
From the best-fit model, we derive stellar mass and SFR values of and , respectively. Considering that there may be additional systematic uncertainties, our stellar mass and SFR measurements are likely consistent with those in Trump et al. (2013) and Straatman et al. (2016). The specific SFR () of XID 403 is , within the “main-sequence” of star-forming galaxies at the same redshift (e.g., Elbaz et al. 2011).
3.5 Estimations of AGN Bolometric Luminosity and SMBH Mass
Under the assumption that XID 403 is an AGN, we estimate the AGN bolometric luminosity in epoch 6 by constructing an expected intrinsic AGN SED based on the best-fit X-ray spectrum, which is considered to be the intrinsic X-ray emission (i.e., without X-ray obscuration) given the very steep spectral shape. In this case, XID 403 should be a type 1 AGN at least in epoch 6 as there is no X-ray obscuration. We extrapolate the X-ray SED from 1.3–10 keV to 0.3–10 keV (Figure 7). We then infer a 2500 Å monochromatic luminosity () from and the Steffen et al. (2006) relation (Equation 2), which is . The uncertainties of are propagated from the rms scatter of the expected value (0.165; see Table 5 of Steffen et al. 2006). For the UV-to-IR SED (30 m to 912 Å), we adopt the low-luminosity quasar SED template (given the epoch 6 X-ray luminosity) in Krawczyk et al. (2013), and scale it to . The 912 Å to 0.3 keV SED is a power law connecting the UV and the X-ray SEDs. The expected intrinsic SED and its allowed scatter are shown in Figure 7; the scatter is computed from the uncertainties of . Considering the scatter of the expected AGN SED, there is a broad range for the ratios of AGN luminosities to the host luminosities (e.g., at 2500 Å). To avoid double counting the IR emission that is mostly reprocessed emission from the dusty torus, we extrapolate a power-law SED with a spectral slope of (e.g., Davis & Laor, 2011; Liu et al., 2021) from 1 m to 30 m (gray dash-dotted line in Figure 7). We integrate the 30 m-to-10 keV AGN SED and obtain a value of . The uncertainty is dominated by the uncertainty of . Compared to typical AGNs, super-Eddington accreting AGNs are expected to emit excess EUV radiation (e.g., Castelló-Mor et al., 2016; Kubota & Done, 2018). Thus there may be additional uncertainties on from the above SED integration if XID 403 is indeed super-Eddington accreting given its steep spectral shape in epoch 6.
We note that the above estimation is based solely on the epoch 6 X-ray spectrum and an empirical understanding of typical AGN SEDs (including the relation), without invoking constraints from optical observations. On the other hand, from the -band light curve presented in Section 3.3, we inferred that if there is AGN emission emerging in epoch 6, its contribution to the -band flux is . This upper limit constraint is illustrated by the black downward arrow in Figure 7, which is slightly below the allowed scatter of the expected AGN SED (blue shaded region). Using this upper-limit value to normalize a typical AGN SED, we would obtain an upper limit on the AGN bolometric luminosity of . This discrepancy indicates that the epoch 6 outburst is unlikely due to the emergence of a type 1 AGN with a standard broad-band SED. A simple explanation is dust reddening; mild dust extinction is able to suppress efficiently the observed -band (rest-frame Å) flux and UV SED reddening is not uncommon in type 1 AGNs or luminous quasars. We present quantitative discussion of the possible dust extinction in Section 4.3 below. Therefore, considering the reddening effects, the stable -band light curve in Section 3.3 might not be very constraining for the nature of the X-ray outbursts.
We estimate the SMBH mass () of XID 403 from its stellar mass () using the scaling relation for AGNs (Equation 5 of Reines & Volonteri 2015). The resulting SMBH mass is .888The Chabrier (2003) IMF was used consistently when deriving the stellar mass of XID 403 and the Reines & Volonteri (2015) scaling relation. The uncertainty of this value is estimated to be dex, dominated by the scatter of the scaling relation (0.55 dex; see Section 4.1 of Reines & Volonteri 2015). Since there are additional uncertainties ( dex; e.g., Shen 2013) in the single-epoch virial SMBH mass estimates used to derive the Reines & Volonteri (2015) relation, the uncertainty of XID 403 could be even larger. We note that the uncertainty does not affect significantly our following discussion. For example, if is larger by an order of magnitude, the Eddington ratio estimates would be an order of magnitude smaller (which are very uncertain anyway), and the size and variability time constraints in Section 4 below would vary, but our main conclusions (i.e., two X-ray unveiling events; Section 4.3) remain the same.
We then estimate the epoch 6 Eddington ratio to be . This Eddington ratio is consistent with the value () derived from the relation (Equation 2 of Shemmer et al., 2008), given its value of . The above practice can also be applied to epoch 3, but its flat spectral shape () suggests that the observed X-ray spectrum is modified by intrinsic absorption. We thus add an absorption component (zphabs) to fit the epoch 3 spectrum and derive the absorption-corrected continuum. Since the spectrum has a limited number of counts, we fix the power-law photon index to a typical value of 2.0. The resulting value is . We adopt the same SED integration method and derive a value of , and the corresponding Eddington ratio is .
We also estimate and for epochs 1, 2, 4, and 5 from their X-ray upper limits, again based on the relation and typical AGN SEDs. A power-law X-ray spectrum is adopted. We convert the upper limits on the full-band counts to 2 keV flux upper limits using the spectral response files (with no absorption correction). The resulting upper limits on the 2 keV luminosities for epochs 1, 2, 4, and 5 are 0.80, 4.0, 0.99, and , respectively. We notice that the full-band PF of epoch 6 is higher than that of epoch 5 by a factor of , but the 2 keV luminosity of epoch 6 is higher than that of epoch 5 by a factor of . This is the consequence of the steeper X-ray spectral shape used in determining the 2 keV luminosity of epoch 6. Using the same SED integration method, the resulting upper limits on the bolometric luminosities for epochs 1, 2, 4, and 5 are 9.1, 76, 12, and 7.9 , respectively. The corresponding upper limits on the Eddington ratios are 0.014, 0.12, 0.018, and 0.012, respectively. We caution that these estimates are based on the assumption that the upper limits are intrinsic, but these non-detections might instead be due to X-ray absorption. Thus the Eddington ratios could be much higher. The difference () in Eddington ratios between epoch 5 and epoch 6 is much larger than the difference () in their X-ray fluxes, mainly due to the different values used and the non-linear relation between and .
4 Discussion
The main properties of CDF-S XID 403 and its extreme X-ray variability are summarized as follows.
-
1.
There were two X-ray brightening events. The epoch 3 outburst (intermediate state; detected at a 3 significance level) appears to evolve quite fast. Given the epoch 2–4 light curve, XID 403 brightened by a factor of in rest-frame days, the outburst lasted for –7.3 days, and then the source dimmed by a factor of in days. The epoch 6 outburst (high state) happened years later in the rest frame. It lasted over days and has a large variability amplitude (e.g., ). There is no significant spectral evolution within epoch 6.
-
2.
The epoch 3 spectrum is described with a power-law, suggestive of X-ray absorption. The epoch 6 X-ray spectrum in the rest-frame 1.3–13 keV band is described with a power law.
-
3.
The observed FIR–UV SED of XID 403 is dominated by the host galaxy, which has a stellar mass of and a star-formation rate of . There is no significant optical/UV variability and there is no -band (rest-frame Å) brightening () contemporaneous with the epoch 6 X-ray brightening.
-
4.
There is no clear AGN signature in the available NIR spectra or the IR-to-UV SED, but XID 403 should be either an AGN or associated with TDEs given the luminous X-ray emission.
The discovery of XID 403 involves unique data sets; i.e., 7 Ms of Chandra exposure. We thus do not expect any precedents of such extreme X-ray variability events at high redshifts, which require multiple ks Chandra exposures. However, we do not find any close local analogs of XID 403 either. AGNs with X-ray variability events induced by changes of accretion rate usually show changes in optical properties (e.g., Gilli et al., 2000; LaMassa et al., 2015; Dexter et al., 2019; Ai et al., 2020; Wang et al., 2020; Lyu et al., 2021). Typical TDEs do not show recurrent outbursts (e.g., Zabludoff et al., 2021) or steep X-ray spectral shapes up to 13 keV (e.g., Saxton et al., 2021). Type 2 AGNs with changes of X-ray obscuration do not appear to recover to X-ray unobscured states (e.g., Matt et al., 2003; Guainazzi, 2002; Bianchi et al., 2005; Rivers et al., 2011, 2015; Marchese et al., 2012; Braito et al., 2013; Marinucci et al., 2016). The X-ray variability of XID 403 is reminiscent of local narrow-line Seyfert 1 galaxies (NLS1s) that sometimes show strong X-ray variability due to variable partial-covering absorption (e.g., Tanaka et al., 2004; Turner & Miller, 2009; Miniutti et al., 2012; Liu et al., 2021) and/or disk reflection (e.g., Fabian et al., 2004, 2012; Grupe et al., 2007, 2008; Parker et al., 2014; Grupe et al., 2019; Parker et al., 2019), but unlike NLS1s, its NIR spectra (Section 2.1) and SED (Section 3.4) show no AGN signature. We explore in more detail each of the scenarios in the following subsections.
4.1 Change of Accretion Rate?
In this scenario, the X-ray variability of XID 403 would be associated with changes of accretion rate. The Eddington ratio constraints for the six epochs are, as estimated in Section 3.5, , , , , , and .
However, there are a few properties that are not easily explained by this scenario.
-
1.
The epoch 3 outburst appears to evolve too rapidly for significant changes of the accretion rate, e.g., the flux decreased by a factor of in days. Adopting the standard thin-disk model (e.g., Shakura & Sunyaev, 1973; Netzer, 2013), we estimate the radius of the 2500 Å emitting region to be , where is the gravitational radius. Assuming a disk viscosity parameter of 0.3 and a disk aspect ratio of 0.05, the corresponding thermal and heating/cooling front timescales (Equations 6 and 7 in Stern et al. 2018) at this radius are 1 month and 1.5 years, respectively. These results indicate that the accretion rate of XID 403 should not vary significantly within a few days.
-
2.
In the high state (epoch 6), XID 403 should have produced stronger AGN UV emission than that constrained from the stable -band light curve (comparing the expected AGN SED and the -band upper limit in Figure 7). This is not a critical problem. As introduced in Section 3.5, mild dust reddening should be able to suppress the -band flux significantly.
-
3.
It is unusual that from the low state (e.g., epoch 5; ) to the high state, XID 403 changes from a low accretion rate AGN to a super-Eddington accreting AGN () within rest-frame years. However, the substantial uncertainties associated with the and estimates make the above constraints rather uncertain.
Overall, we consider the X-ray variability of XID 403 unlikely to be caused by changes of accretion rate, mainly due to the significant and rapid variability observed between epoch 2–4 as discussed in the first point above.
4.2 Tidal Disruption Events in an Inactive Galaxy?
Since typical TDEs are found in inactive galaxies, and there is no clear AGN signature for XID 403 (e.g., Section 2.1), we consider it an inactive galaxy in the TDE scenario. In this case, the X-ray outbursts arise from TDEs. There were no contemporary optical/UV outbursts given the -band light curve. This is not unusual for X-ray TDEs (e.g., Komossa, 2015; Saxton et al., 2021).
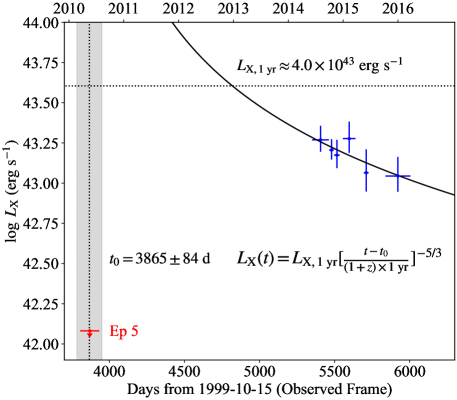
To derive physical parameters for the epoch 6 TDE, we fit the epoch 6 light curve with the canonical power law (e.g., Rees, 1988; Komossa, 2015; Saxton et al., 2021), expressed as:
| (4) |
where is the time at which the disruption event occurs, and is the X-ray luminosity one year later. The X-ray luminosities for the six subepochs are calculated from their soft-band PFs and the epoch 6 best-fit power-law model. We use the module kmpfit in the Python package Kapteyn (Terlouw & Vogelaar, 2016) to fit the light curve. The best-fit is days from 1999-10-15, and the best-fit is . The parameter uncertainties are estimated from . The best-fit TDE light curve is plotted in Figure 8. Since the epoch 3 outburst appears transient, we are not able to perform the above analysis for epoch 3.
We note that the best-fit value overlaps the date span of epoch 5, while the epoch 6 TDE should occur after epoch 5. One possibility is that this value is not correct as the epoch 6 light curve does follow exactly the best-fit power-law model (Figure 8). This could be either due to large uncertainties of the photometric measurements or our binning scheme of the sparsely sampled epoch 6 data. Another possibility is that the TDE light curve does not necessarily follow the canonical power law (e.g., Auchettl et al. 2017, and references therein).
There are also other unusual aspects regarding the TDE scenario, discussed as follows.
-
1.
There are two X-ray outbursts (epochs 3 and 6), and the X-ray light curve (Figure 3) shows that it is unlikely to be caused by a single TDE plus fluctuations. It is very unlikely to have two TDEs given the short time interval of 2.5 years and the typical X-ray TDE rate of (e.g., Donley et al., 2002; Komossa, 2015; Sazonov et al., 2021). There have also been suggestions that partial TDEs (e.g., Chen & Shen, 2021; Payne et al., 2021; Chen et al., 2022; Wevers et al., 2023) or TDEs in SMBH binaries (e.g., Liu et al., 2009; Shu et al., 2020) might produce multiple TDE flares. However, there are only a few such candidates, and their X-ray light curves differ from that of XID 403. Recently, a few X-ray quasi-periodic eruptions (QPEs) have been reported (e.g., Miniutti et al., 2019; Arcodia et al., 2021) in both active and inactive galaxies. We are not able to detect any periodicity in the epoch 6 light curve, but the shapes of the X-ray light curves and the overall properties of these QPE objects also do not resemble those of XID 403.
-
2.
The epoch 6 spectral shape (a power law in the 1.3–13 keV band) is not consistent with typical TDEs. The X-ray spectra of typical X-ray TDEs can be described with single black-body (temperatures of ) or steep power-law (; typically not extending to keV energies) models (e.g., Komossa, 2015; Saxton et al., 2021). For the black-body modeling of the epoch 6 spectrum, the best-fit temperatures are much higher ( times) than typical TDE temperatures (see Section 3.2 and Table 4). However, there are indeed a couple unusual TDE candidates that show similar spectral shapes. One example is XMMSL2 J144605.0685735 reported by Saxton et al. (2019). At a redshift of 0.029, its 0.3–10 keV X-ray spectrum can be described by a power law. Another object is 3XMM J150052.0015452 at a redshift of 0.145 (Lin et al., 2017, 2022; Cao et al., 2023). Its 0.3–10 keV X-ray spectra observed after 2015 can be described with a black-body component with a temperature of plus power law. Besides the epoch 6 spectrum, the flat spectral shape () of the epoch 3 spectrum is also unusual, although the uncertainties are large.
We do not find any TDE candidates that resemble XID 403, mainly due to the two outbursts from XID 403. Besides XMMSL2 J144605.0685735 and 3XMM J150052.0015452 that share some similarity in the X-ray spectral shapes, another unusual TDE candidate that is probably relevant is 1ES 1927654 (e.g., Trakhtenbrot et al., 2019; Ricci et al., 2020, 2021; Laha et al., 2022; Masterson et al., 2022). The optical light curve of this source shows an outburst followed by a TDE-like fading (e.g., Trakhtenbrot et al., 2019). The X-ray light curve shows a strong dip, and then a constant increase in luminosity to levels exceeding the pre-outburst level. During the X-ray rise, a very steep power-law component () appears. This is interpreted as the destruction and re-creation of the inner accretion disk and corona, perhaps by interactions between the accretion disk and debris from a tidally disrupted star (e.g., Ricci et al., 2020). Although the epoch 6 X-ray spectral properties of XID 403 are similar to those of 1ES 1927654 in 2018 and 2019, the optical and X-ray light curves differ significantly from those of 1ES 1927+654.
Overall, we cannot exclude the TDE scenario for explaining the X-ray outbursts of XID 403. But in this case, it should be a TDE candidate with unusual properties (two outbursts, unusual spectral shapes), and it would be the highest-redshift TDE candidate detected so far.
4.3 Change of Obscuration?
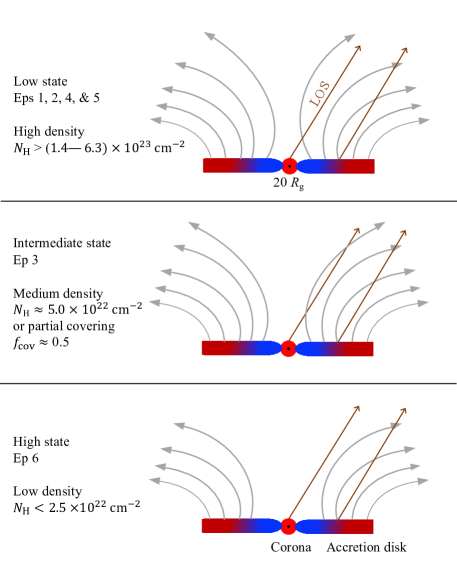
In the scenario of change of obscuration, XID 403 is a luminous AGN with intrinsic X-ray emission described by the epoch 6 data. It accretes at a high rate (), and it has a steep power-law X-ray spectrum with . The AGN SED and the coronal X-ray emission do not vary, and the observed X-ray variability arises from changes of the line-of-sight obscuration, which could be due to changes of either the column density or the covering factor () of the absorber. In epochs 1, 2, 4, and 5, the X-ray corona was fully covered () by the absorber with high column densities. In epoch 3, the column density or the covering factor () was lower. In epoch 6, the column density was the lowest and the line of sight to the X-ray corona was largely cleared. In this scenario, the X-ray outbursts in epochs 3 and 6 are the consequence of two X-ray unveiling events. A schematic illustration of this scenario is shown in Figure 9.
For epoch 6, the column density is constrained to be (Section 3.2). We then estimate the absorber properties for the other epochs, adopting the epoch 6 spectrum as the intrinsic coronal emission. For epoch 3, we first fit the spectrum using an absorbed power-law model (phabs*zphabs*zpowerlw) with and power-law normalization fixed at the epoch 6 values. The resulting intrinsic absorption column density is (Table 4). We then fit the spectrum with a simple power-law model (phabs*zpowerlw), fixing only the value. The resulting power-law normalization (Table 4) is of the epoch 6 value, indicating that the spectrum could be alternatively described by partial-covering absorption with a high and .
For each of the other four epochs, we derived an lower limit that can reduce the photon fluxes to the upper limit values adopting the best-fit spectrum in epoch 6 as the intrinsic spectrum. The resulting constraints for epochs 1, 2, 4, and 5 are , , , and , respectively.
Change of obscuration could occur in both type 1 and type 2 AGNs (Section 1), but the locations of the absorbers might differ (i.e., in the torus, BLR, or disk wind). From the variability time between epoch 2–4, we estimate the distance () of the absorber to the X-ray corona. The rise time and decay time of the epoch 3 outburst are both rest-frame days. We adopt a corona size of (e.g., Chartas et al., 2002, 2009; Risaliti et al., 2009). The absorber should move a distance larger than this size in 6.1 days, and thus the velocity () should be larger than , where days. Assuming that the absorber is moving with a Keplerian velocity, we obtain:
| (5) |
We then compare the distance constraint to the BLR radius and inner torus radius estimated from empirical radius-luminosity relations (e.g., Bentz et al., 2013; Minezaki et al., 2019). Using the Bentz et al. (2013) relation, we estimate an H BLR radius of light-days from the 5100 Å luminosity of the inferred AGN SED in Figure 7. Using the Minezaki et al. (2019) relation, we estimate a dust-sublimation radius (the lower boundary on the torus radius) of light-days from the -band luminosity of the inferred AGN SED. The upper limit on the absorber location ( light-days) is close to the inner radius of the torus. Since the torus has an extended structure, it is likely that the absorber is located in a smaller-scale region, containing dust-free gas. Also considering that we are observing the intrinsic X-ray emission in epoch 6, XID 403 is likely not affected by torus obscuration, and it should be a type 1 AGN.
Luminous X-ray emission lasted over the entire epoch 6, i.e., 251 rest-frame days; we use this time to constrain the size () of the low-density region (). Assuming that the absorber moves at the same velocity as that constrained from the epoch 3, we obtain:
| (6) |
Between epoch 5 and epoch 6, the absorber column density changed by more than an order of magnitude. Given these constraints, the absorber is again unlikely the torus as it is probably difficult to support dynamically such a large size ( thickness of the torus) low-density “hole” in the torus. Instead, the change of the column density might be intrinsic to the absorber (e.g., a variable disk wind) or simply be due to a reduction of the absorber covering factor that exposes the X-ray corona (e.g., Figure 9).
Therefore, the unusual X-ray variability of XID 403 can be consistently explained by changes of obscuration from a small-scale dust-free absorber in a type 1 AGN. Such an absorber should not attenuate the accretion-disk continuum emission or the BLR line emission. However, there is no AGN signature in the SED or spectra. One likely explanation is host-galaxy dilution plus dust extinction, which we explore in the following points.
-
1.
The observed FIR–UV SED appears to be dominated by a star-forming host galaxy (Section 3.4). The expected AGN SED based on the epoch 6 X-ray spectrum would produce an -band flux that is times brighter than the observed value. As introduced in Section 4.3, one possibility is that the AGN UV emission is affected by dust extinction from the host galaxy (due to the intense star formation) or AGN polar dust (e.g., Gilli et al., 2014; López-Gonzaga et al., 2016; Asmus, 2019; Buat et al., 2021). For example, an value of 0.24 mag would be able to suppress the -band flux by a factor of 4.6 (1.5/0.33), adopting a Small Magellanic Cloud extinction curve (Gordon et al., 2003). The corresponding value is only assuming a gas-to-dust ratio of (Rachford et al., 2009), still within the upper-limit constraint from the epoch 6 X-ray spectrum. Thus, it is possible to observe a host-dominated SED due to dust extinction.
-
2.
There was no broad H emission line in the Keck/MOSFIRE spectrum (Section 2). It is not unusual to find X-ray unobscured AGNs in X-ray surveys that do not show emission-line signatures in their optical spectra (i.e., optically “dull” AGNs), and most of them are explained by host-galaxy dilution, with dust extinction being another possible mechanism (e.g., Comastri et al., 2002; Severgnini et al., 2003; Trump et al., 2011; Merloni et al., 2014; Fitriana & Murayama, 2022). Adopting the cigale best-fit galaxy spectrum (Section 3.4) and the Vanden Berk et al. (2001) mean quasar spectrum scaled to the expected AGN SED (with allowed scatter) in Figure 7, we simulate a set of Keck/MOSFIRE spectra considering the spectral signal-to-noise ratio (SNR) at each wavelength. We visually inspect these spectra and a significant fraction () of them do not show a clear broad H emission line. Thus it is possible that XID 403, as a type 1 AGN, does not exhibit a broad H emission line in the Keck/MOSFIRE spectrum.
4.3.1 A High-Redshift analog of NLS1s and Connections
Overall, the change-of-obscuration scenario appears to explain naturally the X-ray variability and multiwavelength properties of XID 403, where the observed X-ray emission is modified by various amounts of absorption from a small-scale dust-free absorber and the optical/UV emission is dominated by the host galaxy. Since XID 403 is probably accreting at a super-Eddington accretion rate given the large estimated value () and the large epoch 6 X-ray photon index (), it appears to be a high-redshift analog of local NLS1s that are considered to have super-Eddington accretion rates and sometimes exhibit strong and rapid X-ray variability (e.g., Mrk 335, Gallo et al. 2018; NGC 4051, Guainazzi et al. 1998; 1H 0707495, Fabian et al. 2012; IRAS 132243809, Boller et al. 1997; Fabian et al. 2013).999Considering the substantial uncertainties associated with and , we cannot exclude the possibility that XID 403 has a moderate Eddington ratio, and then it would belong to a new type of extremely X-ray variable AGNs with unusually steep X-ray spectra. However, Occam’s razor would favor the simpler NLS1 analog explanation.
Recently, an increasing number of type 1 quasars have been found to display similar strong X-ray variability (e.g., PHL 1092, Miniutti et al. 2012; SDSS J07512914, Liu et al. 2019; SDSS J1539+3954, Ni et al. 2020; PG 1448+273, Laurenti et al. 2021; SDSS J13502618, Liu et al. 2022). These quasars show also signatures of high or even super-Eddington accretion rates, e.g., large X-ray photon indices, large estimated values, and/or weak [O III] emission (being part of the Eigenvector 1 parameter space; e.g., Boroson & Green 1992; Sulentic et al. 2000; Shen & Ho 2014), and their X-ray variability likely shares the same origin as that in NLS1s. A common feature of the X-ray variability in these AGNs is the lack of contemporaneous UV/optical continuum or emission-line variability, indicative of a stable accretion rate and little UV extinction from the X-ray absorber. Though in the case of XID 403, it is not feasible to assess the UV/optical variability due to the strong host-galaxy dilution. Another important characteristic of these AGNs is that they follow the relation in the highest X-ray flux states and they become X-ray weaker in the low states (e.g., Miniutti et al., 2012; Liu et al., 2019, 2021; Ni et al., 2020; Boller, 2021), which also supports the obscuration scenario where the highest state represents the unobscured intrinsic coronal emission.
A good candidate for the X-ray absorber in XID 403 is a powerful accretion-disk wind that is generally expected in AGNs with high accretion rates (e.g., Takeuchi et al., 2014; Jiang et al., 2019; Giustini & Proga, 2019). The dynamical nature of the wind causes variable obscuration, and the high-density clouds in the wind produce heavy or even Compton-thick obscuration in the low state. As illustrated in Figure 9, the corona is shielded heavily by the wind in the low states (epochs 1, 2, 4, and 5). In the epoch 3 intermediate state, the wind weakened with a small or a less than 100% covering factor of the corona, allowing some of the X-ray photons to pass through. In epoch 6, the wind did not intercept the line of sight to the corona, and the intrinsic X-ray emission was observed. This scenario is consistent with the thick disk and outflow (TDO) model recently proposed to explain the strong X-ray variability in weak emission-line quasars and other similar AGNs with high accretion rates (Ni et al., 2020, 2022). The small-scale TDO is probably clumpy, and it may sometimes shield the corona partially, yielding a steep X-ray spectrum (with little absorption signature) dominated by the leaked fraction of the intrinsic continuum (e.g., Liu et al., 2019, 2022; Wang et al., 2022a).
The fraction of super-Eddington accreting AGNs that displays strong X-ray variability is poorly constrained (; Liu et al. 2019), and it is likely related to the inclination angle of the system and the covering factor of the wind, which also affect the duration or duty cycle of the X-ray dimming event. XID 403 was discovered in the 7 Ms CDF-S X-ray survey, and there were no other type 1 AGNs in this survey reported to show such strong X-ray variability (Yang et al., 2016; Zheng et al., 2017). Most of the CDF-S AGNs are obscured type 2 AGNs. From the Luo et al. (2017) CDF-S X-ray source catalog, we find only 10 AGNs that have effective photon indices of (unobscured and probably having high accretion rates) and more than 100 net counts in the 0.5–7 keV band (for variability assessment). Thus it is not surprising that only XID 403 (one out of 10) was found to be affected by variable wind obscuration.101010Another AGN among these 10 sources, XID 479, was reported in Appendix C of Yang et al. (2016) to have a luminosity variability amplitude of with little variability (almost always unobscured), and it was also variable in the optical. Thus the variability is probably due to changes of accretion rate.
X-ray obscuration events have also been observed in a small number of more typical type 1 AGNs, e.g., NGC 5548 (e.g., Cappi et al., 2016) and NGC 3227 (e.g., Mao et al., 2022; Wang et al., 2022b). These events generally have shorter durations (sometimes being transient) and lower variability amplitudes (with in the low states) than those in super-Eddington accreting AGNs. The fraction of AGNs showing such obscuration and the frequency of observing such an event (e.g., Pu et al., 2020; Timlin et al., 2020b) are also lower than those for super-Eddington accreting AGNs. These obscuration events are considered to originate from moving clouds in the BLRs, which are probably also responsible for the absorption variability in type 2 AGNs in general (e.g., Risaliti et al., 2011; Rivers et al., 2015; Ricci et al., 2016; Hickox & Alexander, 2018). Given the different characteristics, we consider the absorbers in XID 403 and other super-Eddington accreting AGNs different from the typical BLR clouds. Although the accretion-disk wind is closely connected to the BLR and may even be an essential component of the BLR, the obscuring clouds in XID 403 should have higher densities and be more persistent (e.g., larger covering factors) than typical BLR clouds.
Besides absorption, another mechanism that is frequently invoked to explain the variable X-ray emission in NLS1s is relativistic disk reflection (e.g., Grupe et al., 2008; Fabian et al., 2012; Miniutti et al., 2012; Parker et al., 2014; Grupe et al., 2019). This scenario (e.g., Ross & Fabian, 2005; Fabian & Ross, 2010) was proposed mainly to describe the reflected continuum, broad iron line, and soft excess in the low X-ray state. Changes of the corona height in the lamppost geometry affect the observed X-ray emission, but these are generally not used to account for the entire X-ray variability of such AGNs. Significant normalization changes in the coronal emission (i.e., changes of accretion rates) are often required when describing multi-epoch spectra using solely the disk-reflection model (e.g., Miniutti et al., 2012; Waddell et al., 2019); otherwise, variable absorption is needed in addition to the disk reflection (e.g., Boller, 2021). The available low-state spectrum (epoch 3) of XID 403 has limited photon statistics, and thus we are not able to assess if disk reflection is present. Nevertheless, it may contribute to some extent to the observed X-ray variability.
The unprecedented deep CDF-S data have thus likely revealed, for the first time, a high-redshift moderate-luminosity AGN that shows strong and rapid X-ray variability similar to local NLS1s. This is consistent with our current understanding that the basic emission properties of the AGN population do not have any significant redshift evolution. Future deep X-ray surveys might be able to uncover a sample of such objects for detailed studies.
5 Summary and Future Work
In this paper, we report the extreme X-ray variability of XID 403 in the 7 Ms CDF-S. The optical counterpart of XID 403 has a redshift of . Our results are summarized as follows.
-
1.
In epochs 1, 2, 4, and 5, XID 403 was in a low state, and it was not detected by Chandra. In epoch 3, XID 403 brightened to an intermediate state. The full-band (0.5–5 keV) PF increased by a factor of within 6.1 days. The outburst lasted for –7.3 days, and then the full-band PF decreased by a factor of within 6.1 days. The 0.5–5 keV (rest-frame 1.3–13 keV) X-ray spectral shape appears flat (). In epoch 6, XID 403 entered a high state, lasting days. Compared to epoch 5, the PF increased by factors of , , in the full, soft, and hard bands, respectively. There is no apparent flux or spectral-shape variability within epoch 6. The 0.5–5 keV X-ray spectrum can be described by a simple power-law model () modified by the Galactic absorption. See Sections 3.1 and 3.2.
- 2.
-
3.
Among the three scenarios discussed in Section 4, we prefer the change-of-obscuration scenario (Section 4.3), as it explains most naturally the X-ray variability and multiwavelength properties of XID 403. The X-ray variability is due to two X-ray unveiling events, where the line of sight to the corona is no longer shielded by high column-density gas clumps in a small-scale dust-free absorber. XID 403 is likely a high-redshift analog of NLS1s, and the absorber is probably a powerful accretion-disk wind driven by super-Eddington accretion. We cannot exclude the possibility that XID 403 is an unusual TDE candidate (Section 4.2).
The discovery of XID 403 involved unique data sets, and it is the highest-redshift moderate-luminosity AGN discovered with such extreme X-ray variability. For future prospects, a high SNR NIR spectrum of XID 403, e.g., with the Near InfraRed Spectrograph (NIRSpec) of the James Webb Space Telescope (JWST; Gardner et al. 2006; Jakobsen et al. 2022), might be able to reveal broad Balmer emission lines and thereby nail down its type 1 nature. XID 403 is in the Deep-Drilling Fields (DDFs) of the Vera C. Rubin Observatory (e.g., Ivezic et al. 2008; Brandt et al. 2018), and it will soon have superb photometric monitoring for years. In our preferred scenario, change of obscuration, XID 403 is a high-redshift analog of NLS1s with strong and rapid X-ray variability. It might be feasible to search the Chandra archive for regions covered by multiple ks exposures and identify high-redshift moderate-luminosity AGNs with similar X-ray variability. The extended Roentgen Survey with an Imaging Telescope Array (eROSITA; Merloni et al. 2012; Predehl 2017), if it resumes operation, will be able to discover more NLS1s with such X-ray variability. The next generation X-ray instruments like the new Advanced Telescope for High-ENergy Astrophysics (Athena; Barcons et al. 2017) , the Survey and Time-domain Astrophysical Research eXplorer (STAR-X; Zhang 2017), and the Advanced X-ray Imaging Satellite (AXIS; Mushotzky & AXIS Team 2019; Marchesi et al. 2020) may be able to reveal a population of objects like XID 403 at high redshifts via deep surveys.
References
- Abbott et al. (2021) Abbott, T. M. C., Adamów, M., Aguena, M., et al. 2021, ApJS, 255, 20
- Ai et al. (2020) Ai, Y., Dou, L., Yang, C., et al. 2020, ApJ, 890, L29
- Arcodia et al. (2021) Arcodia, R., Merloni, A., Nandra, K., et al. 2021, Nature, 592, 704
- Arnaud (1996) Arnaud, K. A. 1996, in Astronomical Society of the Pacific Conference Series, Vol. 101, Astronomical Data Analysis Software and Systems V, ed. G. H. Jacoby & J. Barnes, 17
- Asmus (2019) Asmus, D. 2019, MNRAS, 489, 2177
- Auchettl et al. (2017) Auchettl, K., Guillochon, J., & Ramirez-Ruiz, E. 2017, ApJ, 838, 149
- Baldwin et al. (1981) Baldwin, J. A., Phillips, M. M., & Terlevich, R. 1981, PASP, 93, 5
- Barcons et al. (2017) Barcons, X., Barret, D., Decourchelle, A., et al. 2017, Astronomische Nachrichten, 338, 153
- Baskin et al. (2014) Baskin, A., Laor, A., & Stern, J. 2014, MNRAS, 445, 3025
- Bentz et al. (2013) Bentz, M. C., Denney, K. D., Grier, C. J., et al. 2013, ApJ, 767, 149
- Bianchi et al. (2005) Bianchi, S., Guainazzi, M., Matt, G., et al. 2005, A&A, 442, 185
- Boller (2021) Boller, T. 2021, Astronomische Nachrichten, 342, 708
- Boller et al. (1997) Boller, T., Brandt, W. N., Fabian, A. C., & Fink, H. H. 1997, MNRAS, 289, 393
- Bonanos et al. (2019) Bonanos, A. Z., Yang, M., Sokolovsky, K. V., et al. 2019, A&A, 630, A92
- Boquien et al. (2019) Boquien, M., Burgarella, D., Roehlly, Y., et al. 2019, A&A, 622, A103
- Boroson & Green (1992) Boroson, T. A., & Green, R. F. 1992, ApJS, 80, 109
- Bradley et al. (2020) Bradley, L., Sipőcz, B., Robitaille, T., et al. 2020, astropy/photutils: 1.0.0, v1.0.0, Zenodo
- Braito et al. (2013) Braito, V., Ballo, L., Reeves, J. N., et al. 2013, MNRAS, 428, 2516
- Brammer et al. (2012) Brammer, G. B., van Dokkum, P. G., Franx, M., et al. 2012, ApJS, 200, 13
- Brandt et al. (1995) Brandt, W. N., Pounds, K. A., & Fink, H. 1995, MNRAS, 273, L47
- Brandt et al. (2018) Brandt, W. N., Ni, Q., Yang, G., et al. 2018, arXiv e-prints, arXiv:1811.06542
- Broos et al. (2007) Broos, P. S., Feigelson, E. D., Townsley, L. K., et al. 2007, ApJS, 169, 353
- Broos et al. (2010) Broos, P. S., Townsley, L. K., Feigelson, E. D., et al. 2010, ApJ, 714, 1582
- Bruzual & Charlot (2003) Bruzual, G., & Charlot, S. 2003, MNRAS, 344, 1000
- Buat et al. (2021) Buat, V., Mountrichas, G., Yang, G., et al. 2021, A&A, 654, A93
- Calzetti et al. (2000) Calzetti, D., Armus, L., Bohlin, R. C., et al. 2000, ApJ, 533, 682
- Cao et al. (2023) Cao, Z., Jonker, P. G., Wen, S., Stone, N. C., & Zabludoff, A. I. 2023, MNRAS, 519, 2375
- Cappi et al. (2016) Cappi, M., De Marco, B., Ponti, G., et al. 2016, A&A, 592, A27
- Castelló-Mor et al. (2016) Castelló-Mor, N., Netzer, H., & Kaspi, S. 2016, MNRAS, 458, 1839
- Chabrier (2003) Chabrier, G. 2003, ApJ, 586, L133
- Chambers et al. (2016) Chambers, K. C., Magnier, E. A., Metcalfe, N., et al. 2016, arXiv e-prints, arXiv:1612.05560
- Chartas et al. (2002) Chartas, G., Agol, E., Eracleous, M., et al. 2002, ApJ, 568, 509
- Chartas et al. (2009) Chartas, G., Kochanek, C. S., Dai, X., Poindexter, S., & Garmire, G. 2009, ApJ, 693, 174
- Chen et al. (2022) Chen, J.-H., Dou, L.-M., & Shen, R.-F. 2022, ApJ, 928, 63
- Chen & Shen (2021) Chen, J.-H., & Shen, R.-F. 2021, ApJ, 914, 69
- Cid Fernandes et al. (2011) Cid Fernandes, R., Stasińska, G., Mateus, A., & Vale Asari, N. 2011, MNRAS, 413, 1687
- Comastri et al. (2002) Comastri, A., Mignoli, M., Ciliegi, P., et al. 2002, ApJ, 571, 771
- Dale et al. (2014) Dale, D. A., Helou, G., Magdis, G. E., et al. 2014, ApJ, 784, 83
- Davis & Laor (2011) Davis, S. W., & Laor, A. 2011, ApJ, 728, 98
- De Cicco et al. (2019) De Cicco, D., Paolillo, M., Falocco, S., et al. 2019, A&A, 627, A33
- Dexter et al. (2019) Dexter, J., Xin, S., Shen, Y., et al. 2019, ApJ, 885, 44
- Ding et al. (2018) Ding, N., Luo, B., Brandt, W. N., et al. 2018, ApJ, 868, 88
- Done (2010) Done, C. 2010, arXiv e-prints, arXiv:1008.2287
- Donley et al. (2002) Donley, J. L., Brandt, W. N., Eracleous, M., & Boller, T. 2002, AJ, 124, 1308
- Drake et al. (2012) Drake, A. J., Djorgovski, S. G., Mahabal, A., et al. 2012, in New Horizons in Time Domain Astronomy, ed. E. Griffin, R. Hanisch, & R. Seaman, Vol. 285, 306–308
- Elbaz et al. (2011) Elbaz, D., Dickinson, M., Hwang, H. S., et al. 2011, A&A, 533, A119
- Fabian et al. (2017) Fabian, A. C., Lohfink, A., Belmont, R., Malzac, J., & Coppi, P. 2017, MNRAS, 467, 2566
- Fabian et al. (2004) Fabian, A. C., Miniutti, G., Gallo, L., et al. 2004, MNRAS, 353, 1071
- Fabian & Ross (2010) Fabian, A. C., & Ross, R. R. 2010, Space Sci. Rev., 157, 167
- Fabian et al. (2012) Fabian, A. C., Zoghbi, A., Wilkins, D., et al. 2012, MNRAS, 419, 116
- Fabian et al. (2013) Fabian, A. C., Kara, E., Walton, D. J., et al. 2013, MNRAS, 429, 2917
- Falocco et al. (2015) Falocco, S., Paolillo, M., Covone, G., et al. 2015, A&A, 579, A115
- Falocco et al. (2017) Falocco, S., Paolillo, M., Comastri, A., et al. 2017, A&A, 608, A32
- Fitriana & Murayama (2022) Fitriana, I. K., & Murayama, T. 2022, PASJ, 74, 689
- Gallo et al. (2018) Gallo, L. C., Blue, D. M., Grupe, D., Komossa, S., & Wilkins, D. R. 2018, MNRAS, 478, 2557
- Gardner et al. (2006) Gardner, J. P., Mather, J. C., Clampin, M., et al. 2006, Space Sci. Rev., 123, 485
- Garmire et al. (2003) Garmire, G. P., Bautz, M. W., Ford, P. G., Nousek, J. A., & Ricker, George R., J. 2003, in Society of Photo-Optical Instrumentation Engineers (SPIE) Conference Series, Vol. 4851, X-Ray and Gamma-Ray Telescopes and Instruments for Astronomy., ed. J. E. Truemper & H. D. Tananbaum, 28–44
- Gehrels (1986) Gehrels, N. 1986, ApJ, 303, 336
- Gezari (2021) Gezari, S. 2021, ARA&A, 59, 21
- Gibson & Brandt (2012) Gibson, R. R., & Brandt, W. N. 2012, ApJ, 746, 54
- Gilfanov & Merloni (2014) Gilfanov, M., & Merloni, A. 2014, Space Sci. Rev., 183, 121
- Gilli et al. (2000) Gilli, R., Maiolino, R., Marconi, A., et al. 2000, A&A, 355, 485
- Gilli et al. (2014) Gilli, R., Norman, C., Vignali, C., et al. 2014, A&A, 562, A67
- Giustini & Proga (2019) Giustini, M., & Proga, D. 2019, A&A, 630, A94
- Gordon et al. (2003) Gordon, K. D., Clayton, G. C., Misselt, K. A., Landolt, A. U., & Wolff, M. J. 2003, ApJ, 594, 279
- Grupe et al. (2007) Grupe, D., Komossa, S., & Gallo, L. C. 2007, ApJ, 668, L111
- Grupe et al. (2008) Grupe, D., Komossa, S., Gallo, L. C., et al. 2008, ApJ, 681, 982
- Grupe et al. (2010) Grupe, D., Komossa, S., Leighly, K. M., & Page, K. L. 2010, ApJS, 187, 64
- Grupe et al. (2001) Grupe, D., Thomas, H. C., & Beuermann, K. 2001, A&A, 367, 470
- Grupe et al. (2019) Grupe, D., Komossa, S., Gallo, L., et al. 2019, MNRAS, 486, 227
- Guainazzi (2002) Guainazzi, M. 2002, MNRAS, 329, L13
- Guainazzi et al. (1998) Guainazzi, M., Nicastro, F., Fiore, F., et al. 1998, MNRAS, 301, L1
- Guo et al. (2019) Guo, H., Liu, X., Shen, Y., et al. 2019, MNRAS, 482, 3288
- Haardt & Maraschi (1991) Haardt, F., & Maraschi, L. 1991, ApJ, 380, L51
- HI4PI Collaboration et al. (2016) HI4PI Collaboration, Ben Bekhti, N., Flöer, L., et al. 2016, A&A, 594, A116
- Hickox & Alexander (2018) Hickox, R. C., & Alexander, D. M. 2018, ARA&A, 56, 625
- Huang et al. (2020) Huang, J., Luo, B., Du, P., et al. 2020, ApJ, 895, 114
- Ivezic et al. (2008) Ivezic, Z., Axelrod, T., Brandt, W. N., et al. 2008, Serbian Astronomical Journal, 176, 1
- Jakobsen et al. (2022) Jakobsen, P., Ferruit, P., Alves de Oliveira, C., et al. 2022, A&A, 661, A80
- Jana et al. (2022) Jana, A., Ricci, C., Naik, S., et al. 2022, MNRAS, 512, 5942
- Jiang et al. (2019) Jiang, Y.-F., Stone, J. M., & Davis, S. W. 2019, ApJ, 880, 67
- Just et al. (2007) Just, D. W., Brandt, W. N., Shemmer, O., et al. 2007, ApJ, 665, 1004
- Komossa (2015) Komossa, S. 2015, Journal of High Energy Astrophysics, 7, 148
- Kraft et al. (1991) Kraft, R. P., Burrows, D. N., & Nousek, J. A. 1991, ApJ, 374, 344
- Krawczyk et al. (2013) Krawczyk, C. M., Richards, G. T., Mehta, S. S., et al. 2013, ApJS, 206, 4
- Kubota & Done (2018) Kubota, A., & Done, C. 2018, MNRAS, 480, 1247
- Kuijken (2011) Kuijken, K. 2011, The Messenger, 146, 8
- Laha et al. (2022) Laha, S., Meyer, E., Roychowdhury, A., et al. 2022, ApJ, 931, 5
- LaMassa et al. (2015) LaMassa, S. M., Cales, S., Moran, E. C., et al. 2015, ApJ, 800, 144
- Laurenti et al. (2021) Laurenti, M., Luminari, A., Tombesi, F., et al. 2021, A&A, 645, A118
- Le Fèvre et al. (2003) Le Fèvre, O., Saisse, M., Mancini, D., et al. 2003, in Society of Photo-Optical Instrumentation Engineers (SPIE) Conference Series, Vol. 4841, Instrument Design and Performance for Optical/Infrared Ground-based Telescopes, ed. M. Iye & A. F. M. Moorwood, 1670–1681
- Lehmer et al. (2005) Lehmer, B. D., Brandt, W. N., Alexander, D. M., et al. 2005, ApJS, 161, 21
- Li et al. (2019) Li, J., Xue, Y., Sun, M., et al. 2019, ApJ, 877, 5
- Liang & Price (1977) Liang, E. P. T., & Price, R. H. 1977, ApJ, 218, 247
- Lin et al. (2017) Lin, D., Guillochon, J., Komossa, S., et al. 2017, Nature Astronomy, 1, 0033
- Lin et al. (2022) Lin, D., Godet, O., Webb, N. A., et al. 2022, ApJ, 924, L35
- Liu et al. (2009) Liu, F. K., Li, S., & Chen, X. 2009, ApJ, 706, L133
- Liu et al. (2021) Liu, H., Luo, B., Brandt, W. N., et al. 2021, ApJ, 910, 103
- Liu et al. (2022) —. 2022, ApJ, 930, 53
- Liu et al. (2019) —. 2019, ApJ, 878, 79
- Liu et al. (2017) Liu, T., Tozzi, P., Wang, J.-X., et al. 2017, ApJS, 232, 8
- Liu et al. (2020) Liu, Z., Li, D., Liu, H.-Y., et al. 2020, ApJ, 894, 93
- López-Gonzaga et al. (2016) López-Gonzaga, N., Burtscher, L., Tristram, K. R. W., Meisenheimer, K., & Schartmann, M. 2016, A&A, 591, A47
- Luo et al. (2014) Luo, B., Brandt, W. N., & Bauer, F. 2014, The Astronomer’s Telegram, 6625, 1
- Luo et al. (2013) Luo, B., Brandt, W. N., Alexander, D. M., et al. 2013, ApJ, 772, 153
- Luo et al. (2015) Luo, B., Brandt, W. N., Hall, P. B., et al. 2015, ApJ, 805, 122
- Luo et al. (2017) Luo, B., Brandt, W. N., Xue, Y. Q., et al. 2017, ApJS, 228, 2
- Lusso & Risaliti (2016) Lusso, E., & Risaliti, G. 2016, ApJ, 819, 154
- Lyu et al. (2021) Lyu, B., Yan, Z., Yu, W., & Wu, Q. 2021, MNRAS, 506, 4188
- MacLeod et al. (2016) MacLeod, C. L., Ross, N. P., Lawrence, A., et al. 2016, MNRAS, 457, 389
- MacLeod et al. (2019) MacLeod, C. L., Green, P. J., Anderson, S. F., et al. 2019, ApJ, 874, 8
- Mao et al. (2022) Mao, J., Kaastra, J. S., Mehdipour, M., et al. 2022, A&A, 665, A72
- Marchese et al. (2012) Marchese, E., Braito, V., Della Ceca, R., Caccianiga, A., & Severgnini, P. 2012, MNRAS, 421, 1803
- Marchesi et al. (2020) Marchesi, S., Gilli, R., Lanzuisi, G., et al. 2020, A&A, 642, A184
- Marinucci et al. (2016) Marinucci, A., Bianchi, S., Matt, G., et al. 2016, MNRAS, 456, L94
- Markowitz et al. (2014) Markowitz, A. G., Krumpe, M., & Nikutta, R. 2014, MNRAS, 439, 1403
- Marlar et al. (2018) Marlar, A., Shemmer, O., Anderson, S. F., et al. 2018, ApJ, 865, 92
- Masci et al. (2019) Masci, F. J., Laher, R. R., Rusholme, B., et al. 2019, PASP, 131, 018003
- Masterson et al. (2022) Masterson, M., Kara, E., Ricci, C., et al. 2022, ApJ, 934, 35
- Matt et al. (2003) Matt, G., Guainazzi, M., & Maiolino, R. 2003, MNRAS, 342, 422
- Matthews et al. (2016) Matthews, J. H., Knigge, C., Long, K. S., et al. 2016, MNRAS, 458, 293
- Maughan & Reiprich (2019) Maughan, B. J., & Reiprich, T. H. 2019, The Open Journal of Astrophysics, 2, 9
- Merloni et al. (2012) Merloni, A., Predehl, P., Becker, W., et al. 2012, arXiv e-prints, arXiv:1209.3114
- Merloni et al. (2014) Merloni, A., Bongiorno, A., Brusa, M., et al. 2014, MNRAS, 437, 3550
- Merloni et al. (2015) Merloni, A., Dwelly, T., Salvato, M., et al. 2015, MNRAS, 452, 69
- Minezaki et al. (2019) Minezaki, T., Yoshii, Y., Kobayashi, Y., et al. 2019, ApJ, 886, 150
- Miniutti et al. (2012) Miniutti, G., Brandt, W. N., Schneider, D. P., et al. 2012, MNRAS, 425, 1718
- Miniutti et al. (2009) Miniutti, G., Fabian, A. C., Brandt, W. N., Gallo, L. C., & Boller, T. 2009, MNRAS, 396, L85
- Miniutti et al. (2019) Miniutti, G., Saxton, R. D., Giustini, M., et al. 2019, Nature, 573, 381
- Momcheva et al. (2015) Momcheva, I. G., Williams, K. A., Cool, R. J., Keeton, C. R., & Zabludoff, A. I. 2015, ApJS, 219, 29
- Mushotzky & AXIS Team (2019) Mushotzky, R., & AXIS Team. 2019, in LPI Contributions, Vol. 2135, The Space Astrophysics Landscape for the 2020s and Beyond, ed. Moores J. E., King P. L., Smith C. L., Martinez G. M., Newman C. E., Guzewich S. D., Meslin P. -Y., Webster C. R., Mahaffy P. R., Atreya S. K., & Schuerger A. C., 5025
- Nanni et al. (2018) Nanni, R., Gilli, R., Vignali, C., et al. 2018, A&A, 614, A121
- Netzer (2013) Netzer, H. 2013, The Physics and Evolution of Active Galactic Nuclei (Cambridge: Cambridge Univ. Press)
- Ni et al. (2020) Ni, Q., Brandt, W. N., Yi, W., et al. 2020, ApJ, 889, L37
- Ni et al. (2021) Ni, Q., Brandt, W. N., Chen, C.-T., et al. 2021, ApJS, 256, 21
- Ni et al. (2022) Ni, Q., Brandt, W. N., Luo, B., et al. 2022, MNRAS, 511, 5251
- Paolillo et al. (2004) Paolillo, M., Schreier, E. J., Giacconi, R., Koekemoer, A. M., & Grogin, N. A. 2004, ApJ, 611, 93
- Paolillo et al. (2017) Paolillo, M., Papadakis, I., Brandt, W. N., et al. 2017, MNRAS, 471, 4398
- Parker et al. (2014) Parker, M. L., Schartel, N., Komossa, S., et al. 2014, MNRAS, 445, 1039
- Parker et al. (2019) Parker, M. L., Longinotti, A. L., Schartel, N., et al. 2019, MNRAS, 490, 683
- Payne et al. (2021) Payne, A. V., Shappee, B. J., Hinkle, J. T., et al. 2021, ApJ, 910, 125
- Planck Collaboration et al. (2020) Planck Collaboration, Aghanim, N., Akrami, Y., et al. 2020, A&A, 641, A6
- Predehl (2017) Predehl, P. 2017, Astronomische Nachrichten, 338, 159
- Pu et al. (2020) Pu, X., Luo, B., Brandt, W. N., et al. 2020, ApJ, 900, 141
- Puccetti et al. (2004) Puccetti, S., Risaliti, G., Fiore, F., et al. 2004, Nuclear Physics B Proceedings Supplements, 132, 225
- Rachford et al. (2009) Rachford, B. L., Snow, T. P., Destree, J. D., et al. 2009, ApJS, 180, 125
- Ranalli et al. (2013) Ranalli, P., Comastri, A., Vignali, C., et al. 2013, A&A, 555, A42
- Rees (1988) Rees, M. J. 1988, Nature, 333, 523
- Reines & Volonteri (2015) Reines, A. E., & Volonteri, M. 2015, ApJ, 813, 82
- Ricci et al. (2016) Ricci, C., Bauer, F. E., Arevalo, P., et al. 2016, ApJ, 820, 5
- Ricci et al. (2020) Ricci, C., Kara, E., Loewenstein, M., et al. 2020, ApJ, 898, L1
- Ricci et al. (2021) Ricci, C., Loewenstein, M., Kara, E., et al. 2021, ApJS, 255, 7
- Risaliti et al. (2010) Risaliti, G., Elvis, M., Bianchi, S., & Matt, G. 2010, MNRAS, 406, L20
- Risaliti et al. (2002) Risaliti, G., Elvis, M., & Nicastro, F. 2002, ApJ, 571, 234
- Risaliti et al. (2011) Risaliti, G., Nardini, E., Salvati, M., et al. 2011, MNRAS, 410, 1027
- Risaliti et al. (2009) Risaliti, G., Salvati, M., Elvis, M., et al. 2009, MNRAS, 393, L1
- Rivers et al. (2011) Rivers, E., Markowitz, A., & Rothschild, R. 2011, ApJ, 742, L29
- Rivers et al. (2015) Rivers, E., Baloković, M., Arévalo, P., et al. 2015, ApJ, 815, 55
- Ross & Fabian (2005) Ross, R. R., & Fabian, A. C. 2005, MNRAS, 358, 211
- Saez et al. (2012) Saez, C., Brandt, W. N., Gallagher, S. C., Bauer, F. E., & Garmire, G. P. 2012, ApJ, 759, 42
- Saxton et al. (2021) Saxton, R., Komossa, S., Auchettl, K., & Jonker, P. G. 2021, Space Sci. Rev., 217, 18
- Saxton et al. (2019) Saxton, R. D., Read, A. M., Komossa, S., et al. 2019, A&A, 630, A98
- Sazonov et al. (2021) Sazonov, S., Gilfanov, M., Medvedev, P., et al. 2021, MNRAS, 508, 3820
- Scott et al. (2011) Scott, A. E., Stewart, G. C., Mateos, S., et al. 2011, MNRAS, 417, 992
- Severgnini et al. (2003) Severgnini, P., Caccianiga, A., Braito, V., et al. 2003, A&A, 406, 483
- Shakura & Sunyaev (1973) Shakura, N. I., & Sunyaev, R. A. 1973, A&A, 500, 33
- Shemmer et al. (2008) Shemmer, O., Brandt, W. N., Netzer, H., Maiolino, R., & Kaspi, S. 2008, ApJ, 682, 81
- Shen (2013) Shen, Y. 2013, Bulletin of the Astronomical Society of India, 41, 61
- Shen & Ho (2014) Shen, Y., & Ho, L. C. 2014, Nature, 513, 210
- Shen et al. (2019) Shen, Y., Hall, P. B., Horne, K., et al. 2019, ApJS, 241, 34
- Shu et al. (2020) Shu, X., Zhang, W., Li, S., et al. 2020, Nature Communications, 11, 5876
- Stalevski et al. (2012) Stalevski, M., Fritz, J., Baes, M., Nakos, T., & Popović, L. Č. 2012, MNRAS, 420, 2756
- Stalevski et al. (2016) Stalevski, M., Ricci, C., Ueda, Y., et al. 2016, MNRAS, 458, 2288
- Steffen et al. (2006) Steffen, A. T., Strateva, I., Brandt, W. N., et al. 2006, AJ, 131, 2826
- Stern et al. (2018) Stern, D., McKernan, B., Graham, M. J., et al. 2018, ApJ, 864, 27
- Straatman et al. (2016) Straatman, C. M. S., Spitler, L. R., Quadri, R. F., et al. 2016, ApJ, 830, 51
- Sulentic et al. (2000) Sulentic, J. W., Zwitter, T., Marziani, P., & Dultzin-Hacyan, D. 2000, ApJ, 536, L5
- Sunyaev & Titarchuk (1980) Sunyaev, R. A., & Titarchuk, L. G. 1980, A&A, 500, 167
- Takeuchi et al. (2014) Takeuchi, S., Ohsuga, K., & Mineshige, S. 2014, PASJ, 66, 48
- Tanaka et al. (2004) Tanaka, Y., Boller, T., Gallo, L., Keil, R., & Ueda, Y. 2004, PASJ, 56, L9
- Terlouw & Vogelaar (2016) Terlouw, J. P., & Vogelaar, M. G. R. 2016, Kapteyn Package: Tools for developing astronomical applications, Astrophysics Source Code Library, record ascl:1611.010, , , ascl:1611.010
- Timlin et al. (2020a) Timlin, J., Brandt, W. N., & Zhu, S. 2020a, Research Notes of the American Astronomical Society, 4, 168
- Timlin et al. (2020b) Timlin, J. D., Brandt, W. N., Ni, Q., et al. 2020b, MNRAS, 492, 719
- Trakhtenbrot et al. (2019) Trakhtenbrot, B., Arcavi, I., MacLeod, C. L., et al. 2019, ApJ, 883, 94
- Trump et al. (2011) Trump, J. R., Nagao, T., Ikeda, H., et al. 2011, ApJ, 732, 23
- Trump et al. (2013) Trump, J. R., Konidaris, N. P., Barro, G., et al. 2013, ApJ, 763, L6
- Turner & Miller (2009) Turner, T. J., & Miller, L. 2009, A&A Rev., 17, 47
- Vagnetti et al. (2011) Vagnetti, F., Turriziani, S., & Trevese, D. 2011, A&A, 536, A84
- Vanden Berk et al. (2001) Vanden Berk, D. E., Richards, G. T., Bauer, A., et al. 2001, AJ, 122, 549
- Veilleux & Osterbrock (1987) Veilleux, S., & Osterbrock, D. E. 1987, ApJS, 63, 295
- Villforth et al. (2010) Villforth, C., Koekemoer, A. M., & Grogin, N. A. 2010, ApJ, 723, 737
- Waddell et al. (2019) Waddell, S. G. H., Gallo, L. C., Gonzalez, A. G., Tripathi, S., & Zoghbi, A. 2019, MNRAS, 489, 5398
- Wang et al. (2022a) Wang, C., Luo, B., Brandt, W. N., et al. 2022a, ApJ, 936, 95
- Wang et al. (2020) Wang, J., Xu, D. W., & Wei, J. Y. 2020, ApJ, 901, 1
- Wang et al. (2019) Wang, S., Shen, Y., Jiang, L., et al. 2019, ApJ, 882, 4
- Wang et al. (2022b) Wang, Y., Kaastra, J., Mehdipour, M., et al. 2022b, A&A, 657, A77
- Wevers et al. (2023) Wevers, T., Coughlin, E. R., Pasham, D. R., et al. 2023, ApJ, 942, L33
- Xue (2017) Xue, Y. Q. 2017, New A Rev., 79, 59
- Xue et al. (2016) Xue, Y. Q., Luo, B., Brandt, W. N., et al. 2016, ApJS, 224, 15
- Xue et al. (2011) —. 2011, ApJS, 195, 10
- Yang et al. (2016) Yang, G., Brandt, W. N., Luo, B., et al. 2016, ApJ, 831, 145
- Yang et al. (2020) Yang, G., Boquien, M., Buat, V., et al. 2020, MNRAS, 491, 740
- Yang et al. (2022) Yang, G., Boquien, M., Brandt, W. N., et al. 2022, ApJ, 927, 192
- Young et al. (2012) Young, M., Brandt, W. N., Xue, Y. Q., et al. 2012, ApJ, 748, 124
- Zabludoff et al. (2021) Zabludoff, A., Arcavi, I., La Massa, S., et al. 2021, Space Sci. Rev., 217, 54
- Zhang (2017) Zhang, W. W. 2017, in UV, X-Ray, and Gamma-Ray Space Instrumentation for Astronomy XX, ed. O. H. Siegmund, Vol. 10397, International Society for Optics and Photonics (SPIE), 103970O
- Zhang (2021) Zhang, X.-G. 2021, MNRAS, 500, L57
- Zhang et al. (2019) Zhang, X.-G., Bao, M., & Yuan, Q. 2019, MNRAS, 490, L81
- Zheng et al. (2017) Zheng, X. C., Xue, Y. Q., Brandt, W. N., et al. 2017, ApJ, 849, 127