Resource-aware Cyber Deception in
Cloud-Native Environments
Abstract
Cyber deception can be a valuable addition to traditional cyber defense mechanisms, especially for modern cloud-native environments with a fading security perimeter. However, pre-built decoys used in classical computer networks are not effective in detecting and mitigating malicious actors due to their inability to blend with the variety of applications in such environments. On the other hand, decoys cloning the deployed microservices of an application can offer a high-fidelity deception mechanism to intercept ongoing attacks within production environments. However, to fully benefit from this approach, it is essential to use a limited amount of decoy resources and devise a suitable cloning strategy to minimize the impact on legitimate services performance. Following this observation, we formulate a non-linear integer optimization problem that maximizes the number of attack paths intercepted by the allocated decoys within a fixed resource budget. Attack paths represent the attacker’s movements within the infrastructure as a sequence of violated microservices. We also design a heuristic decoy placement algorithm to approximate the optimal solution and overcome the computational complexity of the proposed formulation. We evaluate the performance of the optimal and heuristic solutions against other schemes that use local vulnerability metrics to select which microservices to clone as decoys. Our results show that the proposed allocation strategy achieves a higher number of intercepted attack paths compared to these schemes while requiring approximately the same number of decoys.
Index Terms:
Cyber deception, cyber-threat intelligence, microservice architecture, resource management, optimizationI Introduction
Cloud-native applications running on highly-distributed environments with a variety of interfaces and microservices inevitably increase the attack surface of the infrastructure [1]. Traditional cyber defense mechanisms, like intrusion detection systems (IDSs), rely on up-to-date knowledge of attacker tactics, techniques, and procedures (TTPs), which frequently evolve due to the multitude of technologies employed [2]. As a result, production applications are more exposed to zero-day attacks where deployed microservices can be exploited by malicious actors as a foothold to further spread within the target environment.
To strengthen security, cyber deception can be used as a proactive defense strategy by allocating decoys that resemble legitimate system components within the defender infrastructure to lure malicious actors into interacting with them [3]. Decoys must appear realistic to engage the attacker and increase the likelihood of interaction. Traditionally, decoys are general-purpose (possibly vulnerable) applications that are created a-priori and shipped to customers and, as such, they might have little or no fit within the defender ecosystem [4]. Moreover, when prompted by an attacker they cannot ensure the same degree of similarity or interactivity level as the original applications [5][6][7]. On the other hand, containerization techniques and cloud-native technologies provide the instruments to create high-fidelity and high-interaction decoys by cloning microservices of deployed applications with limited complexity [8]. Unlike pre-built decoys, which require a non-negligible management overhead and are usually installed as standalone elements within the defender environment [9], deceptive microservices can be seamlessly deployed and monitored in production using cloud orchestration technologies like Kubernetes.
By blending this deception mechanism with the running microservices, defenders can detect and mitigate internal threats such as attacker lateral movements between microservices while gathering valuable information about the attacker TTPs. Moreover, using clones of organization’s microservices as decoys reduces the chance that attackers will unveil the deception mechanism since they are more likely to believe that the decoys are legitimate system components. This belief is further enforced by the fact that replication of microservices is a well-known horizontal scaling technique adopted to accommodate variable workload conditions [10]. Indeed, the attacker might expect to find multiple copies of the same microservice within the system configuration.
To fully benefit from this deception approach, two main challenges must be addressed. Firstly, enterprises can’t afford a massive deployment of decoys within their infrastructure, due to limited computational resources, potential scarcity (e.g., in edge scenarios), and associated costs (capital and/or operational expenditure). A key requirement for a practical deception solution is therefore balancing the number of decoys based on incurred resource usage. Secondly, unlike traditional decoy allocation schemes that consider decoys as isolated from the real system in order to avoid any negative impact on the production assets, a deceptive ecosystem based on copies of existing microservices is intertwined with the real application deployment. Consequently, the decoy allocation strategy (i.e., which and how many production microservices are cloned) plays a fundamental role in taking advantage of this behavior and maximizing the chance of attacker interaction. An effective decoy placement scheme should consider the modification introduced by decoys on the original microservice deployment and tailor the cloning mechanism according to the altered perception of the attacker about the target environment.
Although research on decoy placement schemes has addressed some of the challenges related to this allocation problem, it has limitations. Most of the proposed strategies assume that decoys can be located near the organization’s network perimeter and thus cannot handle threats that elude the first line of defences or insider attacks propagating within the production environment [4]. Additionally, these schemes often consider a fixed number of decoys that need to be allocated on a predetermined number of system assets. As a consequence, the scaling efficiency as well as the resource consumption of these techniques is not addressed and cannot be extended to support large-scale microservice deployments where every microservice can be potentially cloned as decoy. Finally, many of these approaches rely on game-theoretical models to determine a suitable decoy allocation strategy [11][12]. Such resolution methodology cannot properly capture neither the heterogeneous nature of the resources (e.g. CPU, memory, disk storage) nor the constraint on the maximum availability of those resources in the considered physical infrastructure.
Motivated by such research gap, this paper presents a novel optimization-based decoy allocation scheme for cloud-native microservice architectures. In detail, our work provides the following contributions:
-
•
we design a metric to evaluate the decoy effectiveness in luring attacks according to the attack graph structure. The latter models the admissible lateral movements of an attacker between microservices. The proposed formulation accounts for the topology modifications in the attack graph introduced by the decoy deployment in order to fully characterize the deceptive capability of each new decoy placement.
-
•
we formulate an integer non-linear optimization problem leveraging the proposed metric in order to compute the optimal decoy placement strategy. By including the impact of the allocated decoys on the attack graph within the objective function formulation, our solution maximizes the number of attack paths intercepted by the decoys according to the availability of computational resources.
-
•
we design an heuristic scheme to overcome the computational complexity of the optimal formulation. The proposed algorithm approximates the original objective function by leveraging an iterative decoy placement strategy which greatly reduces complexity while ensuring a modest performance loss compared to the optimal solution.
-
•
we evaluate optimal and heuristic solutions against state-of-the-art and baseline schemes using several metrics to assess the effectiveness of our resource-aware decoy placement strategy. Our schemes outperformed the benchmark ones in terms of deceptive capability performance, while requiring approximately the same number of decoys.
The remainder of the paper is structured as follows. In Section 2, we discuss the related work. In Section 3, we describe the system model and each component. In Section 4, we propose an optimization-based decoy allocation scheme as well as a heuristic algorithm to approximate the optimal solution. In Section 5, we assess the performance of the proposed schemes. Finally, we draw the conclusion in Section 6.
II Related work
Modern cyber deception has evolved towards the design of flexible and adaptive deception techniques tailored to the considered defense scenario in order to maximize the deception effectiveness and reduce the management cost complexity. A more detailed discussion of cyber deception principles and related challenges can be found in [13] and [14]. In the context of microservice architectures, deception strategies need lightweight and flexible decoy implementations to minimize the impact on the computational resources [15]. Moreover, the distributed nature of microservice-based applications requires the design of fine-granularity decoy allocation schemes to efficiently cover the wide attack surface characterizing this technology [16]. Following these observations, we discuss the work on decoy/honeypot allocation schemes by focusing the analysis on the related resource efficiency and deceptive effectiveness of the decoy placement.
The authors of [17] develop a sandbox network that misdirects attacks from the production network towards deceptive containers with exposed vulnerabilities that are deployed in a isolated and monitored virtual environment. Although their approach allows to trap the attacker on a confined environment separated from the real assets, both the management cost and the decoy resource consumption performance are not addressed. We instead limit the orchestration complexity by directly disseminating deceptive microservices replicas within the production infrastructure according to a given resource budget.
In [18], the authors propose a fingerprint anonymity technique to slow and increase the difficulty of the attacker reconnaissance activities by generating container replicas having a fake set of labels attributes. Differently, our decoy allocation scheme deceives the attacker lateral movements between microservices by employing fully-interactive microservice replicas that are clone of the legitimate ones.
The authors of [19] and [20] design a deep reinforcement learning agents that place fake microservices replicas in order to maximize their capability to lure attacks directed toward legitimate microservices and to conceals assets, respectively. Similarly, [21] proposes a two-phase honeypot allocation algorithm combining game theory and reinforcement learning techniques in order to model and dynamically adapt the honeypot allocation according to the attacker activity. Beside the omission of the decoy resource consumption, the main limitation of [19][20][21] is the scaling efficiency of the proposed schemes that mostly derived from machine learning approaches. Specifically, these algorithms suffers from a high computational complexity as the training procedure requires many iterations to converge toward a stable allocation policy when the number of possible decoy allocation configurations increases. Instead, we tackle the design of a resource-aware decoy allocation scheme using an optimization-based approach that allows to extend the solution for a high number active microservices by leveraging a low-complexity heuristic.
The authors of [22] design a honey-credential deployment strategy that allocates fake account/password to maximize the probability to lure attacks. Although their approach ensures a very low resource usage as the decoy are simple text files, our solution still ensures a manageable resource consumption overhead and, at the same time, high-interaction decoys that can provide valuable information on the attacker TTPs when violated.
In [23], the authors formulate a honeypot placement scheme given a limited budged of resources. In particular, the resulting allocation policy leverages a game-theoretical approach and incentivizes the placement of decoys on the most valuable network assets. However, the considered resources are homogeneous whereas we consider heterogeneous computational resource such CPU cycles and RAM volume needed to run each decoy. Furthermore, the placement strategy follows a sidecar approach which aims at defending vulnerable network entities by exclusively allocating decoys on those assets. Differently, we aggregate the exploit difficulty of the various microservices in order to place decoys on critical microservices whose violation would allow the attacker to spread more effectively among the infrastructure.
The authors of [24] propose a scheme that first identifies the most vulnerable assets in a cloud environment based on the number of attack paths traversing them, then it uses such information to deploy suitable moving target defense strategies. However, such an approach neglects the modification in the number of attack paths affecting the legitimate microservice due to allocation of the deceptive microservices. Differently, we provide an analytical formulation that updates the number of attack paths traversing the legitimate microservices for any decoy placement configuration and we employ this metric to design an optimization problem maximizing the number of attack paths that are intercepted by the allocated decoys.
Finally, the authors of [25] and [26] propose statistic approaches based on probabilistic attack graphs and partially observable Markov decision process, respectively, in order to provide a decoy allocation strategy according to the attacker uncertain behavior. However, they assume that the decoy placement is restricted to specific locations within the infrastructure and neglect the impact of the decoys on the attack graph topology, thus limiting the approaches flexibility. Differently, we assume that any microservice can be replicated as decoy and we design our decoy placement scheme based on the worst-case attack path scenario.
To summarize, unlike the previously discussed work, our cyber deception scheme provides a lightweight and scalable decoy placement strategy that maximizes the chance of the attacker interaction according to a predetermined amount of computational resources. Our solution can be integrated within the production environment of cloud-native applications thanks to the flexibility offered by container-based technologies. In detail, we generate high-interaction decoys by cloning active microservices of an application and we deploy them as legitimate microservices that effectively blend within the defender environment.
III System model
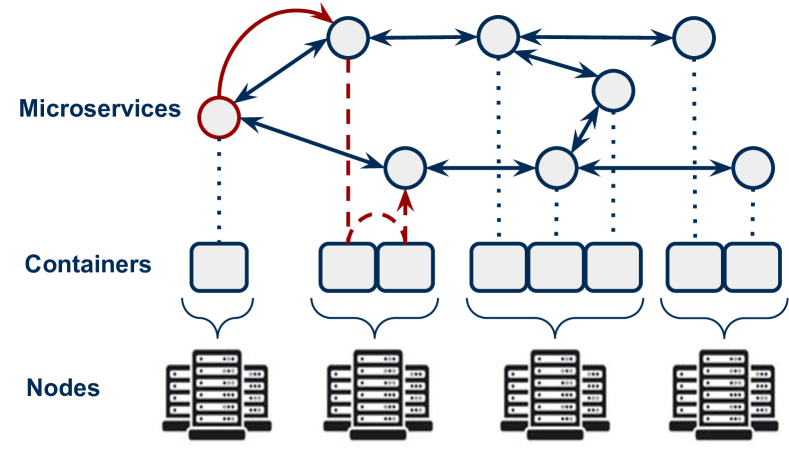
We discuss the system model that we considered in order to design the decoy allocation strategy. We provide a comprehensive representation of the main system features in Fig.1. In the following subsections, we describe the various components identified as attacker model, microservice architecture model, decoy configuration and placement model and threat model. In Table I, we report the model notation.
| Sets |
| N | Set of computing nodes |
|---|---|
| M | Set of production microservices |
| D | Set of allocated decoys |
| V | Set of vertices in the attack graph |
| E | Set of directed edges in the attack graph |
| Parameters |
| is the j-th decoy replica of microservice | |
|---|---|
| vertex in the attack graph | |
| edge between vertices and in the attack graph | |
| Nominal CPU resources of node | |
| Nominal RAM memory available on node | |
| CPU cycles requested by microservice on node | |
| RAM requested by microservice on node | |
| Amount of available resources (CPU or RAM) on node | |
| percentage of available resources reserved to deception | |
| Degree of exploitability of vulnerability | |
| Degree of likelihood of vulnerability being attacked | |
| Attack path between vertices and | |
| Deceptive attack path between vertices and | |
| Binary function such that iff | |
| Binary function such that iff | |
| Betweenness value of vertex |
| Decision variables |
| Number of decoys cloning microservice |
III-A Attacker model
We consider an attack scenario where a malicious user (the attacker) has eluded the security mechanisms of an organization (the defender), such as IDSs and firewalls, and gained access to its cloud services by compromising one of the deployed microservices in order to steal some important data. The initial access can be accomplished by means of phishing mails, stolen login credential or exploits of any internet-facing service (e.g. web servers) hosted by the targeted organization. Upon entering the defender environment, the attacker gathers information about the microservice deployment structure and it uses such knowledge to remain undetected by defender as well as to plan its strategy according to the exposed vulnerabilities (for example, this objective can be practically achieved by the attacker leveraging the environment variables associated to each container running in a Kubernetes cluster as they provide information about IP address, port and service name of all active services within the deployment [27]). Due to the loose coupling between microservices as well as the distributed nature of cloud-native deployments, it is reasonable to assume that the attacker can further penetrate the defender environment by moving laterally among the microservices of the violated application [28]. However, we assume he is unaware of the deception mechanism, thus he can compromise any legitimate microservice and/or decoy in order to reach its goal. The attacker lateral movements can be accomplished by means of two techniques:
-
•
Remote Code Execution (RCE): the attacker can violate a microservice by injecting malicious code throughout its interfaces [29]. The compromised microservice is used as foothold to violate other communicating microservices.
-
•
Container Escape: the attacker exploits any non-root privilege configuration available in each container to interact with other containers that do not belong to the same name-space [30]. In other words, we assume that the attacker can break the microservices logical isolation in order to compromise any microservice deployed on the same node.
Regardless of the employed technique, we assume that the attacker cannot accomplish a privilege escalation to gain access to the whole cluster (i.e., the full set of nodes running the containerized microservices). This attack scenario would bypass any deployed defense mechanism and it is mostly due to a poor configuration of the system privilege levels performed by the defender, which is beyond the deception scope.
III-B Microservice architecture model
We consider an organization running microservice-based applications on the cloud. Every microservice is virtualized and deployed as a container. We indicate as the set of production microservices, whereas we indicate as the set of computing nodes. Each node has a fixed capacity in terms of processing and memory capabilities denoted as and , respectively. We analytically represent the deployment of each microservice on a specific node by means of the indicator variables and , which express the number of CPU cycles and RAM volume used by microservice to run on node . In particular, if microservice is assigned to node , then and , where and represent the actual values of CPU and RAM resources. Otherwise, if microservice is not assigned to node , then and . Based on this notation, we define the resource deployment matrix as
| (1) |
where the (.) notation indicates that the above formulation holds both for CPU and RAM resources. The first condition in (1) ensures that the total number of resources requested by each microservice cannot exceed the node capacity. Similarly, the second condition guarantees that the microservice deployment is feasible by uniquely assigning a single node to each microservice.
III-C Decoy configuration and placement model
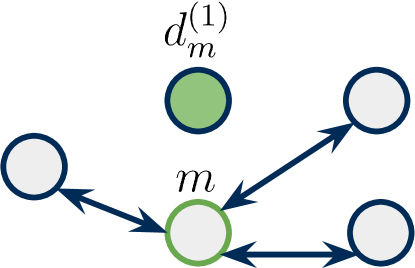
Each decoy is created by cloning the image of production microservices as well as the related interfaces towards adjacent communicating microservices. We assume that each decoy is deployed on the same node of the original cloned microservice. From a security perspective, although this assumption restricts the possible number of decoy placement strategies, this constraint negates the addition of new container escape threats that would be generated by instead allocating a decoy on a different node. In Fig. 2, we show an example of decoy placement that can be easily extended to any microservice deployment topology. Furthermore, every decoy is configured to provide the following features:
-
•
Attack detection reliability: any data traffic intercepted by a decoy is considered malicious since legal data traffic is exclusively forwarded to production microservices. For example, this behavior could be implemented by defining specific network policies with Kubernetes [31]. This tool makes it possible to steer the application traffic flow among legitimate microservices while preserving their interfaces towards the decoys. Based on this configuration, the attacker can still interact with the decoys as the latter are only isolated from the application traffic and not from networking reachability.
-
•
High interactivity: each decoy reacts to the attacker input like a production microservice. However, any data extracted by the attacker is fake and its content is configured to resemble the structure of production data (for example, a database filled with fake entries).
-
•
TTPs monitoring: each decoy implementation is augmented by monitoring functionalities that allow the defender to gather cyber threat intelligence information on the attacker TTPs employed to violate the decoy.
The advantage of the proposed decoy configuration is twofold. It reduces the likelihood that the attacker can spot the deception mechanism as decoys are embedded within the microservice deployment topology like production microservices. It limits the decoy management complexity by duplicating microservices that are currently running.
Instead of cloning the up-to-date implementation of a production microservice, a deceptive microservice could employ a legacy implementation version characterized by known and non-patched vulnerabilities. On one hand, this design choice increases the decoy luring capability. On the other hand, beside possible compatibility issues with the current microservice deployment, it enlarges the attack surface of the infrastructure by intentionally introducing additional weaknesses that offer new TTPs to the attacker. For this reason, we do not consider such a decoy configuration option and we plan to better investigate such tradeoff in a future work to improve the proposed decoy allocation strategy.
We indicate the set of allocated decoys as , where refers to the -th decoy replicating microservice . Due to the resource limitation, a microservice can be replicated as decoy only if the resources reserved to the deception mechanism satisfies the same CPU and RAM resource request associated to the legitimate microservice. Therefore, assuming that microservice is allocated on node , we express a feasible decoy allocation as
| (2) |
where indicates the total number of decoys cloning microservice , denotes the resource decoy ratio and indicates the share of available resources that are reserved for the decoy allocation, is the amount of unused resources in each node given the microservice resource deployment . The condition in (2) ensures that the total resource request of decoys cloning a specific microservice can be accommodated by the available resources in the node. We assume that is fixed and its value is selected by the organization in order to balance the security level and the resource overhead achieved by the deception mechanism. Specifically, the higher is the value of , the higher is the number of deployable decoys as more resources are dedicated for the deception mechanism which intuitively allows to lure and intercept more attacks. By computing the decoy allocation strategy according to a tunable share of the remaining resources, we ensure to not always require the full nodes capacity. This design choice mitigates the impact of the deception scheme on the production microservices whose service provisioning performance should always be prioritized.
III-D Threat model
We model the potential threats of the considered system using graph theory in order to better tailor the design of an effective decoy allocation strategy [32]. This mathematical tool can efficiently model the attacker lateral movements among microservices and decoys by abstracting the attacker techniques in the form of a sequence of graph vertices and edges. In detail, we introduce the Attack Graph (AG) associated to the current microservice deployment configuration as a directed acyclic graph where:
-
•
is the set of vertices in the graph corresponding to the active microservices and decoys.
-
•
is the set of directed edges identified by the ordered vertex pairs that represent the microservices downstream call flow (in other words, we consider that microservice requests a task to microservice ). More specifically, the vertex pair is connected by the directional edge if an attacker can move laterally from microservice to microservice by either leveraging RCE or container-escape techniques. Note that in the latter scenario, microservices and must be allocated on the same computing node.
-
•
is a function assigning a weight to each directed edge expressing the microservice vulnerability level. Note that the same reasoning applies to decoys. In order to formalize this concept, we employ an approach similar to the one adopted by the authors of [24] that leverages the Exploitability Metrics (EM) and Exploit Code Maturity (ECM) indicators. The former measures the difficulty to exploit a vulnerability of a microservice, whereas the latter indicates the likelihood of that vulnerability being attacked [33]. Formally, we compute the weight for each edge as
(3) where is the set of vulnerabilities associated to microservice .
Practically, each vertex provides the weight of its in-ward edges as a weighted average of the vulnerabilities associated to the microservice technical implementation. The lower is the value of , the weaker is the security level of a microservice. The above formulation is extended to include virtualization vulnerabilities when both and are allocated on the same node.
Based on the definition of AG as well as the knowledge about the attacker of the defender environment, we assume that the attacker reaches the target by violating the sequence of microservices providing the ”least impedance” path in terms of exploitability complexity given its entry-point. While this assumption disregards alternative attacker profiles, such as those who engage in stealthy lateral movements to minimize detection or maximize damage to the defender’s environment, we corroborate the effectiveness of our approach by demonstrating its resilience to various attacker behaviors in the results section.
Although this assumption ignores other types of attacker profiles (for example, attackers may perform lateral movements to reduce the likelihood of detection by the defender or to maximize the damage inflicted on the defender’s environment), in the results section we support the validity of the proposed approach by showcasing the limited sensitivity of our solution against different attacker behaviors.
We quantify such attacker behavior as the shortest path in AG between a source vertex , that identifies the attacker entry-point, and a target vertex , that identifies the target microservice whose violation makes it possible for the attacker to access some organization assets. Formally, we define the (AP) between and as the sequence of vertices
| (4) |
that minimizes the total weight . Intuitively, each represents the worst-case attack scenario where a malicious user employs the most efficient sequence of techniques to penetrate the system. Moreover, if an AP contains at least one decoy between and , we denote this path as a (DAP), i.e.
| (5) |
The amount of DAPs in AG measures the deception quality of the decoy placement configuration since the higher is this value, the higher is the number of attacks that are likely to be intercepted by the decoys. From the above definitions, we remark that a DAP is also an AP, hence we can generally refer to any path in the AG as an AP if needed.
IV Problem formulation
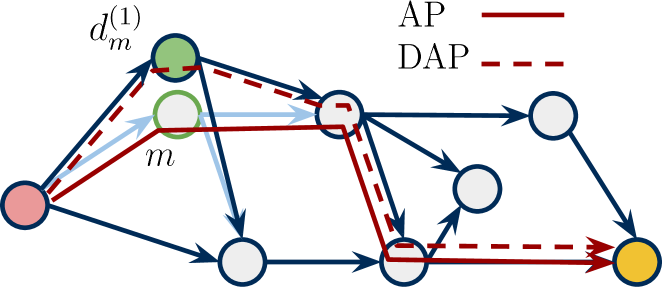
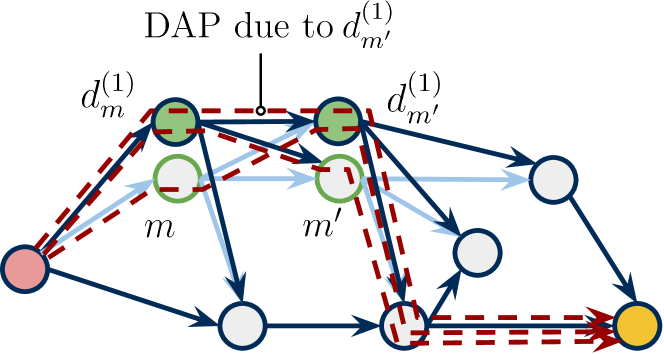
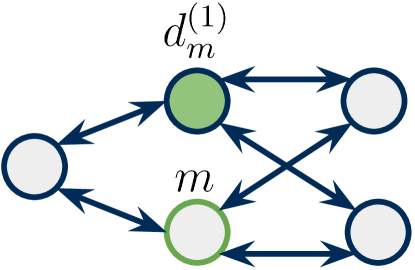
Assuming that the defender is unaware of the attacker entry point and targets, an effective decoy allocation maximizes the number of generated DAPs between any vertex pair in AG according to the resource availability. We illustrate this intuition by analyzing the impact of the decoy allocation on the AG topology in Fig. 3. The latter depicts an example of DAP generation in a simple scenario but it can be easily extended for an arbitrary number of decoys and APs. Each decoy placement modifies the AG structure by adding a new “deceptive” vertex having the same features as the one corresponding to the replicated microservice. As a consequence, a decoy generates a number of DAPs equals to the number of APs traversing the cloned microservice (Fig. 3(a)). Note that those APs may also include DAPs that are introduced by other allocated decoys as highlighted in Fig. 3(b), where decoy now generates an additional DAP due to the allocation of on the same AP (the same argument applies for the additional DAP traversing due to ).
Following these observations, the allocation of decoys on microservices sharing multiple APs can produce a high number of DAPs and thus increases the decoys likelihood to misdirect and intercept possible attacks. In other words, using an analogy, decoys can be considered as ’magnets’ that attract APs to their location, hence an effective decoy placement is the one that maximizes the total number of intercepted APs to maximize the number of DAPs generated.
We formalize the dynamic of decoy allocation by using the concept of Betweenness Centrality (BC) of a vertex. This metric measures the number of shortest paths traversing each graph vertex and offers an analytic approach to tackle the decoy allocation problem. The higher this value is, the more “central” is the related vertex compared to the surrounding vertices since its location allows to reach multiple destinations with minimum cost. Based on this definition, we can consider the BC as a security metric indicating the likelihood that a microservice may eventually interact with an attacker. Consequently, a suitable decoy allocation strategy should select those microservices with high BC values to increase the chance of the decoys to intercept possible attacks.
Formally, we define as the binary indicator function that expresses whether the AP from to contains the vertex . More specifically, if and otherwise. Similarly, we define as the variable indicating the number of APs from to . According to this notation, we compute the BC of a vertex given the number of APs in as
| (6) |
The denominator of (6) can be considered as a normalization factor balancing the BC gain contribution of the multiple equal-cost DAPs generated by the decoys allocated on the same microservice.
IV-A Optimal decoy allocation
In practice, allows to formally quantify the deception effectiveness of each decoy according to its placement. However, the formulation (6) cannot be employed as optimization objective since it is not expressed as a function of the number allocated decoys, which is indeed the optimization variable. In general, the computation of the BC of a vertex given an arbitrary number of graph modifications (e.g. vertex addition/removal and edge addition/removal) is a very challenging task since the corresponding shortest paths modifications can hardly be predicted [34].
However, by leveraging the AG topology structure as well as the decoy allocation dynamic, we can overcome this issue and propose an alternative formulation of fulfilling the aforementioned requirement. In detail, we employ the initial number of APs going through each vertex in the original AG without decoys as a basis to update the BC value of any vertex when a decoy allocation is computed. As a matter of fact, the decoy allocation, which corresponds to a vertex addition operation, preserves the acyclic property of AG since the new introduced edges have the same direction of the in-ward and out-ward edges of the cloned microservice (see Fig. 3).
This particular feature can be used to exactly predict the number of DAPs generated by any decoy placement configuration. Formally, we compute the BC of a vertex given a feasible decoy allocation as
| (7) |
where represent the number of decoys allocated on microservices corresponding to vertices , respectively, and indicates the AP going through vertex in the AG when no decoys are allocated, otherwise. The numerator of addend in (7) provides the total number of DAPs traversing vertex that are generated from the vertex pairs having and decoys allocated, respectively. Note that DAPs generated by vertex pairs not containing are excluded from the computation since by construction. In practice, the total number of DAPs is computed by summing up the individual contribution of the possible vertex pairs formed between the sets and . Each vertex pair enumerates the DAP between the corresponding source and target vertices as where and . The denominator of addend in (7) accounts for the fact that any DAP generated by each vertex pair is also replicated by decoys allocated on microservice if , hence it acts as normalization factor like the denominator of (6).
Leveraging this alternative BC formulation, we compute the decoy allocation maximizing the total number of DAPs given the microservice resource deployment configuration expressed by as
| (8) |
subject to
| (9) |
| (10) |
| (11) |
| (12) |
| (13) |
Each addend in (8) provides the number of DAPs generated by the decoys replicating microservice . Constraints (9) and (10) ensure that the allocated decoys do not exceed the dedicated CPU and RAM resources defined by parameter , respectively. Constraints (11) and (12) enforce that each decoy must be allocated on the same node of the cloned microservice. Finally, constraint (13) expresses the integer nature of the considered allocation problem.
The proposed optimization problem is characterized by a non-linear objective function as it can be easily observed by the definition of in (7) which makes the solution computation very demanding. Moreover, the integrity constraint further exacerbates this issue as it renders the problem combinatorial. Intuitively, (8)-(13) can be seen as a Knapsack problem with variable coefficients and thus its complexity is NP-hard [35]. For this reason, this problem formulation is unpractical for real-world architectures having hundreds of active microservices whose resource occupation can be often reconfigured and thus leading to a decoy re-allocation. To overcome this limitation, we approximate the optimal allocation by designing an heuristic decoy allocation scheme to reduce the solution computational complexity.
IV-B Heuristic decoy allocation
The proposed heuristic consists of a greedy algorithm that prioritizes the allocation of decoys on microservices that require a low amount of resources and, at the same time, that are traversed by a high number of APs (in other words, it employs the BC values associated to each microservice in the original AG). In detail, the algorithm allocates one decoy at every iteration and update the DAPs generation according to the previously allocated decoys. This procedure makes it possible to progressively enumerate every DAP introduced by the decoys and thus can help approximating the optimal allocation. We present the pseudo-code for this scheme in Algorithm 1.
Line 5 computes the number of deployable decoys on each microservice defined as the available resources on the assigned node divided by the microservice resource consumption. This value is used to weight each microservices in the priority queue according to the number of APs going through them in lines 8-9. We allocate a decoy on the microservice with the highest priority in (i.e. the one in the first position) by updating the AG topology in line 15 and we recompute the available resources for decoys in line 16. We iteratively calculate the number of generated DAPs in lines 17-22. In detail, line 19 updates the BC values for other microservices in AG given the new decoy allocation, while line 20 takes into consideration the total DAPs, denoted as , generated by the interaction with the newly allocated decoy and the previously allocated ones. Lines 23-24 clean the queue and recompute the number of deployable decoys. These steps are needed to discard microservices that cannot be cloned as decoys, thus they are no longer considered as possible candidates. Lines 26-28 weight the microservices priority according to the potential number of DAPs, expressed as the BC increment , that can be generated by allocating an additional decoy on the corresponding microservice. These steps guide the decoy allocation computation in the next iteration as the algorithm is incentivized to select microservices with the highest BC gain. Lines 31-33 insert the microservices into the queue with the updated priority only if the resources available are sufficient. The algorithm convergence is completed when is empty, which indicates that the resources reserved for the decoys are exhausted.
The overall algorithm time complexity can be computed as follows. We restrict the analysis for a single iteration, referred by lines 13-34, in order to provide the time complexity required to allocated a single decoy into the infrastructure. The most computationally expensive operation consists of the nested loops calculating the number of additionally DAPs generated by the interactions with previously allocated decoys. In this scenario, assuming that the priority queue is implemented using a binary heap, these steps have a complexity of , which can be further simplified to . Since the total number of the algorithm iterations depends on the number of allocated decoys , the overall algorithm complexity is .
V Performance evaluation
We evaluate the performance of the presented deception mechanism under different configurations of number of active microservices and resource decoy ratio. We compare the performance of the Optimal decoy allocation defined in (8)-(13), which provides the performance upper-bound of the considered metrics, and the related Heuristic allocation presented in Algorithm 1 with the following three schemes:
-
•
Linear: this scheme provides a decoy allocation that maximizes the number of DAPs without accounting for the additional paths introduced by the decoys and follows a similar approach like the one proposed by [24]. For example, with reference to Fig. 3, this scheme would ignore the DAP between and . In other words, this scheme neglects the AG topology modifications due to the decoy placement. The solution is computed by formulating a linear integer optimization problem having as objective function instead of (8). Formally, we have
(14) subject to (9)-(13). Note that this formulation is still NP-hard as it can be reduced to the classical Knapsack problem. We assess the performance of this approach in order to analyze the performance gain provided by the Optimal solution which accounts for every DAPs introduced by the decoy allocation.
-
•
Sidecar: this scheme is a simple decoy placement strategy that allocates decoys on the most vulnerable assets. In our scenario, we identify the most vulnerable microservices as those having the lowest weight associated to the in-ward edges in the AG. To provide a fair comparison with other schemes which are resource-aware, we also account for the resource consumption of the decoys by selecting the microservices to be cloned according to the priority metric of the heuristic algorithm.
-
•
Random: this scheme randomly allocates the decoys and it is used as a performance lower bound.
We define the following metrics to compare the security performance achieved by the aforementioned decoy allocation schemes:
-
•
Decoy interaction probability: this is the probability that an attacker interacts with a decoy when moving laterally between the microservices composing an AP. In other words, this is the probability that an attacker follows a DAP in order to reach its target. Formally, we compute the decoy interaction probability associated to a decoy placement configuration as
(15) where is the initial number of APs in the attack graph without any decoy, and is the number of DAPs generated on the attack graph by the decoy placement configuration . We define this metric in order to provide a more practical insight about the deception performance of the considered schemes as it measures the decoys likelihood to intercept attacks.
-
•
Average number of decoy per AP: this metric measures the average ratio of decoys over the number of legitimate microservices contained in each AP. We define this indicator to evaluate the efficiency of the various schemes in condensing the allocation of decoys on microservices that are traversed by an AP. Intuitively, the higher is this value, the higher is the frequency that an attacker can interact with more than one decoy before reaching its target. As a result, the defender can collect more information about the attacker techniques after each decoy interaction. Formally, we compute the average decoy number per AP associated to a decoy placement configuration as
(16) where is the number of decoy allocated on the AP defined by the vertex pair .
V-A Simulation setup
The simulation environment was developed in Python. In particular, the decoys deployment as well as the AG related computations were implemented using NetworkX library [36], which provides many functionalities to handle operations in graphs. The optimal and linear approaches were computed using the SCIP optimization suite [37].
Due to the impossibility to retrieve practical scenarios of large-scale microservice deployments, we synthetically generated the microservice diagram topology according to a Barabasi-Albert graph model as already proposed in [38]. These graphs, composed by few highly-connected vertices and many low-connected vertices [39], resemble the typical structure of the communication flows within microservice-based applications where few microservices dispatch tasks toward multiple microservices that are rarely connected with one another.
To effectively model a realistic resource deployment of a microservice architecture, we employed a public dataset containing the traces of the normalized computing nodes capacities and the resource consumption of the allocated containers in the Alibaba cloud infrastructure [40]. We generated the resource deployment configuration matrices and by randomly sampling a number of containers corresponding to the number of considered microservices. In other words, we mapped the resource consumption of Alibaba containers and the related allocation on the computing nodes as and . We chose the number of computational nodes by progressively deploying each active microservice on the same node up to the of its capacity before selecting a new one. For example, by following this procedure, the number of nodes required to accommodate 500 microservices, which is the highest microservice configuration considered in the simulation, is . Based on the resulting microservice deployment, we reserved a share of the remaining resources in each node for the decoys allocation according to .
Given the microservice diagram and the related microservice resource deployment, we extracted the AG as described in the previous section. We generated the edge weights of AG by first assigning a random number of vulnerabilities between 3 to 5 to each microservice, i.e. . Then, for each vulnerability of every microservice, we extracted a random and using the Common Vulnerability Scoring System Calculator tool [33] in order to compute the final value of with (3).
Finally, we randomly sampled 100 configurations of microservice architectures and resource deployment and we plotted the average results within the 95% confidence intervals for each considered simulation instance.
V-B Variable number of microservices
We assess the results by fixing the decoy resource ratio as while increasing the number of microservice from to .
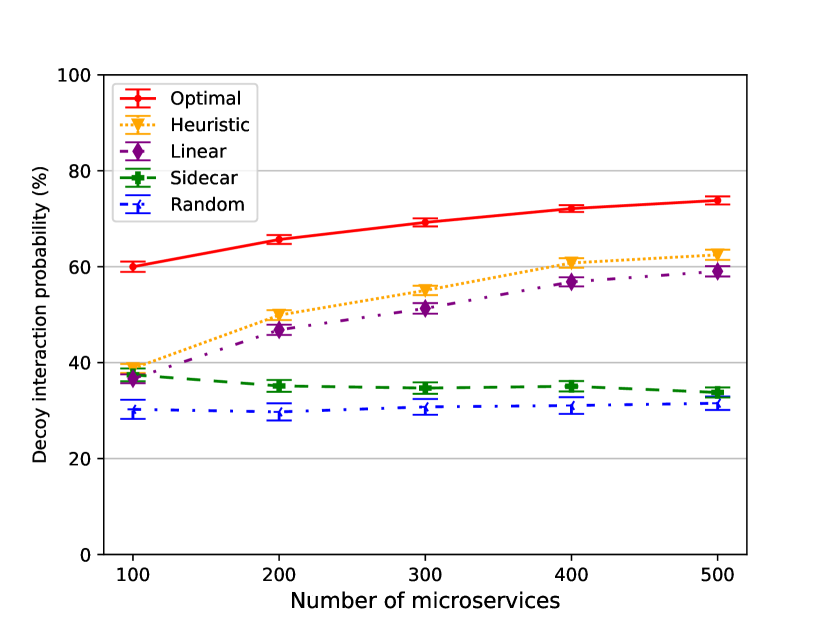
In Fig. 4 we present the decoy interaction probability as defined in (15). The optimal solution achieves the best performance since it spreads more effectively the decoys within the current microservice deployment. In detail, the optimal formulation selects microservices that are traversed by a high number of APs and, at the same time, by a high number of DAPs which are possibly generated by already deployed decoys given the resource available. The heuristic scheme provides some notable optimality gap since its greedy approach prioritizes the allocation of decoys along the same AP instead of diversifying the allocation on other APs. However, it still generates a higher number of DAPs compared to the linear scheme. The latter underestimates the number of generated DAPs as it neglects the impact of the allocated decoy on the AG topology. This decoy placement configuration does not take advantage of DAPs generated between decoys to increase the possible number of intercepted attacks, hence it suffers from an evident performance loss compared to the optimal approach. The sidecar is outperformed by all schemes since it does not consider the sequence of microservices that must be violated by the attacker in order to reach the target. In detail, highly vulnerable microservices are reached by few APs when they are surrounded by more secure microservices. Consequently, the allocated decoys generates a lower number of DAPs. Moreover, by increasing the number of microservices, this effect is exacerbated as there are more microservices acting as “filters” that further reduce the number of APs traversing the selected microservices.
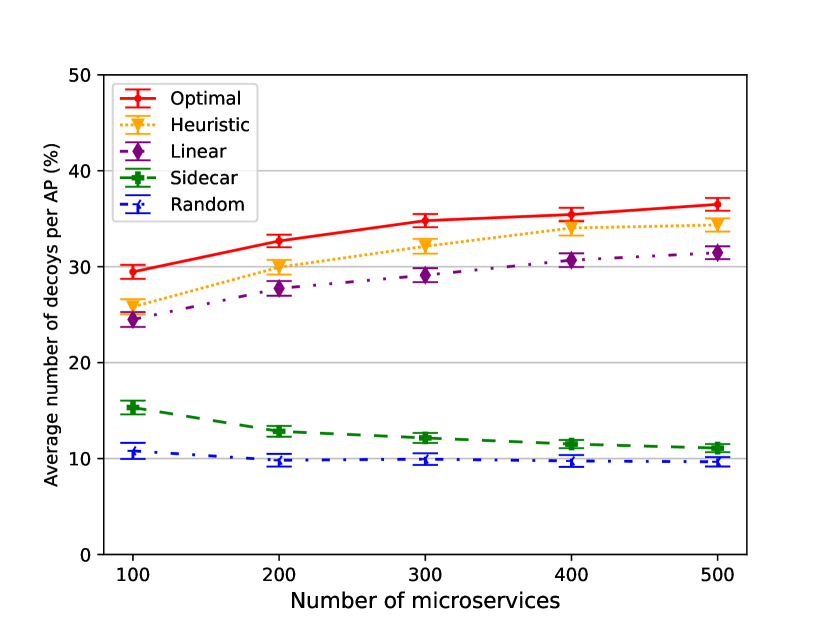
In Fig. 5 we show the average number of decoys per AP as defined in (16). In general, the discussion of the previous plot also applies for this scenario. The optimal scheme ensures the highest number of decoys per AP as it places the decoys along microservices contained in multiple APs. The heuristic scheme achieves similar performance and provides better gain compared to the linear and sidecar schemes. In particular, the greedy nature of the heuristic scheme encourages the allocation of decoys on microservices within the same AP. This strategy generates a high amount of DAPs at each new algorithm iteration thanks to the already allocated decoys along that AP in the previous steps.
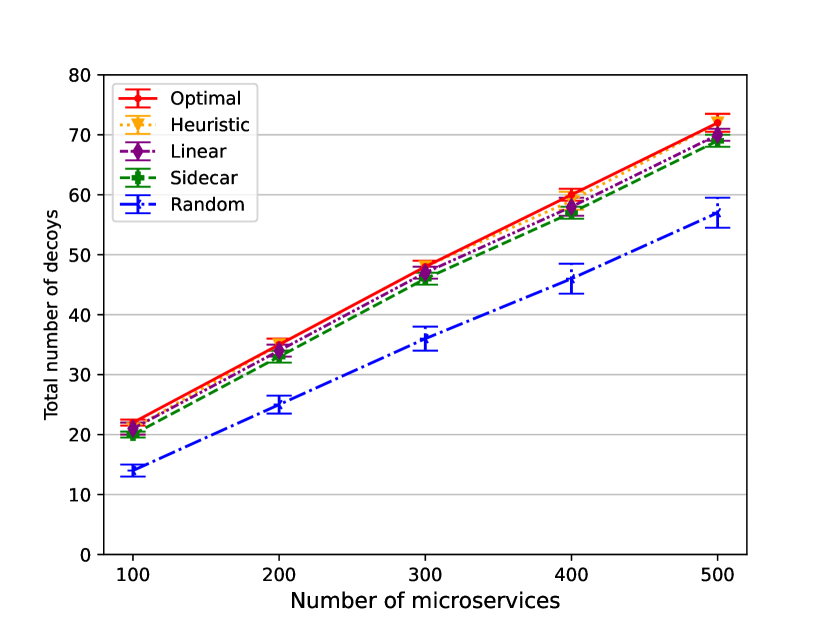
In Fig. 6 we show the total number of allocated decoys. The number of decoys increases as more computing nodes are activated to accommodate the required microservices. Generally, excluding the random scheme which is resource-agnostic, the various schemes roughly deploy the same number of decoys in a given microservice deployment configuration. This behavior suggests that the performance gain provided by the optimal and heuristic schemes derive from a decoy allocation that is tailored to the vulnerabilities of the current microservice deployment and it is not due to a higher number of allocated decoys that artificially inflates the number of generated DAPs. This statement is also supported by the following observation. Unlike the sidecar scheme, the modest decoy increment produced by the microservice scaling allows the optimal and heuristic scheme to further increase the number of DAPs. As a matter of fact, we highlight that when that decoy-to-microservice ratio is roughly instead when is roughly , meaning that the number of decoys increases way slower than the number of active microservices.
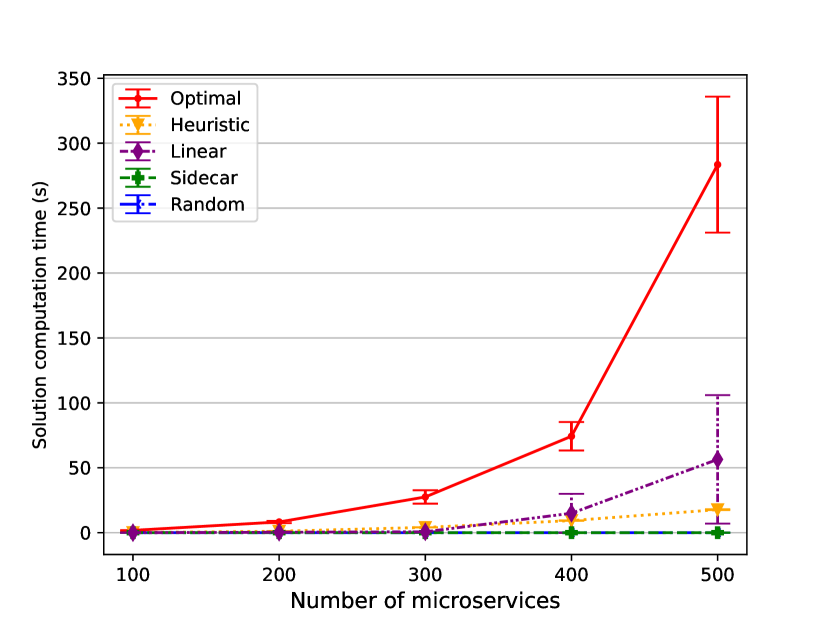
In Fig. 7 we show the convergence performance of the considered schemes. The non-linearity of (8) makes the optimal scheme unsuitable for large-scale microservice deployments that need to be frequently updated due to the high convergence time. Conversely, the heuristic decoy allocation requires a considerably lower computational complexity, thus it is preferable in the aforementioned scenarios. Moreover, the proposed heuristic also outperforms the linear approach, that suffers from a similar trend as the optimal scheme when the number of microservices is higher than 300. The sidecar scheme is characterized by a very low complexity due to the simplicity of its approach, which however achieves poor results in terms of DAP generation as previously discussed. As a consequence, the optimal and heuristic schemes provide the most effective solutions to ensure an effective deception strategy and a scalable decoy placement configuration, respectively.
V-C Variable ratio of dedicated deceptive resources
We also present the performance of the considered decoy allocation schemes for different configurations of available resource reserved for the deception mechanism. Specifically, we restrict the analysis for and we compute the decoy allocation when .
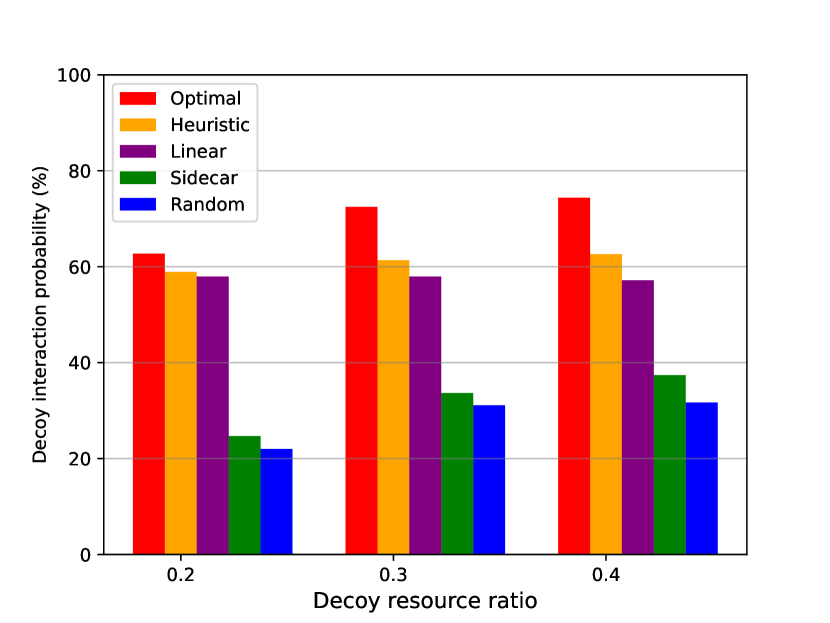
In Fig. 8, we show the decoy interaction probability for different resource configurations. By increasing the number of resources assigned for the decoy deployment, the optimal and heuristic schemes increase the APs coverage by placing a higher number of decoys. Conversely, we remark the performance degradation of the linear scheme whose underestimation error of the DAPs number gets more severe as the decoy deployment availability increases.
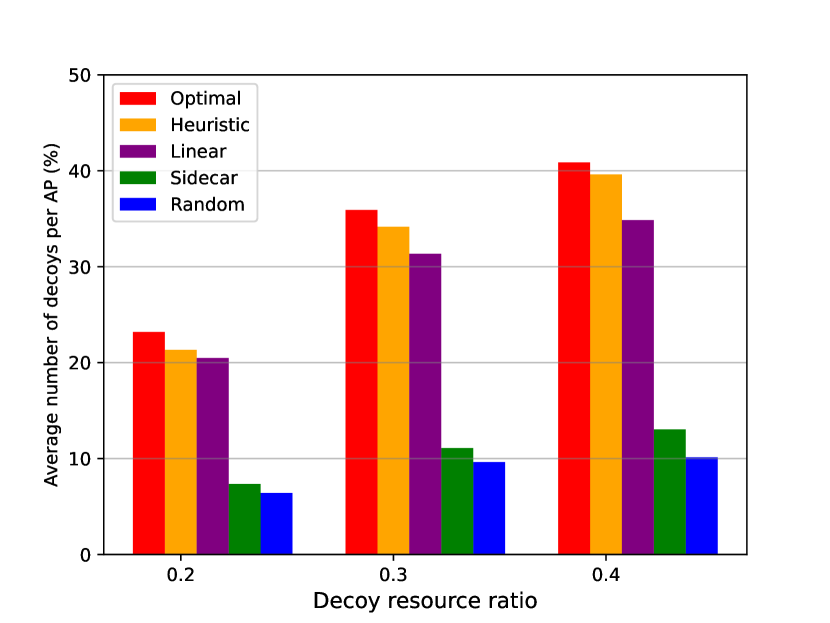
In Fig. 9, we show the average number of decoys per AP. The heuristic scheme performance is comparable to the optimal scheme in every configuration. This result is achieved by distributing the decoy allocation on the available nodes in order to balance the resource consumption. In detail, by ranking microservices according to the number of deployable decoys, the heuristic scheme prioritizes the placement of decoys that can produce a high number of DAPs and, at the same time, have low resource consumption.
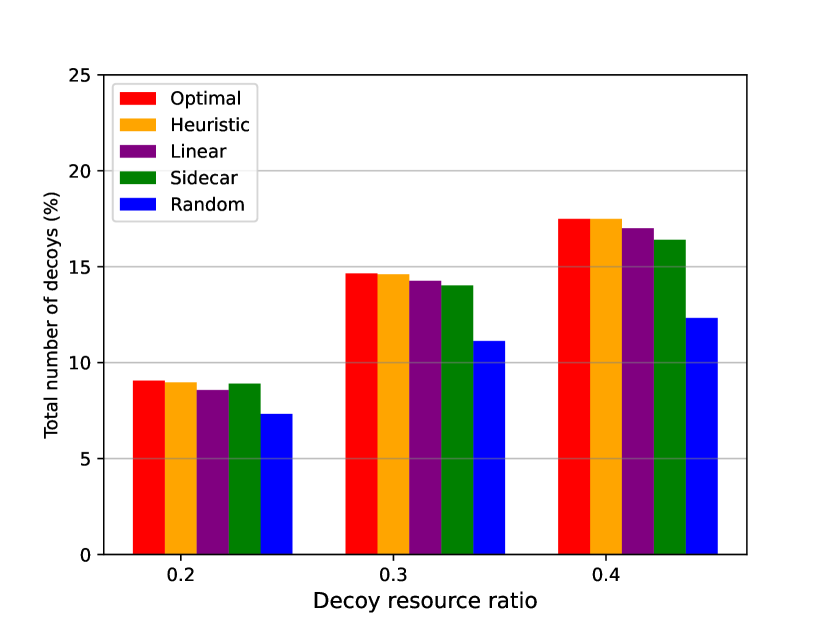
In Fig. 10 we shows the percentage of allocated decoys. As previously observed, all schemes deploy the same number of decoys in every resource configuration scenario. This fact further highlights the resource-efficiency of the proposed approach that leverages the topological structure of the APs to tradeoff the resource consumption for an effective decoy allocation.
V-D Sensitivity to attacker’s behavior
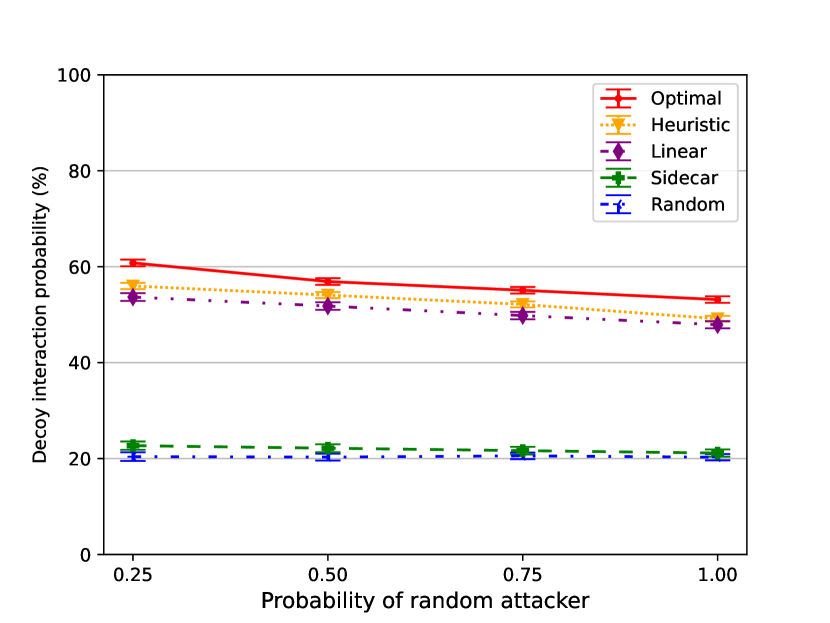
As final result, we investigate how the decoy interaction probability metric responds to various attacker profiles. We simulate a random attacker behavior that differs from the ”least-impedance AP” assumption outlined in Section 3. To achieve this, for every source and target pair in the Attack Graph (AG), we randomly sample an AP with probability of . Conversely, we retain the AP defined as the shortest path in AG with a probability of 1-. Subsequently, we evaluate the decoy interaction probability using the same deployment of decoys as when the attacker strictly follows the shortest path in the AG.
In Fig. 11, we show the outcomes of our analysis by plotting the decoy interaction probability as the probability of introducing random AP (i.e., ) gradually increases. Specifically, when such probability is equal to 1, the attacker behavior is fully random, hence the selected AP is unlikely to match the shortest path. With respect to the results, besides the random scheme, which is unaffected by the attacker profile, we observe a performance degradation of the optimal and heuristic solutions that still, however, outperform the linear scheme. This behavior is expected as the decoy placement maximizes the number of intercepted APs, which now differs when alternative APs are considered. Nonetheless, the performance loss is modest and can be neglected compared to the considerable gains achieved over the sidecar approach. The resilience of the proposed deception strategy to various attacker profiles can be attributed to the all-pair shortest path method used for configuring decoy placements. In particular, our approach considers all source and target pairs within AG. Consequently, some microservices belonging to the predicted AP, when cloned as decoys, may also intercept random APs, as they share sub-path segments. Thanks to this dynamic, the resulting decoy placement configuration remains effective even when dealing with attacker behaviors that deviate from the worst-case scenario, providing a reliable cyber-deception solution.
VI Conclusion
Cyber deception is a promising defense strategy to enhance the security of microservice architectures. By deploying deceptive microservices within the infrastructure, it is possible to intercept attacks and learn about attackers’ TTPs with a limited complexity overhead. In light of this, we considered the problem of a resource-aware decoy allocation strategy under a limited budget of available computational resources. We modeled the attacker lateral movements between microservices using graph theory, where we considered an attack path as the sequence of microservices violated by the attacker in order to reach its target. We proposed an analytical formulation to quantify the number of deceptive attack paths generated by an arbitrary decoy placement, and used this expression to design an integer non-linear optimization problem that maximizes the number of deceptive attack paths given the available resources. We also designed a low-complexity heuristic decoy allocation scheme to approximate the optimal solution. In the performance evaluation, our approach outperformed benchmark schemes on several metrics while using the same number of decoys.
Acknowledgements
This work has received funding from the EU Horizon Europe R&I Programme under Grant Agreement no. 101070473 (FLUIDOS).
References
- [1] I. Nadareishvili, R. Mitra, M. McLarty, and M. Amundsen, Microservice architecture: aligning principles, practices, and culture. ” O’Reilly Media, Inc.”, 2016.
- [2] A. Hannousse and S. Yahiouche, “Securing microservices and microservice architectures: A systematic mapping study,” Computer Science Review, vol. 41, p. 100415, 2021.
- [3] S. Jajodia, V. Subrahmanian, V. Swarup, and C. Wang, Cyber deception. Springer, 2016, vol. 6.
- [4] L. Zhang and V. L. Thing, “Three decades of deception techniques in active cyber defense-retrospect and outlook,” Computers & Security, vol. 106, p. 102288, 2021.
- [5] Q. Duan, E. Al-Shaer, M. Islam, and H. Jafarian, “Conceal: A strategy composition for resilient cyber deception-framework, metrics and deployment,” in 2018 IEEE Conference on Communications and Network Security (CNS). IEEE, 2018, pp. 1–9.
- [6] K. Ferguson-Walter, M. Major, C. K. Johnson, and D. H. Muhleman, “Examining the efficacy of decoy-based and psychological cyber deception.” in USENIX Security Symposium, 2021, pp. 1127–1144.
- [7] M. M. Islam, A. Dutta, M. S. I. Sajid, E. Al-Shaer, J. Wei, and S. Farhang, “Chimera: Autonomous planning and orchestration for malware deception,” in 2021 IEEE Conference on Communications and Network Security (CNS). IEEE, 2021, pp. 173–181.
- [8] A. Nehme, V. Jesus, K. Mahbub, and A. Abdallah, “Securing microservices,” IT Professional, vol. 21, no. 1, pp. 42–49, 2019.
- [9] X. Han, N. Kheir, and D. Balzarotti, “Deception techniques in computer security: A research perspective,” ACM Computing Surveys (CSUR), vol. 51, no. 4, pp. 1–36, 2018.
- [10] W. Hasselbring and G. Steinacker, “Microservice architectures for scalability, agility and reliability in e-commerce,” in 2017 IEEE International Conference on Software Architecture Workshops (ICSAW). IEEE, 2017, pp. 243–246.
- [11] Q. Zhu, “Game theory for cyber deception: a tutorial,” in Proceedings of the 6th Annual Symposium on Hot Topics in the Science of Security, 2019, pp. 1–3.
- [12] A. H. Anwar and C. Kamhoua, “Game theory on attack graph for cyber deception,” in International Conference on Decision and Game Theory for Security. Springer, 2020, pp. 445–456.
- [13] C. Wang and Z. Lu, “Cyber deception: Overview and the road ahead,” IEEE Security & Privacy, vol. 16, no. 2, pp. 80–85, 2018.
- [14] M. Zhu, A. H. Anwar, Z. Wan, J.-H. Cho, C. A. Kamhoua, and M. P. Singh, “A survey of defensive deception: Approaches using game theory and machine learning,” IEEE Communications Surveys & Tutorials, vol. 23, no. 4, pp. 2460–2493, 2021.
- [15] B. Götz, D. Schel, D. Bauer, C. Henkel, P. Einberger, and T. Bauernhansl, “Challenges of production microservices,” Procedia CIRP, vol. 67, pp. 167–172, 2018.
- [16] T. Yarygina and A. H. Bagge, “Overcoming security challenges in microservice architectures,” in 2018 IEEE Symposium on Service-Oriented System Engineering (SOSE). IEEE, 2018, pp. 11–20.
- [17] A. Osman, P. Bruckner, H. Salah, F. H. Fitzek, T. Strufe, and M. Fischer, “Sandnet: towards high quality of deception in container-based microservice architectures,” in ICC 2019-2019 IEEE International Conference on Communications (ICC). IEEE, 2019, pp. 1–7.
- [18] L. Li, J. Wu, W. Zeng, and X. Cheng, “A cyber deception method based on container identity information anonymity,” IEICE Transactions on Information and Systems, vol. 104, no. 6, pp. 893–896, 2021.
- [19] H. Li, Y. Guo, P. Sun, Y. Wang, and S. Huo, “An optimal defensive deception framework for the container-based cloud with deep reinforcement learning,” IET Information Security, vol. 16, no. 3, pp. 178–192, 2022.
- [20] H. Li, Y. Guo, S. Huo, H. Hu, and P. Sun, “Defensive deception framework against reconnaissance attacks in the cloud with deep reinforcement learning,” Science China Information Sciences, vol. 65, no. 7, pp. 1–19, 2022.
- [21] A. H. Anwar, C. A. Kamhoua, N. O. Leslie, and C. Kiekintveld, “Honeypot allocation for cyber deception under uncertainty,” IEEE Transactions on Network and Service Management, 2022.
- [22] J. Liu, Z. Wang, J. Yang, B. Wang, L. He, G. Song, and X. Liu, “Deception maze: A stackelberg game-theoretic defense mechanism for intranet threats,” in ICC 2021-IEEE International Conference on Communications. IEEE, 2021, pp. 1–6.
- [23] A. H. Anwar and C. A. Kamhoua, “Cyber deception using honeypot allocation and diversity: A game theoretic approach,” in 2022 IEEE 19th Annual Consumer Communications & Networking Conference (CCNC). IEEE, 2022, pp. 543–549.
- [24] H. Jin, Z. Li, D. Zou, and B. Yuan, “DSEOM: A framework for dynamic security evaluation and optimization of mtd in container-based cloud,” IEEE Transactions on Dependable and Secure Computing, vol. 18, no. 3, pp. 1125–1136, 2019.
- [25] H. Ma, S. Han, N. Leslie, C. Kamhoua, and J. Fu, “Optimal decoy resource allocation for proactive defense in probabilistic attack graphs,” arXiv preprint arXiv:2301.01336, 2023.
- [26] M. A. R. A. Amin, S. Shetty, L. Njilla, D. K. Tosh, and C. Kamhoua, “Online cyber deception system using partially observable monte-carlo planning framework,” in International Conference on Security and Privacy in Communication Systems. Springer, 2019, pp. 205–223.
- [27] G. Sayfan, Mastering kubernetes. Packt Publishing Ltd, 2017.
- [28] N. Mateus-Coelho, M. Cruz-Cunha, and L. G. Ferreira, “Security in microservices architectures,” Procedia Computer Science, vol. 181, pp. 1225–1236, 2021.
- [29] A. Alshamrani, S. Myneni, A. Chowdhary, and D. Huang, “A survey on advanced persistent threats: Techniques, solutions, challenges, and research opportunities,” IEEE Communications Surveys & Tutorials, vol. 21, no. 2, pp. 1851–1877, 2019.
- [30] S. Sultan, I. Ahmad, and T. Dimitriou, “Container security: Issues, challenges, and the road ahead,” IEEE Access, vol. 7, pp. 52 976–52 996, 2019.
- [31] G. Budigiri, C. Baumann, J. T. Mühlberg, E. Truyen, and W. Joosen, “Network policies in kubernetes: Performance evaluation and security analysis,” in 2021 Joint European Conference on Networks and Communications & 6G Summit (EuCNC/6G Summit). IEEE, 2021, pp. 407–412.
- [32] S. Milani, W. Shen, K. S. Chan, S. Venkatesan, N. O. Leslie, C. Kamhoua, and F. Fang, “Harnessing the power of deception in attack graph-based security games,” in International Conference on Decision and Game Theory for Security. Springer, 2020, pp. 147–167.
- [33] C. S. I. Group, “Common vulnerability scoring system v3. 0: Specification document,” 2019.
- [34] D. A. Bader, S. Kintali, K. Madduri, M. Mihail et al., “Approximating betweenness centrality,” in WAW, vol. 4863. Springer, 2007, pp. 124–137.
- [35] H. Suzuki, “A generalized knapsack problem with variable coefficients,” Mathematical Programming, vol. 15, no. 1, pp. 162–176, 1978.
- [36] A. A. Hagberg, D. A. Schult, and P. J. Swart, “Exploring network structure, dynamics, and function using networkx,” in Proceedings of the 7th Python in Science Conference, G. Varoquaux, T. Vaught, and J. Millman, Eds., Pasadena, CA USA, 2008, pp. 11 – 15.
- [37] K. Bestuzheva et al., “The scip optimization suite 8.0,” 2021. [Online]. Available: https://arxiv.org/abs/2112.08872
- [38] V. Podolskiy, M. Patrou, P. Patros, M. Gerndt, and K. B. Kent, “The weakest link: revealing and modeling the architectural patterns of microservice applications,” 30th Annual International Conference on Computer Science and Software Engineering, 2020.
- [39] S.-H. Yook, H. Jeong, and A.-L. Barabási, “Modeling the internet’s large-scale topology,” Proceedings of the National Academy of Sciences, vol. 99, no. 21, pp. 13 382–13 386, 2002.
- [40] C. Lu, K. Ye, G. Xu, C.-Z. Xu, and T. Bai, “Imbalance in the cloud: An analysis on alibaba cluster trace,” in 2017 IEEE International Conference on Big Data (Big Data). IEEE, 2017, pp. 2884–2892.