An SMA Survey of Chemistry in Disks around Herbig AeBe Stars
Abstract
Protoplanetary disks around Herbig AeBe stars are exciting targets for studying the chemical environments where giant planets form. Save for a few disks, however, much of Herbig AeBe disk chemistry is an open frontier. We present a Submillimeter Array (SMA) 213-268 GHz pilot survey of mm continuum, CO isotopologues, and other small molecules in disks around five Herbig AeBe stars (HD 34282, HD 36112, HD 38120, HD 142666, and HD 144432). We detect or tentatively detect 12CO 2–1 and 13CO 2–1 from four disks; C18O 2–1 and HCO+ 3–2 from three disks; HCN 3–2, CS 5–4, and DCO+ 3–2 from two disks; and C2H 3–2 and DCN 3–2 from one disk each. H2CO 3–2 is undetected at the sensitivity of our observations. The mm continuum images of HD 34282 suggest a faint, unresolved source 50 away, which could arise from a distant orbital companion or an extended spiral arm. We fold our sample into a compilation of T Tauri and Herbig AeBe/F disks from the literature. Altogether, most line fluxes generally increase with mm continuum flux. Line flux ratios between CO 2–1 isotopologues are nearest to unity for the Herbig AeBe/F disks. This may indicate emitting layers with relatively similar, warmer temperatures and more abundant CO relative to disk dust mass. Lower HCO+ 3–2 flux ratios may reflect less ionization in Herbig AeBe/F disks. Smaller detection rates and flux ratios for DCO+ 3–2, DCN 3–2, and H2CO 3–2 suggest smaller regimes of cold chemistry around the luminous Herbig AeBe/F stars.
1 Introduction
Protoplanetary disks are the birthplaces of planetary systems. Disks around pre-main-sequence A-type and B-type stars (“Herbig AeBe” stars) are typically larger and brighter observational targets in millimeter-wavelength (mm) continuum emission than disks around less massive stars (see, e.g., empirical relationships between disk size derived from the millimeter-wavelength continuum, flux, and stellar mass in Figure 5 of Andrews, 2020, and references therein). Herbig Ae stars are also expected to generally host more massive planets compared to less massive stars (e.g., Bowler et al., 2010; Johnson et al., 2010). Protoplanetary disks around Herbig AeBe stars (“Herbig AeBe disks”) are therefore ideal targets for studying the formation environments of giant planets (e.g., Quanz, 2015).
Indeed, direct imaging has already detected gas giant planets around some A-type stars (e.g., Johnson et al., 2007; Marois et al., 2008; Carson et al., 2013; Rameau et al., 2013; Quanz et al., 2015). Depletions of heavy elements in the photospheres of Herbig AeBe stars with disks suggest that at least 30% of their disks may host yet-undetected planets of 0.1-10 Jupiter masses (Kama et al., 2015). Spatially-resolved observations from infrared to millimeter wavelengths have also revealed complex structures in the gas and dust of many Herbig AeBe disks, including spiral arms, asymmetries, cavities, and rings (e.g., Lin et al., 2006; Isella et al., 2007; Fukagawa et al., 2010; Honda et al., 2012; Dong et al., 2018). Several studies have attributed such complex structures to nascent planets embedded within the disks (e.g., Grady et al., 2013; Dong et al., 2015; Bae et al., 2016; Matter et al., 2016; Huang et al., 2018; Isella et al., 2018; Pinte et al., 2018; Zhang et al., 2018).
The compositions of these giant planets are seeded by the gaseous and icy molecular distributions of their ancestral protoplanetary disks. It is currently unclear how similar or different Herbig AeBe disk compositions are to the better studied T Tauri disks. Disks around Herbig AeBe stars are larger, hotter, and more highly irradiated in the ultraviolet than disks around lower mass stars. As density, temperature, and radiation are key drivers of protoplanetary disk chemistry (e.g., Aikawa & Herbst, 1999), these environmental differences may foster different molecular compositions and distributions in Herbig AeBe disks compared to their lower mass counterparts.
While Herbig AeBe disk studies are quite common, there are few such studies of their disk chemistry. The majority of Herbig disk studies have focused on CO gas and dust in order to characterize the disks’ surface density profiles and structures (e.g., Dent et al., 2005; Boissier et al., 2011; van der Plas et al., 2015; Gravity Collaboration et al., 2019; Stapper et al., 2022). Most existing chemistry surveys that do contain Herbig AeBe disks have targeted infrared wavelengths, which probe 10 au of these disks (e.g., Pontoppidan et al., 2010; Fedele et al., 2011; Meeus et al., 2012).
For species other than CO, few Herbig AeBe disks have been surveyed at millimeter wavelengths, which probe 10 au. Notably Öberg et al. (2010, 2011) conducted a millimeter-wavelength survey of a 12-disk sample containing one Herbig Ae disk (MWC 480) and three F-star disks. Their survey included lines of HCO+, CN, HCN, DCN, DCO+, and H2CO. They found that small molecules (other than CO) were generally detected at lower rates for the Herbig AeBe/F disks than for the disks around lower mass stars. They attributed the lower detection rates to a combination of (1) the brighter far-ultraviolet fields inherent to Herbig Ae stars and (2) the warmer disks themselves, which would cultivate less CO freeze-out and generally diminish abundances of molecules that form significantly in cold environments (e.g., deuterated molecules and H2CO).
Beyond their survey, only a few Herbig AeBe disks have been well-characterized in chemistry at millimeter (mm) wavelengths: AB Aur, HD 163296, and MWC 480 (e.g., Thi et al., 2004; Schreyer et al., 2008; Henning et al., 2010; Fuente et al., 2010; Chapillon et al., 2012a, b; Guilloteau et al., 2013; Qi et al., 2013a, b; Graninger et al., 2015; Guzmán et al., 2015; Huang et al., 2017; Bergner et al., 2018, 2019; Le Gal et al., 2019; Loomis et al., 2020; Pegues et al., 2020; Öberg et al., 2021a; Law et al., 2021a; Guzmán et al., 2021; Ilee et al., 2021; Le Gal et al., 2021). Otherwise, Oph IRS 48 has been detected in a mix of commonly and uncommonly targeted molecules, including H2CO, CH3OH, NO, SO, SO2, and CH3OCH3 (van der Marel et al., 2014; Booth et al., 2021; van der Marel et al., 2021; Brunken et al., 2022). Other molecule-specific exceptions include DCO+ from HD 169142 (Macías et al., 2017), H2CO, CH3OH, and SO from HD 100546 (Booth et al., 2018, 2023), HC15N and H13CO+ from HD 97048 (Booth et al., 2019), and upper limits of CN, H2CO, and SO from HD 36112 (also known as MWC 758; Guilloteau et al., 2013).
A subset of these studies (e.g., Guzmán et al., 2015; Le Gal et al., 2019; Loomis et al., 2020; Pegues et al., 2020) compared mm-wavelength observations between the Herbig Ae disks and T Tauri disks in their samples. Altogether, they found tentative differences in the inventories of carbon, nitrogen, oxygen, and sulfur-bearing molecules between the two disk types. The differences were attributed to differences in disk temperature, photochemical environment, and/or regions of CO freeze-out - all of which are properties derivative of the different luminosities and effective temperatures of the central stars. These chemistry studies, however, have each considered only one or two Herbig Ae disks in total, and have often called for more observations of Herbig Ae disks to test these tentative hypotheses over larger samples.
In this study, we present a molecular line survey of four Herbig Ae disks and one Herbig Be disk observed within 213-268 GHz with the Submillimeter Array (SMA). We leverage the wide spectral range and high spectral resolution capabilities of the SMA to probe a suite of molecular lines in an efficient way, and to help enable follow-up of these lines at higher spatial resolution in future studies. In Section 2, we describe the target disks, SMA observations and data reduction, target molecular lines, and a comparative sample of disks from the literature. In Section 3, we overview techniques used to analyze the molecular line emission. In Section 4, we present our results, including molecular line detections, velocity-integrated emission maps, spectra, and extracted fluxes. In Section 5, we interpret these results in the context of existing disk chemistry observations across the pre-main-sequence stellar mass distribution. We summarize our findings in Section 6.
2 SAMPLE
2.1 Target Disks
| Star+Disk | Spectral | R.A.[1] | Decl.[1] | Dist.[1] | aaAdapted from Dent et al. (2005), as described in the main body of this caption. | P.A.bbEstimated from near-infrared, submillimeter, or millimeter continuum. | Incl.bbEstimated from near-infrared, submillimeter, or millimeter continuum. | |||||
|---|---|---|---|---|---|---|---|---|---|---|---|---|
| System | Type | (J2000) | (J2000) | (pc) | (Myr) | () | () | (K) | (km s-1) | () | () | (au) |
| HD 34282c,dc,dfootnotemark: | A3[3] | 05:16:00.48 | 09:48:35.41 | 3092 | 6.5 | 9.55 | 1.45 | 9500 | 2.7 | 117[4] | 59[4] | 260[5] |
| HD 36112c,dc,dfootnotemark: | A5[6] | 05:30:27.53 | 25:19:56.65 | 1561 | 8.3 | 11.0 | 1.56 | 7605 | 5.9 | 245[7] | 21[7] | 123[5] |
| HD 38120 | B9[8] | 05:43:11.89 | 04:59:49.91 | 3855 | 3.5 | 52.5 | 2.37 | 10700 | 16.4 | 165[9] | 49[9] | 100 |
| HD 142666ccHD 34282, HD 36112, and HD 142666 are also known as V1366 Ori, MWC 758, and V1026 Sco, respectively, in the literature. | A8[10] | 15:56:40.01 | 22:01:40.36 | 1461 | 9.3 | 8.71 | 1.49 | 7500 | 4.0 | 162[11] | 62[11] | 52[5] |
| HD 144432ddOrbital companions have been reported for HD 34282 (Wheelwright et al., 2010), HD 36112 (Thomas et al., 2007), and HD 144432 (Maheswar et al., 2002). | A9[10] | 16:06:57.94 | 27:43:10.15 | 1551 | 5.0 | 9.33 | 1.39 | 7500 | 5.8 | 76[9] | 30[9] | 100 |
Note. — Column 1: Star+disk system. Column 2: Spectral type. Columns 3, 4, and 5: Right ascension, declination, and distance, respectively, from Gaia (Gaia Collaboration et al., 2016, 2018). Columns 6, 7, 8, and 9: Stellar age, luminosity, mass, and effective temperature, respectively, from the compilation of Vioque et al. (2018), which updated values from the literature as needed using parallaxes from the Gaia Data Release 2. Column 10: Systemic velocities in the local standard of rest frame, which were (1) converted from heliocentric values presented in Dent et al. (2005) and then (2) adjusted as needed to better match the center of the 12CO 2–1 emission spectra. We were unable to adjust the systemic velocity for HD 38120 (see Section 4.1). Columns 11 and 12: Position and inclination angles, respectively. The position angles are measured East of North. Column 13: disk radii from the literature, derived from 90% of the 1.3 mm continuum emission. No mm continuum radii are known for HD 38120 and HD 144432, so here we assume 100 au.
References. — [1] Gaia Collaboration et al. (2016, 2018); [2] Vioque et al. (2018); [3] Merín et al. (2004); [4] van der Plas et al. (2017); [5] Stapper et al. (2022); [6] Zuckerman et al. (1995); [7] Isella et al. (2010); [8] Juhász et al. (2010); [9] Gravity Collaboration et al. (2019); [10] Meeus et al. (1998); [11] Huang et al. (2018).
We target four protoplanetary disks around Herbig Ae stars and one disk around a Herbig Be star. Table 2.1 summarizes their stellar and disk characteristics. These star+disk systems were chosen because they had previously been detected in at least one CO emission line (e.g., CO J=3–2 observations by Dent et al., 2005; van der Plas et al., 2017) but were otherwise not characterized in millimeter-wavelength chemistry. The systems are associated with the Taurus-Auriga (HD 36112), Orion OB Ic (HD 38120), and Upper Scorpius (HD 142666 and HD 144432) star-forming regions, or are isolated (HD 34282) (see the compilations by Sandell et al., 2011; Alecian et al., 2012). The stars were selected to span a range of spectral types, with four stars of types A3-A9 and the fifth star (HD 38120) of type B9 (Zuckerman et al., 1995; Meeus et al., 1998; Merín et al., 2004; Juhász et al., 2010). Three of the star+disk systems are reported to have orbital companions: HD 34282 (Wheelwright et al., 2010), HD 36112 (Thomas et al., 2007), and HD 144432 (Maheswar et al., 2002).
Altogether, these five Herbig AeBe disks have lower CO luminosities than the Herbig Ae disks that have been relatively well characterized in chemistry so far (i.e., AB Aur, HD 163296, and MWC 480, found to be brightest in CO 3–2 emission in the survey by Dent et al., 2005). Our observations of these disks serve as 1) an investigative probe into a larger and more representative sample of Herbig AeBe disk chemistry and 2) a foundation for potential follow-up observations at higher spatial resolution in the future.
Studies have found complex morphologies in the dust disks of a subset of these systems, including a cavity within 88 au, a bright point-like source, and a single spiral arm in HD 34282 (millimeter-wavelength continuum and scattered light observations of van der Plas et al., 2017; de Boer et al., 2021, respectively); bright dust clumps and at least three spiral arms in HD 36112 (millimeter-wavelength continuum and scattered light observations of Boehler et al., 2018; Dong et al., 2018; Reggiani et al., 2018, respectively); and an inner cavity of radius 10 au, rings, and asymmetries in HD 142666 (millimeter-wavelength continuum observations of Rubinstein et al., 2018; Huang et al., 2018). There has been a lack of detected scattered light from HD 144432 (Monnier et al., 2017), which may indicate that the disk was truncated by its stellar companions (see discussion by Monnier et al., 2017), or that the disk has already lost much of its gas given the old age of its association (Upper Scorpius, 10 Myr; Pecaut et al., 2012).
2.2 SMA Observations and Data Reduction
| Project | Date | Star+Disk | Config. | # | Time on | Baselines | Bandpass | Flux | Gain |
|---|---|---|---|---|---|---|---|---|---|
| Code | System | of Ant. | Source | Calibrator | Calibrator | Calibrator(s) | |||
| (min) | (m) | ||||||||
| 2020B-S007 | 2021 May 1∗ | HD 142666 | Compact | 6 | 187 | 18-77 | 3c279 | Titan | 1517-243, 1626-298 |
| 2021 May 1∗ | HD 144432 | Compact | 6 | 178 | 18-77 | 3c279 | Titan | 1517-243, 1626-298 | |
| 2020A-S007 | 2020 Nov. 14 | HD 38120 | Subcompact | 8 | 232 | 9-69 | 3c84 | Uranus | 0532+075, 0607-085 |
| 2019B-S037 | 2020 March 10 | HD 36112 | Compact | 7 | 225 | 16-77 | 3c279 | Uranus | 0555+398 |
| 2020 March 9 | HD 34282 | Compact | 7 | 200 | 16-77 | 3c279 | Uranus | 0541-056 | |
| 2020 Feb. 27∗ | HD 142666 | Compact | 7 | 178 | 16-77 | 3c279 | Titan | 1517-243, 1626-298 | |
| 2020 Feb. 27∗ | HD 144432 | Compact | 7 | 178 | 16-77 | 3c279 | Titan | 1517-243, 1626-298 |
Note. — Column 1: SMA project code. Column 2: Date of observations. Column 3: Star+disk system observed. Column 4: SMA configuration. Column 5: Time spent per source. Column 6: Number of baselines. Columns 7, 8, and 9: Bandpass, flux, and gain calibrators, respectively.
*: HD 142666 and HD 144432 were observed during the same observing sessions.
All disks were observed with the Submillimeter Array111The Submillimeter Array is a joint project between the Smithsonian Astrophysical Observatory and the Academia Sinica Institute of Astronomy and Astrophysics and is funded by the Smithsonian Institution and the Academia Sinica. (SMA; Ho et al., 2004) during projects 2019B-S037, 2020A-S007, and 2020B-S007. Table 2 summarizes the observational details. Four of the disks were observed in the compact configuration with seven antennas, while the fifth (HD 38120) was observed in the subcompact configuration with eight antennas. HD 142666 and HD 144432 were observed together during two shared tracks, while all other disks were observed during individual tracks.
The observations were conducted with the SMA SWARM correlator, which at the time of the initial observations consisted of 16 2 GHz bands, or 32 GHz in total per source222The SWARM correlator has since been upgraded and now allows a total spectral bandwidth of 48 GHz. HD 38120 and the second shared track targeting HD 142666 and HD 144432 were observed with the upgraded SWARM correlator, but we do not use the additional bandwidth in this study due to the disks’ faint molecular line emission.. For the 230 GHz receiver, we tuned band S1 in the upper spectral band to the 12CO J=2–1 line (230.538 GHz). For HD 142666 and HD 144432, which were expected to be relatively inclined disks (based on the broad Keplerian profiles fitted to their 12CO 3–2 emission by Dent et al., 2005), we shifted the 230 GHz setup by 0.2 GHz to permit wider coverage of both the C18O J=2–1 line (219.560 GHz) and the DCN J=3–2 line (217.239 GHz). For the 240 GHz receiver, we tuned band S4 in the upper spectral band to the HCO+ J=3–2 line (267.558 GHz).
This setup permitted coverage of molecular lines within four spectral bands: 213-221 GHz, 229-237 GHz, 244-252 GHz, and 260-268 GHz.333Each 8 GHz spectral band was observed in four 2 GHz bands. We removed the 0.1 GHz from the edges of each band during analysis to avoid spectral artifacts. The native resolution of the observations was 140 kHz (0.16-0.20 km s-1 across the bands) for four disks. For the fifth and faintest disk (HD 38120), we binned the SMA data by 4, reducing the resolution from the native 140 kHz to 559 kHz (0.63-0.79 km s-1 across the bands).
We calibrated the SMA data using the MIR package444See the MIR Cookbook (https://www.cfa.harvard.edu/~cqi/mircook.html) for standard calibration practices.. We performed continuum subtraction for each SMA band with the Common Astronomy Software Applications package (CASA; McMullin et al., 2007; CASA Team et al., 2022) version 4.7.2. For cleaning, we constructed a clean mask that encompassed the mm continuum and 12CO 2–1 emission, and we used the mask to uniformly clean all channels down to 3.
After the continuum subtraction, we imaged with spectral resolution coarser than the native SWARM resolution to enhance the signal-to-noise for any line emission. We used 0.5 km s-1 velocity bins for HD 34282 and HD 36112 and 2 km s-1 bins for the fainter, more highly inclined disks HD 142666 and HD 144432.
2.3 Target Molecular Lines
| Molecular | Frequency | Aul | |
|---|---|---|---|
| Line | (GHz) | (s-1) | (K) |
| 12CO J=2–1 | 230.538 | 6.9110-7 | 16.6 |
| 13CO J=2–1 | 220.399 | 6.0810-7 | 15.9 |
| C18O J=2–1 | 219.560 | 6.0110-7 | 15.8 |
| HCO+ J=3–2 | 267.558 | 1.4810-3 | 25.7 |
| CS J=5–4 | 244.936 | 3.4910-4 | 35.3 |
| HCN J=3–2aaC2H N=3–2, J=7/2–5/2 includes the hyperfine transitions F=4–3 and F=3–2. HCN J=3–2, DCN J=3–2, and DCO+ J=3–2 include only the hyperfine transitions blended with their brightest transition (at 265.886 GHz, 217.239 GHz, and 216.113 GHz, respectively). | 265.886 | 8.3610-4 | 25.5 |
| C2H N=3–2, J=7/2–5/2aaC2H N=3–2, J=7/2–5/2 includes the hyperfine transitions F=4–3 and F=3–2. HCN J=3–2, DCN J=3–2, and DCO+ J=3–2 include only the hyperfine transitions blended with their brightest transition (at 265.886 GHz, 217.239 GHz, and 216.113 GHz, respectively). | 262.004 | 5.3110-5 | 25.1 |
| DCN J=3–2aaC2H N=3–2, J=7/2–5/2 includes the hyperfine transitions F=4–3 and F=3–2. HCN J=3–2, DCN J=3–2, and DCO+ J=3–2 include only the hyperfine transitions blended with their brightest transition (at 265.886 GHz, 217.239 GHz, and 216.113 GHz, respectively). | 217.239 | 4.5910-4 | 20.9 |
| DCO+ J=3–2aaC2H N=3–2, J=7/2–5/2 includes the hyperfine transitions F=4–3 and F=3–2. HCN J=3–2, DCN J=3–2, and DCO+ J=3–2 include only the hyperfine transitions blended with their brightest transition (at 265.886 GHz, 217.239 GHz, and 216.113 GHz, respectively). | 216.113 | 7.6610-4 | 20.7 |
| H2CO 303–202 | 218.222 | 2.8210-4 | 21.0 |
Table 3 describes the spectroscopic characteristics of the target molecular lines covered by the correlator setup.555We also checked lines of CH3CN, CH3OH, c-C3H2, H13CN, HC15N, HC3N, H2CS, HNCO, H13CO+, and N2D+ that fell within the total 213-268 GHz range of the correlator. These lines were either not detected or were at or beyond the edges of the individual SMA bands. These lines have been observed in previous surveys that targeted disks around lower mass pre-main-sequence M-type through G-type stars (collectively known as “T Tauri” stars; e.g., Öberg et al., 2010, 2011; Huang et al., 2017; Bergner et al., 2019, 2020; Miotello et al., 2019; Le Gal et al., 2019; Pegues et al., 2020, 2021a), permitting direct comparison of our observations to T Tauri disk chemistry. Observations and models have shown that these molecules reflect a disk’s physical and chemical makeup, including the disk’s gas mass and surface density (the CO isotopologues 12CO J=2–1, 13CO J=2–1, and C18O J=2–1; e.g., Miotello et al., 2014; Zhang et al., 2021), distributions of small carbon-bearing, nitrogen-bearing, and sulfur-bearing organics (C2H N=3–2, J=7/2–5/2, HCN J=3–2, and CS J=5–4; e.g., Bergner et al., 2019; Le Gal et al., 2019; Guzmán et al., 2021), cold and deuterated chemistry (DCN J=3–2, DCO+ J=3–2, and H2CO 303–202; e.g., Huang et al., 2017; Pegues et al., 2020; Cataldi et al., 2021), and ionization (HCO+ J=3–2; e.g., Cleeves et al., 2014; Aikawa et al., 2021)666These lines are denoted as 12CO 2–1, 13CO 2–1, C18O 2–1, C2H 3–2, HCN 3–2, CS 5–4, DCN 3–2, DCO+ 3–2, H2CO 3–2, and HCO+ 3–2, respectively, throughout the rest of this paper..
2.4 Disk Sample from the Literature
To facilitate comparison of chemistry across the pre-main-sequence stellar mass distribution (i.e., from M-type through B-type stars), we have compiled a sample of protoplanetary disks from the literature that have interferometric millimeter-wavelength (mm) observations of at least one of the target lines in Table 3777For disks from the literature where H2CO 3–2 was not observed, we use H2CO 404–303 (H2CO 4–3) observations as a proxy when available. Both transitions are expected empirically to give similar fluxes (Pegues et al., 2020).. Appendix A describes the stellar characteristics of the literature sample and lists the total (i.e., disk-integrated and velocity-integrated as applicable) mm continuum and molecular line fluxes and upper limits.
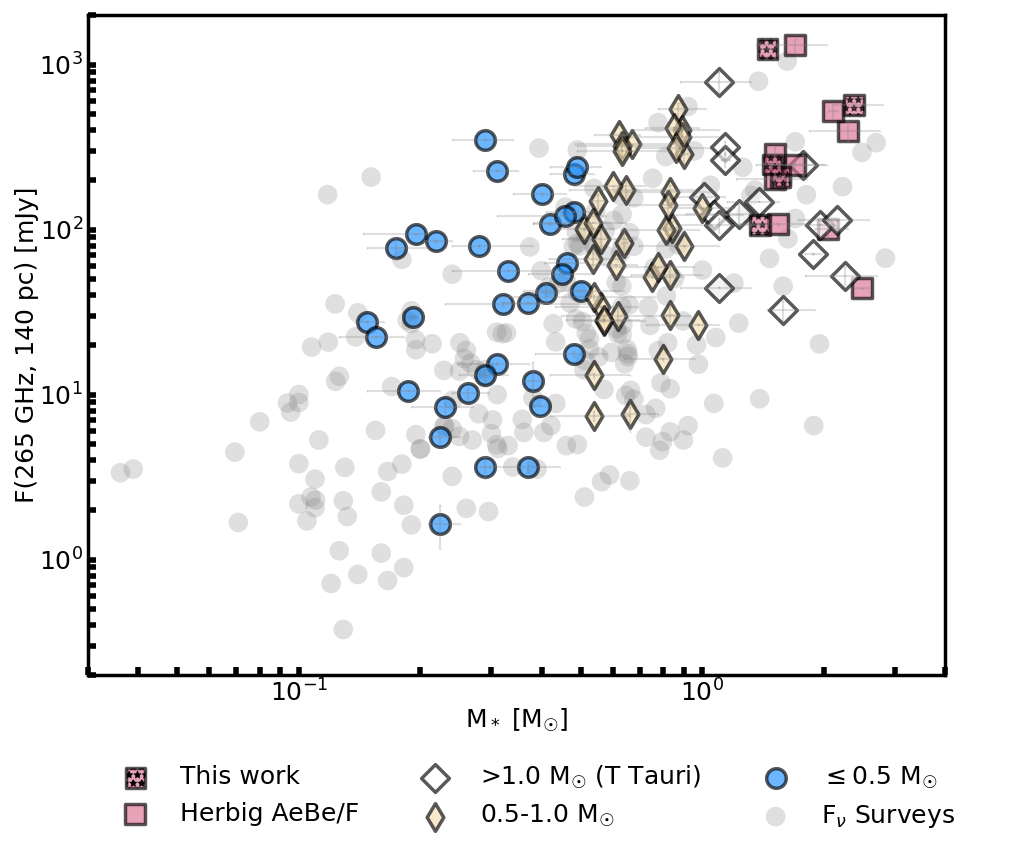
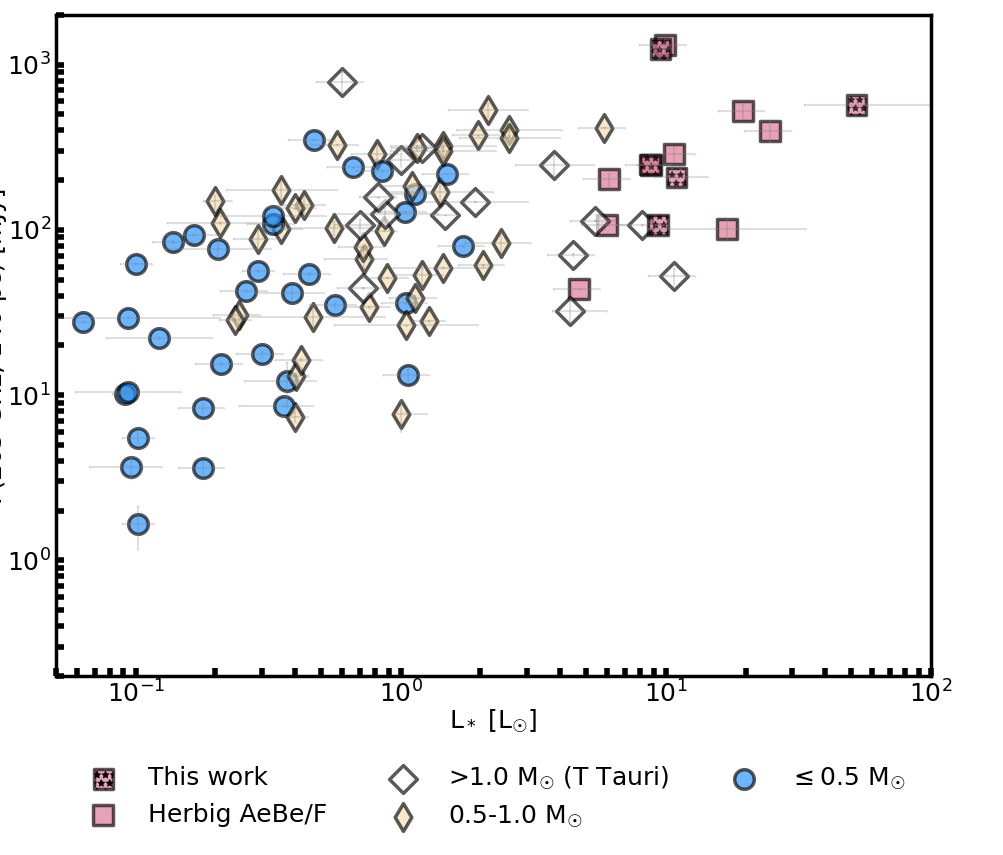
We split the literature sample into four categories: (1) 0.5 M☉, (2) = 0.5-1.0 M☉, (3) T Tauri disks with 1.0 M☉, and (4) disks around F-type, B-type, and A-type pre-main-sequence stars (“Herbig AeBe/F disks”), where is the disk’s stellar mass. Figure 1 compares mm continuum fluxes for the five disks from this work to (1) the literature disk sample, as well as to (2) disks from mm continuum surveys. We find that our five target disks and the literature sample are consistent with the generally positive correlation between mm continuum flux and the mass and luminosity of the host star.
Figure 1 also shows that, though the Herbig AeBe/F disks host the most massive and most luminous stars in the combined sample, they do not all have the largest millimeter-wavelength continuum fluxes. Assuming mm continuum flux is proportional to disk size by a roughly consistent factor (see, e.g., empirical relationships in Andrews, 2020), we note that the disks around less massive stars in our combined sample may have relatively large disks (which, indeed, makes them easier observing targets), and/or the Herbig AeBe/F disks have relatively small or truncated morphologies (possibly due to disk dust evolution over time, and/or to their preferentially massive orbital companions, as discussed in Section 1).
3 Analysis
3.1 Emission Extraction
To extract the mm continuum emission in each SMA spectral band, we used masks built from two-dimensional Gaussian fits to the mm continuum emission. We used the model fitted to the combined mm continuum emission (i.e., taken across all four SMA spectral bands) to estimate a characteristic center for each disk, and we used the mask derived from this fit to uniformly extract an unbiased spectrum across all bandwidth. The unbiased spectra are plotted in Appendix B, providing a complete view of the SMA bandwidth and the targeted molecular lines for each disk.
For the targeted molecular lines, we extracted emission with Keplerian masks (Pegues, 2019). Keplerian masks use the expected Keplerian rotation of a disk to predict spatial distributions of emission within each velocity channel. These masks can reduce the noise contributed per channel relative to elliptical masks (e.g., Yen et al., 2016). The edges of these masks were set to 2.5 the radii in Table 2.1 (where 2.5 is the empirical dust-to-CO disk radius factor measured in Andrews, 2020). We used the Keplerian-masked emission across channels to generate image products for each line, including spectra, velocity-integrated emission maps (i.e., zeroth moment maps), and velocity-integrated fluxes.
3.2 Noise Estimation
We estimated the noise for each image product888Our error estimates do not include 10% flux calibration uncertainties. via bootstrapping over 1000 random samples of emission-free channels/regions. We used the average root-mean-square (rms; mJy beam-1) as an estimate of (1) the noise for the mm continuum emission and (2) the noise per channel for the target line emission. In both cases, we extracted the random samples from within the corresponding elliptical masks (see Section 3.1).
For the mm continuum flux errors and the line flux errors, we took the standard deviation of the noise summed within the elliptical continuum mask (mJy) and within the Keplerian masks (mJy km s-1), respectively. For the error in the velocity-integrated emission maps, we used the same methodology as Bergner et al. (2018): we (1) generated velocity-integrated “noise” maps from samples of emission-free channels and (2) took the median of the resulting maps as a representation of the map error.
To avoid artifacts at the image edges caused by the primary beam corrections, all random samples were extracted from within a square region -180 to +180 around the disk center. We also excluded the inner square region -50 to +50 when estimating noise for the mm continuum.
4 Results
| Star+Disk | Repr. Freq. | Flux | Peak Em. | rms | Synthesized | Gaus. Param. |
|---|---|---|---|---|---|---|
| System | (GHz) | (mJy) | (mJy beam-1) | (mJy beam-1) | Beam (P.A.) | (, , ) |
| HD 34282 | Comb. | 130.5 2.7 | 124.1 1.3 | 2 | 40 26 (36.8) | 17, 12, 127.9 |
| 218 | 100.8 2.4 | 91.9 1.0 | 1.5 | 44 29 (37.0) | ||
| 234 | 128.4 2.6 | 119.3 0.9 | 1.6 | 40 25 (33.7) | ||
| 249 | 162.8 3.2 | 152.4 1.4 | 2.4 | 40 27 (34.9) | ||
| 265 | 205.2 6.9 | 184.1 3.0 | 3.6 | 37 23 (38.0) | ||
| HD 36112 | Comb. | 83.4 2.3 | 75.1 0.9 | 1.3 | 31 27 (53.1) | 13, 14, 66.5 |
| 218 | 59.4 1.0 | 53.7 0.4 | 0.78 | 36 30 (38.9) | ||
| 234 | 82.3 1.6 | 74.9 0.7 | 1.1 | 31 26 (33.0) | ||
| 249 | 102.7 2.1 | 90.3 0.9 | 1.3 | 33 28 (68.2) | ||
| 265 | 134.8 3.9 | 115.0 1.2 | 2.2 | 29 25 (63.9) | ||
| HD 38120 | Comb. | 38.7 0.9 | 39.3 0.3 | 0.59 | 36 28 (4.8) | 15, 12, 84.6 |
| 218 | 28.6 0.7 | 28.1 0.3 | 0.49 | 43 32 (-0.4) | ||
| 234 | 39.1 1.3 | 39.8 0.4 | 0.65 | 38 29 (2.8) | ||
| 249 | 43.0 1.6 | 43.8 0.3 | 0.69 | 37 28 (4.4) | ||
| 265 | 60.7 2.5 | 55.8 0.9 | 0.97 | 35 25 (9.7) | ||
| HD 142666 | Comb. | 135.5 1.4 | 134.6 0.9 | 1.1 | 33 28 (-24.8) | 14, 12, 114.3 |
| 218 | 110.0 1.1 | 106.9 0.5 | 0.9 | 37 31 (-21.7) | ||
| 234 | 137.3 1.5 | 134.8 1.0 | 1.2 | 34 28 (-21.2) | ||
| 249 | 151.6 1.5 | 143.8 0.8 | 1.2 | 33 28 (-23.2) | ||
| 265 | 183.1 2.4 | 174.0 1.2 | 1.9 | 31 25 (-21.4) | ||
| HD 144432 | Comb. | 54.6 0.7 | 55.4 0.3 | 0.51 | 35 27 (-16.7) | 15, 12, 106.5 |
| 218 | 45.9 0.9 | 44.7 0.4 | 0.57 | 40 31 (-14.0) | ||
| 234 | 56.4 1.5 | 56.7 0.6 | 0.84 | 36 28 (-13.0) | ||
| 249 | 62.3 1.3 | 59.5 0.6 | 0.83 | 35 28 (-14.0) | ||
| 265 | 70.2 1.7 | 68.7 0.7 | 1.1 | 33 25 (-16.5) | ||
Note. — Column 1: Star+disk system. Column 2: Representative frequency for the SMA spectral band from which the mm continuum emission was measured. Emission taken across all combined SMA spectral bands is labeled “Comb.”. Columns 3, 4, and 5: Total mm continuum flux, peak mm continuum intensity, and rms, respectively, along with the estimated errors (Section 3.2). Note that given the significant change in beam size across all SMA spectral bands, these values and errors were estimated from different elliptical masks (Section 3.1). Column 6: Dimensions of the synthesized beam. Column 7: Parameters for the Gaussian fits to the combined mm continuum emission (Section 3.1).
All errors do not include 10% flux calibration uncertainties.
| Star+Disk | Molecular | Int. Flux | Peak Flux | Velocity | Channel | Channel rms | Synthesized |
|---|---|---|---|---|---|---|---|
| System | Line | (mJy | (mJy beam-1 | Range | Spacing | (mJy | Beam (P.A.) |
| km s-1) | km s-1) | (km s-1) | (km s-1) | beam-1) | |||
| HD 34282 | 12CO 2-1 | 8149 282 | 7721 212 | [-6.39, 1.11] | 0.5 | 145 | 66 24 (24.3) |
| HD 36112 | 7370 208 | 7142 161 | [3.02, 8.52] | 0.5 | 125 | 48 26 (16.6) | |
| HD 142666 | 3250 205 | 3998 168 | [-1.64, 10.37] | 2.0 | 42 | 35 29 (-19.9) | |
| HD 144432 | 1034 226 | 1221 172 | [-0.88, 11.13] | 2.0 | 44 | 37 29 (-13.8) | |
| HD 34282 | 13CO 2-1 | 2469 249 | 2661 184 | [-6.69, 0.82] | 0.5 | 126 | 70 25 (25.5) |
| HD 36112 | 2017 176 | 2278 132 | [3.17, 8.68] | 0.5 | 109 | 51 27 (17.8) | |
| HD 142666 | 1206 197 | 1293 161 | [-1.43, 10.59] | 2.0 | 40 | 36 30 (-17.2) | |
| HD 144432 | 646 | 712 154 | [-0.68, 11.33] | 2.0 | 41 | 39 30 (-14.7) | |
| HD 34282 | C18O 2-1 | 912 249 | 955 187 | [-6.22, 0.82] | 0.5 | 133 | 70 25 (25.5) |
| HD 36112 | 732 179 | 750 135 | [3.18, 8.71] | 0.5 | 112 | 51 27 (17.8) | |
| HD 142666 | 550 167 | 761 140 | [-1.26, 10.70] | 2.0 | 34 | 36 31 (-18.3) | |
| HD 144432 | 552 | 402 | [-0.51, 11.44] | 2.0 | 35 | 39 30 (-13.4) | |
| HD 34282 | HCO+ 3-2 | 1325 428 | 1802 308 | [-6.29, 1.21] | 0.5 | 190 | 33 23 (45.2) |
| HD 36112 | 1048 333 | 981 205 | [3.11, 8.61] | 0.5 | 172 | 28 23 (80.1) | |
| HD 142666 | 1339 280 | 1746 245 | [-2.24, 9.76] | 2.0 | 55 | 31 25 (-18.9) | |
| HD 144432 | 981 | 725 | [0.51, 12.51] | 2.0 | 59 | 33 25 (-14.1) | |
| HD 34282 | CS 5-4 | 847 | 750 208 | [-6.25, 1.27] | 0.5 | 135 | 35 26 (43.4) |
| HD 36112 | 667 | 691 182 | [3.07, 8.58] | 0.5 | 119 | 31 24 (84.4) | |
| HD 142666 | 629 | 485 | [-2.59, 9.44] | 2.0 | 40 | 33 28 (-17.2) | |
| HD 144432 | 677 | 491 | [0.17, 12.20] | 2.0 | 42 | 35 27 (-12.3) | |
| HD 34282 | HCN 3-2 | 1439 | 1719 260 | [-6.23, 1.26] | 0.5 | 171 | 33 23 (43.5) |
| HD 36112 | 1313 | 568 | [3.15, 8.64] | 0.5 | 152 | 29 23 (80.4) | |
| HD 142666 | 1770 296 | 2226 216 | [-1.98, 10.00] | 2.0 | 50 | 31 25 (-19.5) | |
| HD 144432 | 1031 | 722 196 | [0.76, 12.75] | 2.0 | 52 | 33 25 (-14.5) | |
| HD 34282 | C2H 3-2 | 1532 | 1228 350 | [-8.78, 1.20] | 0.5 | 209 | 60 22 (27.3) |
| HD 36112 | 1281 | 802 | [0.58, 8.56] | 0.5 | 190 | 45 24 (25.4) | |
| HD 142666 | 921 | 738 | [-4.15, 9.83] | 2.0 | 53 | 32 25 (-19.9) | |
| HD 144432 | 1079 | 709 | [-3.40, 12.57] | 2.0 | 55 | 33 25 (-16.0) | |
| HD 34282 | DCN 3-2 | 581 | 409 | [-6.36, 1.13] | 0.5 | 96 | 39 28 (44.1) |
| HD 36112 | 437 | 288 | [2.95, 8.43] | 0.5 | 82 | 33 28 (61.9) | |
| HD 142666 | 504 | 412 | [-2.66, 9.32] | 2.0 | 35 | 37 31 (-17.3) | |
| HD 144432 | 566 | 446 134 | [0.09, 12.06] | 2.0 | 36 | 39 31 (-11.2) | |
| HD 34282 | DCO+ 3-2 | 529 | 567 128 | [-6.23, 1.29] | 0.5 | 82 | 39 28 (44.1) |
| HD 36112 | 387 | 332 89 | [3.12, 8.64] | 0.5 | 72 | 33 28 (61.9) | |
| HD 142666 | 493 | 536 136 | [-2.01, 10.03] | 2.0 | 33 | 37 31 (-17.3) | |
| HD 144432 | 516 | 382 | [0.75, 12.79] | 2.0 | 34 | 39 31 (-11.2) | |
| HD 34282 | H2CO 303-202 | 655 | 496 | [-6.46, 1.06] | 0.5 | 108 | 70 25 (25.4) |
| HD 36112 | 452 | 307 | [3.40, 8.41] | 0.5 | 92 | 52 27 (17.4) | |
| HD 142666 | 509 | 413 | [-1.19, 10.84] | 2.0 | 34 | 36 31 (-18.3) | |
| HD 144432 | 571 | 413 | [-0.44, 11.59] | 2.0 | 36 | 39 30 (-13.4) |
Note. — Column 1: Star+disk system. Column 2: Molecular line. Column 3: Velocity-integrated flux. “” and “” are 3 upper limits and mark tentative detections and non-detections, respectively. Column 4: Peak flux. Column 5: Total velocity range used to estimate columns 3 and 4. The range is centered on the systemic velocity (Table 2.1). Column 6: Spacings between imaged channels. Column 7: Channel rms. Column 8: Dimensions of the synthesized beam.
Columns 3, 4, and 7 were estimated within the Keplerian masks. rms and errors were estimated via bootstrapping (Section 3.2). Errors do not include 10% absolute flux calibration uncertainties.
4.1 Millimeter-Wavelength Continuum and Molecular Line Detections
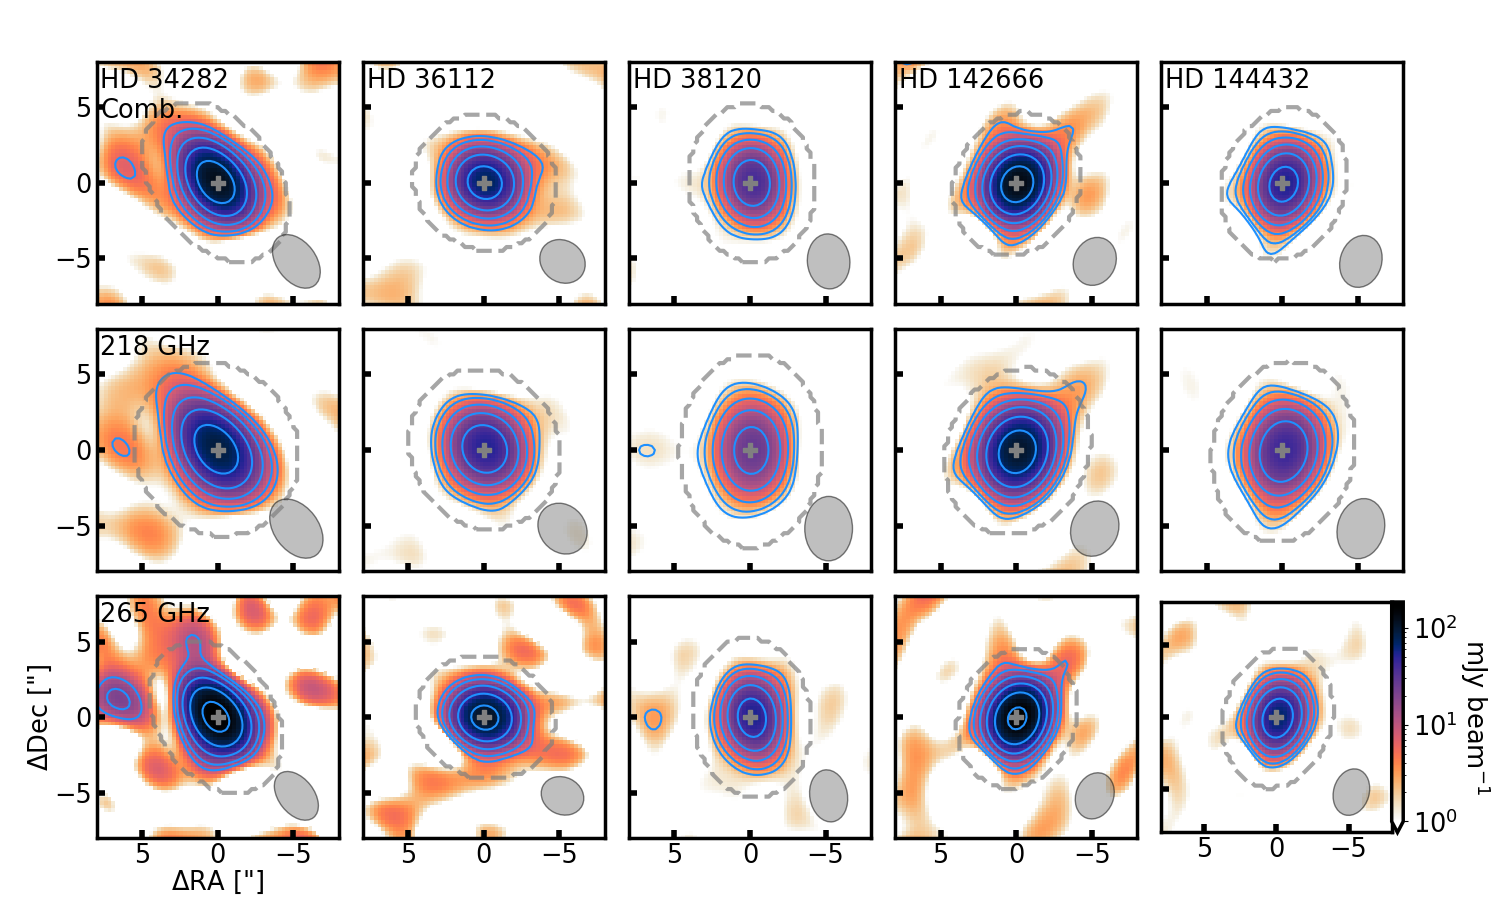
Table 4 presents the mm continuum fluxes, synthesized beam sizes, and estimated error measured for the individual and combined SMA spectral bands for each disk. Figure 2 shows the mm continuum emission for the lowest frequency, highest frequency, and combined SMA spectral bands. We detect mm continuum emission at millimeter wavelengths above 3 from all five disks in the sample.
For HD 34282, HD 36112, and HD 142666, 1.3 mm continuum fluxes have been measured at higher spatial resolution in the literature (Stapper et al., 2022). While our 234 GHz continuum fluxes are consistent with these literature values within 15% for HD 36112 and HD 142666, our 234 GHz continuum flux for HD 34282 (128 mJy) exceeds the literature value by over 15% (99 mJy; Stapper et al., 2022). This excess could be due to differences in uv coverage between the observations, or to inclusion of an extended or external source of emission within the extraction masks (see Section 4.3).
We classified detections of the molecular line emission according to the following criteria (where the and error values are as described in Section 3.2):
-
1.
Peak emission is 3 the noise estimated for the velocity-integrated emission map over a significant spatial area (at least 7%9997% is based on a simple geometric argument for the beams, which are too large to fully resolve the observed emission: for a point source image convolved with a Gaussian of standard deviation , the ratio of areas between a circle of diameter and a circle containing the bulk of the emission (taken to be 95%, which is contained within a diameter of 4 by the 68-95-99 rule) is 1/16, or 7%. of the beam).
-
2.
The velocity-integrated line flux is 3.
Molecular lines that fulfilled both criteria were classified as detections, while lines that fulfilled one criterion were classified as tentative detections. If neither criterion was met, then the lines were classified as non-detections.
Based on these criteria, we detect 12CO 2–1 from four disks. We detect 13CO 2–1, C18O 2–1, and HCO+ 3–2 from three disks, and tentatively detect 13CO 2–1 from a fourth disk. We detect HCN 3–2 from one disk and tentatively detect the same line from another disk. Finally, we tentatively detect CS 5–4 and DCO+ 3–2 from two disks each, and we tentatively detect C2H 3–2 and DCN 3–2 from one disk each. All other line+disk pairs are not detected at the sensitivity of our observations.
We do not detect any molecular line emission, including 12CO 2–1, from HD 38120. This is in contrast to Dent et al. (2005), which observed a bright 12CO 3–2 spectrum from HD 38120 with the James Clerk Maxwell Telescope (JCMT; see their Figure 2b). We note that (1) Dent et al. (2005) reported a beam size of 1400 au at 100 pc, or an angular resolution of 140; (2) Dent et al. (2005) fitted the 12CO 3–2 spectrum with a single rather than double-peaked Gaussian despite the disk’s high inclination angle (Table 2.1); and (3) there appears to be absorption affecting the 12CO 2–1 spectrum (see Appendix B). It is therefore possible that the 12CO 3–2 spectrum in Dent et al. (2005) was contaminated by CO emission from a surrounding cloud or envelope.
We do detect relatively faint mm continuum emission from HD 38120, suggesting that a dust disk does exist in this system. That being said, observing any molecular gas present in this disk would likely require greater sensitivity than initially expected in this survey. Since our line flux upper limits for this disk are non-constraining, in that we are unable to distinguish any of the disk’s 12CO 2–1 emission from possible environmental contamination, we exclude HD 38120 from subsequent line flux analysis and discussion.
4.2 Gas and Dust Morphologies
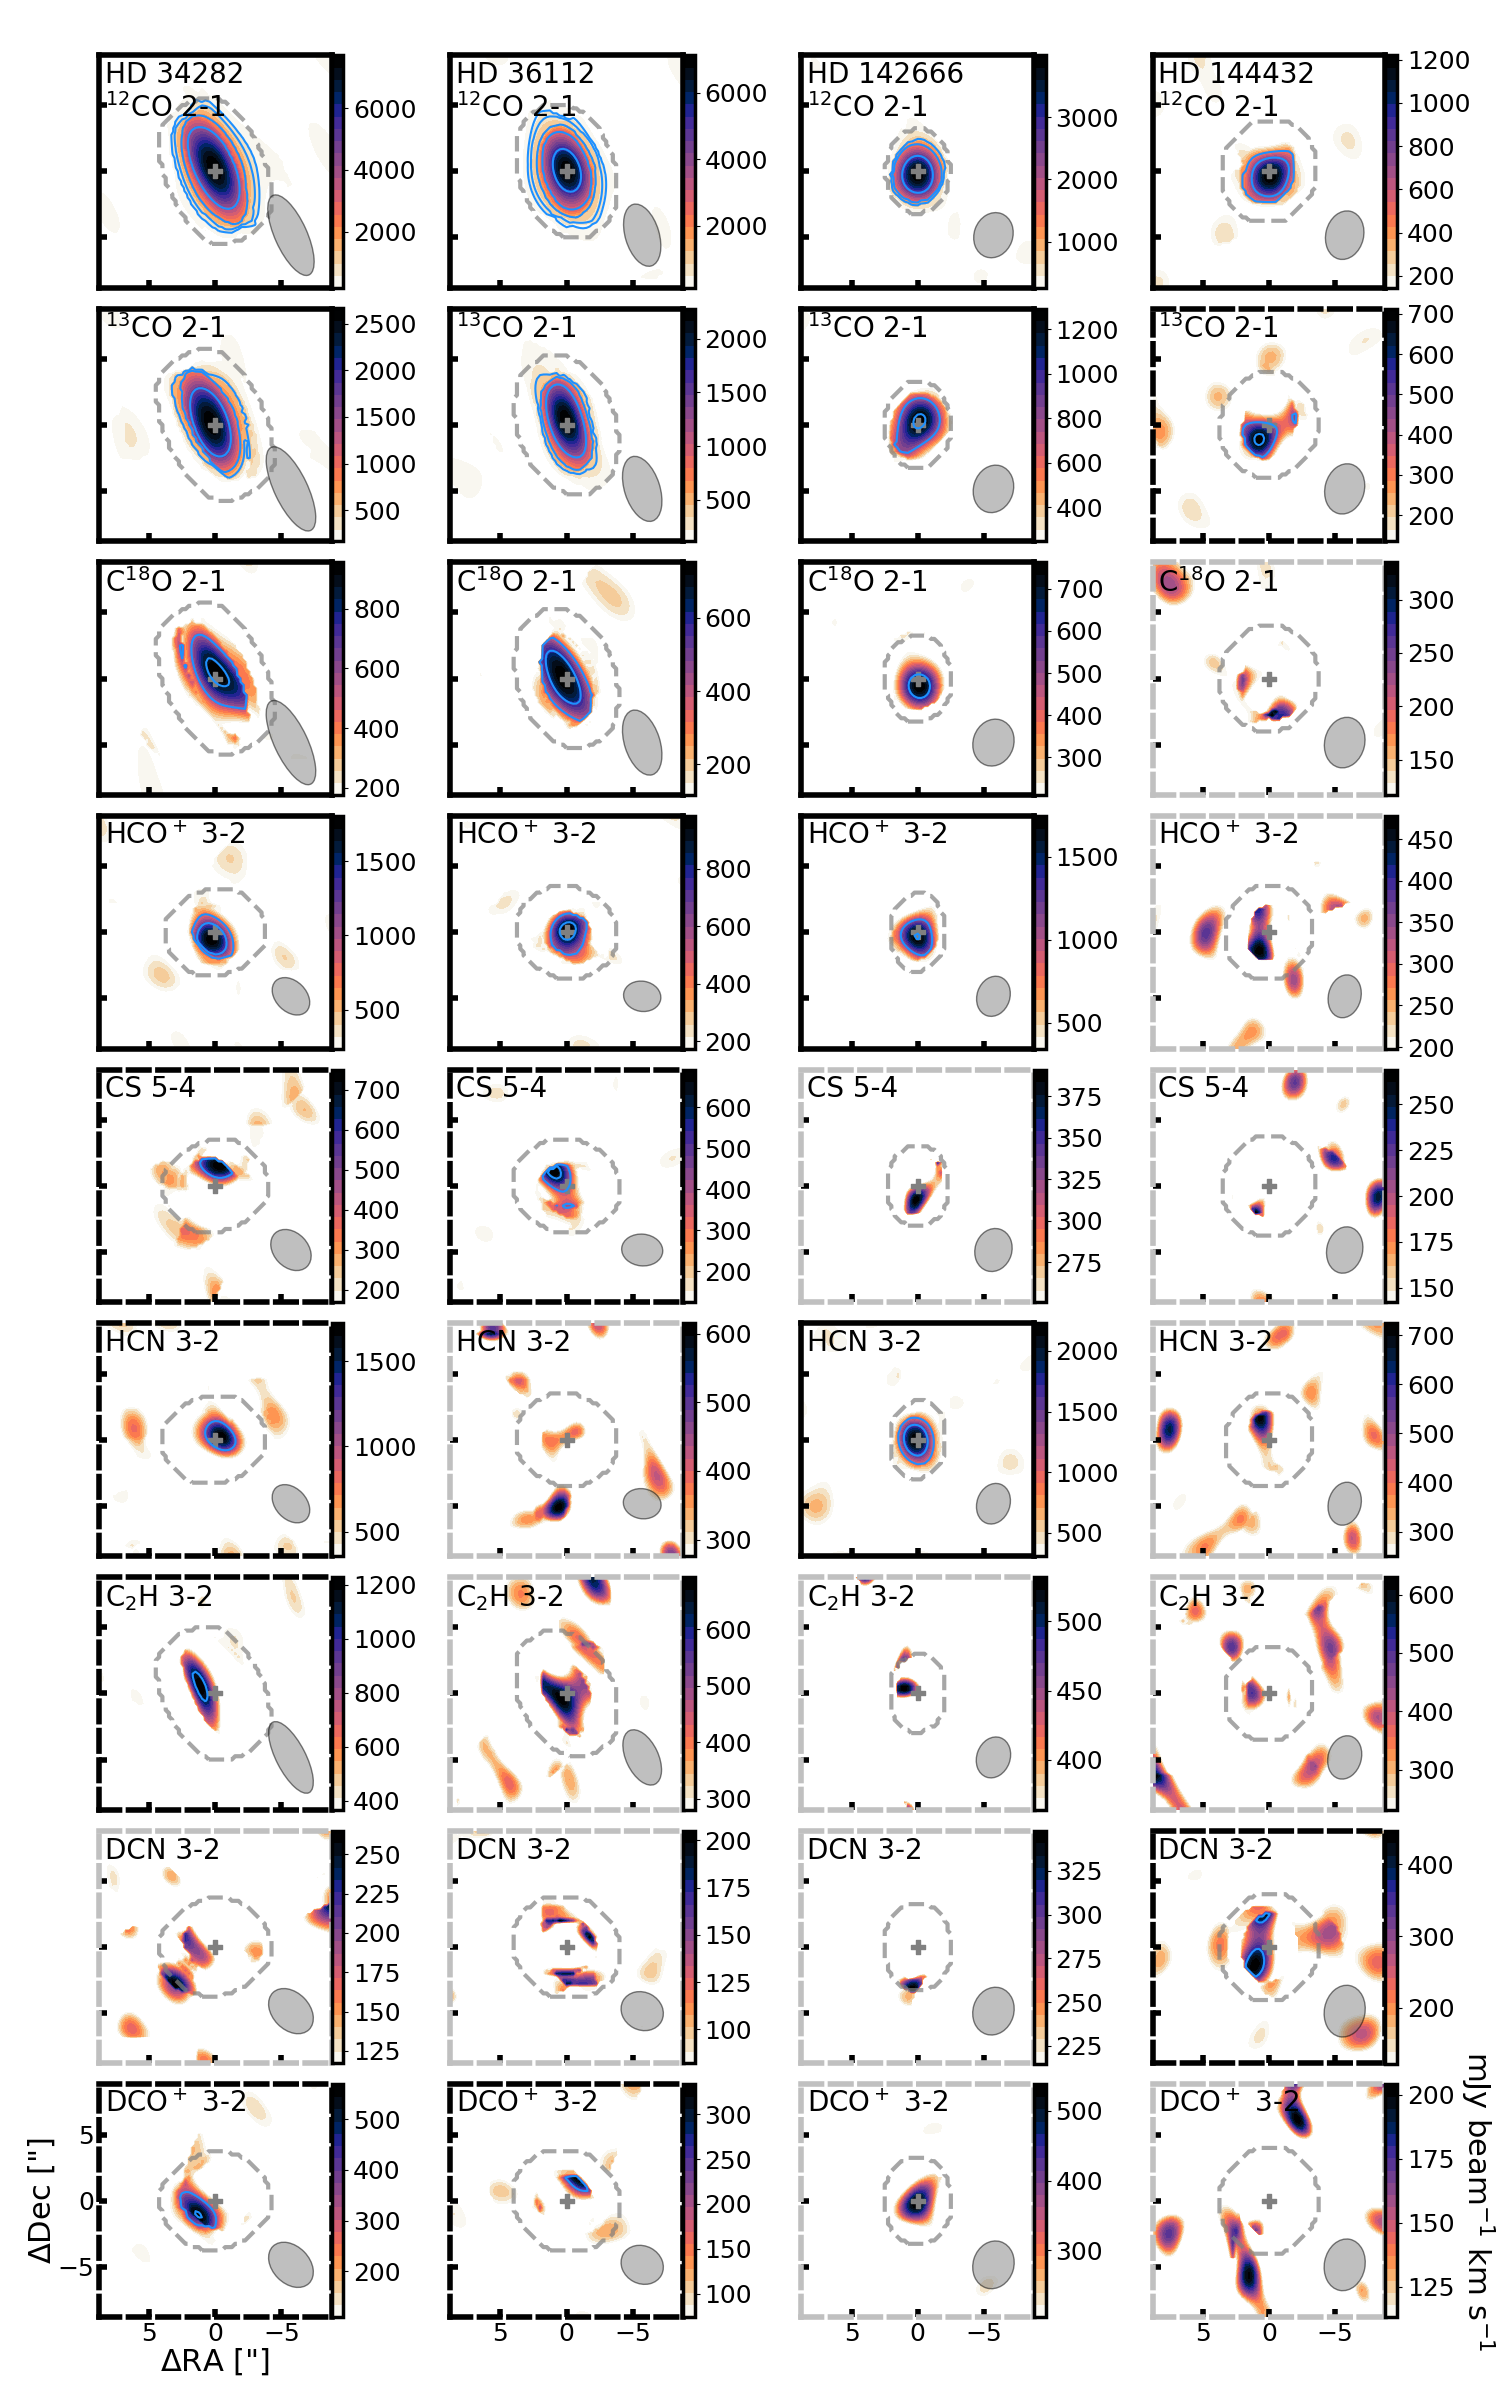
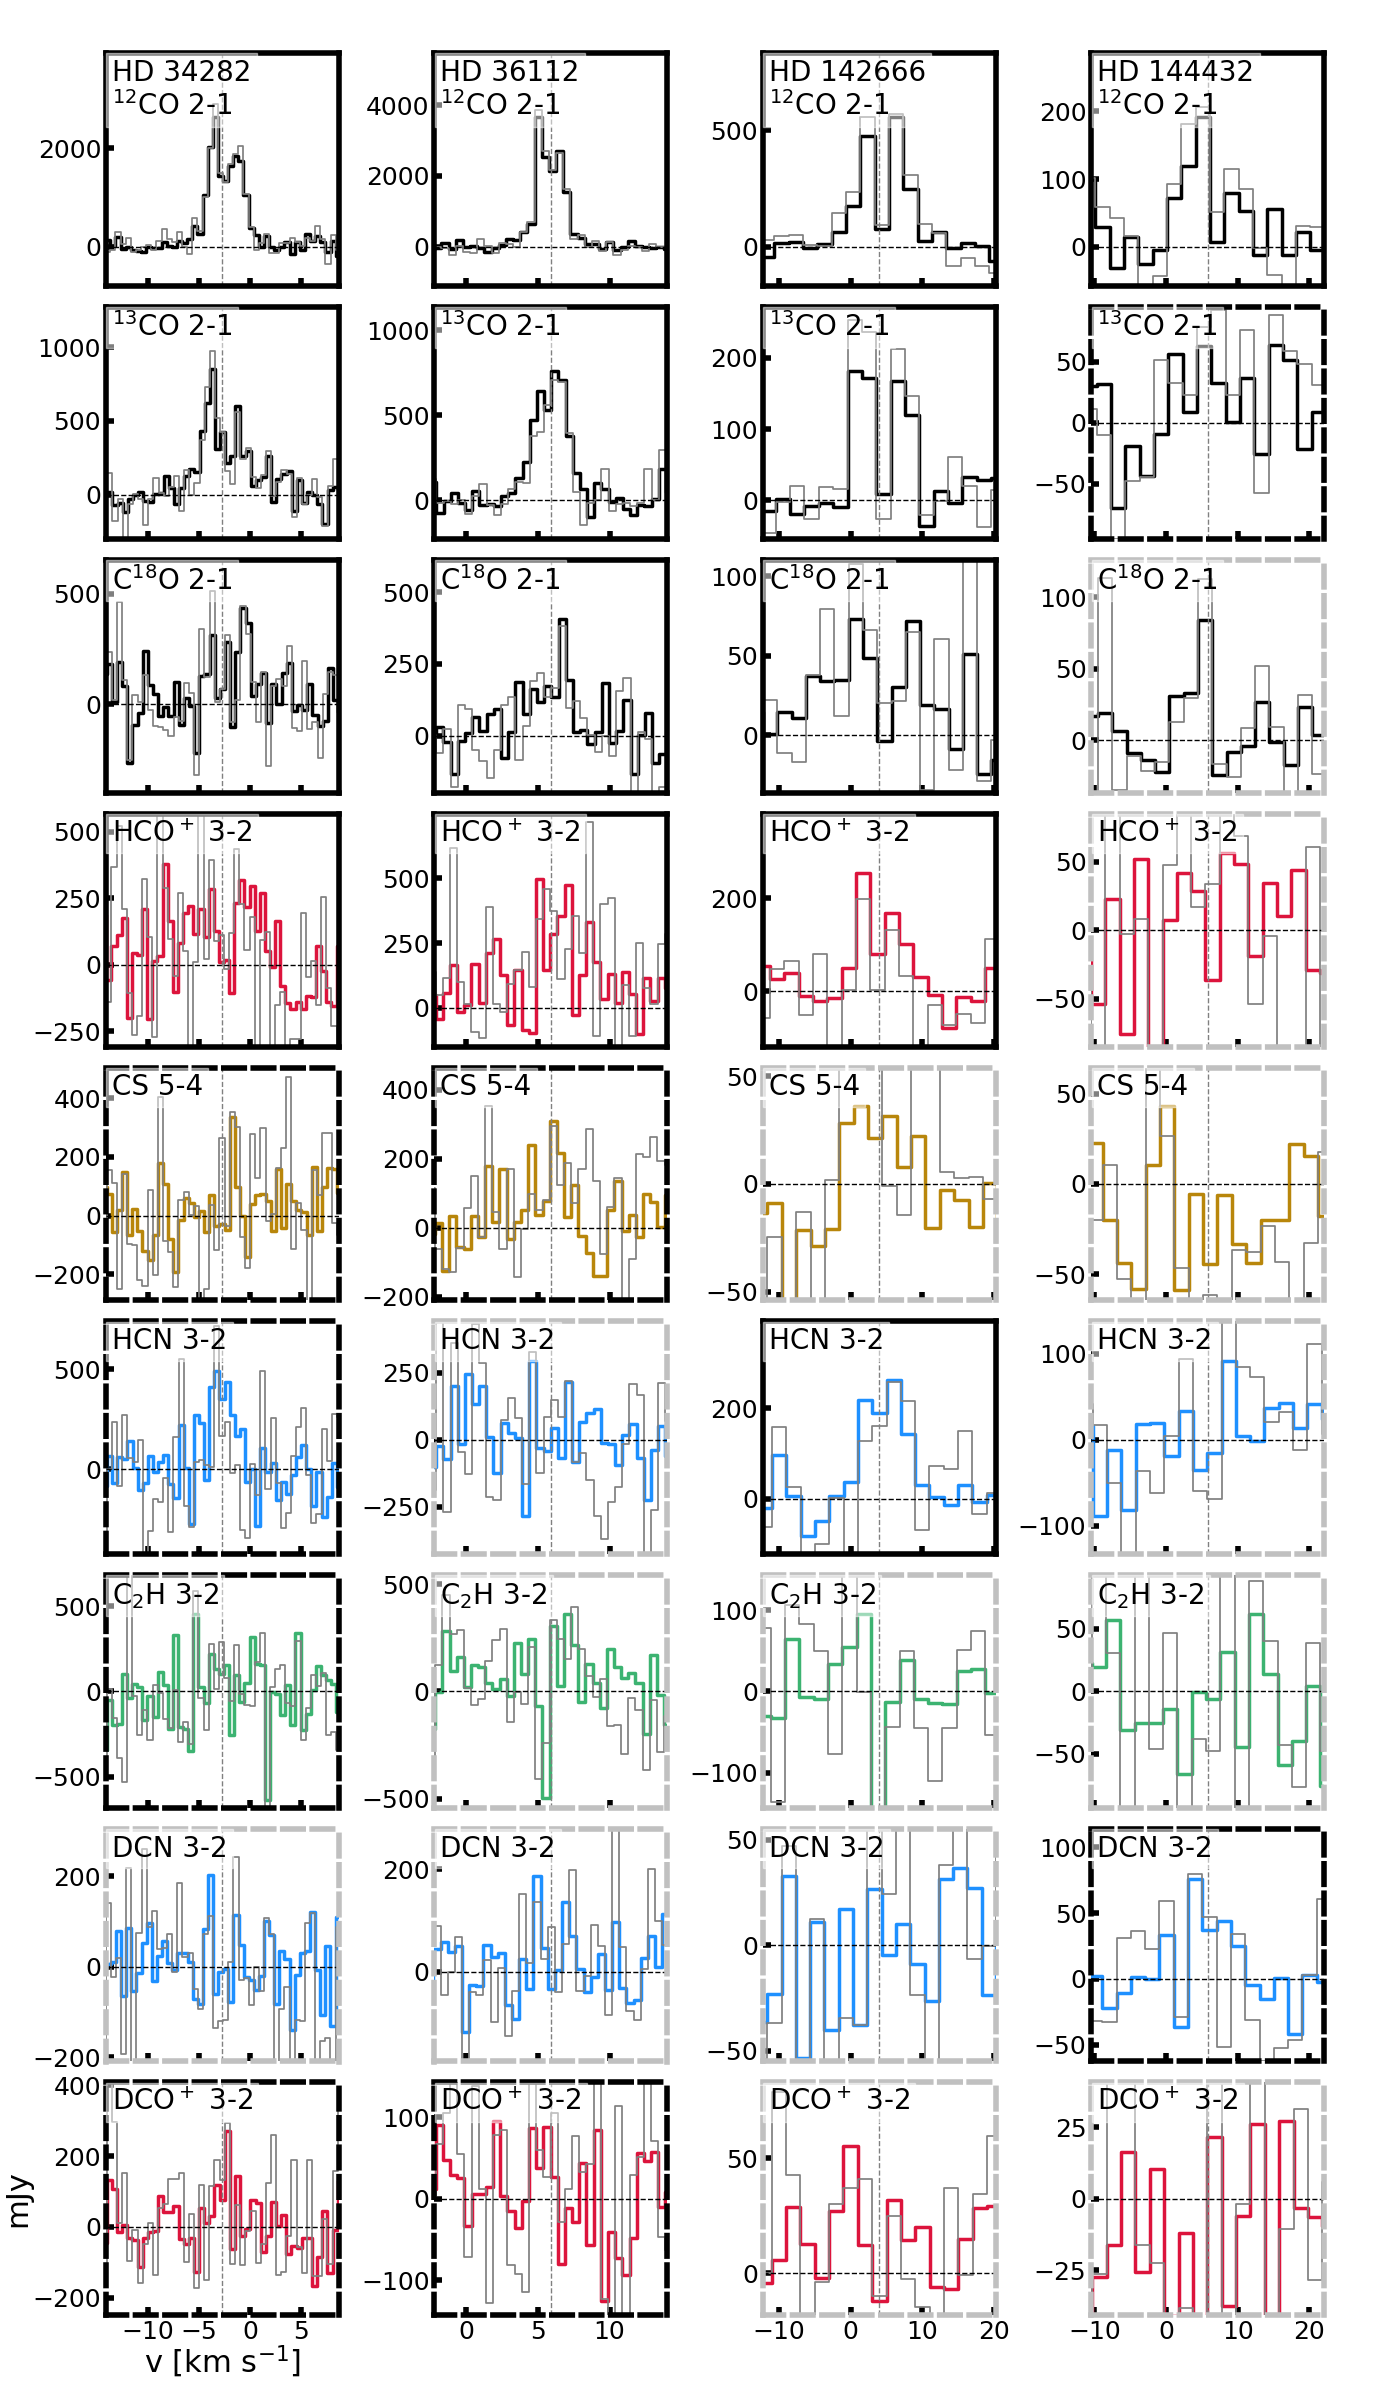
Figures 3 and 4 display velocity-integrated emission maps and spectra, respectively, for molecular lines that are detected or tentatively detected from at least one disk in our sample. Channel maps for all detected and tentatively detected lines are given in Appendix C.
At the spatial resolution of our observations, all mm continuum emission (Figure 2) and detected molecular line emission (Figure 3) appear smooth, without any apparent cavities or gaps. However, we do find persistent asymmetries in the dust and/or bright molecular line emission for certain disks. Here we qualitatively describe these asymmetries in the context of complex morphologies known from the literature.
4.2.1 HD 34282
HD 34282 is adjacent to what appears to be an extended or external source of emission. This neighboring source is centered eastward of HD 34282’s estimated disk center, roughly 5 arcseconds away. The neighbor is seen above 3 in the mm continuum emission and is brightest in the 265 GHz band (Figure 2). There also appears to be a faint “stream” of dust connecting HD 34282 and this neighboring source, although the stream is not detected above 3.
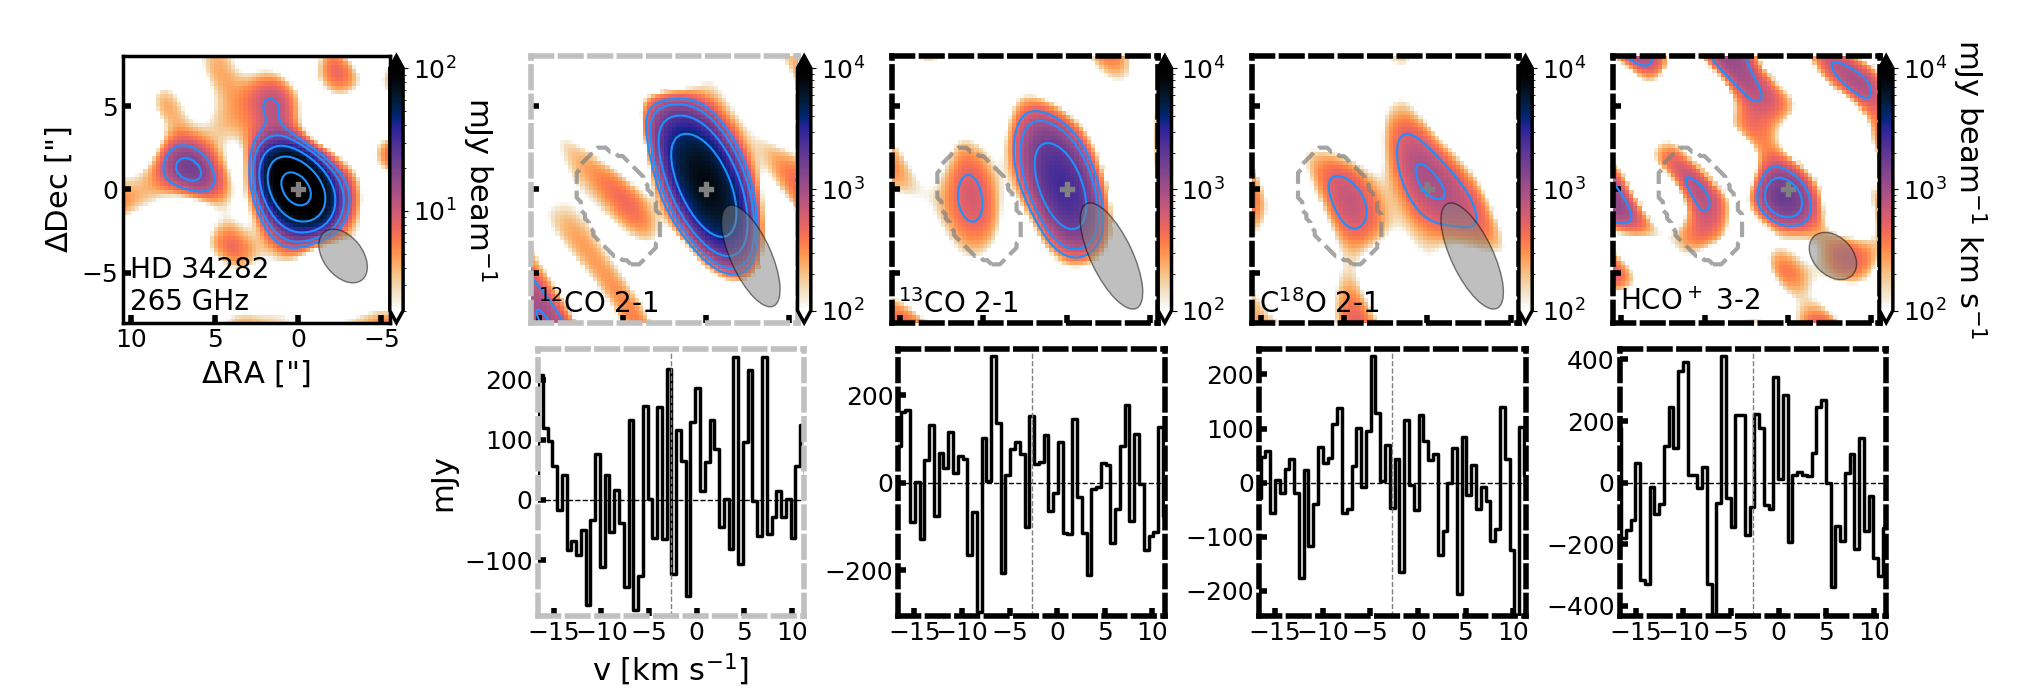
This neighbor is not visible in the velocity-integrated emission maps of Figure 3, because those maps were extracted using Keplerian masks catered to HD 34282. We have thus generated velocity-integrated emission maps for the brightest molecular lines from HD 34282 using no masks, which are displayed in Figure 5. Figure 5 shows that this neighbor is detected above 3 in emission maps of 13CO 2–1, C18O 2–1, and HCO+ 3–2, and is seen in 12CO 2–1 below 3. Spectra extracted from a custom region containing the neighboring emission do not show Keplerian rotation, at least at the sensitivity of these observations.
HD 34282 has previously been observed in millimeter-wavelength continuum and CO emission in the literature. Piétu et al. (2003) mapped the Keplerian rotation of HD 34282 in 12CO 2–1 emission using the Institut de Radioastronomie Millimétrique (IRAM) interferometer (the Plateau de Bure Interferometer, originally denoted PdBI but now upgraded and renamed NOEMA). van der Plas et al. (2017) conducted an ALMA study of 350 GHz continuum, 12CO 3–2, and HCO+ 4–3 emission (from ALMA Project 2013.1.00658.S). Stapper et al. (2022) presented an ALMA image of the 230 GHz continuum emission for HD 34282 (their Figure 2; from the ALMA Project 2015.1.00192.S), while Law et al. (2022a) recently conducted an ALMA vertical structure study and presented new images of the 230 GHz continuum, 12CO 2–1, 13CO 2–1, and C18O 2–1 emission (from ALMA Projects 2015.1.00192.S and 2017.1.01578.S). The latter three studies (van der Plas et al., 2017; Stapper et al., 2022; Law et al., 2022a) all presented images of HD 34282 within a field of view of 2020.
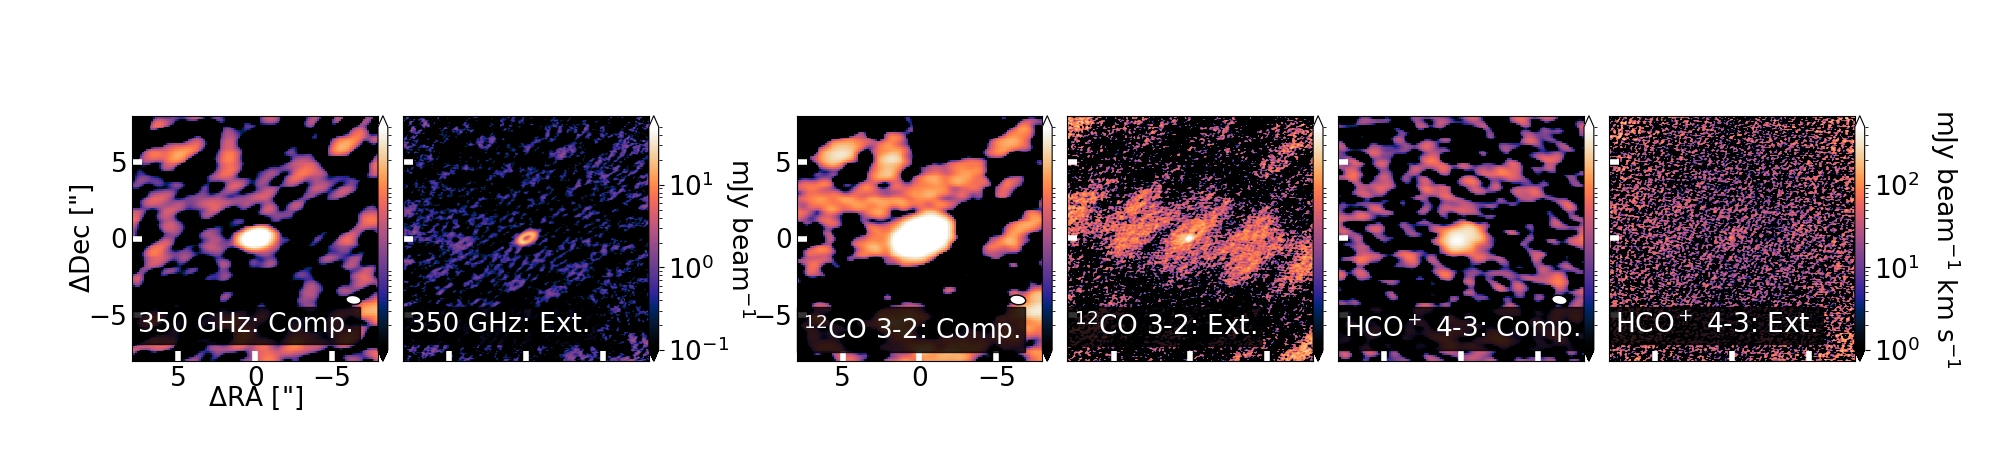
In terms of the dust, faint structure can be seen eastward of HD 34282 in the published 230 GHz continuum images of Stapper et al. (2022) and Law et al. (2022a) within their 2020 fields of view (see their Figures 2 and 1, respectively). However, the same structure is not apparent within the published 2020 350 GHz continuum image of van der Plas et al. (2017) (see, e.g., their Figure 4; see also Figure 1 of Law et al., 2022a). We expanded the field of view for the 350 GHz continuum image from the same observing project as van der Plas et al. (2017) (ALMA Project 2013.1.00658.S, extracted from the ALMA archive; Appendix D). The 350 GHz continuum image observed in the compact configuration tentatively suggests what could be faint structure eastward of HD 34282, while the 350 GHz continuum image observed in the extended configuration shows no such structure.
In terms of the gas, model residuals of the 12CO 2–1 emission in Piétu et al. (2003) (see their Figure 5) suggest a neighboring emitting source, with a center that shifts from roughly 3 arcseconds away to 5 arcseconds away over the course of their channel maps. However, published ALMA images of the 12CO 3–2, HCO+ 4–3, 12CO 2–1, 13CO 2–1, and C18O 2–1 emission in van der Plas et al. (2017) and Law et al. (2022a) show no emission structure eastward of the disk within 2020. We expanded the field of view of the 12CO 2–1, 13CO 2–1, and C18O 2–1 image cubes provided by Law et al. (2022a) (derived from ALMA Projects 2015.1.00192.S and 2017.1.01578; not shown). We also expanded the archival ALMA images of the 12CO 3–2 and HCO+ 4–3 emission presented in van der Plas et al. (2017) (ALMA Project 2013.1.00658.S, extracted from the ALMA archive; Appendix D). The 12CO 3–2 image observed in the compact configuration tentatively suggests faint structure eastward of HD 34282, cospatial to the faint structure seen for the expanded 350 GHz continuum image in the same configuration. However, no such structure is apparent in the other expanded images of line emission.
Altogether, we detect what appears to be a neighboring source eastward of HD 34282 in mm continuum emission, which is connected to HD 34282 by a faint ‘stream’ of emission. Faint 230 GHz continuum emission structure eastward of HD 34282 can also be seen in 2020 images in the literature (Stapper et al., 2022; Law et al., 2022a). There is some very tentative suggestion of cospatial 12CO emission from compact observations of this system (Piétu et al., 2003, Figure 5, Appendix D). However, the neighbor is not confidently detected in our brightest CO isotopologue (12CO 2–1, Figure 5), and it is not detected in ALMA CO and HCO+ 4–3 images observed in more extended configurations and at higher spatial resolution (van der Plas et al., 2017; Law et al., 2022a).
It is possible that this neighboring source is actually a persistent imaging artifact. That being said, based on mm continuum emission observations of HD 34282 in this work and in the literature, we do believe this neighbor to be real. If so, the exact morphology of the neighbor is likely distorted by the elongated beams of our observations.
We infer that the neighbor is distinct from the spiral arm and point source previously identified within 10 of the disk center (de Boer et al., 2021; van der Plas et al., 2017). It is also likely distinct from the orbital companion reported in Wheelwright et al. (2010), which based on their technique is within 0.1-2” from HD 34282 (Baines et al., 2006). We speculate that this possible neighbor is either (1) an extended spiral arm or (2) a distant orbital companion. It is possible that any gas present for this neighboring source has been dissociated or ionized, and so is not traceable by our target molecules, or that the gas has dissipated or been disrupted through dynamical interactions over time.
4.2.2 HD 142666
The mm continuum emission from HD 142666 shows what appear to be asymmetries above 3 to the northwest and northeast of the disk center (Figure 2). However, Huang et al. (2018) observed HD 142666 in 1.25 mm continuum emission and found no indication of dust asymmetries near the outer disk edge. It is possible that the asymmetries seen in this work are imaging artifacts.
4.2.3 HD 144432
HD 144432 has the faintest mm continuum emission in our sample (excluding HD 38120), and only CO isotopologue emission is detected or tentatively detected from the disk. The dust disk has also previously been undetected in scattered light (Monnier et al., 2017). Notably HD 144432 has a known stellar companion (Maheswar et al., 2002) at a distance of 15 (Müller et al., 2011). Monnier et al. (2017) postulated that interactions with this companion may have truncated the disk and led to its non-detection in scattered light. Other possible explanations include that the disk is old (5 Myr; Section 2.1), and so may have already lost much of its dust and gas over time.
4.3 Molecular Line Fluxes
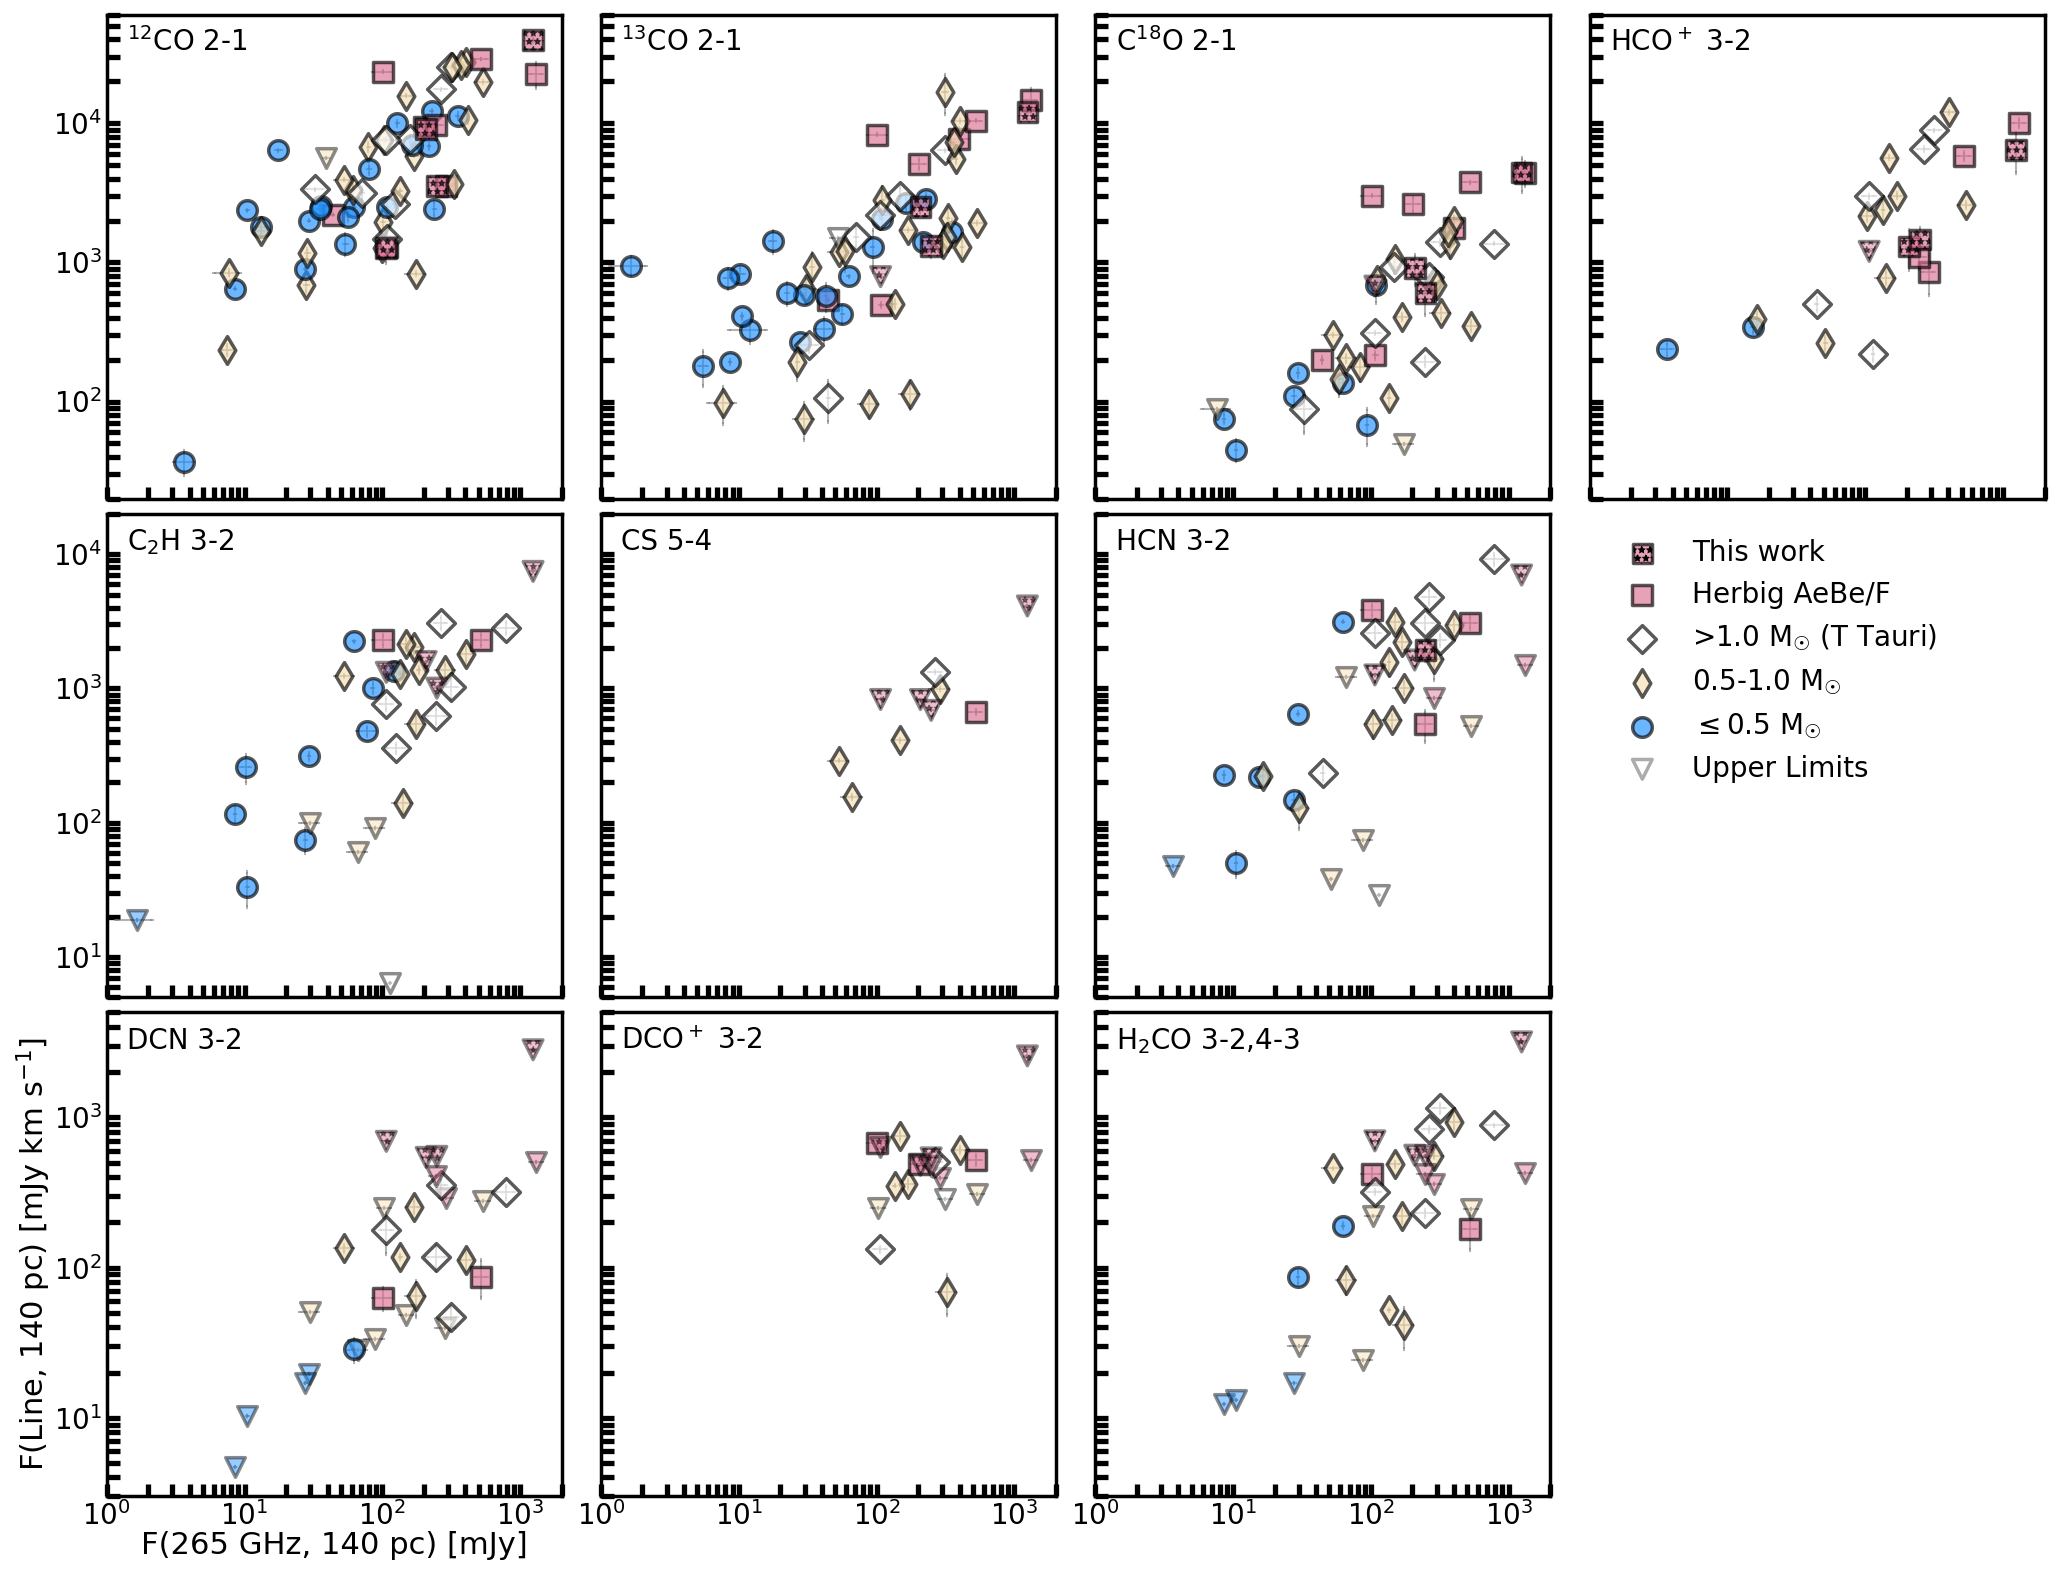
Figure 6 plots scaled molecular line fluxes and upper limits as a function of mm continuum flux for our sample and for the literature sample (Section 2.4, Appendix A). Most molecular lines (e.g., the CO 2–1 isotopologues, C2H 3–2, and HCN 3–2) generally increase in flux as mm continuum flux increases, with one or more orders-of-magnitude of scatter in the flux. Potential exceptions are the CS 5–4 and DCO+ 3–2 lines; for disks with stellar masses below 0.5 M☉, few detections or upper limits are known for these lines.
5 Discussion
5.1 Disk Inventories across the Pre-Main-Sequence Stellar Mass Distribution
We now compare molecular line flux ratios across the combined sample of disks from this work and from the literature sample (Section 2.4, Appendix A). We focus on flux ratios here to help normalize against the different disk sizes across the sample. We compare the flux ratios to stellar mass and spectral type (via binning), stellar luminosity, and mm continuum flux as representative properties of the disks and their host stars.
We note that stellar age, and therefore timespan of chemical evolution, is another important factor. So far, however, previous millimeter-wavelength chemistry surveys of mostly T Tauri disks have not found any clear trends with stellar age (e.g., Bergner et al., 2019; Le Gal et al., 2019; Pegues et al., 2020). Noting this finding, and noting the large intrinsic and explicit uncertainties in existing stellar age estimates for pre-main-sequence stars (e.g., discussion by Hillenbrand & White, 2004), we do not consider stellar age in this work.
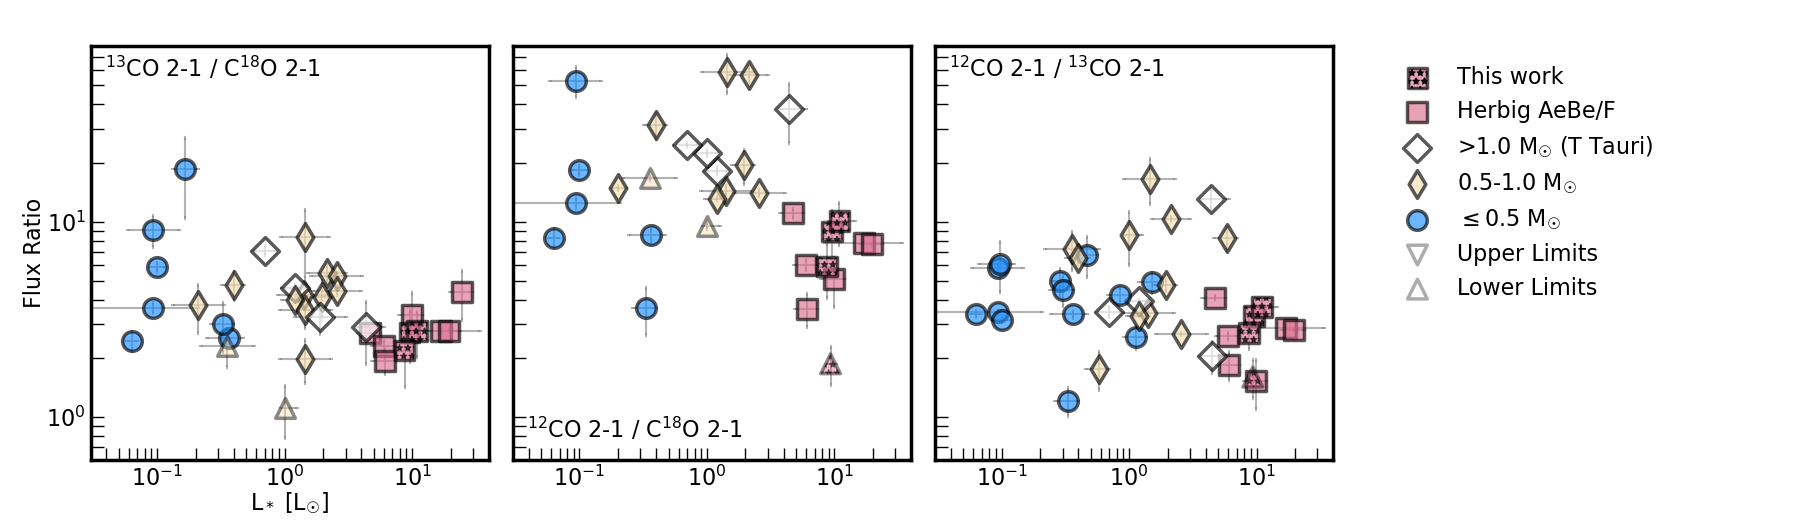


5.1.1 CO Isotopologues
CO is the second most abundant gas-phase molecule in protoplanetary disks after H2. Its isotopologue emission has a complex dependence on disk structure: 12CO emission is optically thick and traces the temperature and extent of the disk’s surface layer; 13CO emission is less optically thick and traces the temperature and extent of a vertically lower emission layer; and finally C18O emission is generally optically thin, emits near the disk midplane, and can serve as a tracer of disk gas mass (e.g., Miotello et al., 2014; Pinte et al., 2018; Law et al., 2021b; Zhang et al., 2021; Law et al., 2022a).
Chemically, astrochemical disk models exploring a range of physical conditions have predicted that chemical processing, and therefore depletion, of CO should be most efficient in colder disks (Bosman et al., 2018). As a result, the warmer Herbig AeBe/F disks should be most abundant in CO. The study by Zhang et al. (2021) agreed with this prediction; they estimated larger CO gas masses and higher CO-derived gas-to-dust ratios for the Herbig Ae disks HD 163296 and MWC 480, relative to T Tauri disks, via high-resolution CO observations.
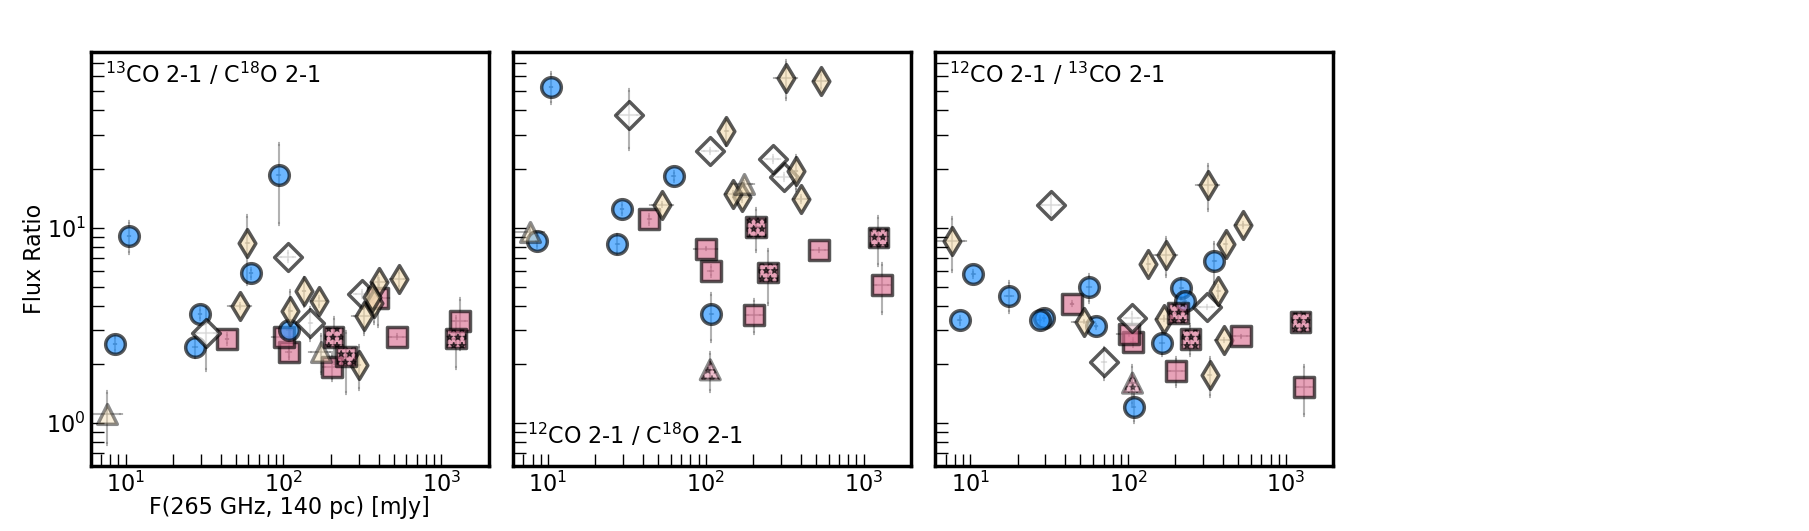
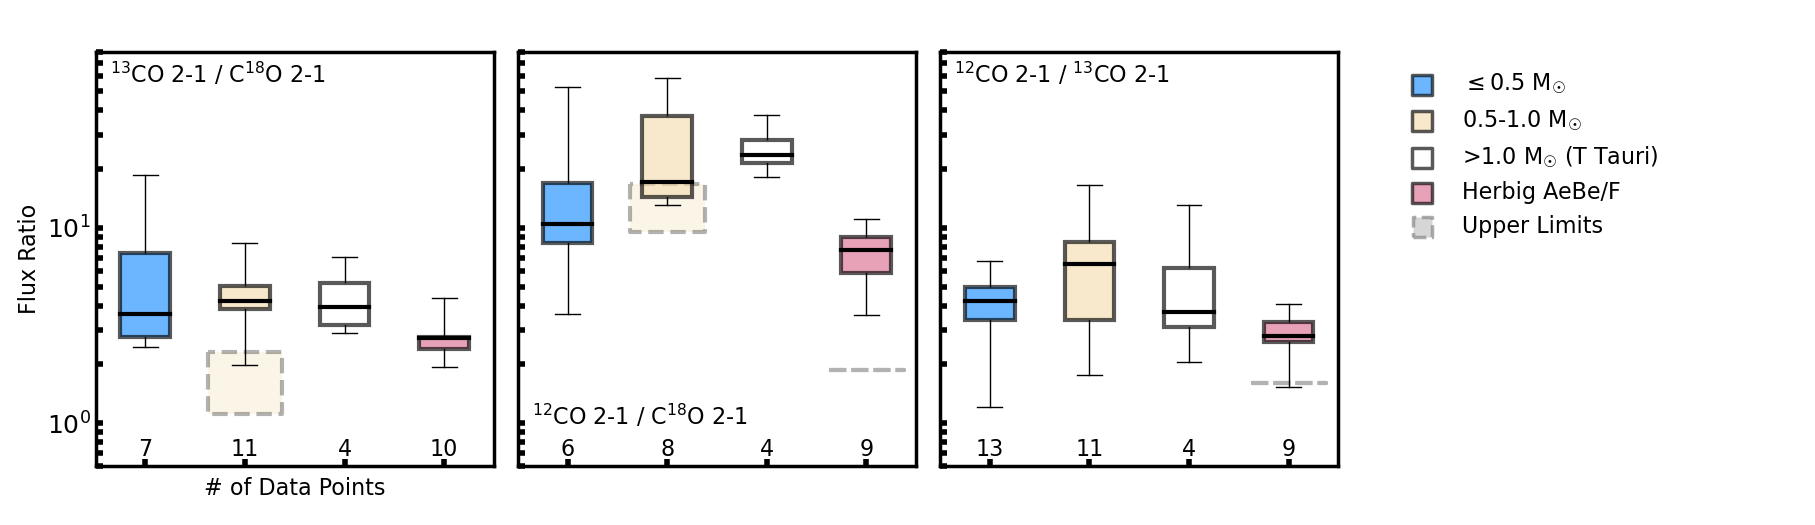
Figure 7 plots CO isotopologue line flux ratios as a function of mm continuum flux and stellar luminosity for the combined disk sample. There is a potential decrease in the line flux ratios with respect to stellar luminosity, with one order of magnitude in scatter. When considered with respect to mm continuum flux, the line flux ratios appear scattered, but are consistent with a globally flat trend across both Herbig AeBe/F and T Tauri disks.
Notably, most of the Herbig AeBe/F disks appear in the lowest regimes of the overall scatter for all three ratios. Let us assume the optically thick 12CO 2–1 and 13CO 2–1 emission trace the temperatures of their emitting layers. Then the CO isotopologue flux ratios for the Herbig AeBe/F disks, which are closest to unity in value compared to the rest of the combined sample, may indicate vertical emitting layers with overall warmer (and therefore more numerically similar) temperatures. Warmer layers would be consistent with the findings of Law et al. (2021b) and Law et al. (2022b), which altogether derived generally warmer CO temperature profiles from observations for Herbig AeBe disks when compared to T Tauri disks.
Let us also assume that the C18O 2–1 emission is generally optically thin over most of the outer disk (e.g., see models, observations, and discussion by Miotello et al., 2014; Pinte et al., 2018; Law et al., 2021b, 2022a), and can trace the disk gas mass. From Figure 6, we see that the Herbig AeBe/F disks have the largest C18O 2–1 fluxes as a function of mm continuum flux. Noting again from Bosman et al. (2018) that CO depletion is expected to decrease in warmer layers, we can infer that the Herbig AeBe/F disks are generally most abundant in CO relative to disk mass, consistent with the results of Zhang et al. (2021).
5.1.2 Signposts of Ionization
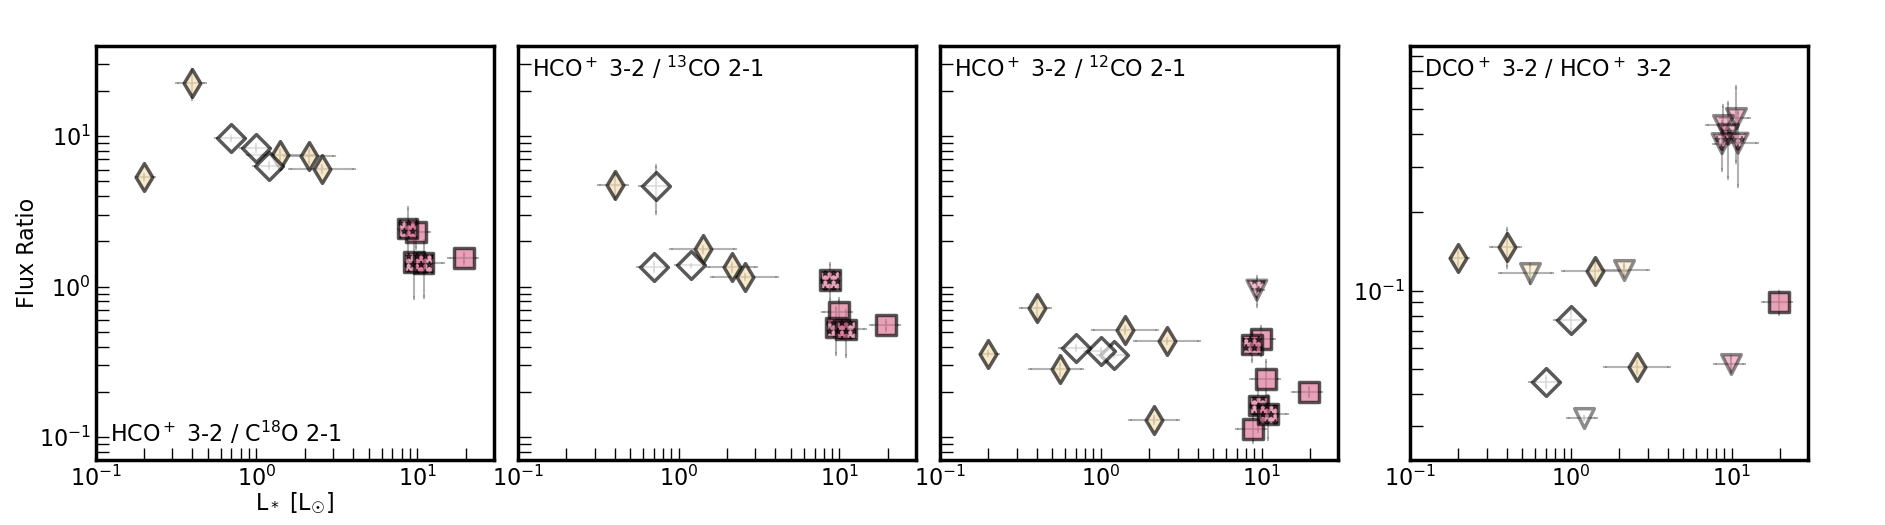
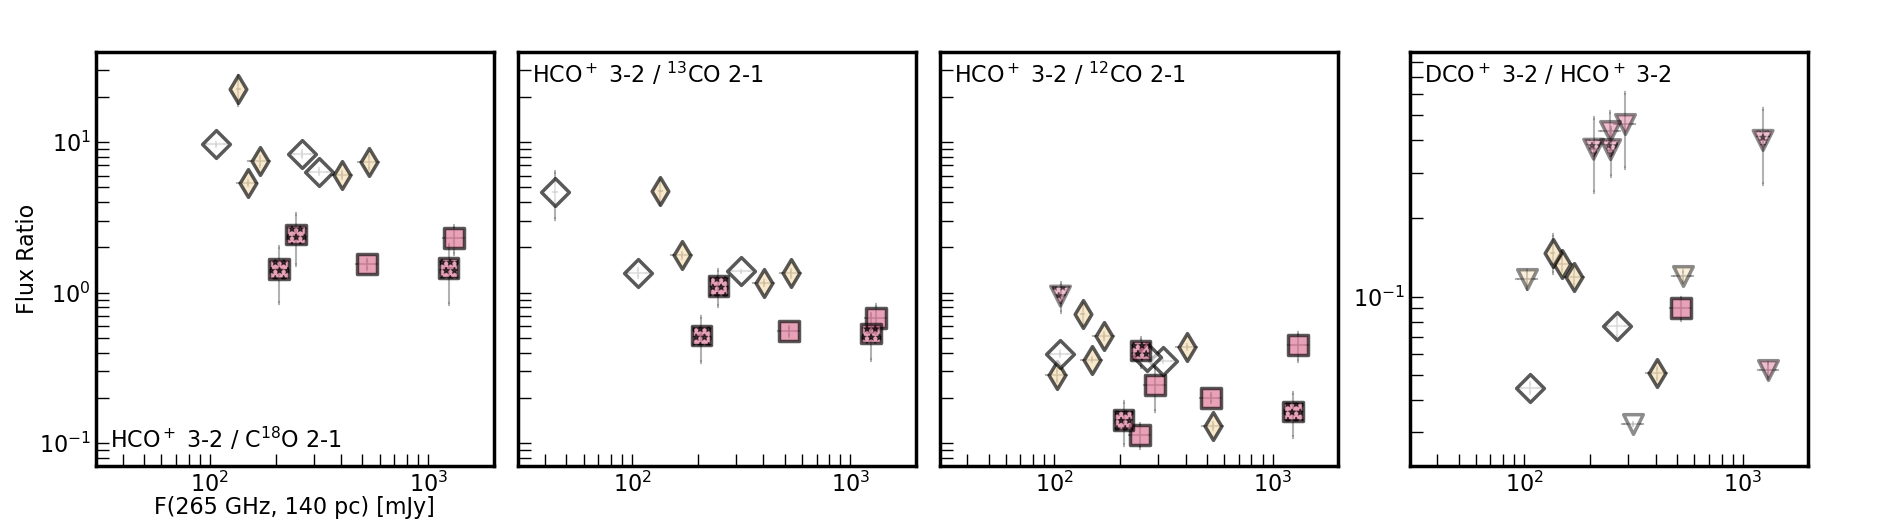
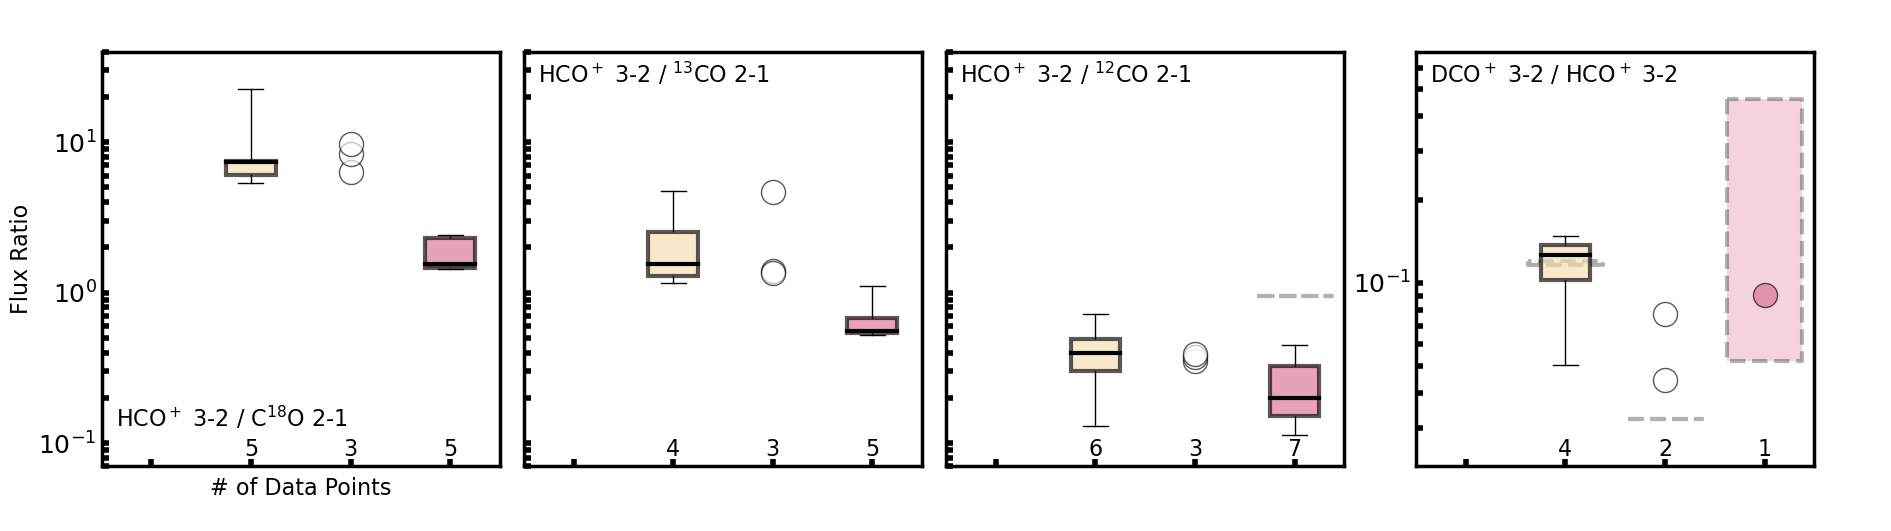
Based on both theory and observations, HCO+ 3–2 is one of the simplest molecular ions found in protoplanetary disks (e.g., Dutrey et al., 1997; Aikawa & Herbst, 2001). Its formation depends on the degree of ionization within the disk, which in turn depends on the presence/absence of stellar X-ray radiation (e.g., Aikawa & Herbst, 2001). Models have predicted that HCO+ is the dominant molecular ion relative to H in the warm CO-rich regions of the disk (specifically, where CO is at least a few orders of magnitude more abundant than free electrons; Aikawa et al., 2015). We thus expect HCO+ to be most prominent in the warm upper layers of the disk, where (1) CO is most abundant and (2) the disk material is most exposed to X-ray radiation from the central star (Aikawa et al., 2021). Furthermore, since HCO+ 3–2 emission is optically thick, we expect its emission to trace its emitting layer within the disk.
Figure 8 plots ratios of HCO+ 3–2, DCO+ 3–2, and CO isotopologue fluxes as a function of stellar luminosity and mm continuum flux for the combined disk sample. Here 12CO 2–1 and 13CO 2–1 serve as probes of the emitting surface layers, the optically thin C18O 2–1 (e.g., see models, observations, and discussion by Miotello et al., 2014; Pinte et al., 2018; Law et al., 2021b, 2022a) as a normalizing metric for the HCO+ 3–2 flux, and DCO+ 3–2 as the deuterated counterpart of HCO+ 3–2.
The existing data above 0.5 M☉ suggest a general decrease in the HCO+ 3–2 flux relative to CO isotopologue fluxes as a function of both stellar luminosity and mm continuum flux. Furthermore, Figure 6 and the HCO+ 3–2 / C18O 2–1 flux ratios in Figure 8 show that the absolute HCO+ 3–2 fluxes for the Herbig AeBe/F disks are distinctly offset from the T Tauri disks with existing data, and have lower HCO+ 3–2 line fluxes when compared to T Tauri disks with the same mm continuum flux. Together, these trends suggest a general decrease in HCO+ 3–2 for Herbig AeBe/F disks relative to T Tauri disks with M∗ 0.5 M☉.
One possible explanation for this trend is that the optically thick HCO+ 3–2 emission is tracing a different emitting layer relative to CO for the Herbig AeBe/F disks than for the T Tauri disks. For T Tauri disks, models have predicted that HCO+ is vertically cospatial with CO (Aikawa et al., 2021). Observationally, Paneque-Carreño et al. (2023) estimated and compared vertical emission surfaces for CO 2–1 isotopologues and HCO+ 1–0 in two Herbig Ae disks (HD 163296 and MWC 480). They found the HCO+ 1–0 emission surfaces were not cospatial with 12CO 2–1 but were instead close to the midplane. For HD 163296, they also noted that the HCO+ 1–0 emission was likely optically thin, based on a low brightness temperature profile. It is unclear if these results can be extrapolated to the HCO+ 3–2 in this work, given the differences in excitation and optical depth between the two line transitions.
Another possible explanation is that Herbig AeBe/F disks are relatively less ionized than T Tauri disks, as predicted from some disk models in the literature (e.g., Walsh et al., 2015). Unlike convective T Tauri stars, Herbig AeBe stars are fully radiative and do not have a coronal layer. They are thus not strong X-ray emitters like their T Tauri counterparts (e.g., Cohen, 1984), and so their disks should receive less stellar X-ray radiation. Less ionization could lead to less abundant HCO+ in the Herbig AeBe/F disks. This is consistent with the conclusions of Aikawa et al. (2021), who found relatively low HCO+ abundances for the Herbig Ae disk MWC 480, and attributed this result to relatively fewer high-energy X-rays incident on this disk.
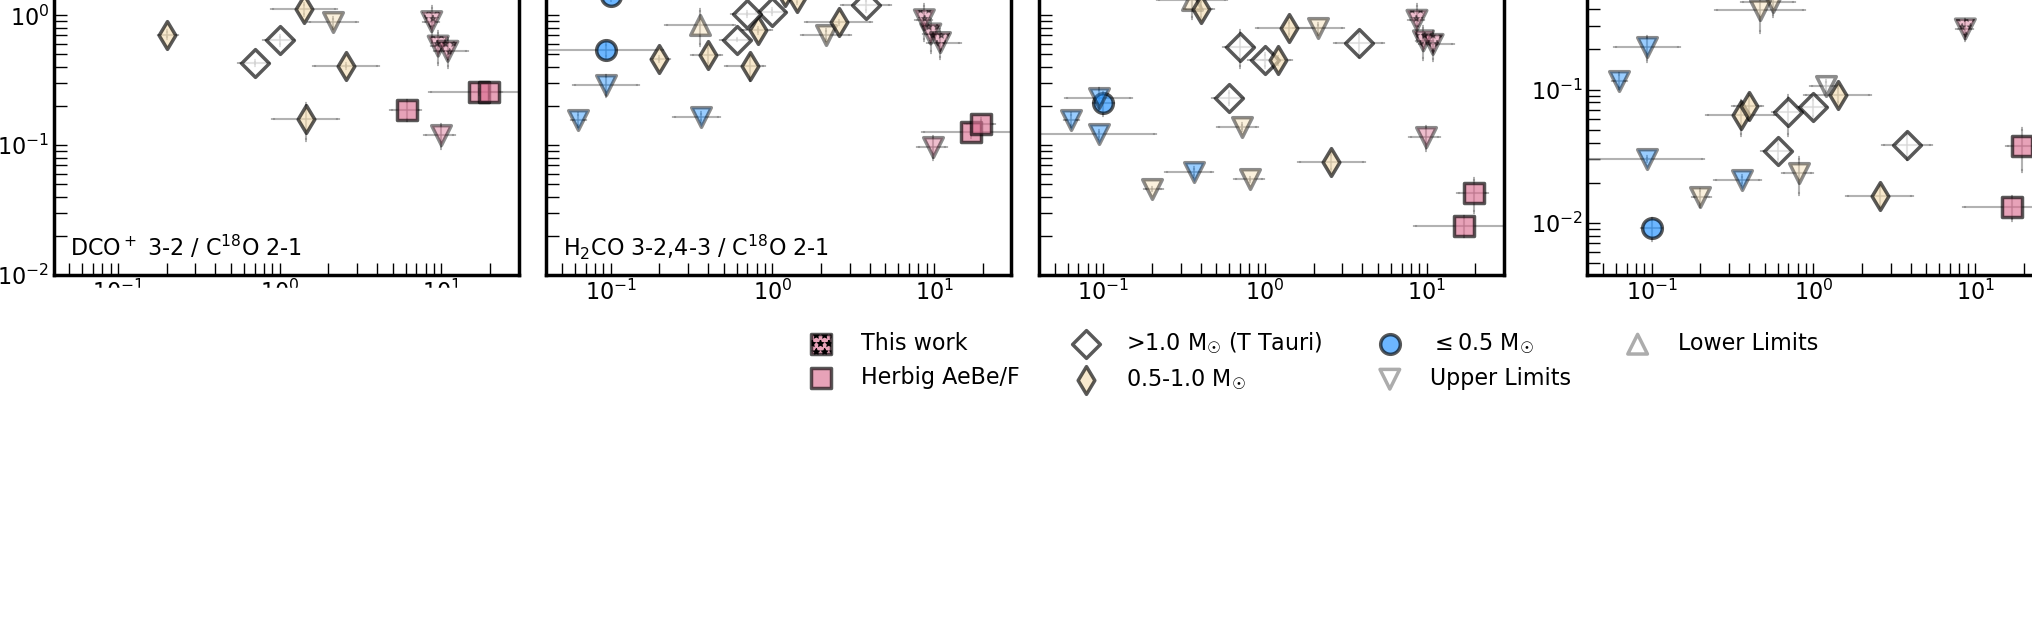
Figure 8 also shows the DCO+ 3–2 / HCO+ 3–2 line flux ratios. We note, however, that unlike DCO+ 3–2 emission, HCO+ 3–2 emission is expected to be optically thick. Therefore the HCO+ 3–2 emission is likely not tracing its molecular abundance. Keeping that in mind, we note that the sole existing Herbig AeBe/F disk DCO+ 3–2 / HCO+ 3–2 detection is consistent with the median flux ratio for the Tauri disks. Intriguingly, this single flux ratio is from MWC 480, which was measured by Aikawa et al. (2021) to have a low HCO+ abundance relative to the T Tauri disks in their sample. This could suggest that DCO+ is similarly less ionized in Herbig AeBe/F disks, as discussed for HCO+ in Section 5.1.2, although more observations are needed to further investigate this possibility.
5.1.3 Cold Chemistry
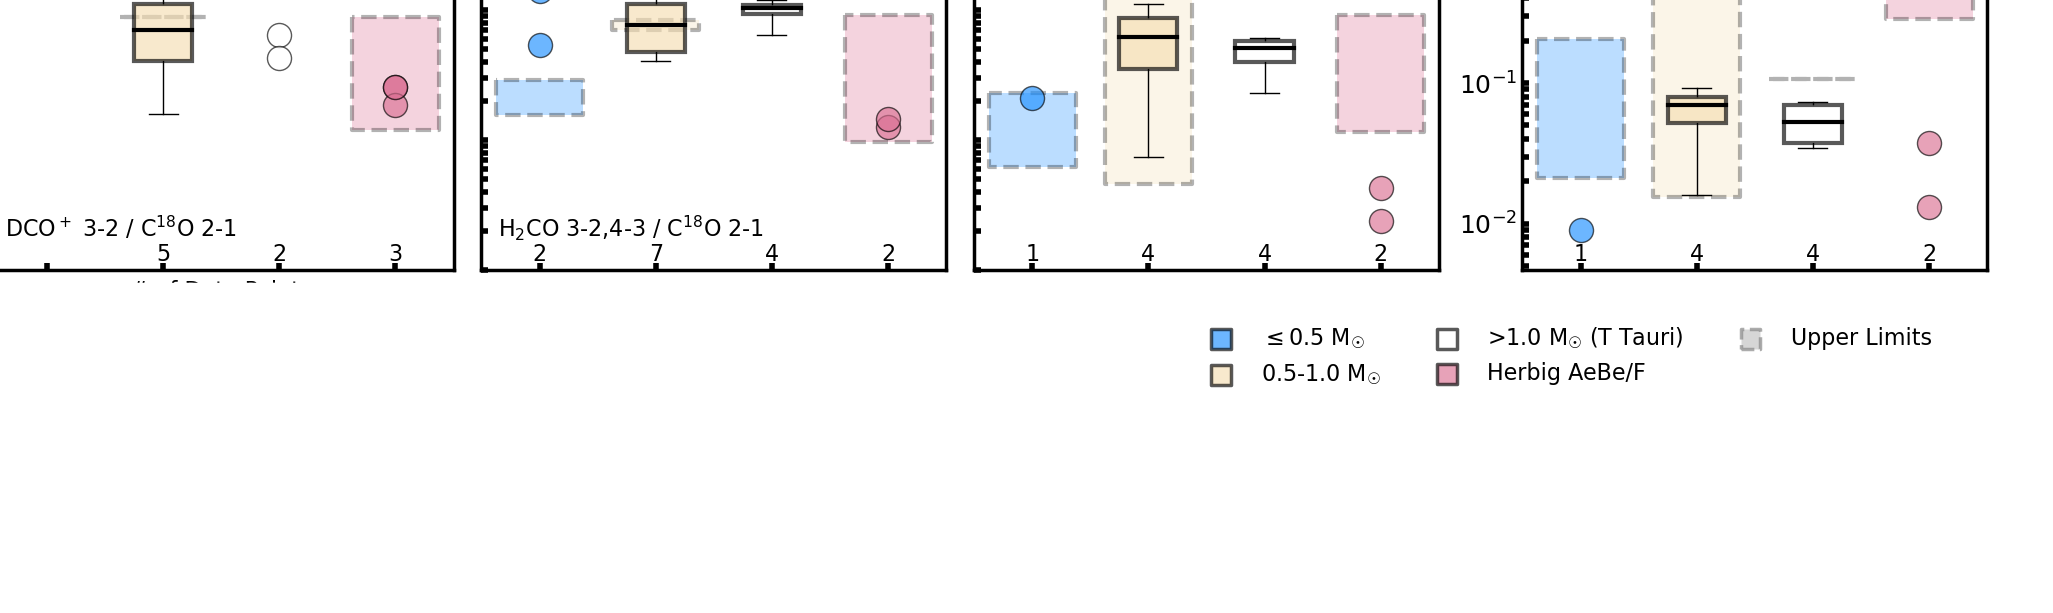
Three of our target molecules are expected to trace cold molecular gas: DCN, DCO+, and H2CO. Based on theoretical models, deuterated chemical pathways are expected to be most efficient at cold temperatures, although warm pathways exist as well. Production of the deuterated molecule DCO+ is expected to peak within the cold disk midplane at temperatures 30K, while DCN production is expected to peak in the warm inner regions (e.g., results and discussion by Millar et al., 1989; Aikawa & Herbst, 1999, 2001; Huang et al., 2017; Öberg et al., 2021b; Muñoz-Romero et al., 2023). The simple oxygen carrier H2CO is predicted to form through both gas-phase pathways in the warm inner disk and through CO ice hydrogenation on grain surfaces beyond the CO snowline (e.g., Hiraoka et al., 1994; Fockenberg & Preses, 2002; Hiraoka et al., 2002; Watanabe & Kouchi, 2002). Notably Pegues et al. (2020) and Guzmán et al. (2021) estimated lower H2CO column densities for the two Herbig Ae disks in their samples (HD 163296 and MWC 480) relative to colder T Tauri disks, possibly due (at least in part) to relatively small reservoirs of CO ice around the warmer stars.
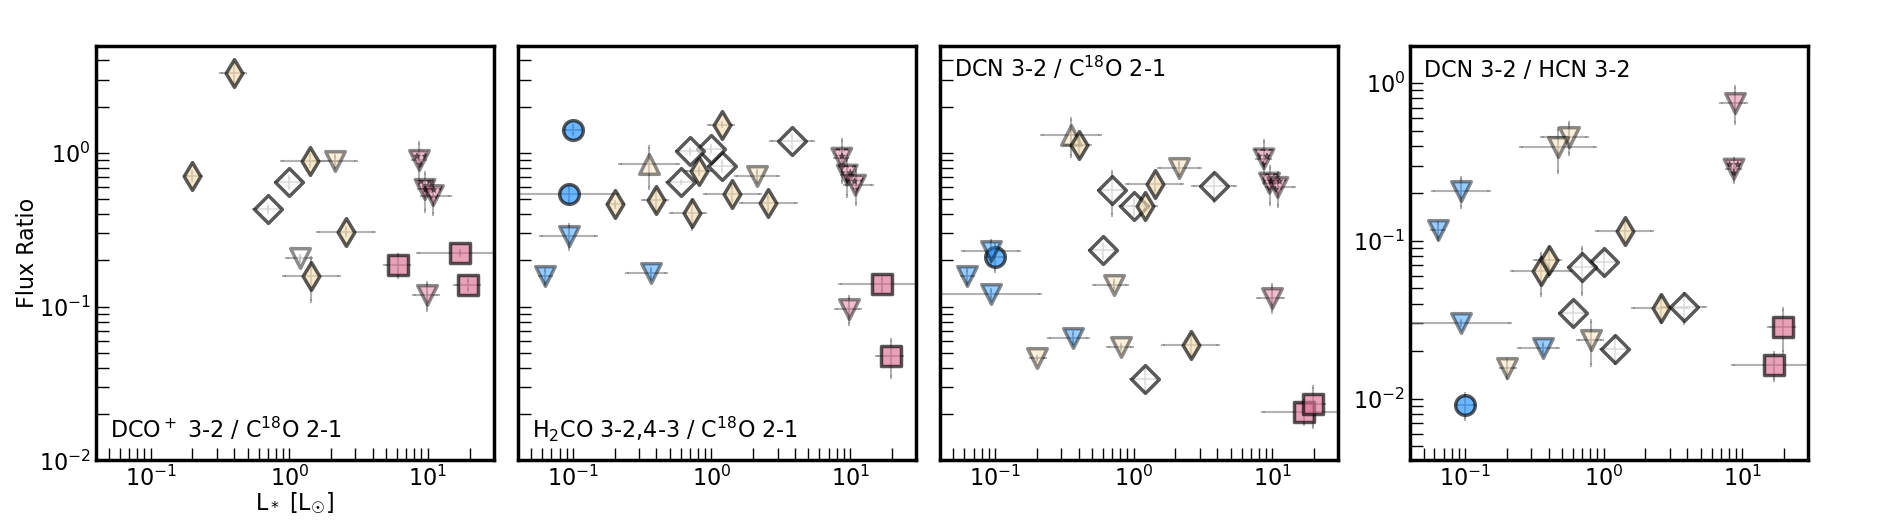
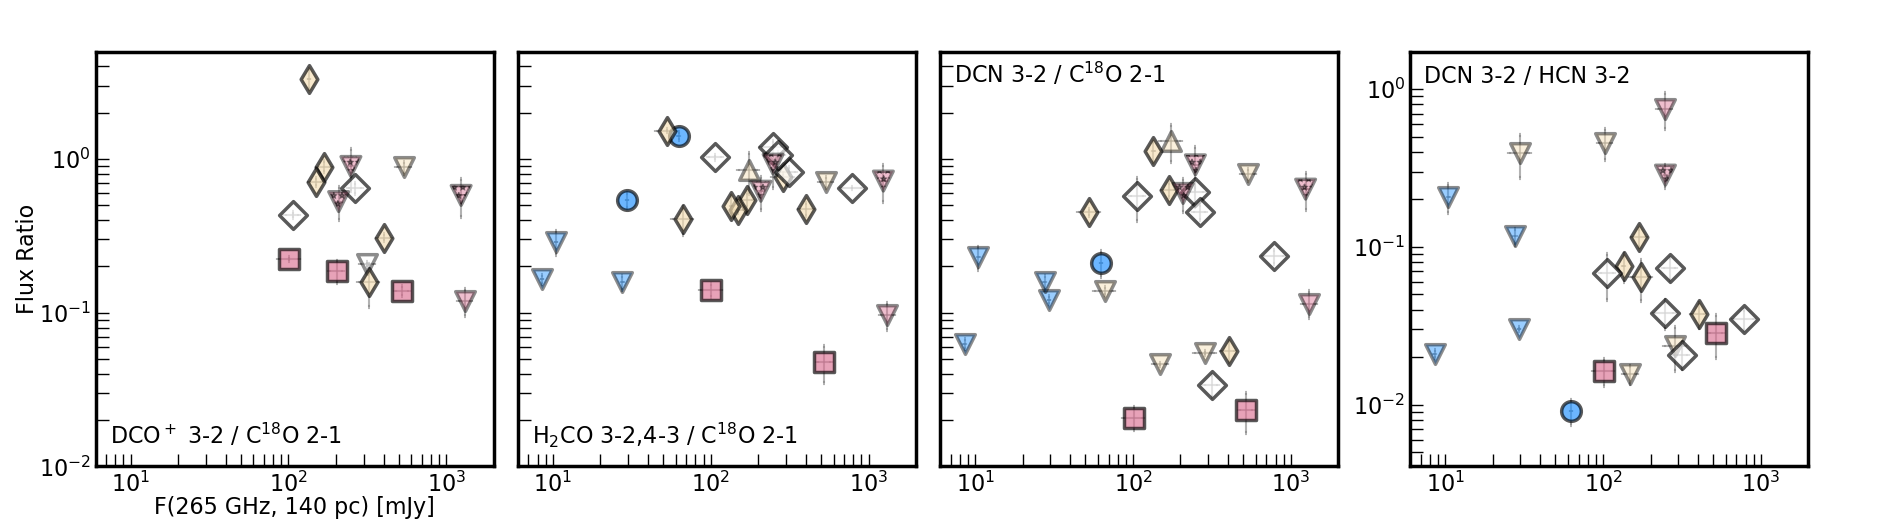
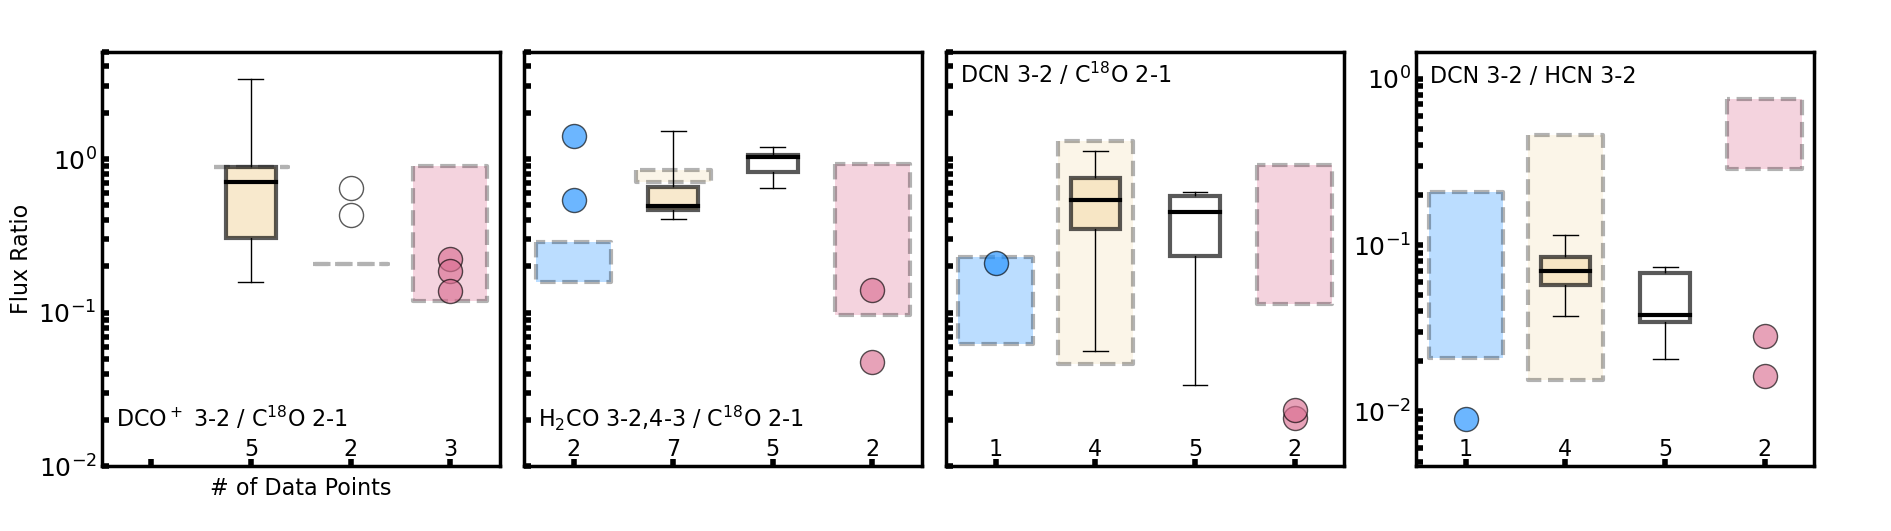
Figure 9 plots DCN 3–2, DCO+ 3–2, and H2CO 3–2,4–3 line fluxes relative to C18O 2–1 line fluxes as a function of stellar luminosity and mm continuum flux for the combined disk sample. We also show DCN 3–2 / HCN 3–2, although we note that HCN 3–2 emission is expected to be optically thick. For the Herbig AeBe/F disks, only a few disks have been detected in some or all of these three lines (see also Figure 6). The rest of the existing Herbig AeBe/F disk data are upper limits from tentative and non-detections.
The few existing detected DCO+ 3–2, DCN 3–2, and H2CO 3–2,4–3 line fluxes relative to C18O 2–1 for the Herbig AeBe/F disks are below the median values for the T Tauri disks. When considered as a function of mm continuum flux, these few detections occupy the lowest regimes of the overall scatter across all observations. These results are consistent with the hypothesis that these molecules with dominant cold pathways are less abundant in the warmer Herbig AeBe/F disks. The few detected, relatively low line flux ratios may also be a byproduct of less CO depletion (and therefore more C18O 2–1 emission) in the Herbig AeBe/F disks (see Section 5.1.1).
We emphasize, however, that only a few Herbig AeBe/F disk detections exist for these lines. Upper limits for the Herbig AeBe/F disks are either consistent with T Tauri disk fluxes and upper limits, or are lower, and are not all constraining. Surveys of these lines toward Herbig AeBe/F disks at higher sensitivity are needed to further investigate these tentative trends.
6 Summary
Using the SMA, we have surveyed millimeter-wavelength (213-268 GHz) molecular line emission from protoplanetary disks around four Herbig Ae stars (HD 34282, HD 36112, HD 142666, and HD 144432) and one Herbig Be star (HD 38120), and we have compared our results to disk chemistry around Herbig AeBe/F stars and T Tauri stars from the literature. We summarize our main findings below:
-
1.
All five disks are detected in mm continuum emission, while four are detected in molecular line emission (Section 4.1). The fifth disk, HD 38120, appears to be cloud contaminated near its systemic velocity and likely has fainter line emission than was previously expected from single-dish observations in the literature.
-
2.
Focusing on the other four disks in the sample, 12CO 2–1 is detected from all four disks (Section 4.1). 13CO 2–1, C18O 2–1, HCO+ 3–2 are detected from three disks, and 13CO 2–1 is tentatively detected from a fourth disk. HCN 3–2 is detected from one disk and tentatively detected from another. Finally, CS 5–4 and DCO+ 3–2 are tentatively detected from two disks each, and C2H 3–2 and DCN 3–2 are tentatively detected from one disk each. H2CO 3–2 is not detected at the sensitivity of our observations.
-
3.
Based on gas and dust morphologies from this work and from Piétu et al. (2003), van der Plas et al. (2017), Stapper et al. (2022), Law et al. (2022a), and the ALMA archive, HD 34282 appears to be adjacent to a faint source of emission. This source is detected in mm continuum emission and is either tentatively or not detected in molecular line emission (Section 4.2.1). This neighbor is located roughly 5 arcseconds eastward of HD 34282. We speculate that the neighbor could be an extended, clumpy spiral arm or a distant orbital companion, for which the gas is either not traceable in our target molecular lines or has dispersed.
-
4.
HD 144432 has previously been undetected in scattered light (i.e., emission from micron-sized dust grains; Monnier et al., 2017). Here we detect HD 144432 in emission from millimeter-sized dust grains (Section 4.2.3). It is possible this disk is compact, truncated (see discussion by Monnier et al., 2017), or has lost material with age.
-
5.
We have compiled a database of known fluxes and upper limits for protoplanetary disks from the literature that have been detected in at least one of our ten target molecular lines (Section 2.4, Appendix A).
-
(a)
Across the combined sample, CO 2–1 isotopologue flux ratios appear closest to unity for Herbig AeBe/F disks relative to T Tauri disks (Section 5.1.1). The CO line flux ratios may indicate their vertical emitting layers have relatively similar, warmer temperatures in Herbig AeBe/F disks, and more abundant CO relative to disk dust mass overall. Relatively diminished HCO+ 3–2 flux ratios may result from less ionization in Herbig AeBe/F disks, as Herbig AeBe stars are fainter X-ray emitters than their T Tauri counterparts (Section 5.1.2).
-
(b)
DCN 3–2, DCO+ 3–2, and H2CO 3–2 have been detected in only a few Herbig AeBe/F disks so far. Observations from this work for these lines yielded only upper limits (Section 5.1.3). These low detection rates, and flux ratios for the few existing detections, are consistent with studies from the literature, which have predicted smaller regimes of cold chemistry in disks around the hotter Herbig AeBe/F stars.
-
(a)
We stress that these conclusions are based on the small sample of disk chemistry surveyed so far (Appendix A). We look forward to any future follow-up or new observations of protoplanetary disks, particularly Herbig AeBe/F disks, that could test these hypotheses over a larger sample of the pre-main-sequence stellar mass distribution.
References
- Aikawa et al. (2015) Aikawa, Y., Furuya, K., Nomura, H., & Qi, C. 2015, ApJ, 807, 120
- Aikawa & Herbst (1999) Aikawa, Y., & Herbst, E. 1999, ApJ, 526, 314
- Aikawa & Herbst (2001) —. 2001, A&A, 371, 1107
- Aikawa et al. (2021) Aikawa, Y., Cataldi, G., Yamato, Y., et al. 2021, ApJS, 257, 13
- Akeson et al. (2019) Akeson, R. L., Jensen, E. L. N., Carpenter, J., et al. 2019, ApJ, 872, 158
- Alcalá et al. (2019) Alcalá, J. M., Manara, C. F., France, K., et al. 2019, A&A, 629, A108
- Alcalá et al. (2014) Alcalá, J. M., Natta, A., Manara, C. F., et al. 2014, A&A, 561, A2
- Alcalá et al. (2017) Alcalá, J. M., Manara, C. F., Natta, A., et al. 2017, A&A, 600, A20
- Alecian et al. (2012) Alecian, E., Wade, G. A., Catala, C., et al. 2012, Monthly Notices of the Royal Astronomical Society, 429, 1001–1026. http://dx.doi.org/10.1093/mnras/sts383
- Allen (1995) Allen, L. E. 1995, PhD thesis, School of Physics, University of New South Wales, Sydney, NSW 2052, Australia
- Allen & Davis (2008) Allen, L. E., & Davis, C. J. 2008, Low Mass Star Formation in the Lynds 1641 Molecular Cloud, ed. B. Reipurth, Vol. 4, 621
- Anderson et al. (2019) Anderson, D. E., Blake, G. A., Bergin, E. A., et al. 2019, ApJ, 881, 127
- Anderson et al. (2022) Anderson, D. E., Cleeves, L. I., Blake, G. A., et al. 2022, ApJ, 927, 229
- Andrews (2020) Andrews, S. M. 2020, ARA&A, 58, 483
- Andrews et al. (2013) Andrews, S. M., Rosenfeld, K. A., Kraus, A. L., & Wilner, D. J. 2013, ApJ, 771, 129
- Andrews et al. (2018a) Andrews, S. M., Terrell, M., Tripathi, A., et al. 2018a, ApJ, 865, 157
- Andrews et al. (2018b) Andrews, S. M., Huang, J., Pérez, L. M., et al. 2018b, ApJ, 869, L41
- Ansdell et al. (2017) Ansdell, M., Williams, J. P., Manara, C. F., et al. 2017, AJ, 153, 240
- Ansdell et al. (2016) Ansdell, M., Williams, J. P., van der Marel, N., et al. 2016, ApJ, 828, 46
- Ansdell et al. (2018) Ansdell, M., Williams, J. P., Trapman, L., et al. 2018, ApJ, 859, 21
- Astropy Collaboration et al. (2013) Astropy Collaboration, Robitaille, T. P., Tollerud, E. J., et al. 2013, A&A, 558, A33
- Astropy Collaboration et al. (2018) Astropy Collaboration, Price-Whelan, A. M., Sipőcz, B. M., et al. 2018, AJ, 156, 123
- Bae et al. (2016) Bae, J., Zhu, Z., & Hartmann, L. 2016, ApJ, 819, 134
- Bailer-Jones et al. (2021) Bailer-Jones, C. A. L., Rybizki, J., Fouesneau, M., Demleitner, M., & Andrae, R. 2021, AJ, 161, 147
- Baines et al. (2006) Baines, D., Oudmaijer, R. D., Porter, J. M., & Pozzo, M. 2006, MNRAS, 367, 737
- Barenfeld et al. (2016) Barenfeld, S. A., Carpenter, J. M., Ricci, L., & Isella, A. 2016, ApJ, 827, 142
- Bergner et al. (2018) Bergner, J. B., Guzmán, V. G., Öberg, K. I., Loomis, R. A., & Pegues, J. 2018, ApJ, 857, 69
- Bergner et al. (2019) Bergner, J. B., Öberg, K. I., Bergin, E. A., et al. 2019, ApJ, 876, 25
- Bergner et al. (2020) —. 2020, ApJ, 898, 97
- Boehler et al. (2018) Boehler, Y., Ricci, L., Weaver, E., et al. 2018, ApJ, 853, 162
- Boissier et al. (2011) Boissier, J., Alonso-Albi, T., Fuente, A., et al. 2011, A&A, 531, A50
- Booth et al. (2023) Booth, A. S., Ilee, J. D., Walsh, C., et al. 2023, A&A, 669, A53
- Booth et al. (2021) Booth, A. S., van der Marel, N., Leemker, M., van Dishoeck, E. F., & Ohashi, S. 2021, A&A, 651, L6
- Booth et al. (2019) Booth, A. S., Walsh, C., & Ilee, J. D. 2019, A&A, 629, A75
- Booth et al. (2018) Booth, A. S., Walsh, C., Kama, M., et al. 2018, A&A, 611, A16
- Bosman et al. (2018) Bosman, A. D., Walsh, C., & van Dishoeck, E. F. 2018, A&A, 618, A182
- Bowler et al. (2010) Bowler, B. P., Johnson, J. A., Marcy, G. W., et al. 2010, ApJ, 709, 396
- Brunken et al. (2022) Brunken, N. G. C., Booth, A. S., Leemker, M., et al. 2022, A&A, 659, A29
- Calahan et al. (2021) Calahan, J. K., Bergin, E., Zhang, K., et al. 2021, ApJ, 908, 8
- Canovas et al. (2016) Canovas, H., Caceres, C., Schreiber, M. R., et al. 2016, MNRAS, 458, L29
- Carney et al. (2018) Carney, M. T., Fedele, D., Hogerheijde, M. R., et al. 2018, A&A, 614, A106
- Carson et al. (2013) Carson, J., Thalmann, C., Janson, M., et al. 2013, ApJ, 763, L32
- CASA Team et al. (2022) CASA Team, Bean, B., Bhatnagar, S., et al. 2022, PASP, 134, 114501
- Cataldi et al. (2021) Cataldi, G., Yamato, Y., Aikawa, Y., et al. 2021, ApJS, 257, 10
- Chapillon et al. (2012a) Chapillon, E., Guilloteau, S., Dutrey, A., Piétu, V., & Guélin, M. 2012a, A&A, 537, A60
- Chapillon et al. (2012b) Chapillon, E., Dutrey, A., Guilloteau, S., et al. 2012b, ApJ, 756, 58
- Cleeves et al. (2014) Cleeves, L. I., Bergin, E. A., & Adams, F. C. 2014, ApJ, 794, 123
- Cleeves et al. (2015) Cleeves, L. I., Bergin, E. A., Qi, C., Adams, F. C., & Öberg, K. I. 2015, ApJ, 799, 204
- Cohen (1984) Cohen, M. 1984, Phys. Rep., 116, 173
- Czekala et al. (2015) Czekala, I., Andrews, S. M., Jensen, E. L. N., et al. 2015, ApJ, 806, 154
- Czekala et al. (2021) Czekala, I., Ribas, Á., Cuello, N., et al. 2021, ApJ, 912, 6
- de Boer et al. (2021) de Boer, J., Ginski, C., Chauvin, G., et al. 2021, A&A, 649, A25
- Dent et al. (2005) Dent, W. R. F., Greaves, J. S., & Coulson, I. M. 2005, MNRAS, 359, 663
- Dong et al. (2018) Dong, R., Najita, J. R., & Brittain, S. 2018, ApJ, 862, 103
- Dong et al. (2015) Dong, R., Zhu, Z., & Whitney, B. 2015, ApJ, 809, 93
- Dutrey et al. (1997) Dutrey, A., Guilloteau, S., & Guelin, M. 1997, A&A, 317, L55
- Endres et al. (2016) Endres, C. P., Schlemmer, S., Schilke, P., Stutzki, J., & Müller, H. S. P. 2016, Journal of Molecular Spectroscopy, 327, 95
- Facchini et al. (2021) Facchini, S., Teague, R., Bae, J., et al. 2021, AJ, 162, 99
- Fairlamb et al. (2015) Fairlamb, J. R., Oudmaijer, R. D., Mendigutía, I., Ilee, J. D., & van den Ancker, M. E. 2015, MNRAS, 453, 976
- Fang et al. (2013) Fang, M., Kim, J. S., van Boekel, R., et al. 2013, ApJS, 207, 5
- Fang et al. (2009) Fang, M., van Boekel, R., Wang, W., et al. 2009, A&A, 504, 461
- Fedele et al. (2011) Fedele, D., Pascucci, I., Brittain, S., et al. 2011, ApJ, 732, 106
- Fedele et al. (2017) Fedele, D., Carney, M., Hogerheijde, M. R., et al. 2017, A&A, 600, A72
- Fockenberg & Preses (2002) Fockenberg, C., & Preses, J. M. 2002, The Journal of Physical Chemistry A, 106, 2924. http://dx.doi.org/10.1021/jp0141880
- Fuente et al. (2010) Fuente, A., Cernicharo, J., Agúndez, M., et al. 2010, A&A, 524, A19
- Fukagawa et al. (2010) Fukagawa, M., Tamura, M., Itoh, Y., et al. 2010, PASJ, 62, 347
- Gaia Collaboration et al. (2016) Gaia Collaboration, Prusti, T., de Bruijne, J. H. J., et al. 2016, A&A, 595, A1
- Gaia Collaboration et al. (2018) Gaia Collaboration, Brown, A. G. A., Vallenari, A., et al. 2018, A&A, 616, A1
- Galli et al. (2021) Galli, P. A. B., Bouy, H., Olivares, J., et al. 2021, A&A, 646, A46
- Grady et al. (2013) Grady, C. A., Muto, T., Hashimoto, J., et al. 2013, ApJ, 762, 48
- Graninger et al. (2015) Graninger, D., Öberg, K. I., Qi, C., & Kastner, J. 2015, ApJ, 807, L15
- Grant et al. (2021) Grant, S. L., Espaillat, C. C., Wendeborn, J., et al. 2021, ApJ, 913, 123
- Gravity Collaboration et al. (2019) Gravity Collaboration, Perraut, K., Labadie, L., et al. 2019, A&A, 632, A53
- Guilloteau et al. (2013) Guilloteau, S., Di Folco, E., Dutrey, A., et al. 2013, A&A, 549, A92
- Guzmán et al. (2015) Guzmán, V. V., Öberg, K. I., Loomis, R., & Qi, C. 2015, ApJ, 814, 53
- Guzmán et al. (2021) Guzmán, V. V., Bergner, J. B., Law, C. J., et al. 2021, ApJS, 257, 6
- Hendler et al. (2020) Hendler, N., Pascucci, I., Pinilla, P., et al. 2020, ApJ, 895, 126
- Henning et al. (2010) Henning, T., Semenov, D., Guilloteau, S., et al. 2010, ApJ, 714, 1511
- Herbig (1977) Herbig, G. H. 1977, ApJ, 214, 747
- Herbig & Bell (1988) Herbig, G. H., & Bell, K. R. 1988, Third Catalog of Emission-Line Stars of the Orion Population : 3 : 1988
- Herczeg & Hillenbrand (2014) Herczeg, G. J., & Hillenbrand, L. A. 2014, ApJ, 786, 97
- Hernández et al. (2009) Hernández, J., Calvet, N., Hartmann, L., et al. 2009, ApJ, 707, 705
- Hernández et al. (2008) Hernández, J., Hartmann, L., Calvet, N., et al. 2008, ApJ, 686, 1195
- Hillenbrand & White (2004) Hillenbrand, L. A., & White, R. J. 2004, ApJ, 604, 741
- Hiraoka et al. (1994) Hiraoka, K., Ohashi, N., Kihara, Y., et al. 1994, Chemical Physics Letters, 229, 408 . http://www.sciencedirect.com/science/article/pii/0009261494010668
- Hiraoka et al. (2002) Hiraoka, K., Sato, T., Sato, S., et al. 2002, ApJ, 577, 265
- Ho et al. (2004) Ho, P. T. P., Moran, J. M., & Lo, K. Y. 2004, ApJ, 616, L1
- Honda et al. (2012) Honda, M., Maaskant, K., Okamoto, Y. K., et al. 2012, ApJ, 752, 143
- Hsu et al. (2012) Hsu, W.-H., Hartmann, L., Allen, L., et al. 2012, ApJ, 752, 59
- Huang et al. (2017) Huang, J., Öberg, K. I., Qi, C., et al. 2017, ApJ, 835, 231
- Huang et al. (2018) Huang, J., Andrews, S. M., Dullemond, C. P., et al. 2018, ApJ, 869, L42
- Huang et al. (2020a) Huang, J., Andrews, S. M., Öberg, K. I., et al. 2020a, ApJ, 898, 140
- Huang et al. (2020b) Huang, J., Andrews, S. M., Dullemond, C. P., et al. 2020b, ApJ, 891, 48
- Hunter (2007) Hunter, J. D. 2007, Computing In Science & Engineering, 9, 90
- Ilee et al. (2021) Ilee, J. D., Walsh, C., Booth, A. S., et al. 2021, ApJS, 257, 9
- Isella et al. (2010) Isella, A., Natta, A., Wilner, D., Carpenter, J. M., & Testi, L. 2010, ApJ, 725, 1735
- Isella et al. (2007) Isella, A., Testi, L., Natta, A., et al. 2007, A&A, 469, 213
- Isella et al. (2018) Isella, A., Huang, J., Andrews, S. M., et al. 2018, ApJ, 869, L49
- Johnson et al. (2010) Johnson, J. A., Aller, K. M., Howard, A. W., & Crepp, J. R. 2010, PASP, 122, 905
- Johnson et al. (2007) Johnson, J. A., Fischer, D. A., Marcy, G. W., et al. 2007, ApJ, 665, 785
- Juhász et al. (2010) Juhász, A., Bouwman, J., Henning, T., et al. 2010, ApJ, 721, 431
- Kama et al. (2015) Kama, M., Folsom, C. P., & Pinilla, P. 2015, A&A, 582, L10
- Kastner et al. (2015) Kastner, J. H., Qi, C., Gorti, U., et al. 2015, ApJ, 806, 75
- Kastner et al. (2018) Kastner, J. H., Qi, C., Dickson-Vandervelde, D. A., et al. 2018, ApJ, 863, 106
- Kellogg et al. (2017) Kellogg, K., Prato, L., Torres, G., et al. 2017, ApJ, 844, 168
- Kim et al. (2016) Kim, K. H., Watson, D. M., Manoj, P., et al. 2016, ApJS, 226, 8
- Kounkel et al. (2017) Kounkel, M., Hartmann, L., Loinard, L., et al. 2017, ApJ, 834, 142
- Law et al. (2021a) Law, C. J., Loomis, R. A., Teague, R., et al. 2021a, ApJS, 257, 3
- Law et al. (2021b) Law, C. J., Teague, R., Loomis, R. A., et al. 2021b, ApJS, 257, 4
- Law et al. (2022a) Law, C. J., Teague, R., Öberg, K. I., et al. 2022a, arXiv e-prints, arXiv:2212.08667
- Law et al. (2022b) Law, C. J., Crystian, S., Teague, R., et al. 2022b, ApJ, 932, 114
- Le Gal et al. (2019) Le Gal, R., Öberg, K. I., Loomis, R. A., Pegues, J., & Bergner, J. B. 2019, ApJ, 876, 72
- Le Gal et al. (2021) Le Gal, R., Öberg, K. I., Teague, R., et al. 2021, ApJS, 257, 12
- Lin et al. (2006) Lin, S.-Y., Ohashi, N., Lim, J., et al. 2006, ApJ, 645, 1297
- Long et al. (2018) Long, F., Pinilla, P., Herczeg, G. J., et al. 2018, ApJ, 869, 17
- Loomis et al. (2020) Loomis, R. A., Öberg, K. I., Andrews, S. M., et al. 2020, ApJ, 893, 101
- Luhman & Mamajek (2012) Luhman, K. L., & Mamajek, E. E. 2012, ApJ, 758, 31
- Macías et al. (2017) Macías, E., Anglada, G., Osorio, M., et al. 2017, ApJ, 838, 97
- Maheswar et al. (2002) Maheswar, G., Manoj, P., & Bhatt, H. C. 2002, A&A, 387, 1003
- Manara et al. (2017) Manara, C. F., Testi, L., Herczeg, G. J., et al. 2017, A&A, 604, A127
- Marois et al. (2008) Marois, C., Macintosh, B., Barman, T., et al. 2008, Science, 322, 1348
- Matter et al. (2016) Matter, A., Labadie, L., Augereau, J. C., et al. 2016, A&A, 586, A11
- McMullin et al. (2007) McMullin, J. P., Waters, B., Schiebel, D., Young, W., & Golap, K. 2007, in Astronomical Society of the Pacific Conference Series, Vol. 376, Astronomical Data Analysis Software and Systems XVI, ed. R. A. Shaw, F. Hill, & D. J. Bell, 127
- Meeus et al. (1998) Meeus, G., Waelkens, C., & Malfait, K. 1998, A&A, 329, 131
- Meeus et al. (2012) Meeus, G., Montesinos, B., Mendigutía, I., et al. 2012, A&A, 544, A78
- Merín et al. (2004) Merín, B., Montesinos, B., Eiroa, C., et al. 2004, A&A, 419, 301
- Miley et al. (2019) Miley, J. M., Panić, O., Haworth, T. J., et al. 2019, MNRAS, 485, 739
- Millar et al. (1989) Millar, T. J., Bennett, A., & Herbst, E. 1989, ApJ, 340, 906
- Miotello et al. (2014) Miotello, A., Bruderer, S., & van Dishoeck, E. F. 2014, A&A, 572, A96
- Miotello et al. (2019) Miotello, A., Facchini, S., van Dishoeck, E. F., et al. 2019, A&A, 631, A69
- Monnier et al. (2017) Monnier, J. D., Harries, T. J., Aarnio, A., et al. 2017, ApJ, 838, 20
- Muñoz-Romero et al. (2023) Muñoz-Romero, C. E., Öberg, K. I., Law, C. J., et al. 2023, ApJ, 943, 35
- Müller et al. (2011) Müller, A., Carmona, A., van den Ancker, M. E., et al. 2011, A&A, 535, L3
- Müller et al. (2005) Müller, H. S. P., Schlöder, F., Stutzki, J., & Winnewisser, G. 2005, Journal of Molecular Structure, 742, 215
- Müller et al. (2001) Müller, H. S. P., Thorwirth, S., Roth, D. A., & Winnewisser, G. 2001, A&A, 370, L49
- Murphy & Paunzen (2017) Murphy, S. J., & Paunzen, E. 2017, MNRAS, 466, 546
- Öberg et al. (2010) Öberg, K. I., Qi, C., Fogel, J. K. J., et al. 2010, ApJ, 720, 480
- Öberg et al. (2011) —. 2011, ApJ, 734, 98
- Öberg et al. (2021a) Öberg, K. I., Guzmán, V. V., Walsh, C., et al. 2021a, ApJS, 257, 1
- Öberg et al. (2021b) Öberg, K. I., Cleeves, L. I., Bergner, J. B., et al. 2021b, AJ, 161, 38
- Oliphant (2006–) Oliphant, T. 2006–, NumPy: A guide to NumPy, USA: Trelgol Publishing, , . http://www.numpy.org/
- Paneque-Carreño et al. (2023) Paneque-Carreño, T., Miotello, A., van Dishoeck, E. F., et al. 2023, A&A, 669, A126
- Pascucci et al. (2016) Pascucci, I., Testi, L., Herczeg, G. J., et al. 2016, ApJ, 831, 125
- Pecaut & Mamajek (2013) Pecaut, M. J., & Mamajek, E. E. 2013, ApJS, 208, 9
- Pecaut et al. (2012) Pecaut, M. J., Mamajek, E. E., & Bubar, E. J. 2012, ApJ, 746, 154
- Pegues (2019) Pegues, J. 2019, jpegues/kepmask: First release of kepmask, vv1.0.0, Zenodo, doi:10.5281/zenodo.3382082. https://doi.org/10.5281/zenodo.3382082
- Pegues et al. (2020) Pegues, J., Öberg, K. I., Bergner, J. B., et al. 2020, The Astrophysical Journal, 890, 142. https://doi.org/10.3847%2F1538-4357%2Fab64d9
- Pegues et al. (2021a) Pegues, J., Öberg, K. I., Bergner, J. B., et al. 2021a, ApJ, 911, 150
- Pegues et al. (2021b) Pegues, J., Czekala, I., Andrews, S. M., et al. 2021b, ApJ, 908, 42
- Perez et al. (2015) Perez, S., Casassus, S., Ménard, F., et al. 2015, ApJ, 798, 85
- Piétu et al. (2003) Piétu, V., Dutrey, A., & Kahane, C. 2003, A&A, 398, 565
- Piétu et al. (2014) Piétu, V., Guilloteau, S., Di Folco, E., Dutrey, A., & Boehler, Y. 2014, A&A, 564, A95
- Pinte et al. (2018) Pinte, C., Ménard, F., Duchêne, G., et al. 2018, A&A, 609, A47
- Pontoppidan et al. (2010) Pontoppidan, K. M., Salyk, C., Blake, G. A., et al. 2010, ApJ, 720, 887
- Qi et al. (2013a) Qi, C., Öberg, K. I., & Wilner, D. J. 2013a, ApJ, 765, 34
- Qi et al. (2013b) Qi, C., Öberg, K. I., Wilner, D. J., & Rosenfeld, K. A. 2013b, ApJ, 765, L14
- Qi et al. (2008) Qi, C., Wilner, D. J., Aikawa, Y., Blake, G. A., & Hogerheijde, M. R. 2008, ApJ, 681, 1396
- Qi et al. (2013c) Qi, C., Öberg, K. I., Wilner, D. J., et al. 2013c, Science, 341, 630
- Quanz (2015) Quanz, S. P. 2015, Ap&SS, 357, 148
- Quanz et al. (2015) Quanz, S. P., Amara, A., Meyer, M. R., et al. 2015, ApJ, 807, 64
- Rameau et al. (2013) Rameau, J., Chauvin, G., Lagrange, A. M., et al. 2013, ApJ, 779, L26
- Reggiani et al. (2018) Reggiani, M., Christiaens, V., Absil, O., et al. 2018, A&A, 611, A74
- Rodriguez et al. (2018) Rodriguez, J. E., Loomis, R., Cabrit, S., et al. 2018, ApJ, 859, 150
- Rubinstein et al. (2018) Rubinstein, A. E., Macías, E., Espaillat, C. C., et al. 2018, ApJ, 860, 7
- Salyk et al. (2014) Salyk, C., Pontoppidan, K., Corder, S., et al. 2014, ApJ, 792, 68
- Sanchis et al. (2020) Sanchis, E., Testi, L., Natta, A., et al. 2020, A&A, 633, A114
- Sandell et al. (2011) Sandell, G., Weintraub, D. A., & Hamidouche, M. 2011, ApJ, 727, 26
- Schreyer et al. (2008) Schreyer, K., Guilloteau, S., Semenov, D., et al. 2008, A&A, 491, 821
- Simon et al. (2019) Simon, M., Guilloteau, S., Beck, T. L., et al. 2019, ApJ, 884, 42
- Spezzi et al. (2008) Spezzi, L., Alcalá, J. M., Covino, E., et al. 2008, ApJ, 680, 1295
- Spezzi et al. (2013) Spezzi, L., Cox, N. L. J., Prusti, T., et al. 2013, A&A, 555, A71
- Stapper et al. (2022) Stapper, L. M., Hogerheijde, M. R., van Dishoeck, E. F., & Mentel, R. 2022, A&A, 658, A112
- Terwisscha van Scheltinga et al. (2021) Terwisscha van Scheltinga, J., Hogerheijde, M. R., Cleeves, L. I., et al. 2021, ApJ, 906, 111
- The & Molster (1994) The, P. S., & Molster, F. J. 1994, Ap&SS, 212, 125
- Thi et al. (2004) Thi, W. F., van Zadelhoff, G. J., & van Dishoeck, E. F. 2004, A&A, 425, 955
- Thomas et al. (2007) Thomas, S. J., van der Bliek, N. S., Rodgers, B., Doppmann, G., & Bouvier, J. 2007, in Binary Stars as Critical Tools & Tests in Contemporary Astrophysics, ed. W. I. Hartkopf, P. Harmanec, & E. F. Guinan, Vol. 240, 250–253
- van der Marel et al. (2021) van der Marel, N., Booth, A. S., Leemker, M., van Dishoeck, E. F., & Ohashi, S. 2021, A&A, 651, L5
- van der Marel et al. (2019) van der Marel, N., Dong, R., di Francesco, J., Williams, J. P., & Tobin, J. 2019, ApJ, 872, 112
- van der Marel et al. (2014) van der Marel, N., van Dishoeck, E. F., Bruderer, S., & van Kempen, T. A. 2014, A&A, 563, A113
- van der Marel et al. (2016) van der Marel, N., Verhaar, B. W., van Terwisga, S., et al. 2016, A&A, 592, A126
- van der Plas et al. (2017) van der Plas, G., Ménard, F., Canovas, H., et al. 2017, A&A, 607, A55
- van der Plas et al. (2015) van der Plas, G., van den Ancker, M. E., Waters, L. B. F. M., & Dominik, C. 2015, A&A, 574, A75
- van der Plas et al. (2019) van der Plas, G., Ménard, F., Gonzalez, J. F., et al. 2019, A&A, 624, A33
- van der Velden (2020) van der Velden, E. 2020, The Journal of Open Source Software, 5, 2004
- Vieira et al. (2003) Vieira, S. L. A., Corradi, W. J. B., Alencar, S. H. P., et al. 2003, AJ, 126, 2971
- Villenave et al. (2021) Villenave, M., Ménard, F., Dent, W. R. F., et al. 2021, A&A, 653, A46
- Vioque et al. (2018) Vioque, M., Oudmaijer, R. D., Baines, D., Mendigutía, I., & Pérez-Martínez, R. 2018, A&A, 620, A128
- Walsh et al. (2015) Walsh, C., Nomura, H., & van Dishoeck, E. 2015, A&A, 582, A88
- Watanabe & Kouchi (2002) Watanabe, N., & Kouchi, A. 2002, ApJ, 571, L173
- Wenger et al. (2000) Wenger, M., Ochsenbein, F., Egret, D., et al. 2000, A&AS, 143, 9
- Wheelwright et al. (2010) Wheelwright, H. E., Oudmaijer, R. D., & Goodwin, S. P. 2010, MNRAS, 401, 1199
- Yen et al. (2016) Yen, H.-W., Koch, P. M., Liu, H. B., et al. 2016, ApJ, 832, 204
- Zhang et al. (2021) Zhang, K., Booth, A. S., Law, C. J., et al. 2021, ApJS, 257, 5
- Zhang et al. (2018) Zhang, S., Zhu, Z., Huang, J., et al. 2018, ApJ, 869, L47
- Zuckerman et al. (1995) Zuckerman, B., Forveille, T., & Kastner, J. H. 1995, Nature, 373, 494
Appendix A The Literature Sample of Protoplanetary Disks
A.1 Stellar Characteristics for the Literature Sample.
Please refer to the original references for retrieval and discussion of all star+disk systems and their characteristics.
| Star+Disk | Distance | Spectral | References | ||||
|---|---|---|---|---|---|---|---|
| System | (pc) | Type | (L☉) | (M☉) | (mJy) | (GHz) | (Distance; Spectral Type; ; ; ) |
| AA Tau | 135 | K5 | 0.56 | 0.84 | 11311 | 267 | 1; 2; 3; 4; 5 |
| AK Sco | 140 | F5 | 4.70 | 2.49 | 330.07 | 231 | 1; 6; 7; 8; 8 |
| AS 205 | 142 | K5 | 2.14 | 0.87 | 52853 | 267 | 1; 9; 10; 10; 11 |
| AS 209 | 121 | K5 | 1.41 | 0.83 | 22923 | 267 | 1; 12; 10; 10; 11 |
| CI Tau | 160 | K5.5 | 0.81 | 0.90 | 161 | 231 | 1; 13; 14; 4; 15 |
| CM Cha | 192 | K7 | 0.86 | 0.81 | 390.20 | 231 | 1; 16; 17; 18; 18 |
| CQ Tau | 149 | F5 | 10.70 | 1.51 | 25826 | 267 | 1; 19; 7; 4; 5 |
| CW Tau | 132 | K3.0 | 2.40 | 0.64 | 16027 | 337 | 1; 13; 20; 4; 21 |
| CX Tau | 127 | M2.5 | 0.37 | 0.38 | 257.6 | 337 | 1; 13; 20; 4; 21 |
| DE Tau | 128 | M2.3 | 0.39 | 0.41 | 8410 | 337 | 1; 13; 20; 4; 21 |
| DM Tau | 144 | M1 | 0.20 | 0.55 | 14314 | 267 | 1; 2; 3; 4; 5 |
| DO Tau | 139 | M0.3 | 0.72 | 0.54 | 89 | 300 | 1; 13; 20; 20; 15 |
| DS Tau | 158 | M0.4 | 0.25 | 0.83 | 406.9 | 337 | 1; 13; 14; 4; 21 |
| EX Lup | 155 | M0 | 0.76 | 0.56 | 200.30 | 225 | 1; 22; 23; 23; 24 |
| FP Tau | 127 | M2.6 | 0.36 | 0.40 | 110.02 | 273 | 1; 13; 20; 25; 26 |
| GM Aur | 158 | K3 | 1.20 | 1.14 | 25125 | 267 | 1; 21; 7; 4; 5 |
| HD 100453 | 104 | A9 | 6.00 | 1.54 | 1493.0 | 234 | 1; 27; 7; 7; 28 |
| HD 100546 | 108 | B9 | 24.70 | 2.30 | 492 | 231 | 1; 29; 7; 7; 30 |
| HD 142527 | 159 | F6 | 9.90 | 1.70 | 1030100 | 267 | 1; 31; 7; 7; 11 |
| HD 143006 | 167 | G7 | 3.80 | 1.78 | 127 | 231 | 1; 9; 10; 10; 15 |
| HD 163296 | 101 | A1 | 16.98 | 2.04 | 255 | 300 | 1; 31; 10; 10; 15 |
| HD 169142 | 115 | F3 | 6.10 | 1.51 | 22623 | 233 | 1; 32; 7; 7; 33 |
| Hn 24 A | 197 | M0 | 1.28 | 0.57 | 100.20 | 231 | 34; 35; 17; 18; 18 |
| IM Lup | 156 | K5 | 2.57 | 0.89 | 33133 | 267 | 1; 36; 10; 10; 11 |
| J0432+1827 | 146 | M5.0 | 0.09 | 0.19 | 290.08 | 273 | 1; 13; 20; 25; 26 |
| J1100-7619 | 193 | M4 | 0.10 | 0.46 | 350.08 | 273 | 1; 37; 38; 25; 26 |
| J1545-3417 | 155 | M5.5 | 0.06 | 0.15 | 240.28 | 273 | 1; 37; 38; 38; 26 |
| J15560210-3655282 | 158 | M1 | 0.26 | 0.50 | 240.20 | 225 | 1; 22; 23; 23; 24 |
| J16000236-4222145 | 160 | M4 | 0.17 | 0.19 | 500.38 | 225 | 1; 36; 38; 38; 24 |
| J1604-2130 | 145 | K2 | 0.60 | 1.10 | 956 | 300 | 1; 39; 7; 7; 15 |
| J16070384-3911113 | 152 | M4.5 | 0.10 | 0.22 | 1.00.3 | 225 | 1; 36; 38; 38; 24 |
| J16070854-3914075 | 175 | M | 0.14 | 0.22 | 921.5 | 337 | 1; 40; 38; 38; 41 |
| J16085324-3914401 | 163 | M3 | 0.21 | 0.31 | 8.00.1 | 225 | 1; 42; 42; 42; 24 |
| J1609-1908 | 137 | K9 | 0.35 | 0.65 | 237 | 300 | 1; 43; 38; 38; 15 |
| J16090141-3925119 | 159 | M4 | 0.09 | 0.26 | 5.50.4 | 225 | 1; 36; 38; 38; 24 |
| J16102955-3922144 | 160 | M4.5 | 0.10 | 0.22 | 2.90.2 | 225 | 1; 36; 38; 38; 24 |
| J1612-1859 | 135 | M0.5 | 0.29 | 0.56 | 69 | 231 | 1; 43; 44; 44; 15 |
| J1614-1906 | 140 | M0 | 0.47 | 0.62 | 22 | 231 | 1; 43; 38; 38; 15 |
| LkCa 15 | 157 | K5 | 1.00 | 1.14 | 21421 | 267 | 1; 39; 7; 4; 5 |
| Lynds 1641 ID 1001 | 400 | K6 | 0.72 | 0.90 | 6.80.1 | 225 | 45; 46; 46; 46; 47 |
| Lynds 1641 ID 1006 | 385 | M0.5 | 0.45 | 0.45 | 5.00.1 | 225 | 45; 48; 49; 49; 47 |
| Lynds 1641 ID 1007 | 369 | M1 | 0.35 | 0.51 | 100.10 | 225 | 45; 50; 51; 51; 47 |
| Lynds 1641 ID 1039 | 380 | M0 | 1.50 | 0.48 | 210.10 | 225 | 45; 52; 49; 49; 47 |
| Lynds 1641 ID 1086 | 428 | M0 | 0.66 | 0.49 | 180.10 | 225 | 53; 52; 49; 49; 47 |
| Lynds 1641 ID 269 | 600 | M3 | 0.47 | 0.29 | 130.10 | 225 | 45; 54; 49; 49; 47 |
| Lynds 1641 ID 307 | 440 | K7.5 | 0.57 | 0.67 | 230.10 | 225 | 45; 46; 46; 46; 47 |
| Lynds 1641 ID 378 | 420 | K7 | 1.95 | 0.62 | 290.10 | 225 | 45; 55; 49; 49; 47 |
| Lynds 1641 ID 399 | 396 | K5 | 5.83 | 0.85 | 360.10 | 225 | 45; 55; 49; 49; 47 |
| Lynds 1641 ID 402 | 310 | M1.5 | 1.05 | 0.37 | 5.10.1 | 225 | 45; 56; 49; 49; 47 |
| Lynds 1641 ID 429 | 390 | M2 | 1.72 | 0.28 | 7.20.1 | 225 | 45; 50; 51; 51; 47 |
| Lynds 1641 ID 477 | 428 | M2.5 | 0.57 | 0.32 | 2.60.1 | 225 | 53; 50; 51; 51; 47 |
| Lynds 1641 ID 483 | 400 | G1 | 8.11 | 1.95 | 9.20.1 | 225 | 45; 50; 51; 51; 47 |
| Lynds 1641 ID 487 | 428 | M0.5 | 1.13 | 0.54 | 2.90.1 | 225 | 53; 46; 46; 46; 47 |
| Lynds 1641 ID 525 | 450 | M1 | 1.13 | 0.40 | 110.10 | 225 | 45; 57; 49; 49; 47 |
| Lynds 1641 ID 556 | 410 | M1.5 | 0.33 | 0.42 | 8.90.1 | 225 | 45; 58; 49; 49; 47 |
| Lynds 1641 ID 633 | 390 | M3 | 1.07 | 0.29 | 1.20.1 | 225 | 45; 52; 49; 49; 47 |
| Lynds 1641 ID 761 | 440 | M0 | 1.04 | 0.48 | 9.10.1 | 225 | 45; 59; 49; 49; 47 |
| Lynds 1641 ID 762 | 390 | M2.5 | 0.85 | 0.31 | 210.10 | 225 | 45; 52; 49; 49; 47 |
| Lynds 1641 ID 848 | 380 | K7.5 | 2.05 | 0.61 | 5.80.1 | 225 | 45; 52; 49; 49; 47 |
| Lynds 1641 ID 971 | 387 | G9 | 4.47 | 1.88 | 6.50.1 | 225 | 45; 46; 46; 46; 47 |
| MWC 480 | 156 | A5 | 19.60 | 2.11 | 42743 | 267 | 1; 21; 7; 4; 5 |
| MY Lup | 157 | K0 | 0.87 | 1.23 | 79 | 239 | 1; 36; 10; 10; 60 |
| PDS 70 | 112 | K5 | 1.20 | 0.83 | 58 | 225 | 1; 6; 7; 7; 61 |
| RU Lup | 158 | K7 | 1.45 | 0.63 | 203 | 239 | 1; 36; 10; 10; 60 |
| RW Aur A | 139 | K0 | 4.37 | 1.58 | 567.8 | 337 | 62; 13; 20; 20; 21 |
| RW Aur B | 139 | K6.5 | 1.00 | 0.66 | 132.9 | 337 | 62; 13; 20; 20; 21 |
| RY Lup | 153 | K2 | 1.91 | 1.38 | 860.68 | 225 | 1; 36; 63; 63; 24 |
| SAO 206462 | 135 | F4 | 8.80 | 1.70 | 26927 | 267 | 1; 31; 7; 7; 11 |
| SU Aur | 157 | G8 | 10.70 | 2.25 | 718.6 | 337 | 1; 21; 7; 7; 21 |
| Sz 111 | 158 | M1 | 0.21 | 0.54 | 600.49 | 225 | 1; 64; 63; 63; 24 |
| Sz 114 | 157 | M5 | 0.20 | 0.17 | 49 | 239 | 1; 36; 10; 10; 60 |
| Sz 118 | 161 | K5 | 0.72 | 1.10 | 230.26 | 225 | 1; 36; 42; 42; 24 |
| Sz 129 | 160 | K7 | 0.43 | 0.82 | 86 | 239 | 1; 42; 42; 42; 60 |
| Sz 130 | 159 | M2 | 0.18 | 0.37 | 2.00.2 | 225 | 1; 42; 42; 42; 24 |
| Sz 133 | 116 | K2 | 1.05 | 0.98 | 270.24 | 225 | 1; 36; 63; 63; 24 |
| Sz 46 | 196 | M1 | 0.40 | 0.54 | 2.80.2 | 231 | 34; 35; 17; 18; 18 |
| Sz 49 | 194 | M0.5 | 0.24 | 0.57 | 110.30 | 231 | 34; 35; 17; 18; 18 |
| Sz 53 | 198 | M1 | 0.40 | 0.54 | 4.80.2 | 231 | 34; 35; 17; 18; 18 |
| Sz 58 | 194 | K5 | 0.82 | 1.01 | 610.30 | 231 | 34; 35; 17; 18; 18 |
| Sz 61 | 199 | K5 | 1.47 | 1.07 | 450.20 | 231 | 34; 35; 17; 18; 18 |
| Sz 63 | 200 | M3 | 0.29 | 0.33 | 200.20 | 231 | 34; 35; 17; 18; 18 |
| Sz 65 | 153 | K7 | 0.89 | 0.75 | 300.20 | 225 | 1; 42; 42; 42; 24 |
| Sz 68 | 153 | K2 | 5.42 | 2.15 | 660.20 | 225 | 1; 42; 42; 42; 24 |
| Sz 69 | 153 | M4.5 | 0.09 | 0.19 | 9.40.0 | 273 | 1; 36; 63; 63; 26 |
| Sz 71 | 155 | M1.5 | 0.33 | 0.46 | 690.31 | 225 | 1; 36; 63; 63; 24 |
| Sz 75 | 154 | K6 | 1.45 | 0.78 | 340.20 | 225 | 1; 36; 63; 63; 24 |
| Sz 76 | 156 | M4 | 0.18 | 0.23 | 4.70.3 | 225 | 1; 22; 23; 23; 24 |
| Sz 82 | 156 | K5 | 2.57 | 0.89 | 2056.0 | 225 | 1; 36; 63; 63; 24 |
| Sz 83 | 158 | K7 | 1.45 | 0.63 | 1670.34 | 225 | 1; 64; 63; 63; 24 |
| Sz 84 | 156 | M5 | 0.12 | 0.15 | 130.21 | 225 | 1; 64; 63; 63; 24 |
| Sz 90 | 160 | K7 | 0.42 | 0.80 | 8.70.2 | 225 | 1; 42; 42; 42; 24 |
| Sz 91 | 159 | M0.5 | 0.30 | 0.48 | 9.50.4 | 225 | 1; 39; 7; 7; 24 |
| Sz 98 | 156 | K7 | 1.10 | 0.60 | 1030.63 | 225 | 1; 36; 3; 3; 24 |
| TW 3A | 37 | M4 | 0.10 | 0.29 | 37 | 226 | 1; 65; 66; 66; 67 |
| TW Hya | 60 | M2 | 0.40 | 1.00 | 7373.0 | 266 | 1; 39; 7; 7; 68 |
| V1094 Sco | 155 | K6 | 1.15 | 0.86 | 1807.0 | 225 | 1; 22; 23; 23; 24 |
| V4046 Sgr | 71 | K5 | 0.70 | 1.10 | 41542 | 267 | 1; 39; 7; 7; 11 |
Note. — Column 1: Star+disk system from the literature sample (Section 2.4). Columns 2 and 3: Estimated distance and spectral type, respectively. Columns 4 and 5: Stellar luminosity and central stellar mass, respectively. For known multi-star systems, the total central stellar luminosity and mass are reported, while the spectral type is reported for the primary star. Where able, the stellar luminosities and stellar masses are taken from references that have calculated or updated values using parallaxes from recent studies (e.g., Gaia; column 2). Dynamical stellar masses are used when known in the literature; otherwise, stellar masses were estimated in the literature using stellar evolutionary models. Values for which no error is given in the literature are marked with a ‘’. Columns 5 and 6: Millimeter-wavelength continuum flux and corresponding continuum frequency, respectively. Column 7: Reference numbers for the distance, spectral type, stellar luminosity, stellar mass, and mm continuum flux, in that order. References: (1) Gaia Collaboration et al. (2016, 2018); (2) Herbig (1977); (3) van der Marel et al. (2019); (4) Simon et al. (2019); (5) Öberg et al. (2010); (6) Wenger et al. (2000); (7) Dong et al. (2018); (8) Czekala et al. (2015); (9) Luhman & Mamajek (2012); (10) Andrews et al. (2018b); (11) Öberg et al. (2011); (12) Herbig & Bell (1988); (13) Herczeg & Hillenbrand (2014); (14) Long et al. (2018); (15) Pegues et al. (2020); (16) Spezzi et al. (2008); (17) value from Spezzi et al. (2008), scaled to distance in column 2; (18) Villenave et al. (2021); (19) Pecaut & Mamajek (2013); (20) Akeson et al. (2019); (21) Andrews et al. (2013); (22) Alcalá et al. (2014, 2017); (23) Sanchis et al. (2020); (24) Ansdell et al. (2018); (25) Pegues et al. (2021b); (26) Pegues et al. (2021a); (27) Vieira et al. (2003); (28) van der Plas et al. (2019); (29) The & Molster (1994); (30) Miley et al. (2019); (31) Fairlamb et al. (2015); (32) Murphy & Paunzen (2017); (33) Fedele et al. (2017); (34) Galli et al. (2021); (35) Spezzi et al. (2013); (36) Alcalá et al. (2017); (37) Manara et al. (2017); (38) Hendler et al. (2020); (39) van der Marel et al. (2016); (40) assumed based on stellar mass; (41) Ansdell et al. (2017); (42) Alcalá et al. (2019); (43) Barenfeld et al. (2016); (44) Pegues et al. (2020) via methodology of Andrews et al. (2018b); (45) Bailer-Jones et al. (2021); (46) Fang et al. (2013) at a distance of 450 pc; (47) Grant et al. (2021); (48) Hernández et al. (2008, 2009); (49) Kim et al. (2016) at a distance of 414 pc; (50) Fang et al. (2009); (51) Fang et al. (2009) at a distance of 450 pc; (52) Hsu et al. (2012); (53) Kounkel et al. (2017); (54) Hernández et al. (2008); (55) Allen (1995); Fang et al. (2009); Hsu et al. (2012); (56) Fang et al. (2009); Hsu et al. (2012); (57) Fang et al. (2013); (58) based on Allen & Davis (2008); Hsu et al. (2012); (59) Allen & Davis (2008); (60) Andrews et al. (2018b); (61) Facchini et al. (2021); (62) used in Akeson et al. (2019), based on Gaia (e.g., Gaia Collaboration et al., 2016, 2018); (63) Andrews et al. (2018a); (64) Alcalá et al. (2014); (65) Kellogg et al. (2017); (66) scaled from value in Kellogg et al. (2017) by Czekala et al. (2021); (67) Czekala et al. (2021); (68) Kastner et al. (2015).
A.2 Molecular Line Fluxes for the Literature Sample.
Tables 7 through 16 list molecular line fluxes and upper limits for the ten target molecular lines (Table 3) observed from the literature disk sample (Section 2.4), in alphabetical order by molecular line. The fluxes here are written exactly as they were reported in the literature. They are scaled separately by distance and/or frequency in our figures for consistent comparison.
Please refer to the original references for retrieval of all line fluxes, how the fluxes were measured, and discussion of the star+disk systems.
| Star+Disk | 12CO 2–1 Flux | Reference |
|---|---|---|
| System | (mJy km s-1) | |
| AA Tau | 8200160 (S) | Öberg et al. (2010) |
| AK Sco | 221010 (A) | Czekala et al. (2015) |
| AS 205 | 19230270 (A) | Salyk et al. (2014) |
| AS 209 | 779045 (A) | Öberg et al. (2021a) |
| CM Cha | 67040 (A) | Villenave et al. (2021) |
| CQ Tau | 3100180 (S) | Öberg et al. (2010) |
| DM Tau | 14870120 (S) | Öberg et al. (2010) |
| FP Tau | 78111 (A) | Pegues et al. (2021a) |
| GM Aur | 1984474 (A) | Öberg et al. (2021a) |
| HD 100453 | 234060 (A) | van der Plas et al. (2019) |
| HD 142527 | 17400 (A) | Perez et al. (2015) |
| HD 163296 | 45246102 (A) | Öberg et al. (2021a) |
| HD 169142 | 140002000 (A) | Fedele et al. (2017) |
| Hn 24 A | 35040 (A) | Villenave et al. (2021) |
| IM Lup | 2234294 (A) | Öberg et al. (2021a) |
| J0432+1827 | 184713 (A) | Pegues et al. (2021a) |
| J1100-7619 | 13066 (A) | Pegues et al. (2021a) |
| J1545-3417 | 73810 (A) | Pegues et al. (2021a) |
| J1609-1908 | 86021 (A) | Anderson et al. (2019) |
| LkCa 15 | 13940150 (S) | Öberg et al. (2010) |
| Lynds 1641 ID 1001 | 83050 (A) | Grant et al. (2021) |
| Lynds 1641 ID 1006 | 18030 (A) | Grant et al. (2021) |
| Lynds 1641 ID 1007 | 28030 (A) | Grant et al. (2021) |
| Lynds 1641 ID 1039 | 93040 (A) | Grant et al. (2021) |
| Lynds 1641 ID 1086 | 26030 (A) | Grant et al. (2021) |
| Lynds 1641 ID 269 | 61030 (A) | Grant et al. (2021) |
| Lynds 1641 ID 307 | 37040 (A) | Grant et al. (2021) |
| Lynds 1641 ID 378 | 293040 (A) | Grant et al. (2021) |
| Lynds 1641 ID 399 | 132060 (A) | Grant et al. (2021) |
| Lynds 1641 ID 402 | 52040 (A) | Grant et al. (2021) |
| Lynds 1641 ID 429 | 60040 (A) | Grant et al. (2021) |
| Lynds 1641 ID 477 | 26030 (A) | Grant et al. (2021) |
| Lynds 1641 ID 483 | 18020 (A) | Grant et al. (2021) |
| Lynds 1641 ID 487 | 200200 (A) | Grant et al. (2021) |
| Lynds 1641 ID 525 | 67040 (A) | Grant et al. (2021) |
| Lynds 1641 ID 556 | 29030 (A) | Grant et al. (2021) |
| Lynds 1641 ID 633 | 23020 (A) | Grant et al. (2021) |
| Lynds 1641 ID 761 | 101040 (A) | Grant et al. (2021) |
| Lynds 1641 ID 762 | 157030 (A) | Grant et al. (2021) |
| Lynds 1641 ID 848 | 45040 (A) | Grant et al. (2021) |
| Lynds 1641 ID 971 | 41040 (A) | Grant et al. (2021) |
| MWC 480 | 2322663 (A) | Öberg et al. (2021a) |
| PDS 70 | 610926 (A) | Facchini et al. (2021) |
| RU Lup | 20000 (A) | Huang et al. (2020a) |
| RW Aur A | 342030 (A) | Rodriguez et al. (2018) |
| RW Aur B | 86030 (A) | Rodriguez et al. (2018) |
| SAO 206462 | 10390210 (S) | Öberg et al. (2011) |
| Sz 46 | 12010 (A) | Villenave et al. (2021) |
| Sz 49 | 61040 (A) | Villenave et al. (2021) |
| Sz 53 | 84060 (A) | Villenave et al. (2021) |
| Sz 58 | 4010240 (A) | Villenave et al. (2021) |
| Sz 61 | 131080 (A) | Villenave et al. (2021) |
| Sz 63 | 104070 (A) | Villenave et al. (2021) |
| Sz 69 | 200115 (A) | Pegues et al. (2021a) |
| Sz 91 | 493223 (A) | Canovas et al. (2016) |
| TW 3A | 526 (A) | Czekala et al. (2021) |
| TW Hya | 17800267 (A) | Calahan et al. (2021) |
| V4046 Sgr | 29300540 (A) | Kastner et al. (2018) |
Note. — Columns 1 and 2: 12CO 2–1 line fluxes for sources from the literature sample (Section 2.4). 3 upper limits are marked with . Fluxes from ALMA, the SMA, and the IRAM PdBI are marked with (A), (S), and (I), respectively. When fluxes from multiple instruments are available, we select the flux from the instrument with the highest spatial resolution to decrease the chance of contamination from external sources of emission. Column 3: Reference.
| Star+Disk | 13CO 2–1 Flux | Reference |
|---|---|---|
| System | (mJy km s-1) | |
| AK Sco | 54010 (A) | Czekala et al. (2015) |
| AS 205 | 186040 (A) | Salyk et al. (2014) |
| AS 209 | 226938 (A) | Öberg et al. (2021a) |
| CX Tau | 400 (I) | Piétu et al. (2014) |
| DE Tau | 400 (I) | Piétu et al. (2014) |
| DS Tau | 500 (I) | Piétu et al. (2014) |
| EX Lup | 760200 (A) | Ansdell et al. (2018) |
| FP Tau | 2328 (A) | Pegues et al. (2021a) |
| GM Aur | 502848 (A) | Öberg et al. (2021a) |
| HD 100453 | 90030 (A) | van der Plas et al. (2019) |
| HD 100546 | 12872 (A) | Miley et al. (2019) |
| HD 142527 | 11400 (A) | Perez et al. (2015) |
| HD 163296 | 1588580 (A) | Öberg et al. (2021a) |
| HD 169142 | 7600600 (A) | Fedele et al. (2017) |
| IM Lup | 837083 (A) | Öberg et al. (2021a) |
| J0432+1827 | 5379 (A) | Pegues et al. (2021a) |
| J1100-7619 | 4176 (A) | Pegues et al. (2021a) |
| J1545-3417 | 2188 (A) | Pegues et al. (2021a) |
| J15560210-3655282 | 450100 (A) | Ansdell et al. (2018) |
| J16000236-4222145 | 976325 (A) | Ansdell et al. (2018) |
| J16070384-3911113 | 805117 (A) | Ansdell et al. (2018) |
| J1609-1908 | 11826 (A) | Bergner et al. (2020) |
| J16090141-3925119 | 64279 (A) | Ansdell et al. (2018) |
| J16102955-3922144 | 13738 (A) | Ansdell et al. (2018) |
| J1612-1859 | 10320 (A) | Bergner et al. (2020) |
| J1614-1906 | 7522 (A) | Bergner et al. (2020) |
| Lynds 1641 ID 1039 | 19020 (A) | Grant et al. (2021) |
| Lynds 1641 ID 269 | 9020 (A) | Grant et al. (2021) |
| Lynds 1641 ID 307 | 21040 (A) | Grant et al. (2021) |
| Lynds 1641 ID 378 | 62040 (A) | Grant et al. (2021) |
| Lynds 1641 ID 399 | 16020 (A) | Grant et al. (2021) |
| Lynds 1641 ID 525 | 26030 (A) | Grant et al. (2021) |
| Lynds 1641 ID 556 | 24030 (A) | Grant et al. (2021) |
| Lynds 1641 ID 762 | 37030 (A) | Grant et al. (2021) |
| Lynds 1641 ID 971 | 20030 (A) | Grant et al. (2021) |
| MWC 480 | 836157 (A) | Öberg et al. (2021a) |
| PDS 70 | 184614 (A) | Facchini et al. (2021) |
| RU Lup | 1200200 (A) | Huang et al. (2020a) |
| RW Aur A | 26030 (A) | Rodriguez et al. (2018) |
| RW Aur B | 10030 (A) | Rodriguez et al. (2018) |
| RY Lup | 2502416 (A) | Ansdell et al. (2018) |
| SU Aur | 1100400 (I) | Piétu et al. (2014) |
| Sz 111 | 2187512 (A) | Ansdell et al. (2018) |
| Sz 118 | 8026 (A) | Ansdell et al. (2018) |
| Sz 133 | 28273 (A) | Ansdell et al. (2018) |
| Sz 63 | 21030 (A) | Villenave et al. (2021) |
| Sz 69 | 34513 (A) | Pegues et al. (2021a) |
| Sz 75 | 1000290 (A) | Ansdell et al. (2018) |
| Sz 76 | 620100 (A) | Ansdell et al. (2018) |
| Sz 82 | 5893166 (A) | Ansdell et al. (2018) |
| Sz 83 | 1076152 (A) | Ansdell et al. (2018) |
| Sz 84 | 48989 (A) | Ansdell et al. (2018) |
| Sz 91 | 1097190 (A) | Ansdell et al. (2018) |
| TW 3A | 86 (A) | Czekala et al. (2021) |
| TW Hya | 2720180 (A) | Qi et al. (2013c) |
| V1094 Sco | 138004300 (A) | Ansdell et al. (2018) |
| V4046 Sgr | 8440450 (A) | Kastner et al. (2018) |
Note. — Column 1: Star+disk system from the literature sample (Section 2.4). Column 2: 13CO 2–1 line fluxes for protoplanetary disks from the literature sample (Section 2.4). 3 upper limits are marked with . Fluxes from ALMA, the SMA, and the IRAM PdBI are marked with (A), (S), and (I), respectively. When fluxes from multiple instruments are available, we select the flux from the instrument with the highest spatial resolution to decrease the chance of contamination from external sources of emission. Only detected 13CO 2–1 fluxes are shown from Ansdell et al. (2018). Column 3: Reference.
| Star+Disk | C18O 2–1 Flux | Reference |
|---|---|---|
| System | (mJy km s-1) | |
| AK Sco | 20010 (A) | Czekala et al. (2015) |
| AS 205 | 34030 (A) | Salyk et al. (2014) |
| AS 209 | 53827 (A) | Öberg et al. (2021a) |
| CI Tau | 54917 (A) | Pegues et al. (2020) |
| CW Tau | 200 (I) | Piétu et al. (2014) |
| DM Tau | 99817 (A) | Pegues et al. (2020) |
| DO Tau | 21012 (A) | Pegues et al. (2020) |
| FP Tau | 917 (A) | Pegues et al. (2021a) |
| GM Aur | 109239 (A) | Öberg et al. (2021a) |
| HD 100453 | 39020 (A) | van der Plas et al. (2019) |
| HD 100546 | 2948 (A) | Miley et al. (2019) |
| HD 142527 | 3400 (A) | Perez et al. (2015) |
| HD 143006 | 13510 (A) | Pegues et al. (2020) |
| HD 163296 | 578351 (A) | Öberg et al. (2021a) |
| HD 169142 | 3900500 (A) | Fedele et al. (2017) |
| IM Lup | 159260 (A) | Öberg et al. (2021a) |
| J0432+1827 | 1489 (A) | Pegues et al. (2021a) |
| J1100-7619 | 714 (A) | Pegues et al. (2021a) |
| J1545-3417 | 8910 (A) | Pegues et al. (2021a) |
| J16000236-4222145 | 5215 (A) | Ansdell et al. (2018) |
| J1604-2130 | 12677 (A) | Pegues et al. (2020) |
| J1609-1908 | 4317 (A) | Anderson et al. (2019) |
| LkCa 15 | 61918 (A) | Pegues et al. (2020) |
| Lynds 1641 ID 378 | 15030 (A) | Grant et al. (2021) |
| Lynds 1641 ID 556 | 8020 (A) | Grant et al. (2021) |
| MWC 480 | 301741 (A) | Öberg et al. (2021a) |
| PDS 70 | 4659 (A) | Facchini et al. (2021) |
| RU Lup | 34030 (A) | Huang et al. (2020a) |
| RW Aur A | 9030 (A) | Rodriguez et al. (2018) |
| RW Aur B | 90 (A) | Rodriguez et al. (2018) |
| RY Lup | 76567 (A) | Ansdell et al. (2018) |
| Sz 111 | 58683 (A) | Ansdell et al. (2018) |
| Sz 69 | 387 (A) | Pegues et al. (2021a) |
| Sz 75 | 12030 (A) | Ansdell et al. (2018) |
| Sz 82 | 132563 (A) | Ansdell et al. (2018) |
| Sz 83 | 543111 (A) | Ansdell et al. (2018) |
| TW Hya | 57085 (A) | Calahan et al. (2021) |
| V4046 Sgr | 118418 (A) | Pegues et al. (2020) |
Note. — Column 1: Star+disk system from the literature sample (Section 2.4). Column 2: C18O 2–1 line fluxes for protoplanetary disks from the literature sample (Section 2.4). 3 upper limits are marked with . Fluxes from ALMA, the SMA, and the IRAM PdBI are marked with (A), (S), and (I), respectively. When fluxes from multiple instruments are available, we select the flux from the instrument with the highest spatial resolution to decrease the chance of contamination from external sources of emission. Only detected C18O 2–1 fluxes are shown from Ansdell et al. (2018). Column 3: Reference.
| Star+Disk | C2H 3–2 Flux | Reference |
|---|---|---|
| System | (mJy km s-1) | |
| AS 209 | 2709290 (A) | Bergner et al. (2019) |
| CI Tau | 1041110 (A) | Bergner et al. (2019) |
| DM Tau | 2013200 (A) | Bergner et al. (2019) |
| DO Tau | 62 (A) | Bergner et al. (2019) |
| FP Tau | 14018 (A) | Pegues et al. (2021a) |
| GM Aur | 801141 (A) | Guzmán et al. (2021) |
| HD 143006 | 43556 (A) | Bergner et al. (2019) |
| HD 163296 | 4396440 (A) | Bergner et al. (2019) |
| IM Lup | 1450170 (A) | Bergner et al. (2019) |
| J0432+1827 | 28819 (A) | Pegues et al. (2021a) |
| J1100-7619 | 118017 (A) | Pegues et al. (2021a) |
| J1545-3417 | 6112 (A) | Pegues et al. (2021a) |
| J1604-2130 | 2632270 (A) | Bergner et al. (2019) |
| J16070384-3911113 | 16 (A) | Miotello et al. (2019) |
| J16070854-3914075 | 64755 (A) | Miotello et al. (2019) |
| J1609-1908 | 56370 (A) | Bergner et al. (2019) |
| J16090141-3925119 | 20046 (A) | Miotello et al. (2019) |
| J1612-1859 | 97 (A) | Bergner et al. (2019) |
| J1614-1906 | 100 (A) | Bergner et al. (2019) |
| LkCa 15 | 2435250 (A) | Bergner et al. (2019) |
| MWC 480 | 1846190 (A) | Bergner et al. (2019) |
| MY Lup | 28421 (A) | Miotello et al. (2019) |
| PDS 70 | 193025 (A) | Facchini et al. (2021) |
| Sz 114 | 38332 (A) | Miotello et al. (2019) |
| Sz 129 | 10716 (A) | Miotello et al. (2019) |
| Sz 68 | 5 (A) | Miotello et al. (2019) |
| Sz 69 | 288 (A) | Pegues et al. (2021a) |
| Sz 71 | 110146 (A) | Miotello et al. (2019) |
| Sz 98 | 110157 (A) | Miotello et al. (2019) |
| TW Hya | 699060 (S) | Kastner et al. (2015) |
| V4046 Sgr | 2962300 (A) | Bergner et al. (2019) |
Note. — Column 1: Star+disk system from the literature sample (Section 2.4). Column 2: C2H 3–2 line fluxes for protoplanetary disks from the literature sample (Section 2.4). 3 upper limits are marked with . Fluxes from ALMA, the SMA, and the IRAM PdBI are marked with (A), (S), and (I), respectively. When fluxes from multiple instruments are available, we select the flux from the instrument with the highest spatial resolution to decrease the chance of contamination from external sources of emission. Column 3: Reference.
| Star+Disk | CS 5–4 Flux | Reference |
|---|---|---|
| System | (mJy km s-1) | |
| CI Tau | 75617 (A) | Le Gal et al. (2019) |
| DM Tau | 3889 (A) | Le Gal et al. (2019) |
| DO Tau | 1596 (A) | Le Gal et al. (2019) |
| LkCa 15 | 105014 (A) | Le Gal et al. (2019) |
| MWC 480 | 53619 (A) | Le Gal et al. (2019) |
| PDS 70 | 4506 (A) | Facchini et al. (2021) |
Note. — Column 1: Star+disk system from the literature sample (Section 2.4). Column 2: C2H 3–2 line fluxes for protoplanetary disks from the literature sample (Section 2.4). 3 upper limits are marked with . Fluxes from ALMA, the SMA, and the IRAM PdBI are marked with (A), (S), and (I), respectively. When fluxes from multiple instruments are available, we select the flux from the instrument with the highest spatial resolution to decrease the chance of contamination from external sources of emission. Column 3: Reference.
| Star+Disk | DCN 3–2 Flux | Reference |
|---|---|---|
| System | (mJy km s-1) | |
| AA Tau | 270 (S) | Öberg et al. (2010) |
| AS 205 | 270 (S) | Öberg et al. (2011) |
| AS 209 | 34030 (A) | Huang et al. (2017) |
| CI Tau | 2710 (A) | Bergner et al. (2020) |
| CQ Tau | 255 (S) | Öberg et al. (2010) |
| DM Tau | 46 (A) | Bergner et al. (2020) |
| DO Tau | 29 (A) | Bergner et al. (2020) |
| FP Tau | 6 (A) | Pegues et al. (2021a) |
| GM Aur | 376 (A) | Cataldi et al. (2021) |
| HD 142527 | 390 (S) | Öberg et al. (2011) |
| HD 143006 | 8215 (A) | Bergner et al. (2020) |
| HD 163296 | 12020 (A) | Huang et al. (2017) |
| IM Lup | 9013 (A) | Huang et al. (2017) |
| J0432+1827 | 18 (A) | Pegues et al. (2021a) |
| J1100-7619 | 153 (A) | Pegues et al. (2021a) |
| J1545-3417 | 14 (A) | Pegues et al. (2021a) |
| J1604-2130 | 29531 (A) | Bergner et al. (2020) |
| J1609-1908 | 6718 (A) | Bergner et al. (2020) |
| J1612-1859 | 36 (A) | Bergner et al. (2020) |
| J1614-1906 | 51 (A) | Bergner et al. (2020) |
| LkCa 15 | 28030 (A) | Huang et al. (2017) |
| MWC 480 | 7020 (A) | Huang et al. (2017) |
| PDS 70 | 20911 (A) | Facchini et al. (2021) |
| SAO 206462 | 435 (S) | Öberg et al. (2011) |
| Sz 69 | 9 (A) | Pegues et al. (2021a) |
| TW Hya | 64120 (A) | Öberg et al. (2021b) |
| V4046 Sgr | 680210 (A) | Kastner et al. (2018) |
Note. — Column 1: Star+disk system from the literature sample (Section 2.4). Column 2: DCN 3–2 line fluxes for protoplanetary disks from the literature sample (Section 2.4). 3 upper limits are marked with . Fluxes from ALMA, the SMA, and the IRAM PdBI are marked with (A), (S), and (I), respectively. When fluxes from multiple instruments are available, we select the flux from the instrument with the highest spatial resolution to decrease the chance of contamination from external sources of emission. Column 3: Reference.
| Star+Disk | DCO+ 3–2 Flux | Reference |
|---|---|---|
| System | (mJy km s-1) | |
| AA Tau | 270 (S) | Öberg et al. (2010) |
| AS 205 | 300 (S) | Öberg et al. (2011) |
| AS 209 | 48030 (A) | Huang et al. (2017) |
| CQ Tau | 345 (S) | Öberg et al. (2010) |
| DM Tau | 71040 (S) | Öberg et al. (2010) |
| GM Aur | 225 (S) | Öberg et al. (2010) |
| HD 142527 | 405 (S) | Öberg et al. (2011) |
| HD 163296 | 129040 (A) | Huang et al. (2017) |
| HD 169142 | 73073 (A) | Carney et al. (2018) |
| IM Lup | 49020 (A) | Huang et al. (2017) |
| LkCa 15 | 40030 (A) | Huang et al. (2017) |
| MWC 480 | 42030 (A) | Huang et al. (2017) |
| RU Lup | 5416 (A) | Huang et al. (2020a) |
| SAO 206462 | 510 (S) | Öberg et al. (2011) |
| TW Hya | 190419 (A) | Öberg et al. (2021b) |
| V4046 Sgr | 51020 (A) | Kastner et al. (2018) |
Note. — Column 1: Star+disk system from the literature sample (Section 2.4). Column 2: DCO+ 3–2 line fluxes for protoplanetary disks from the literature sample (Section 2.4). 3 upper limits are marked with . Fluxes from ALMA, the SMA, and the IRAM PdBI are marked with (A), (S), and (I), respectively. When fluxes from multiple instruments are available, we select the flux from the instrument with the highest spatial resolution to decrease the chance of contamination from external sources of emission. Column 3: Reference.
| Star+Disk | H2CO 3–2 Flux | Reference |
|---|---|---|
| System | (mJy km s-1) | |
| AA Tau | 16080 (S) | Öberg et al. (2010) |
| AS 205 | 240 (S) | Öberg et al. (2011) |
| AS 209 | 29228 (A) | Guzmán et al. (2021) |
| CI Tau | 42012 (A) | Pegues et al. (2020) |
| CQ Tau | 315 (S) | Öberg et al. (2010) |
| DM Tau | 46217 (A) | Pegues et al. (2020) |
| DO Tau | 8517 (A) | Pegues et al. (2020) |
| FP Tau | 15 (A) | Pegues et al. (2021a) |
| GM Aur | 90057 (A) | Guzmán et al. (2021) |
| HD 142527 | 270110 (S) | Öberg et al. (2011) |
| HD 143006 | 1619 (A) | Pegues et al. (2020) |
| HD 163296 | 81378 (A) | Guzmán et al. (2021) |
| IM Lup | 75272 (A) | Guzmán et al. (2021) |
| J0432+1827 | 808 (A) | Pegues et al. (2021a) |
| J1100-7619 | 1004 (A) | Pegues et al. (2021a) |
| J1545-3417 | 14 (A) | Pegues et al. (2021a) |
| J1604-2130 | 8216 (A) | Pegues et al. (2020) |
| J1609-1908 | 4313 (A) | Pegues et al. (2020) |
| J1612-1859 | 26 (A) | Pegues et al. (2020) |
| J1614-1906 | 30 (A) | Pegues et al. (2020) |
| LkCa 15 | 66224∗ (A) | Pegues et al. (2020) |
| MWC 480 | 14439 (A) | Guzmán et al. (2021) |
| PDS 70 | 7107 (A) | Facchini et al. (2021) |
| SAO 206462 | 450 (S) | Öberg et al. (2011) |
| Sz 69 | 11 (A) | Pegues et al. (2021a) |
| TW Hya | 2834 (A) | Terwisscha van Scheltinga et al. (2021) |
| V4046 Sgr | 121840∗ (A) | Pegues et al. (2020) |
Note. — Column 1: Star+disk system from the literature sample (Section 2.4). Column 2: H2CO 3–2 line fluxes for protoplanetary disks from the literature sample (Section 2.4). 3 upper limits are marked with . Fluxes from ALMA, the SMA, and the IRAM PdBI are marked with (A), (S), and (I), respectively. When fluxes from multiple instruments are available, we select the flux from the instrument with the highest spatial resolution to decrease the chance of contamination from external sources of emission. H2CO 3–2 fluxes that are actually H2CO 4–3 fluxes used as proxies are marked with a ‘∗’. Column 3: Reference.
| Star+Disk | HCN 3–2 Flux | Reference |
|---|---|---|
| System | (mJy km s-1) | |
| AA Tau | 590130 (S) | Öberg et al. (2010) |
| AS 205 | 510 (S) | Öberg et al. (2011) |
| AS 209 | 2965297 (A) | Guzmán et al. (2021) |
| CI Tau | 1271390 (S) | Bergner et al. (2019) |
| CQ Tau | 750 (S) | Öberg et al. (2010) |
| DM Tau | 2966400 (S) | Bergner et al. (2019) |
| DO Tau | 1252 (S) | Bergner et al. (2019) |
| FP Tau | 27217 (A) | Pegues et al. (2021a) |
| GM Aur | 1792180 (A) | Guzmán et al. (2021) |
| HD 142527 | 1155 (S) | Öberg et al. (2011) |
| HD 143006 | 2149220 (A) | Bergner et al. (2020) |
| HD 163296 | 7346736 (A) | Guzmán et al. (2021) |
| IM Lup | 2409242 (A) | Guzmán et al. (2021) |
| J0432+1827 | 60018 (A) | Pegues et al. (2021a) |
| J1100-7619 | 165524 (A) | Pegues et al. (2021a) |
| J1545-3417 | 12014 (A) | Pegues et al. (2021a) |
| J1604-2130 | 8507850 (A) | Bergner et al. (2020) |
| J16085324-3914401 | 16219 (A) | Anderson et al. (2022) |
| J1609-1908 | 1048110 (A) | Bergner et al. (2020) |
| J1612-1859 | 79 (A) | Bergner et al. (2020) |
| J1614-1906 | 13040 (A) | Bergner et al. (2020) |
| LkCa 15 | 3809450 (S) | Bergner et al. (2019) |
| MWC 480 | 2469248 (A) | Guzmán et al. (2021) |
| SAO 206462 | 580150 (S) | Öberg et al. (2011) |
| Sz 118 | 17521 (A) | Anderson et al. (2022) |
| Sz 129 | 44346 (A) | Anderson et al. (2022) |
| Sz 130 | 37 (A) | Anderson et al. (2022) |
| Sz 65 | 32 (A) | Anderson et al. (2022) |
| Sz 68 | 24 (A) | Anderson et al. (2022) |
| Sz 69 | 429 (A) | Pegues et al. (2021a) |
| Sz 90 | 16926 (A) | Anderson et al. (2022) |
| TW Hya | 85001700 (S) | |
| V4046 Sgr | 100001000 (A) | Bergner et al. (2019) |
Note. — Column 1: Star+disk system from the literature sample (Section 2.4). Column 2: HCN 3–2 line fluxes for protoplanetary disks from the literature sample (Section 2.4). 3 upper limits are marked with . Fluxes from ALMA, the SMA, and the IRAM PdBI are marked with (A), (S), and (I), respectively. When fluxes from multiple instruments are available, we select the flux from the instrument with the highest spatial resolution to decrease the chance of contamination from external sources of emission. Column 3: Reference.
: From Qi et al. (2008) as reported in Cleeves et al. (2015).
| Star+Disk | HCO+ 3–2 Flux | Reference |
|---|---|---|
| System | (mJy km s-1) | |
| AA Tau | 2320190 (S) | Öberg et al. (2010) |
| AS 205 | 2500120 (S) | Öberg et al. (2011) |
| AS 209 | 4020160 (S) | Öberg et al. (2011) |
| CQ Tau | 750240 (S) | Öberg et al. (2010) |
| DM Tau | 5340120 (S) | Öberg et al. (2010) |
| GM Aur | 696060 (A) | Huang et al. (2020b) |
| HD 142527 | 7790530 (S) | Öberg et al. (2011) |
| IM Lup | 9670290 (S) | Öberg et al. (2011) |
| J16085324-3914401 | 25426 (A) | Anderson et al. (2022) |
| LkCa 15 | 5190170 (S) | Öberg et al. (2010) |
| MWC 480 | 4650310 (S) | Öberg et al. (2010) |
| SAO 206462 | 1180220 (S) | Öberg et al. (2011) |
| Sz 118 | 37638 (A) | Anderson et al. (2022) |
| Sz 129 | 59561 (A) | Anderson et al. (2022) |
| Sz 130 | 18420 (A) | Anderson et al. (2022) |
| Sz 65 | 21923 (A) | Anderson et al. (2022) |
| Sz 68 | 18320 (A) | Anderson et al. (2022) |
| Sz 90 | 29831 (A) | Anderson et al. (2022) |
| TW Hya | 129002120 (S) | Cleeves et al. (2015) |
| V4046 Sgr | 11430240 (S) | Öberg et al. (2011) |
Note. — Column 1: Star+disk system from the literature sample (Section 2.4). Column 2: HCO+ 3–2 line fluxes for protoplanetary disks from the literature sample (Section 2.4). 3 upper limits are marked with . Fluxes from ALMA, the SMA, and the IRAM PdBI are marked with (A), (S), and (I), respectively. When fluxes from multiple instruments are available, we select the flux from the instrument with the highest spatial resolution to decrease the chance of contamination from external sources of emission. Column 3: Reference.
Appendix B Unbiased Spectra for all SMA Bands
Figure 10 displays the spectral data across all SMA spectral bands for the 230 GHz and 240 GHz SMA receivers.
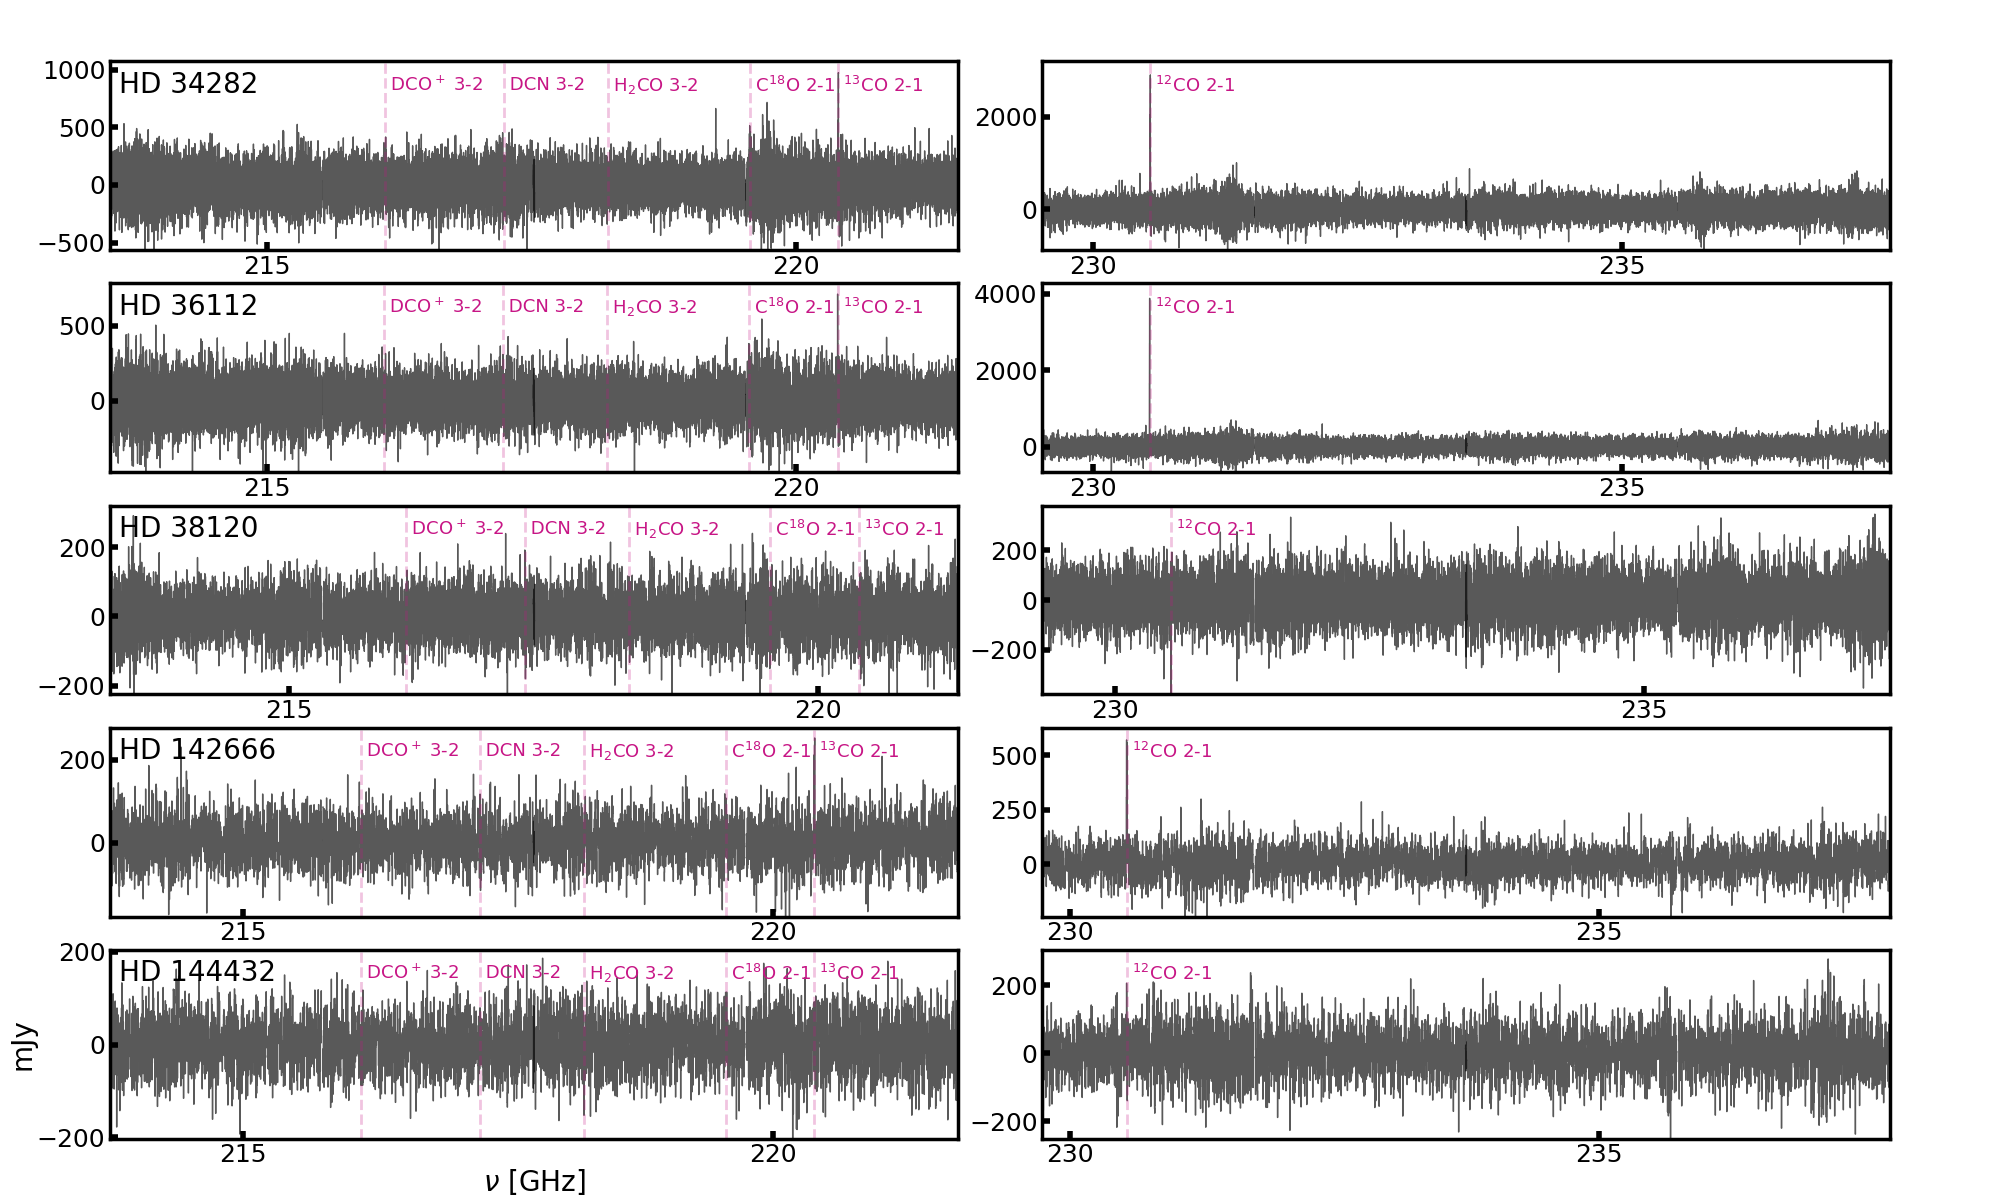
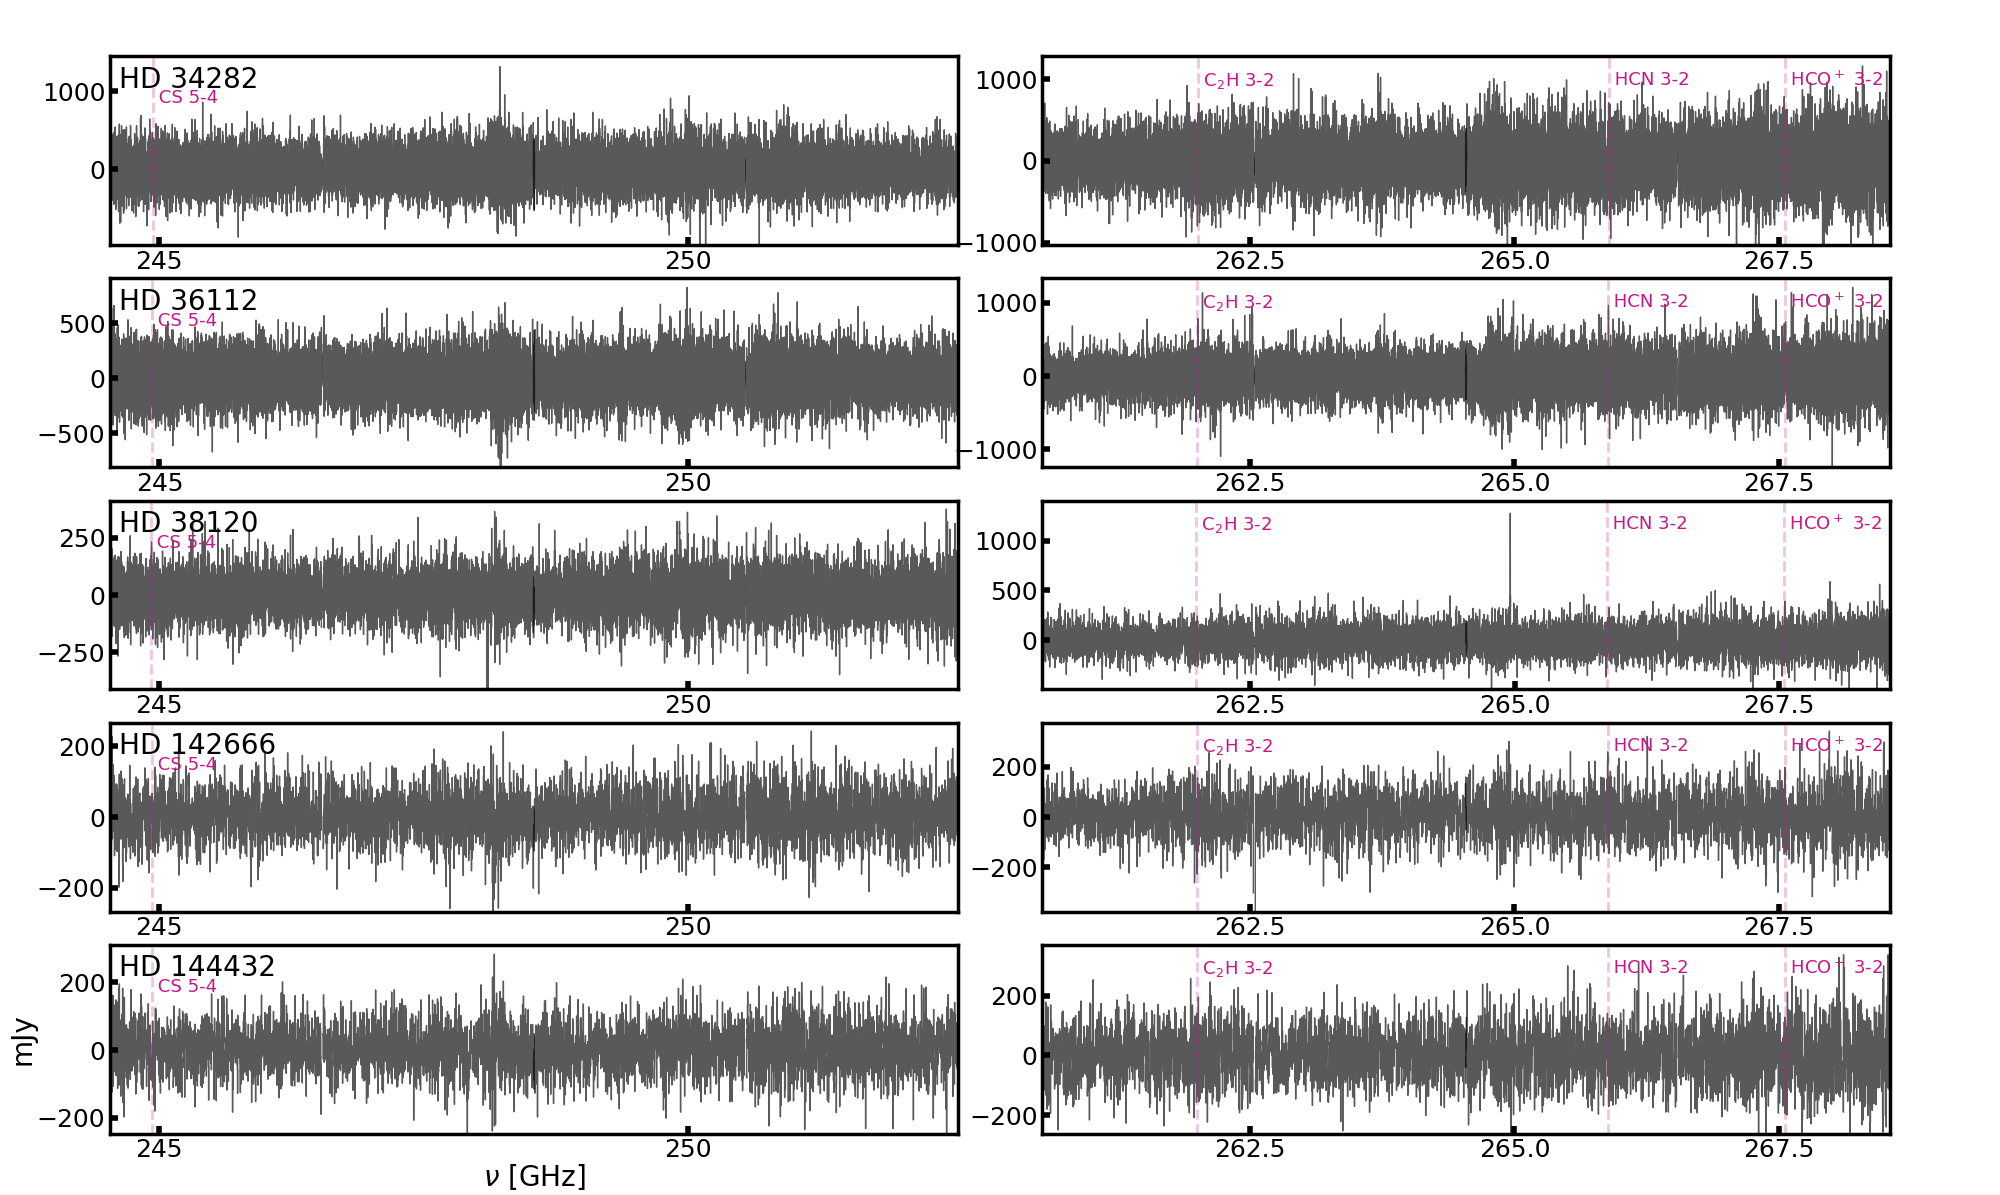
Appendix C Channel Maps
C.1 Channel Maps for HD 34282
Figures 11 and 12 display channel maps for molecular line emission detected or tentatively detected from HD 34282.
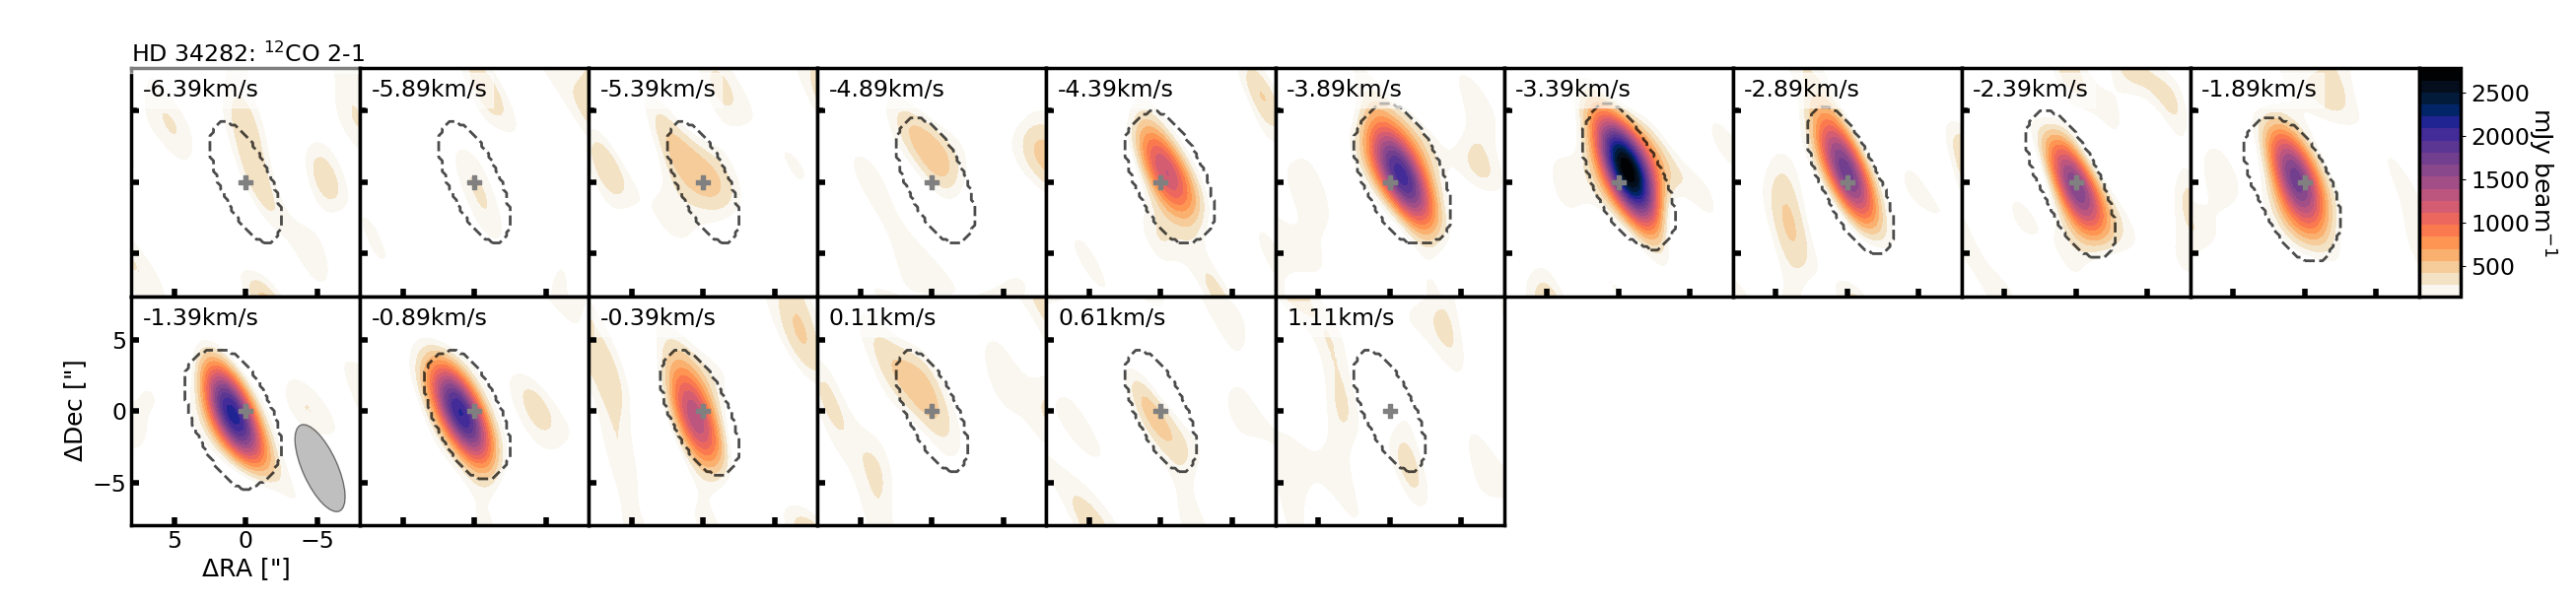
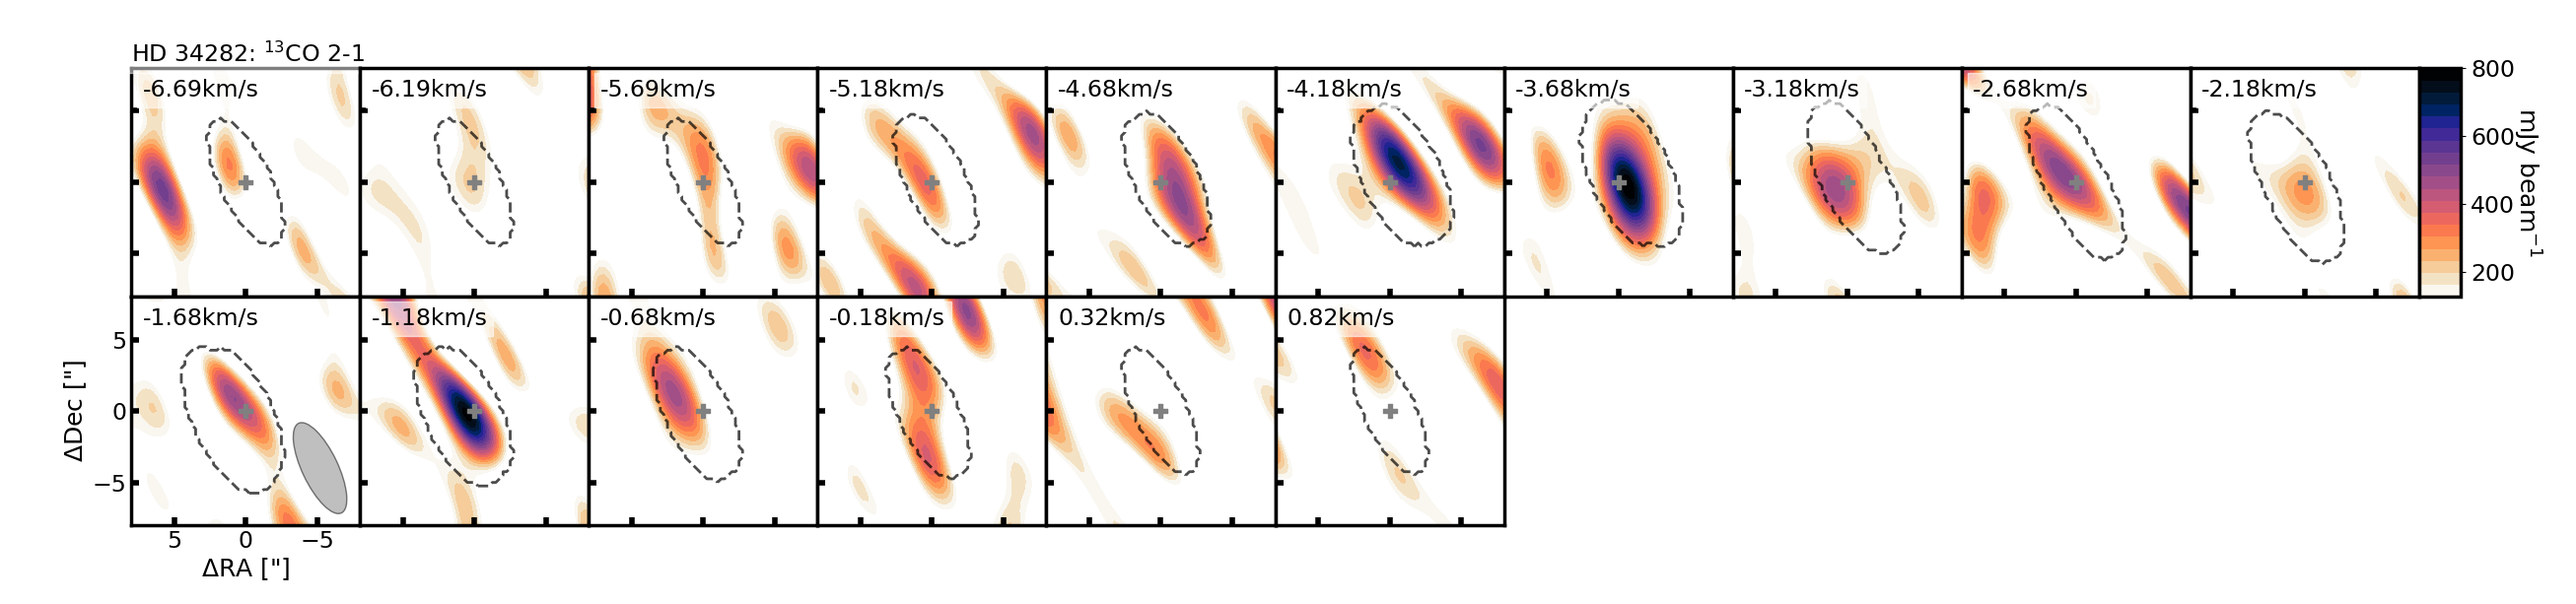
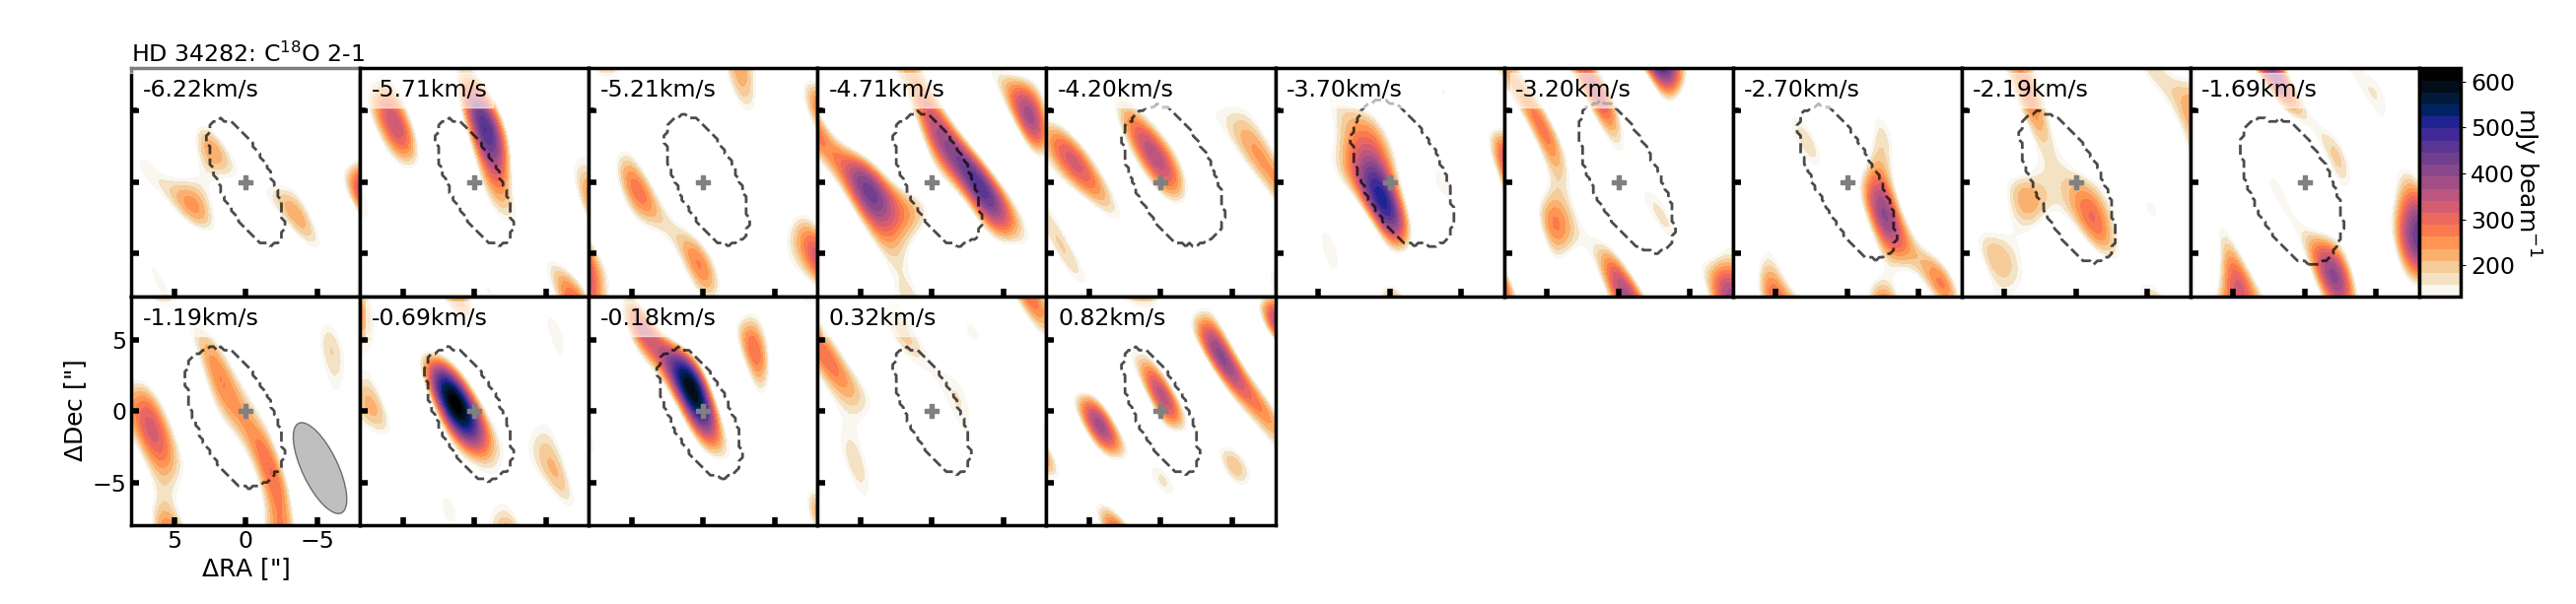
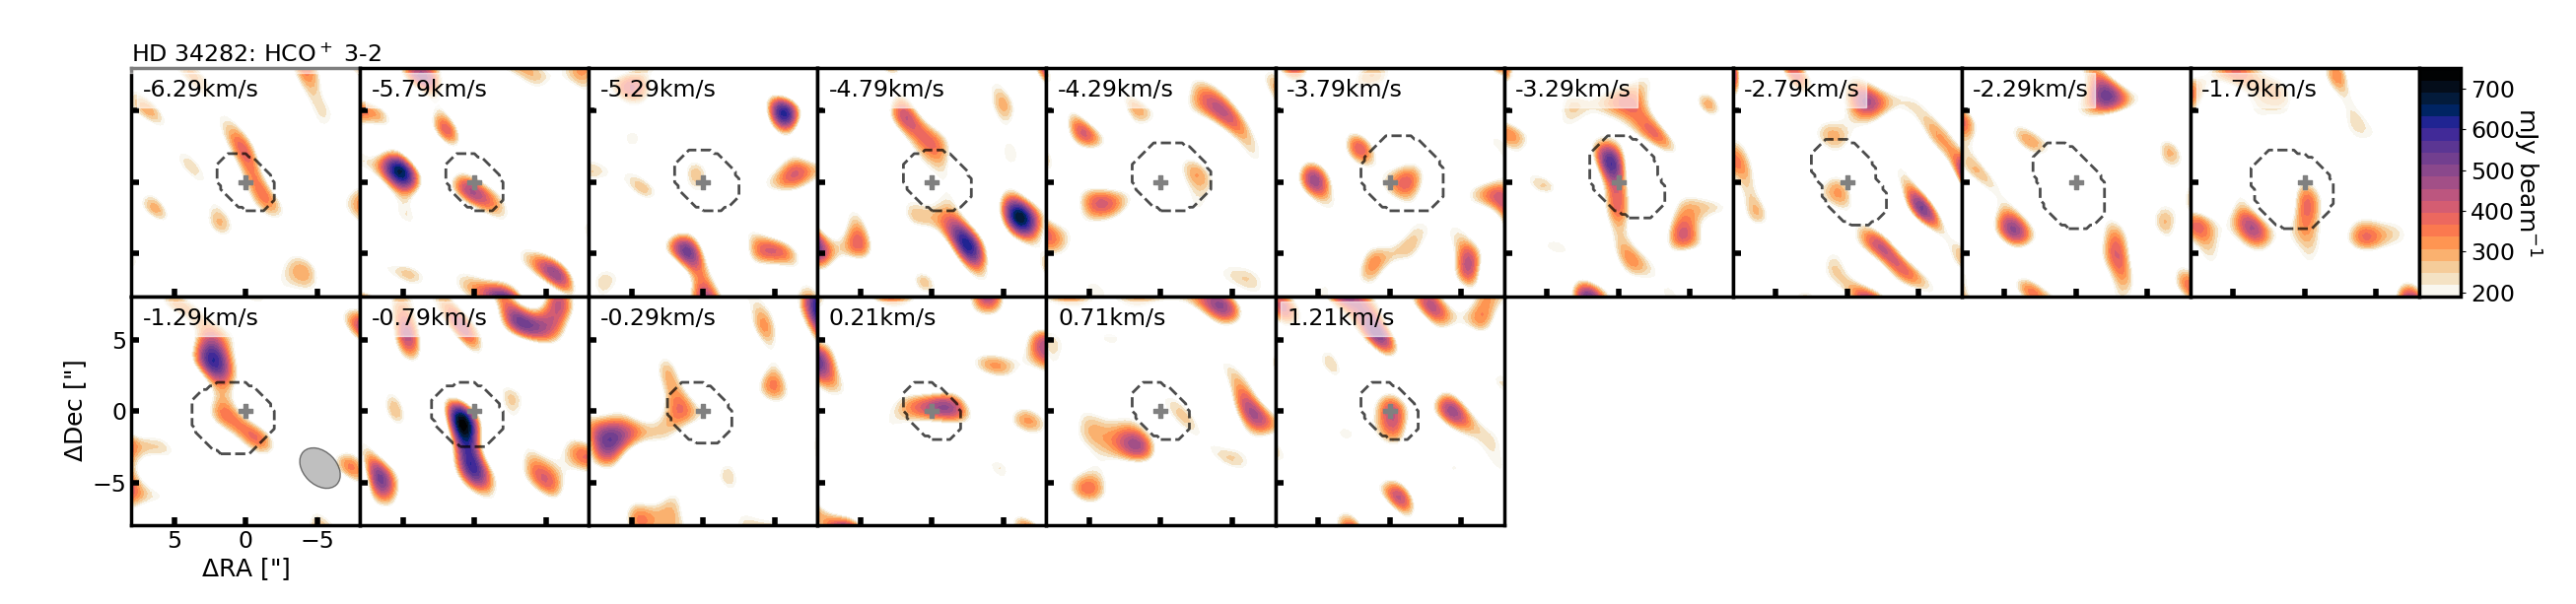
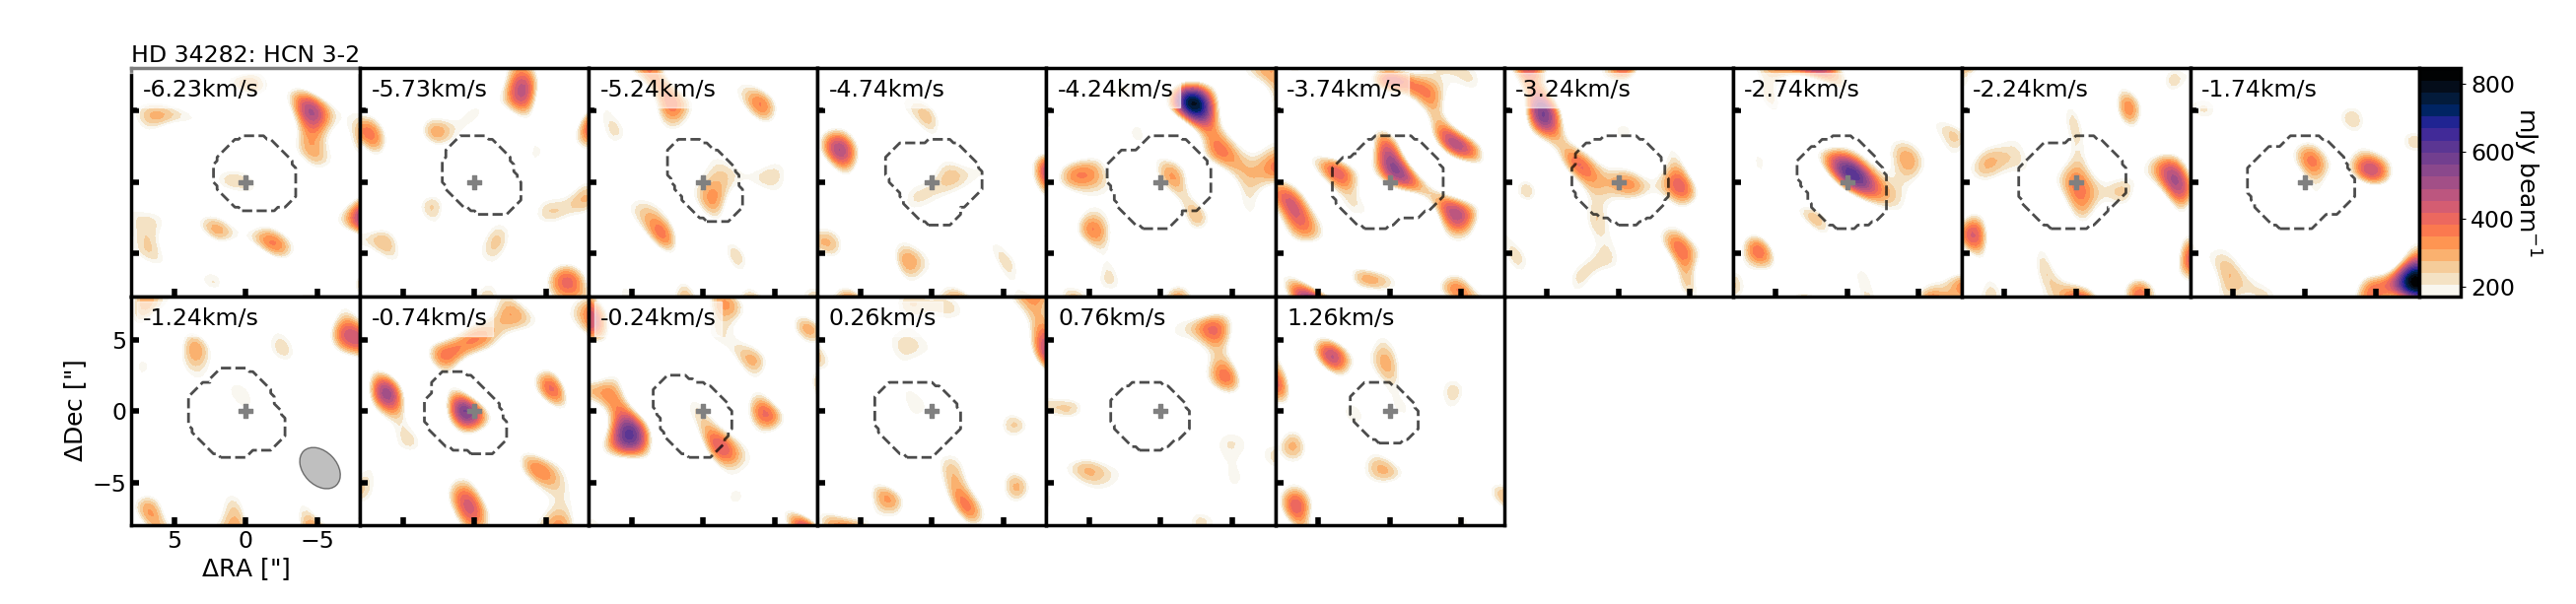
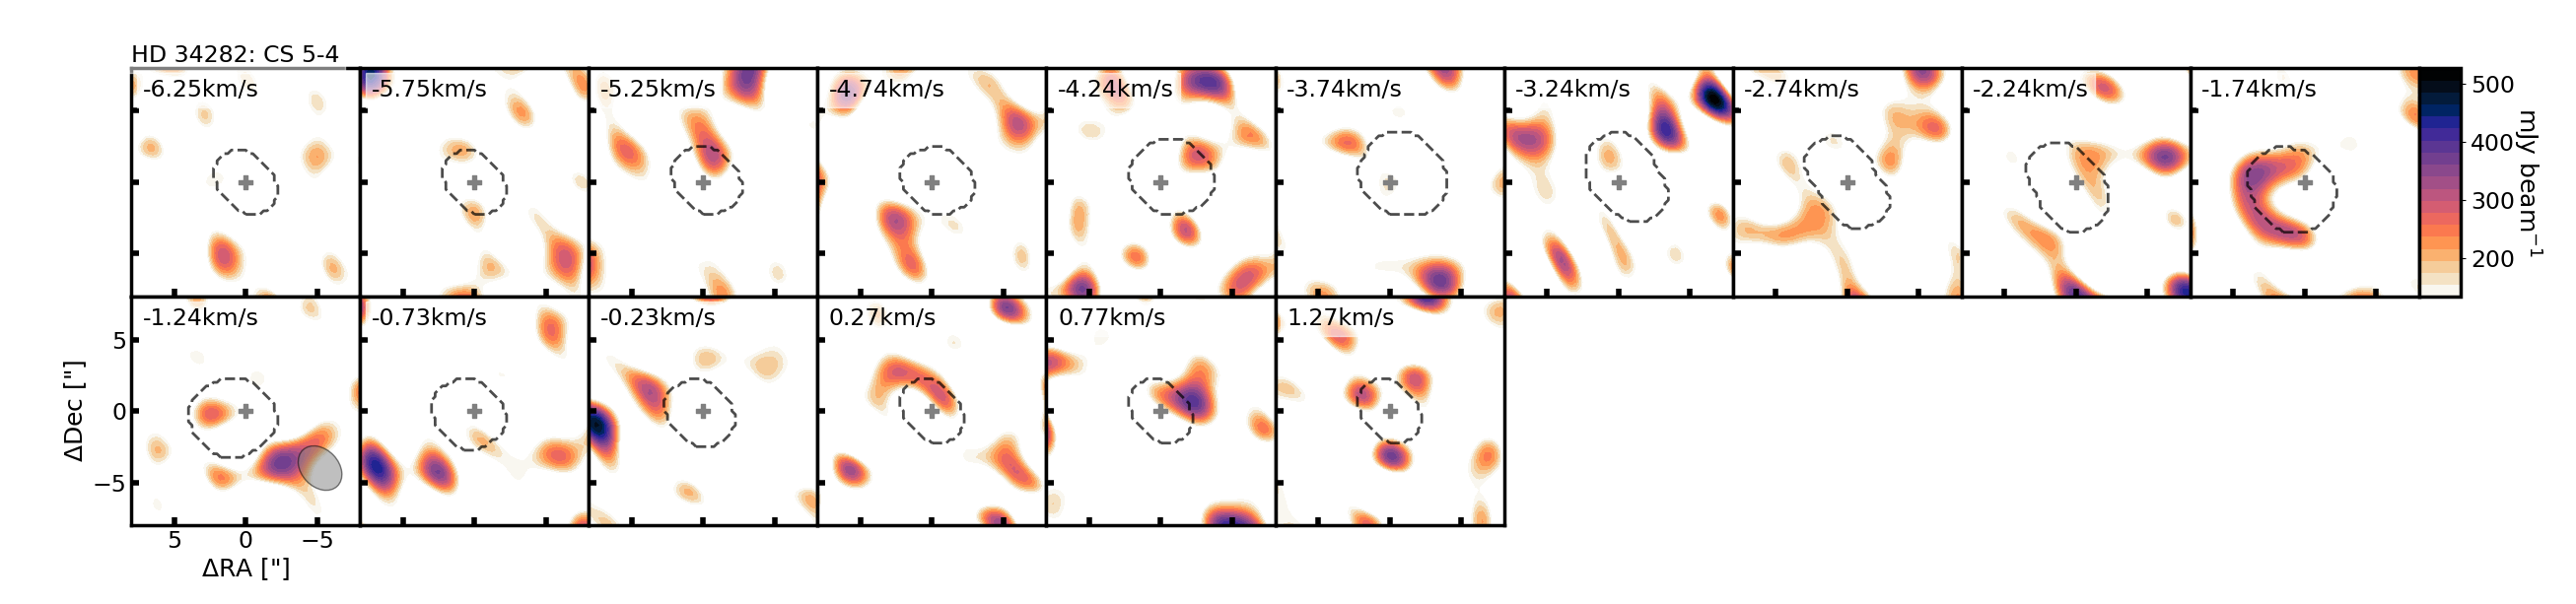
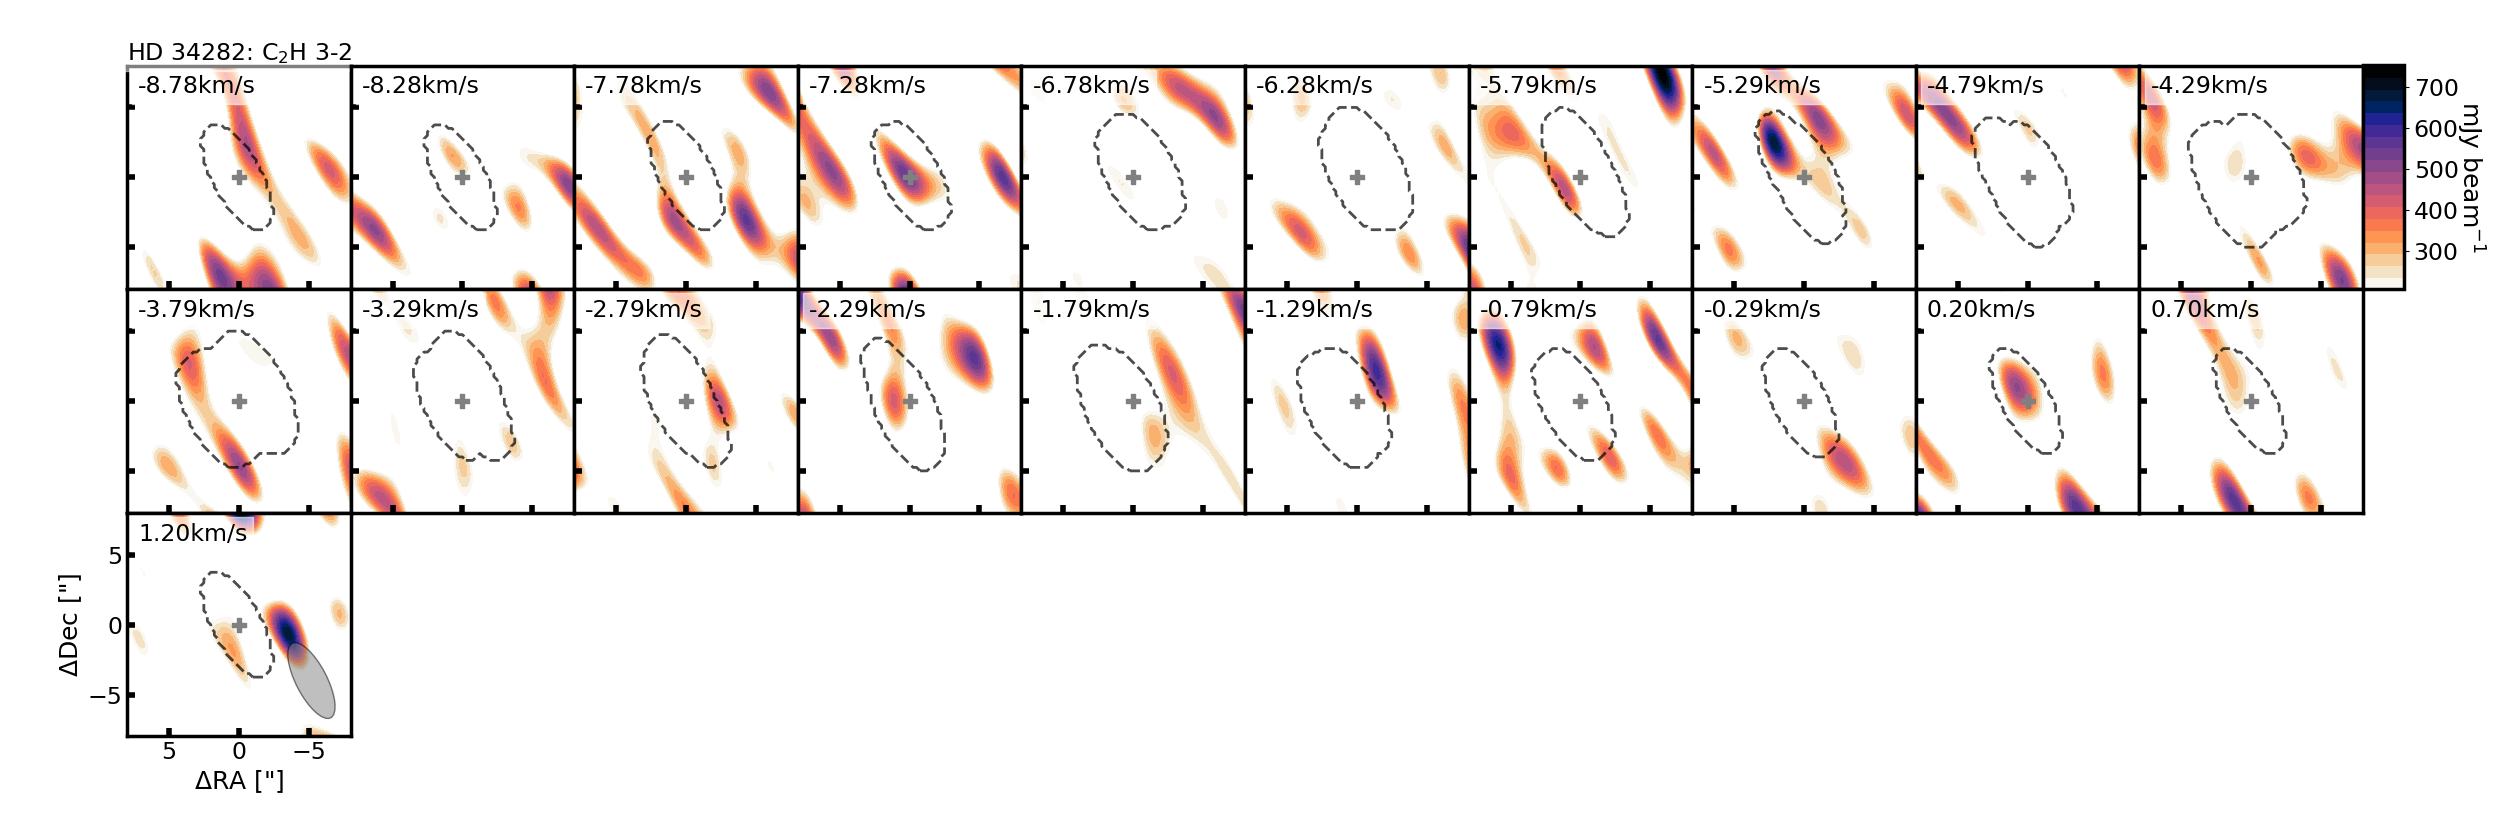
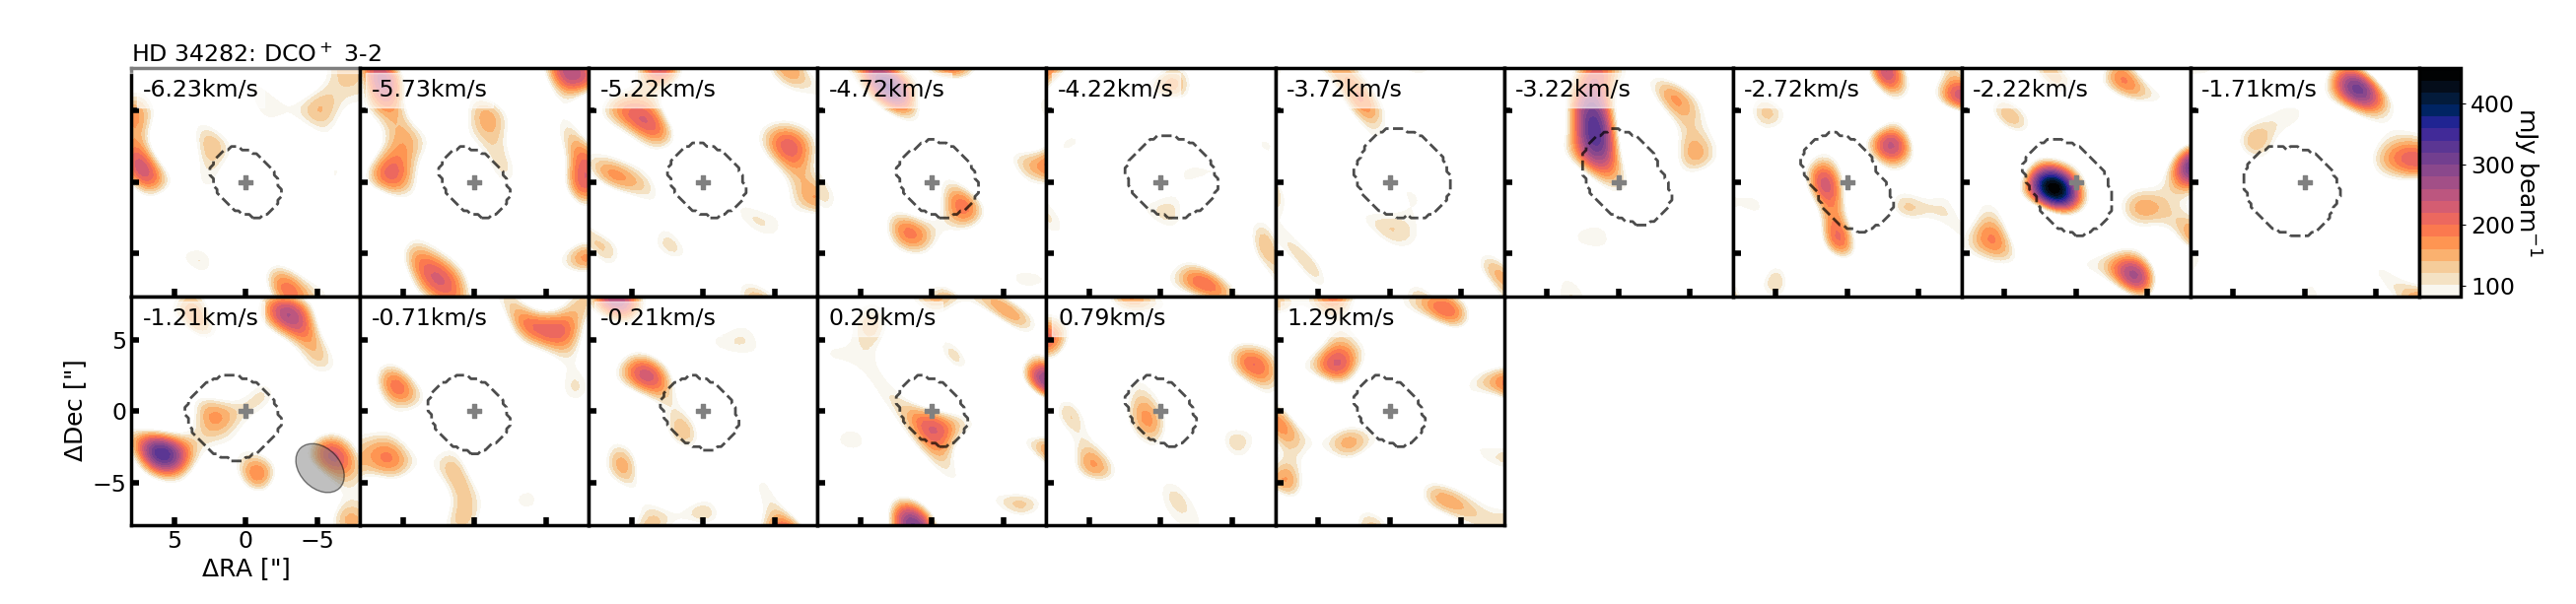
C.2 Channel Maps for HD 36112
Figure 13 displays channel maps for molecular line emission detected or tentatively detected from HD 36112.
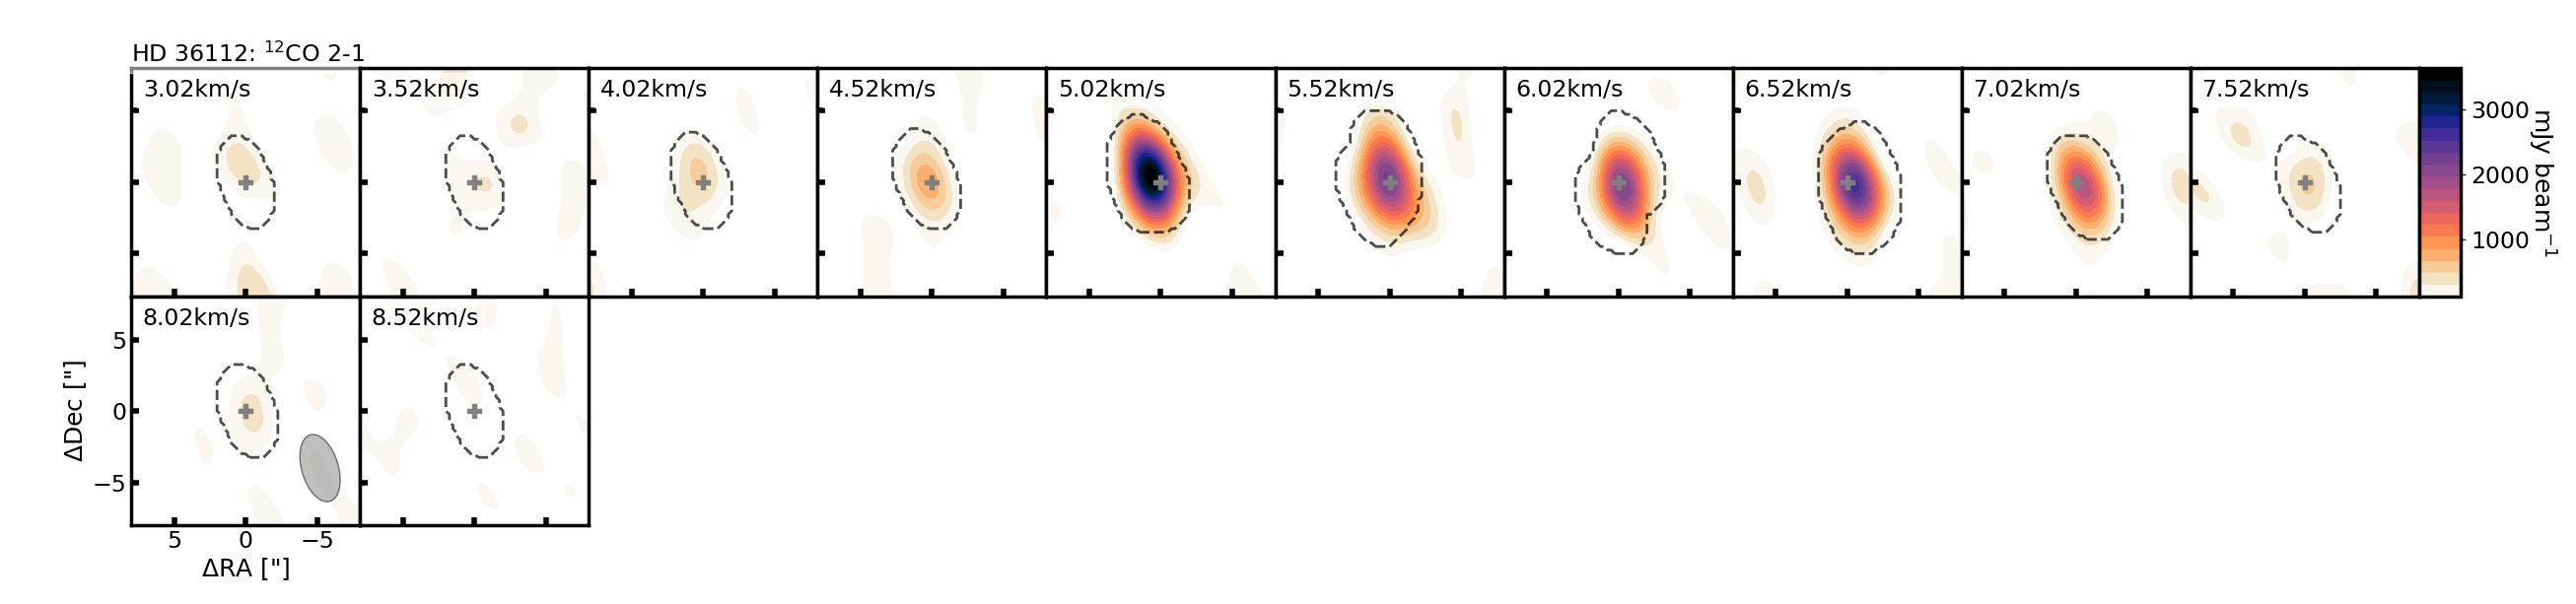
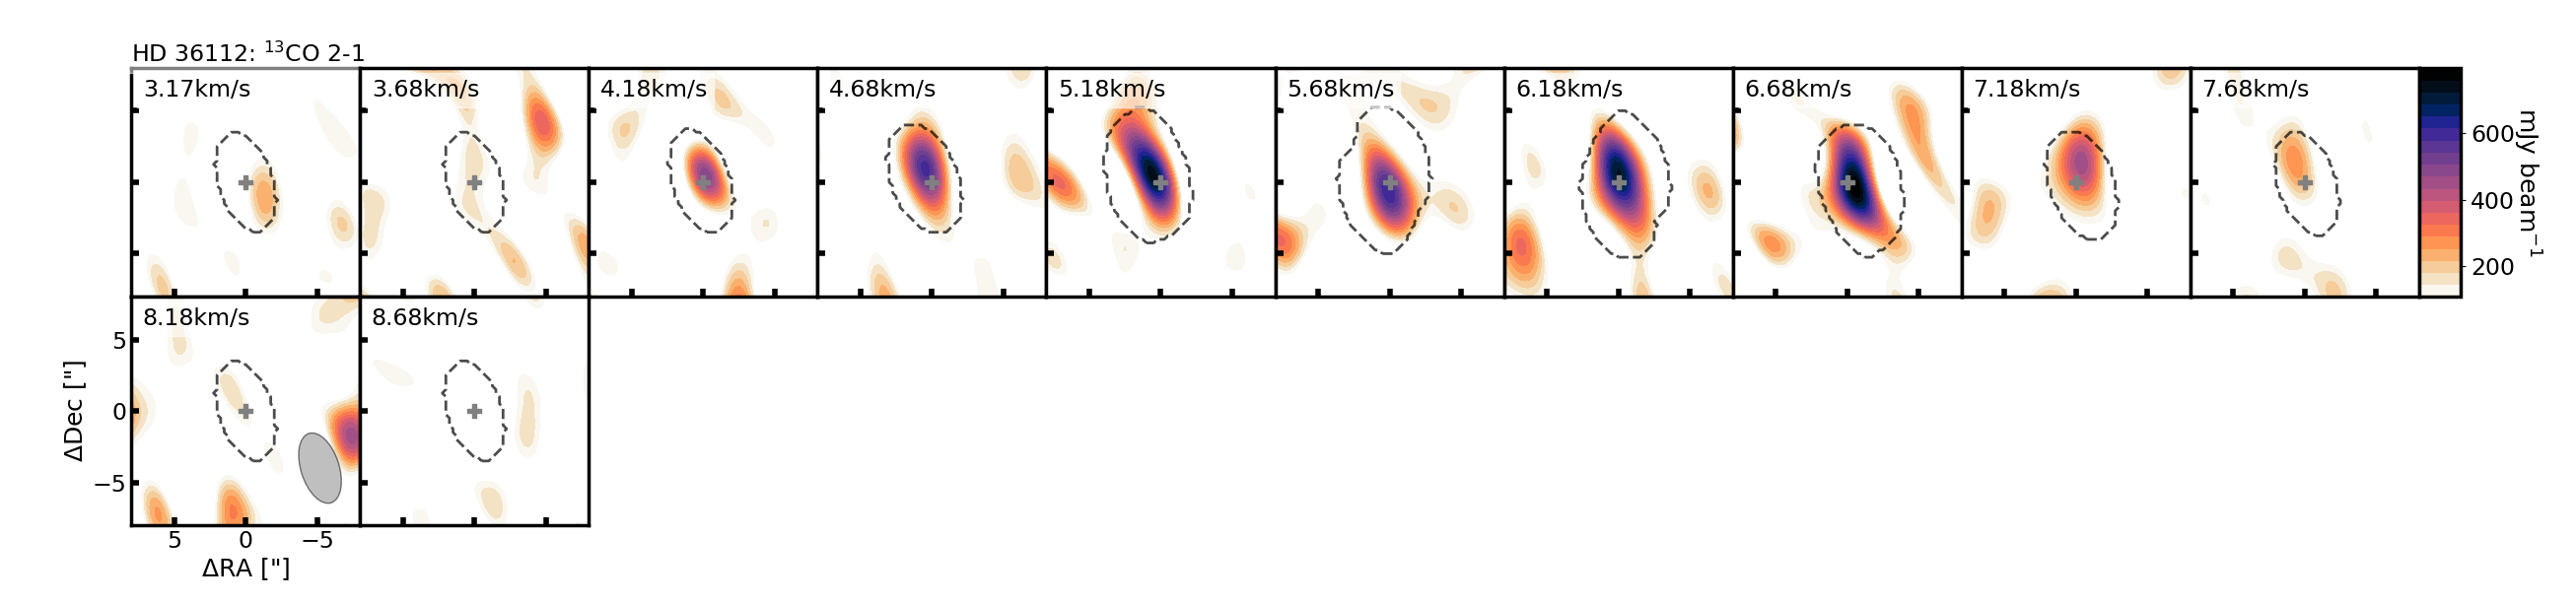
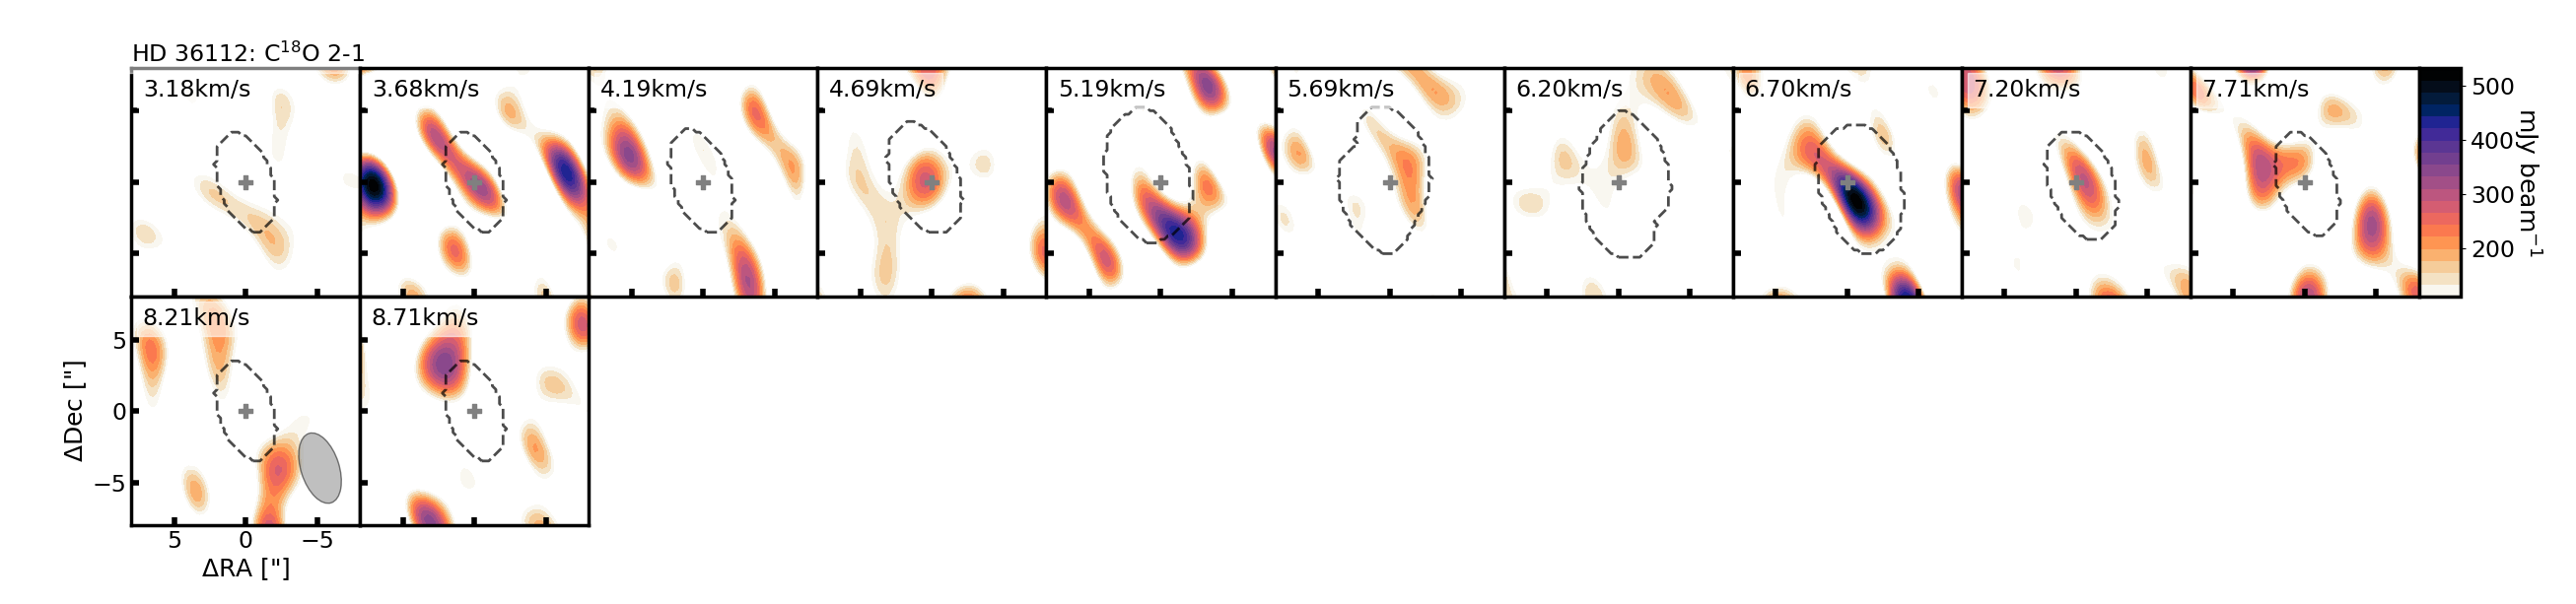
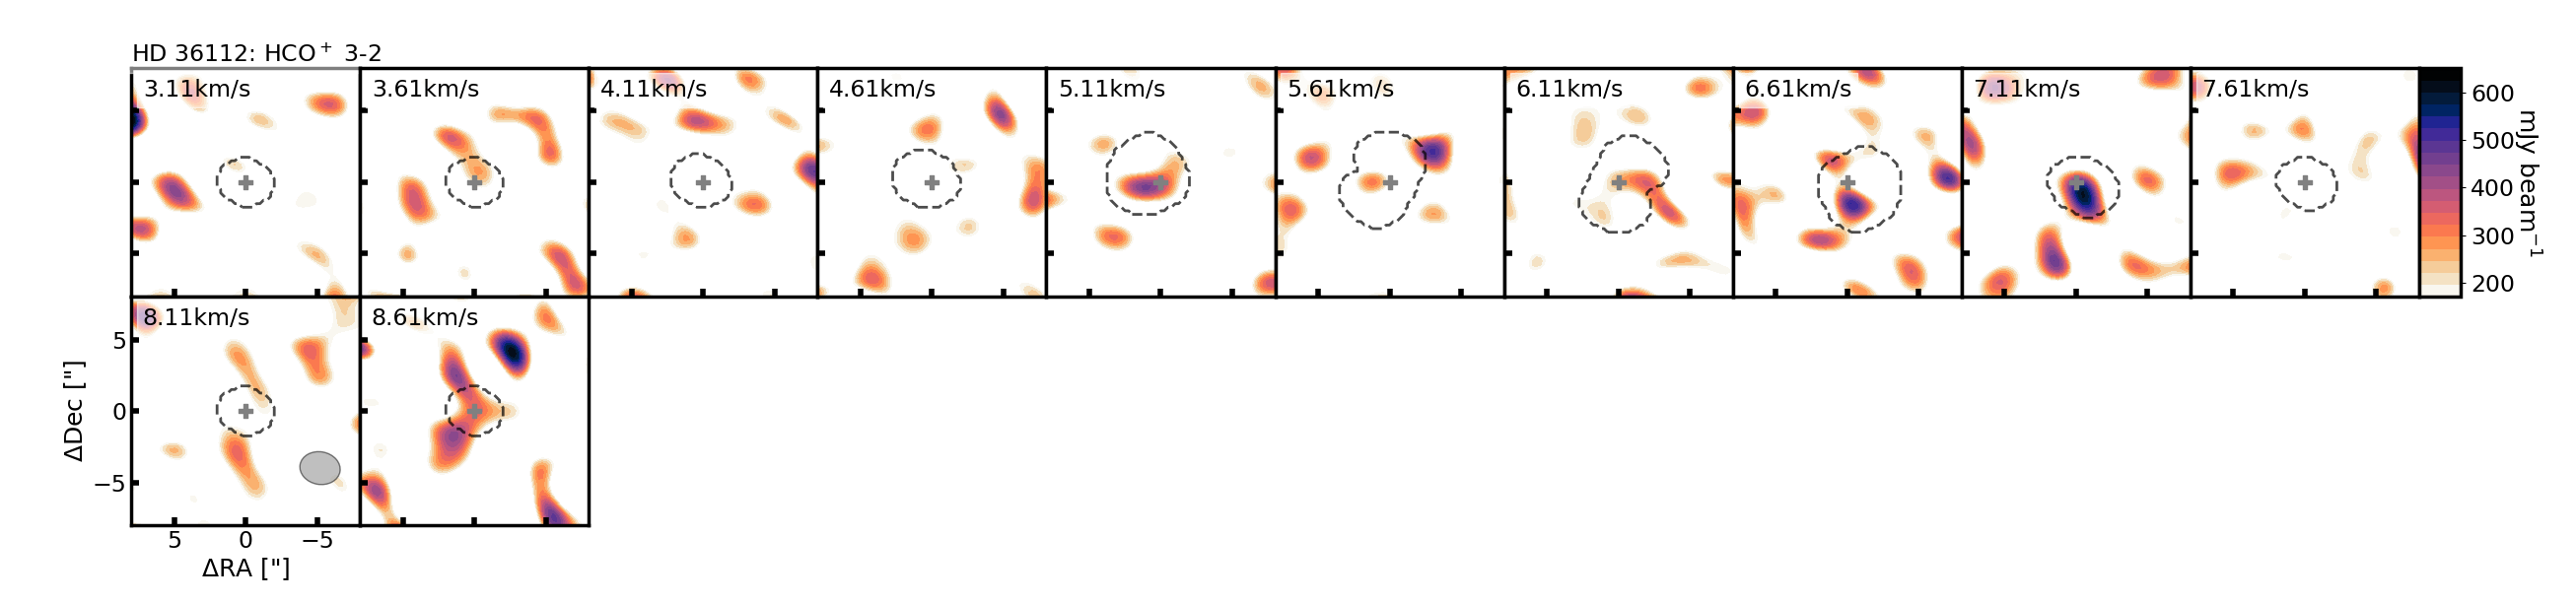
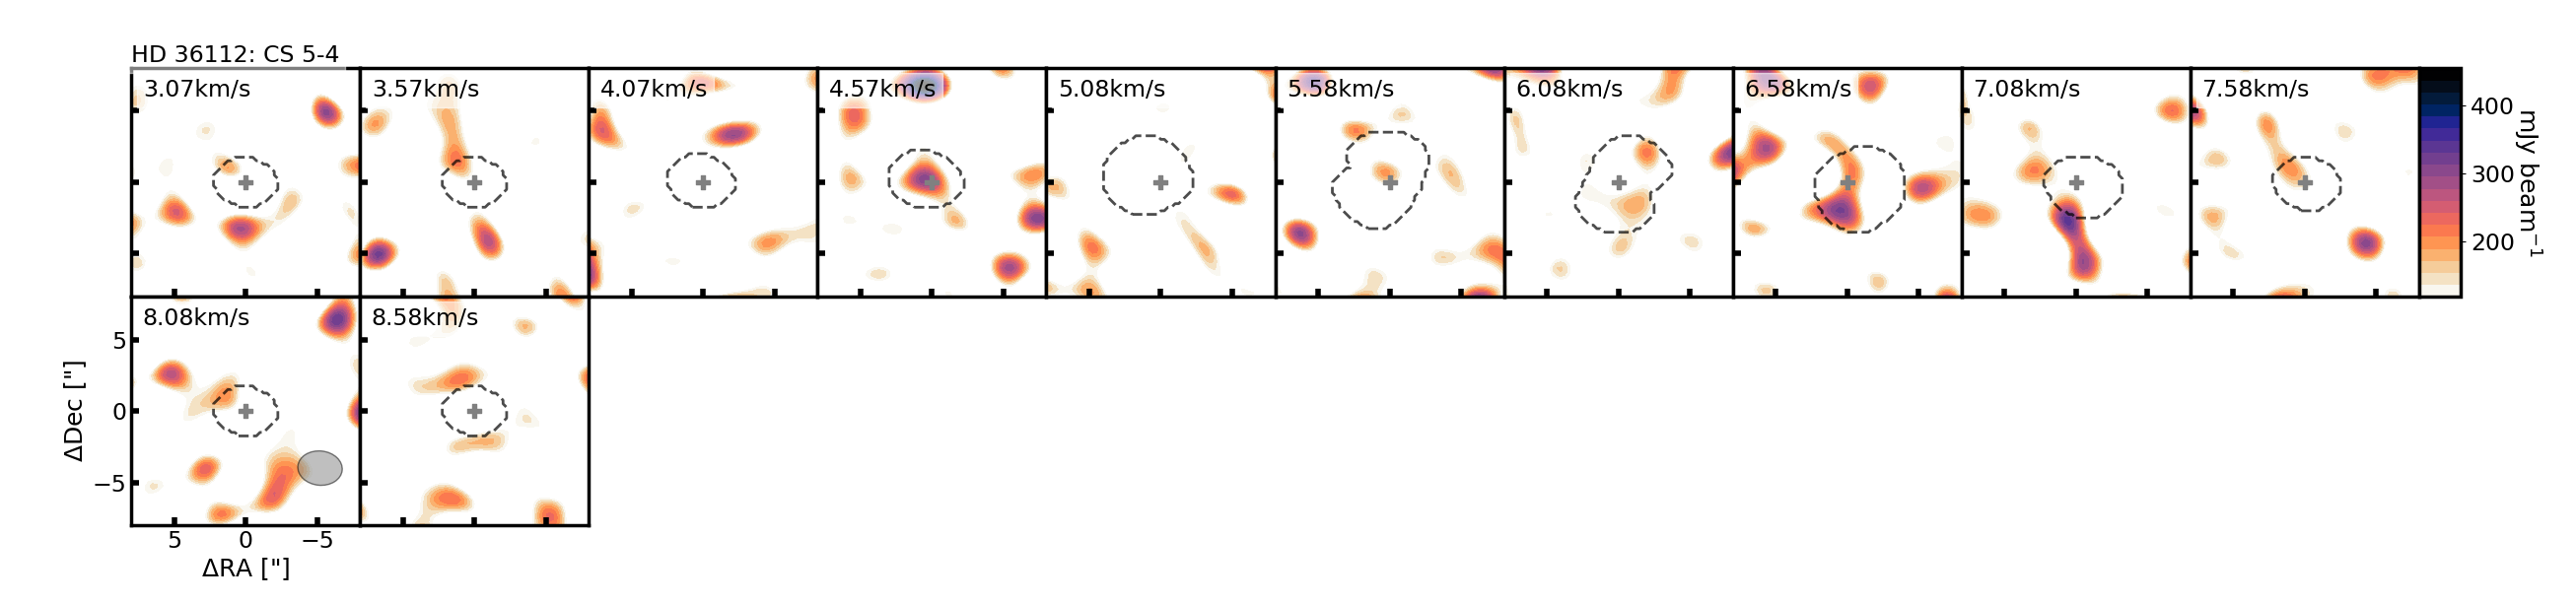
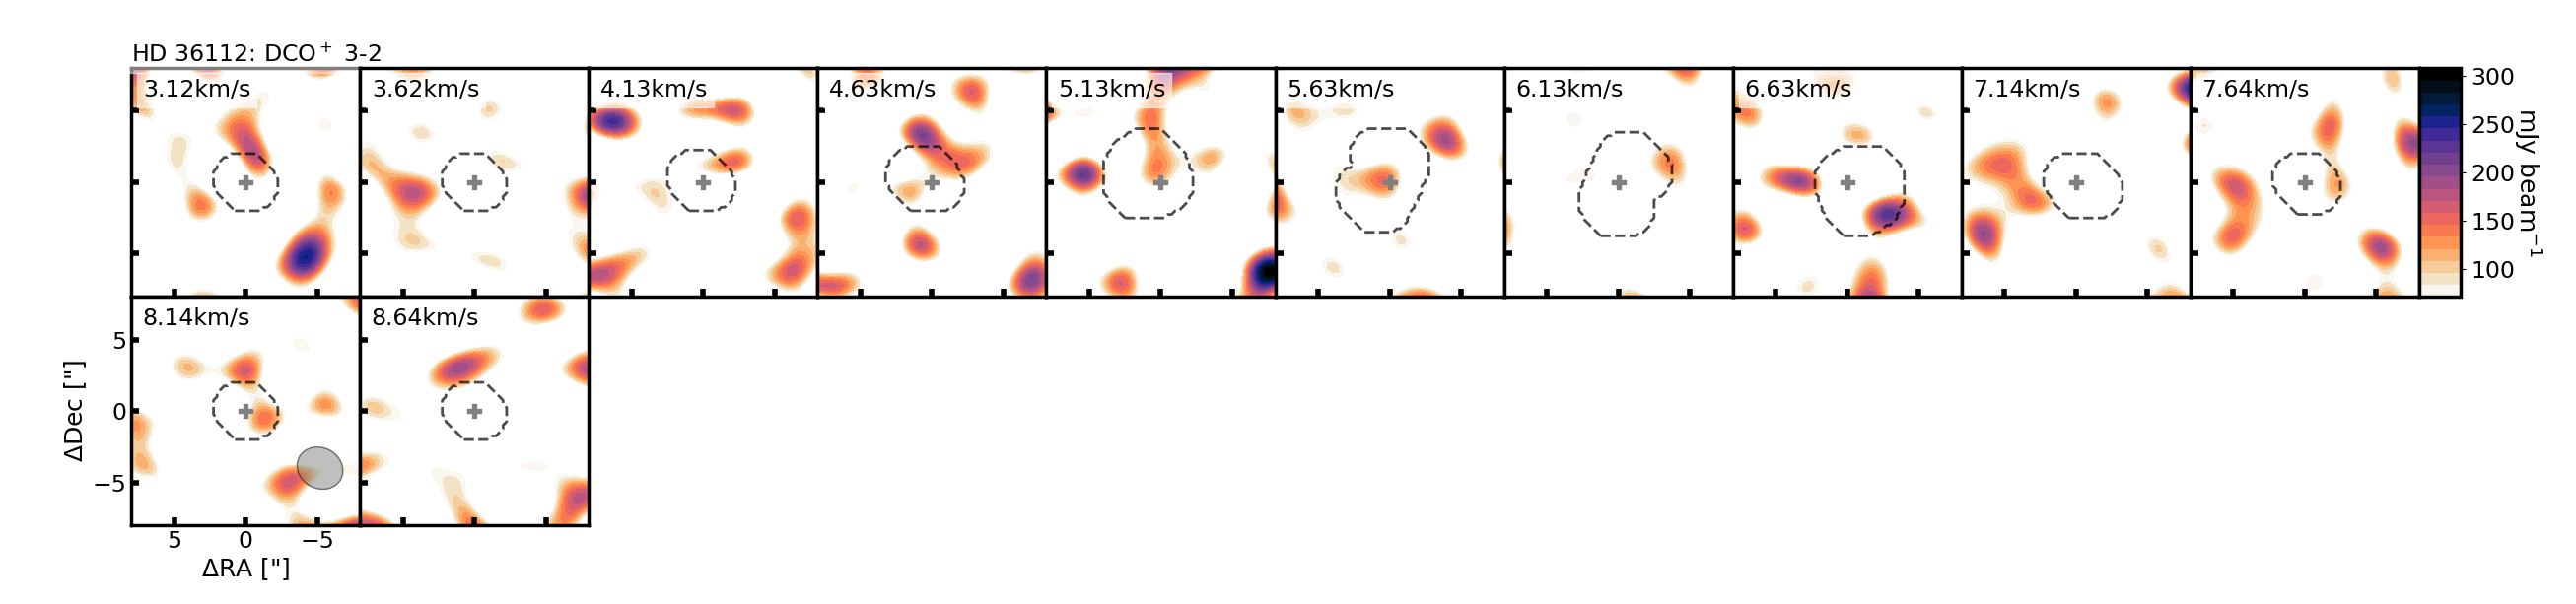
C.3 Channel Maps for HD 142666
Figure 14 displays channel maps for molecular line emission detected or tentatively detected from HD 142666.
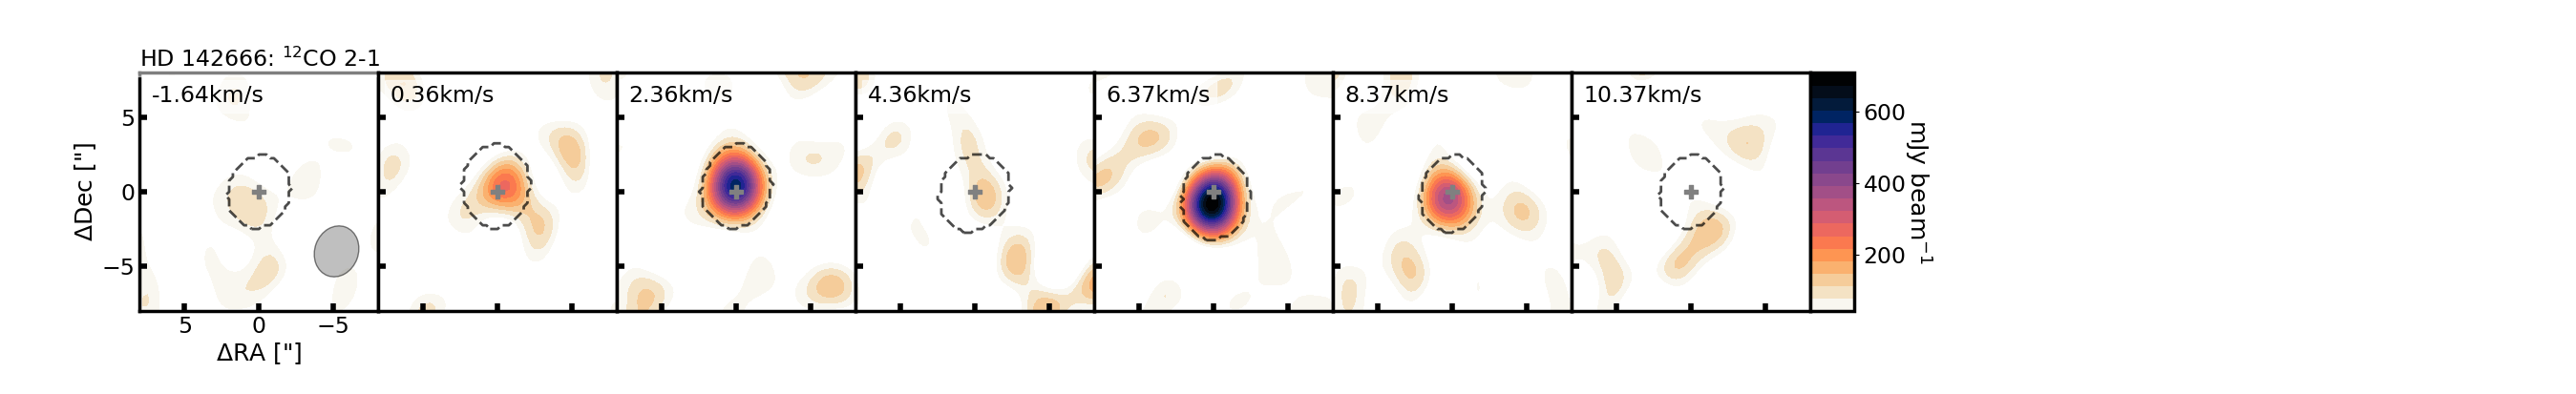
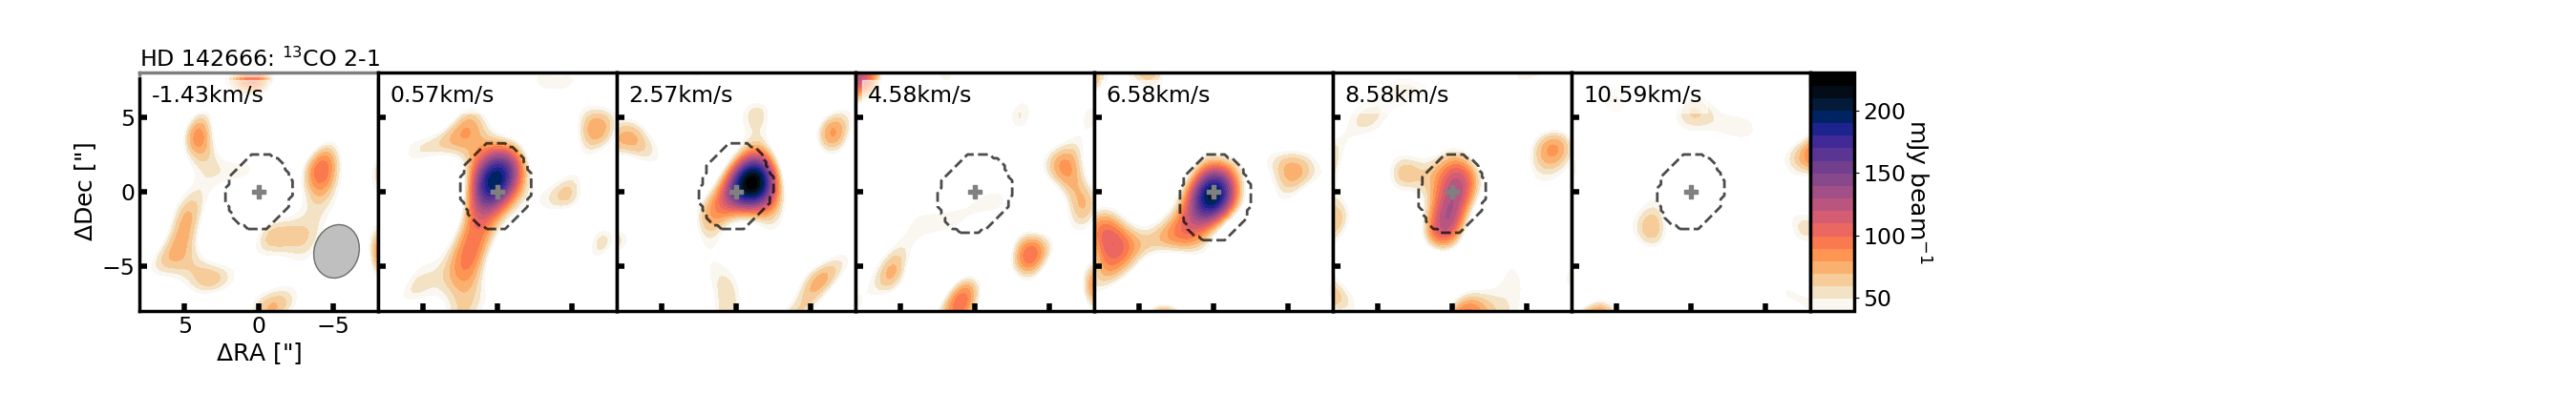
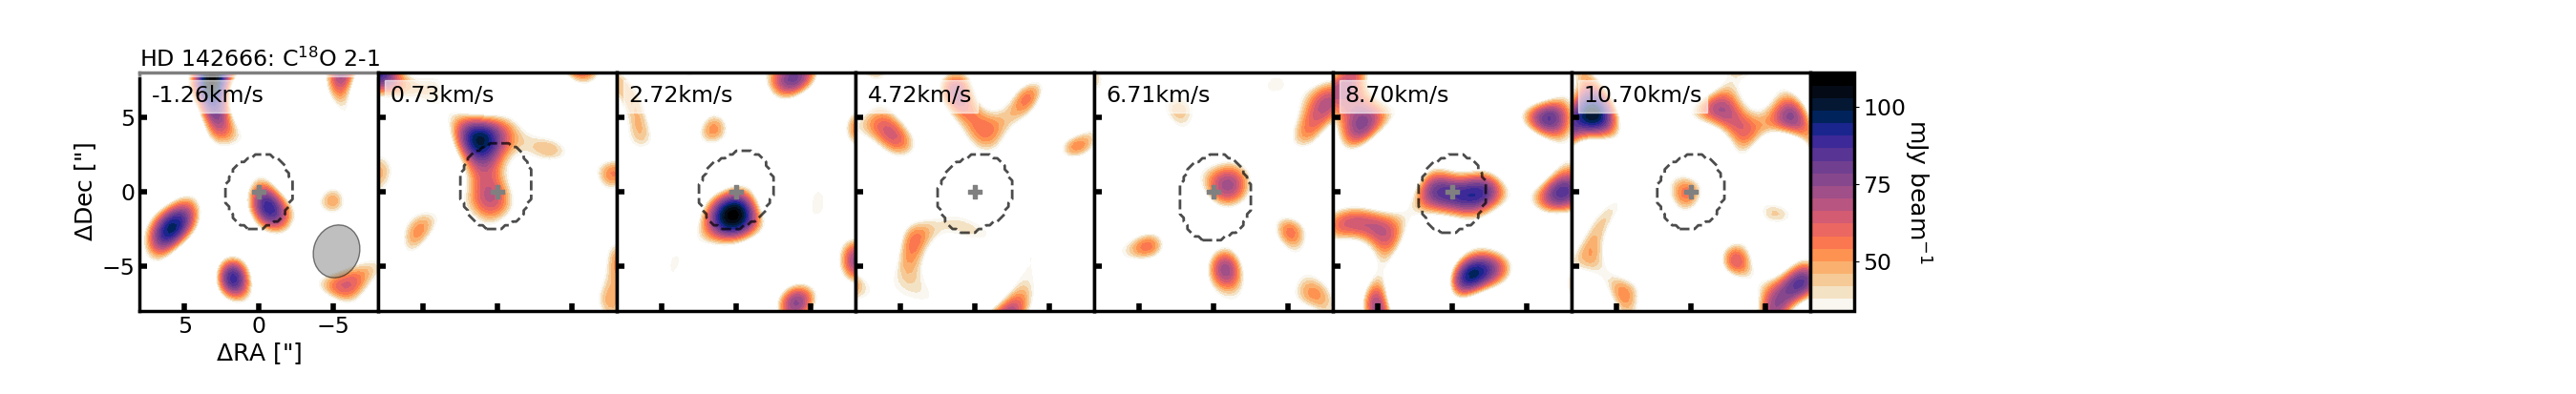
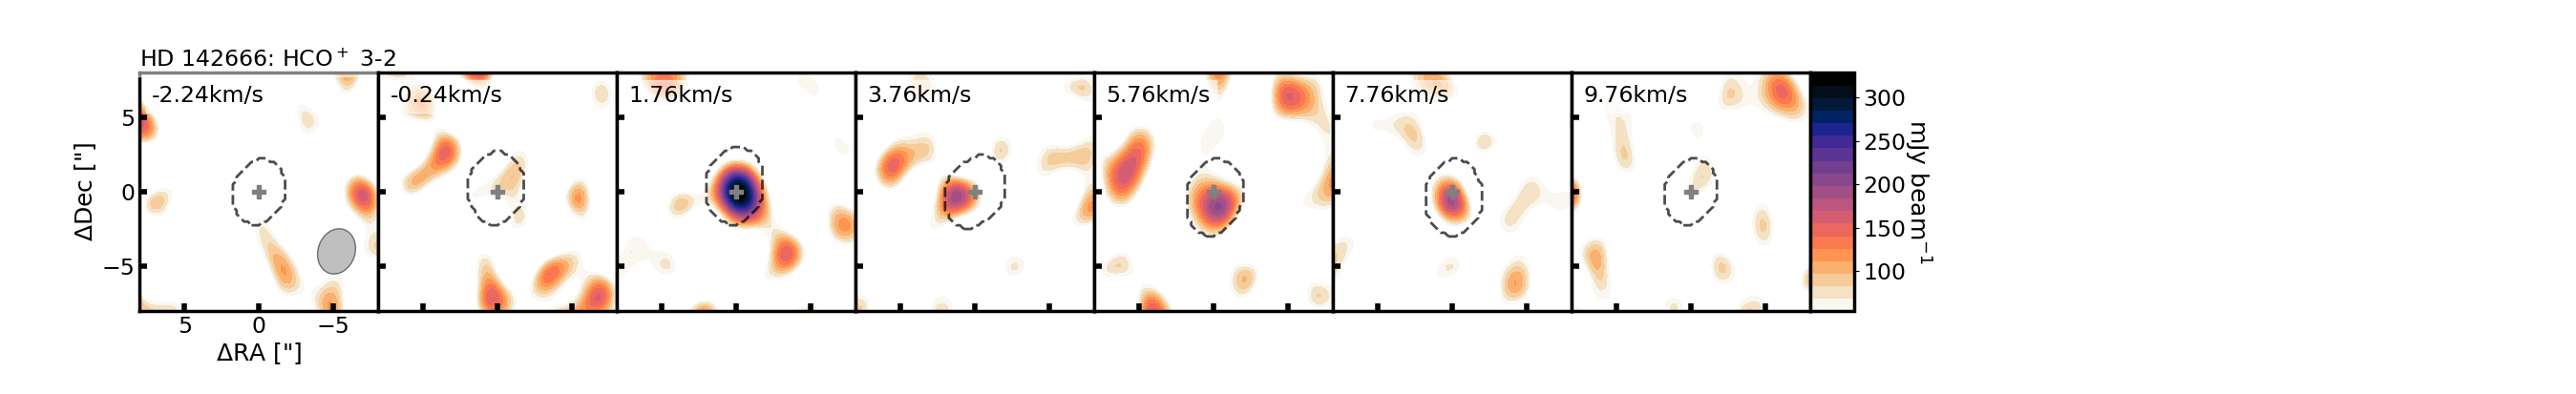
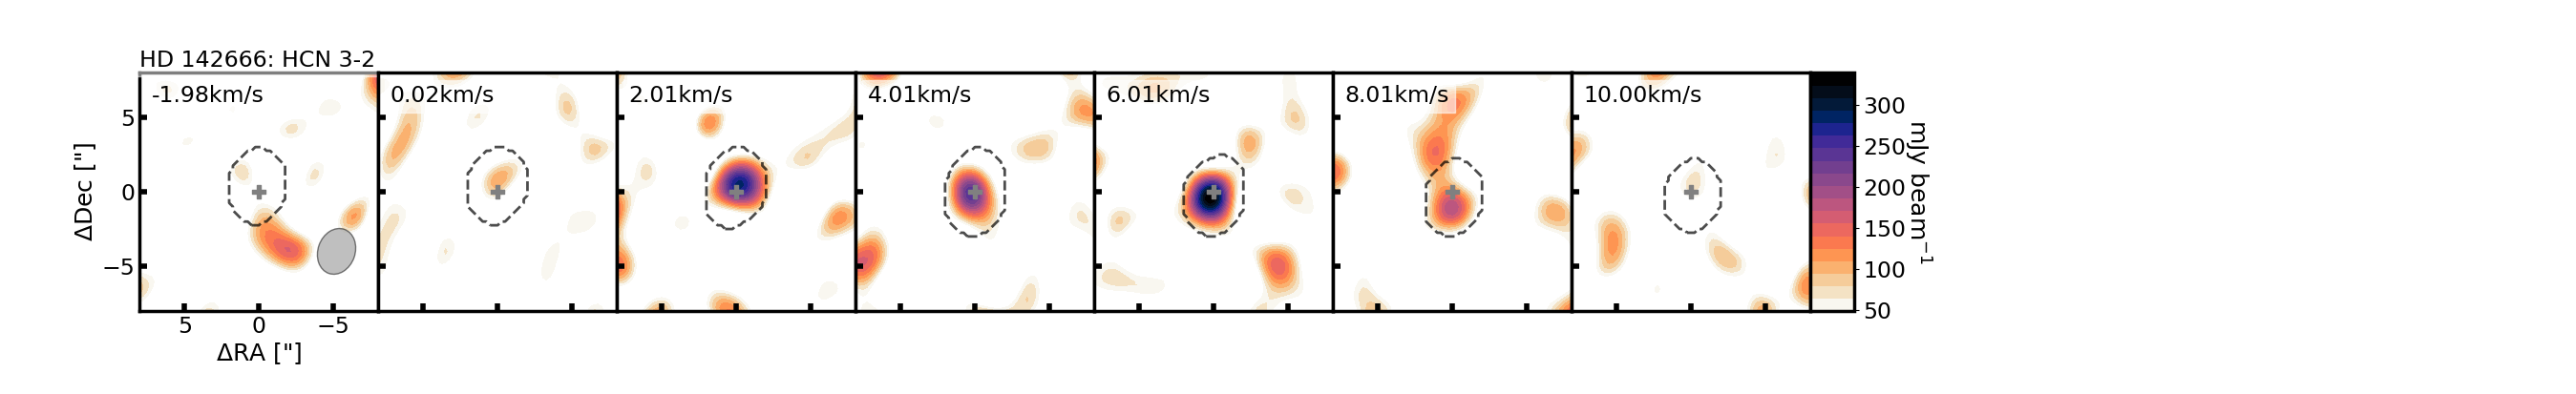
C.4 Channel Maps for HD 144432
Figure 15 displays channel maps for molecular line emission detected or tentatively detected from HD 144432.
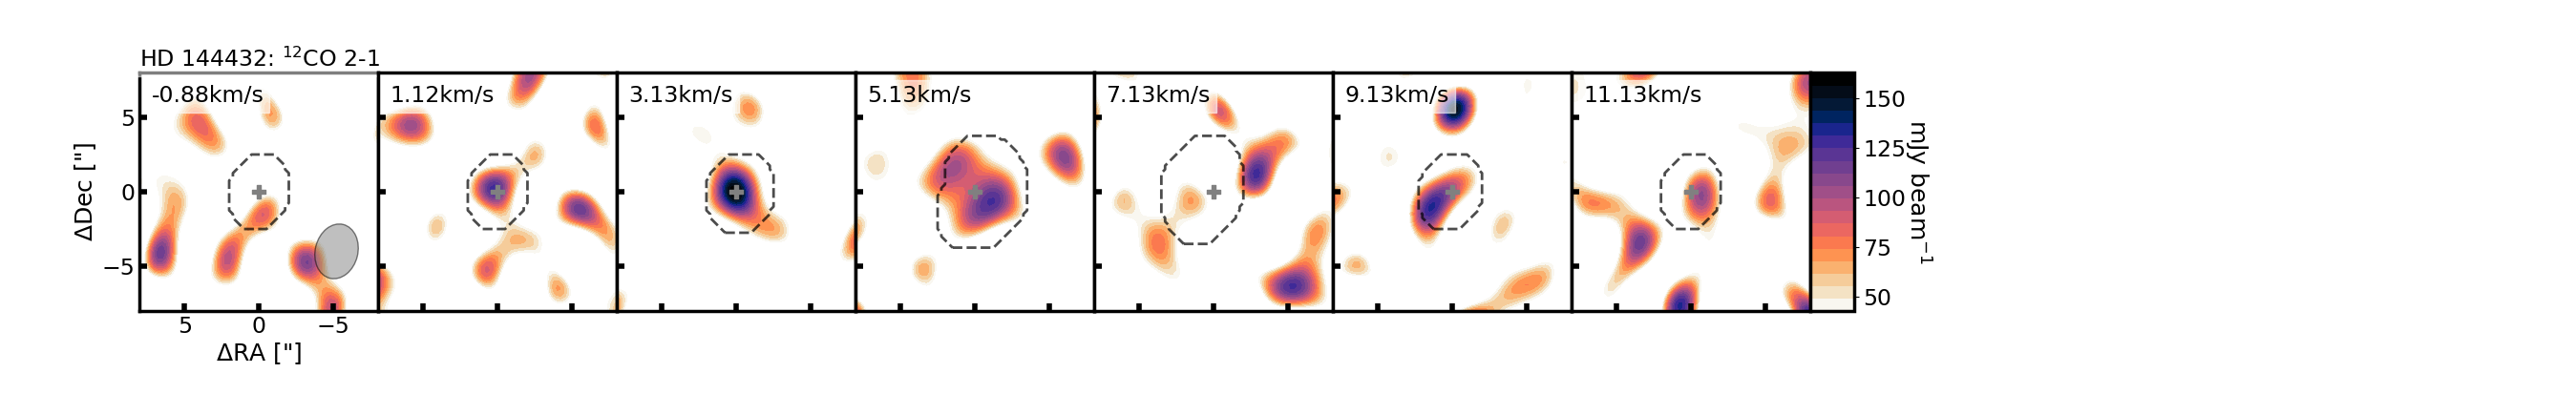
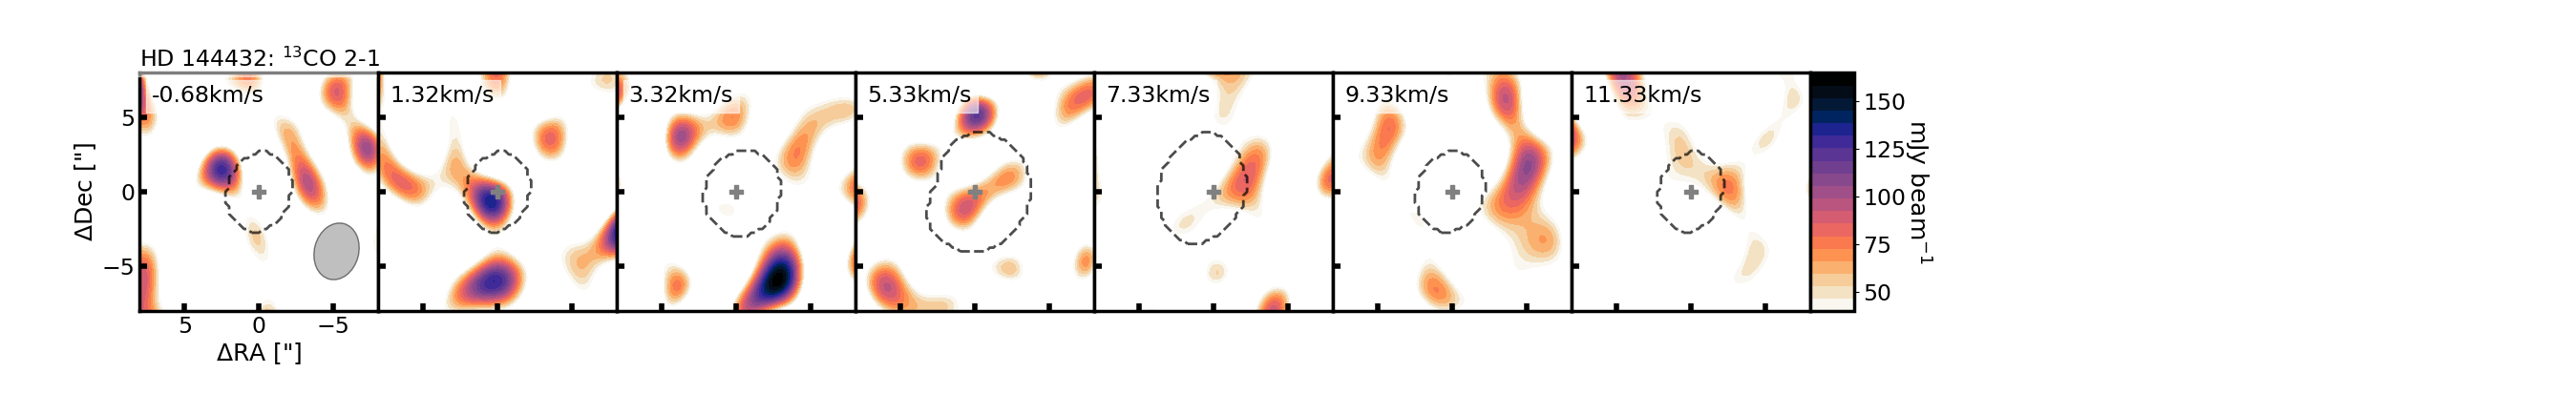
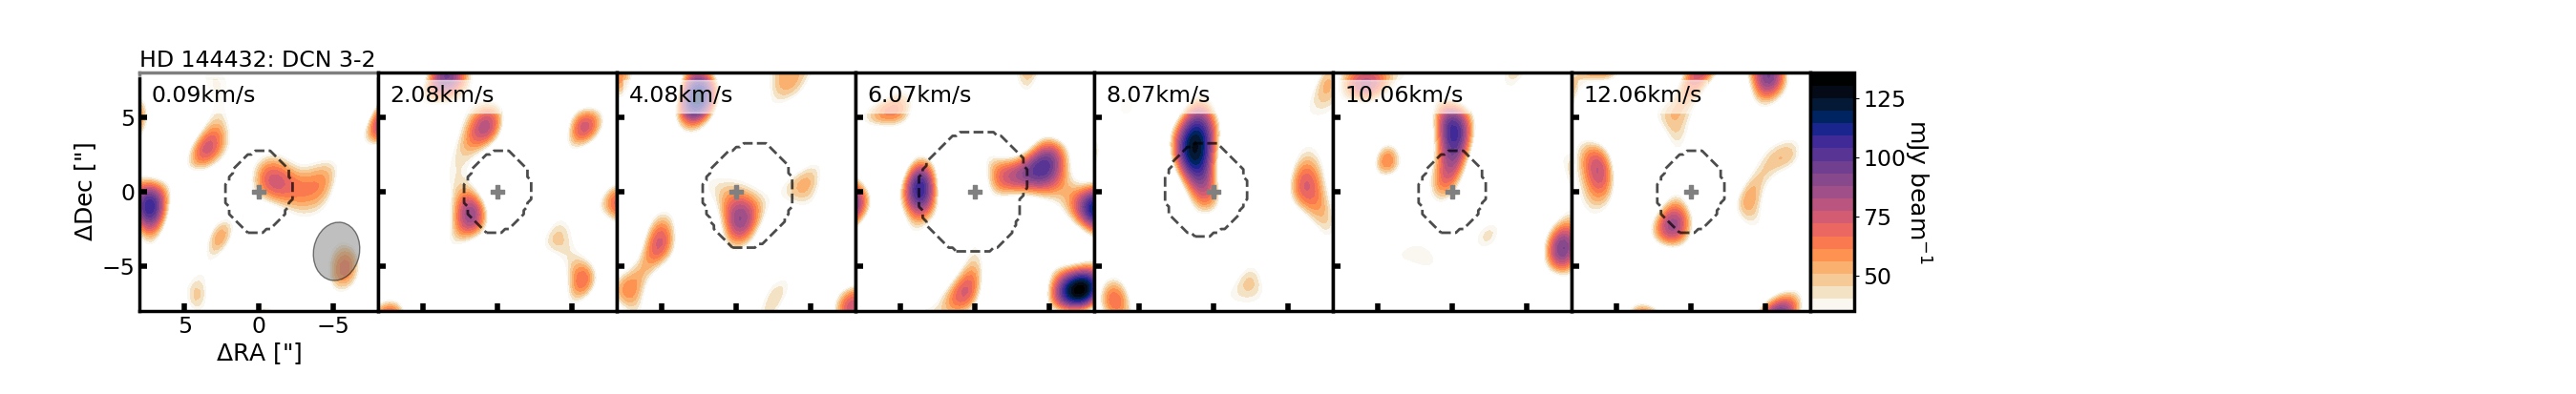
Appendix D ALMA Archival Observations of HD 34282
Figure 16 displays images of HD 34282 emission extracted directly from the ALMA archive for the observing project 2013.1.00658.S.