Commensurate-to-incommensurate transition of charge-density-wave order and a possible quantum critical point in pressurized kagome metal CsV3Sb5
Abstract
Clarifying the interplay between charge density waves (CDWs) and superconductivity is important in the kagome metal CsV3Sb5, and pressure () can play a crucial role. Here, we present 121/123Sb nuclear quadrupole resonance (NQR) measurements under hydrostatic pressures up to 2.43 GPa in CsV3Sb5 single crystals. We demonstrate that the CDW gradually changes from a commensurate modulation with a star-of-David (SoD) pattern to an incommensurate one with a superimposed SoD and Tri-hexagonal (TrH) pattern stacking along the -axis. Moreover, the linewidth of 121/123Sb-NQR spectra increases with cooling down to , indicating the appearance of a short-range CDW order due to CDW fluctuations pinned by quenched disorders. The shows a Curie-Weiss temperature dependence and tends to diverge at 1.9 GPa, suggesting that a CDW quantum critical point (QCP) exists at where shows the maximum. For , spin fluctuations are enhanced when the CDW is suppressed. Our results suggest that the maximal at 1.9 GPa is related to the CDW QCP and the presence of spin fluctuations prevent the from a rapid decrease otherwise after the CDW is completely suppressed.
I Introduction
Unconventional superconductivity always arises in the vicinity of another ordered electronic state, such as a magnetic orderKeimer2010 , a nematic orderChu2012 , or even a charge density wave (CDW)Wu2011 . In cuprate high-temperature superconductors, iron-pnictides or heavy-fermion compounds, carrier dopings or externally applied pressures can suppress the magnetic or nematic orderStewart1984 ; Lee2006 ; Stewart2011 . Quantum critical points(QCPs) and associated fluctuations were often found around the ending point of these orders and considered by many a key to understanding the mechanism of unconventional superconductivityKeimer2010 ; Hashimoto2012 ; Zhou2013 ; Wang2018 ; Luo2019 . However, unconventional superconductivity around a CDW QCP is rarely observedGruner2017 , and whether CDW fluctuations can also mediate the electron pairing is still a mystery.
Recently, a newly discovered quasi-two-dimensional superconductor V3Sb5 ( = K, Cs, Rb) with kagome lattice has emerged as an excellent platform to study the interplay between topology, superconductivity, and CDWdiscovery of CsV3Sb5 . Angle-resolved photoemission spectroscopy combined with density-functional theory reveals a series of non-trivial electronic structures in this compound, including flat band, Dirac point, Van Hove singularity, and topological surface statesZ2 topological kagome metal ; Topological surface states and flat bands ; Twofold van Hove singularity ; Rich nature of Van Hove singularities ; Crucial role of out-of-plane Sb p orbitals in Van Hove singularity ; Dirac nodal lines and nodal loops . Meanwhile, many exotic features, including chiralityChiral flux phase ; Electronic nature of chiral charge order ; Switchable chiral transport ; Analysis of Charge Order , nematicityelectronic nematicity , and time-reversal symmetry-breakingTime-reversal symmetry broken by charge order ; Time-reversal symmetry breaking by polar Kerr effect , were found in the CDW state, which was proposed to be driven by electron correlationsLi2021 ; Possible star-of-David pattern . Especially, the unusual phase diagram of the CDW order and superconductivity with applying hydrostatic pressures attracted a lot of attentionTwo types of charge order ; multidome superconductivity ; Double superconducting dome and triple enhancement of Tc ; Unusual competition of superconductivity and charge-density-wave state . The CDW transition can be gradually suppressed by applying hydrostatic pressure until 1.9 GPa, and the superconducting transition temperature shows a non-monotonic double-dome-like phase diagram until its disappearance around 10 GPaDouble superconducting dome and triple enhancement of Tc ; Unusual competition of superconductivity and charge-density-wave state ; Pressure-induced reemergence ; Highly robust reentrant superconductivity . Most remarkably, the maximum is right at , where no Hebel-Slichter coherence peak is seen below in the superconducting statestripe-like CDW . All these studies point to a possible QCP at Mechanism of exotic density wave and beyond Migdal unconventional superconductivity ; a pressure-induced quantum critical point , which makes CsV3Sb5 an ideal compound to study the relationship between unconventional superconductivity and CDW. Although the high-pressure nuclear magnetic resonance(NMR) experiments suggested that the CDW undergoes an evolution to a new phase with a possible stripe-like CDW order with a unidirectional 4a0 modulation in pressurized CsV3Sb5stripe-like CDW , information about pressure-dependent CDW fluctuations is still lacking, which is of much significance to clarify its interaction with superconducting symmetry. Besides the CDW fluctuations, spin fluctuations were also proposed to play an important role for the high-pressure superconducting phasespin fluctuations ; Mechanism of exotic density wave and beyond Migdal unconventional superconductivity . But whether spin fluctuations exist or not and how they are affected by pressures are still unclear in the current stage.
II Results and Discussions
II.1 Commensurate-to-incommensurate transition of the CDW order
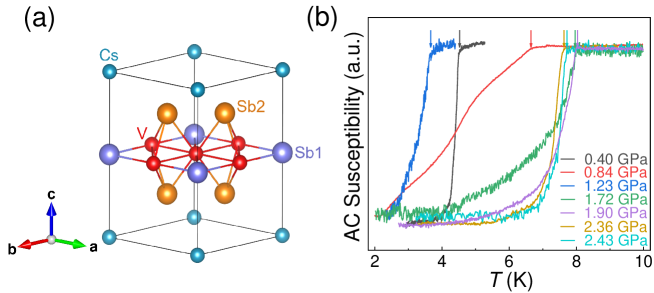
Figure 1 shows the crystal structure and the temperature dependence of AC susceptibility measured at various pressures by using an in-situ NMR coil. The strong diamagnetic signal and the sharp superconducting transition are observed at 0.40 GPa and 1.90 GPa, indicating the high quality of the sample. As in previous studies, the much broader superconducting transitions are observed at 0.84 GPa 1.72 GpaDouble superconducting dome and triple enhancement of Tc ; Unusual competition of superconductivity and charge-density-wave state . The obtained pressure dependence of is consistent with previous transport studies(see supplementary Fig. S3)SM .
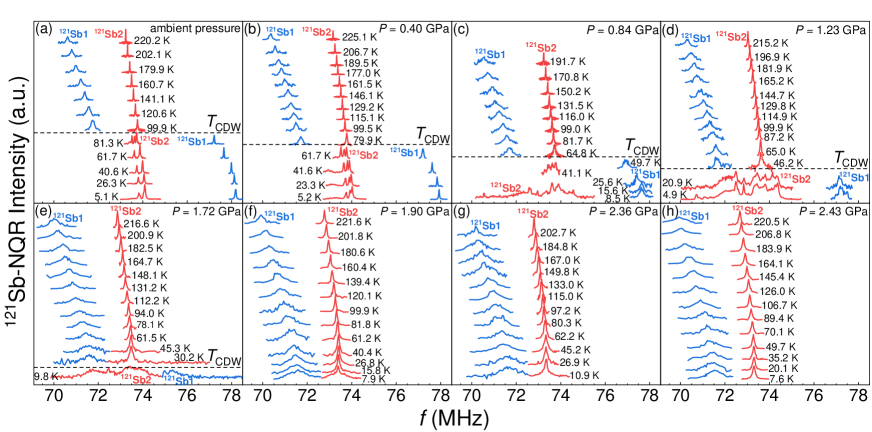
There are two types of Sb sites in CsV3Sb5. Sb1 is located in the kagome plane surrounded by the vanadium hexagon, and Sb2 is located between the kagome plane and Cs layer as illustrated in Fig. 1(a). Sb has two types of isotopes, 121Sb (I = 5/2) and 123Sb (I = 7/2). The quadrupole frequency is defined as , where is the electric field gradient (EFG) and is the nuclear quadrupole moment. For 121Sb nucleus, the NQR spectrum should have two resonance peaks corresponding to 1/2 3/2 and 3/2 5/2 transitions. For 123Sb nucleus, the NQR spectrum should have three resonance peaks corresponding to 1/2 3/2, 3/2 5/2 and 5/2 7/2 transitions. So a total of ten lines should be observed in 121/123Sb-NQR spectrum for CsV3Sb5, which is indeed seen in previous NQR studiesPossible star-of-David pattern ; S-Wave Superconductivity . Figure 2 displays the temperature dependence of 121Sb-NQR spectra corresponding to transitions at various pressures. For all pressures, there is only one peak for both 121Sb1 and 121Sb2 above . For 1.9 GPa, a clear change of the Sb-NQR spectrum due to the CDW transition can be seen as observed at ambient pressurePossible star-of-David pattern ; S-Wave Superconductivity , but gradually decreases with increasing pressure. The abrupt jump of Sb1 line was observed until = 1.23 GPa, indicating the CDW order is of the first order. But it is hard to determine the type of the CDW transition for = 1.72 GPa, since the line is too broad in the CDW state(see supplementary Fig. S5)SM .
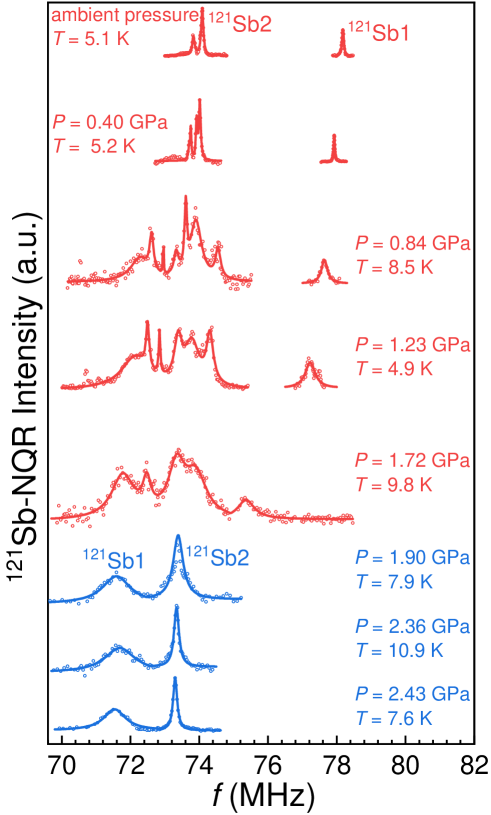
Inside the CDW state, we further found that the lineshape of 121Sb2-NQR spectra experienced a remarkable change with increasing pressure as shown in Fig. 3. For 0.4 Gpa, a simple splitting of 121Sb2 lines was observed, indicating that the CDW order is still commensurate and the lattice distortion should be still star-of-David (SoD) patternPossible star-of-David pattern . With increasing pressure, at = 0.84 GPa, both Sb1 and Sb2 NQR lines start to broaden, and new lines emerge at low frequencies. Below = 1.23 GPa, some sharp lines can still be seen between = 72 MHz to 75 MHz, but only broad lines remain at = 1.72 GPa.
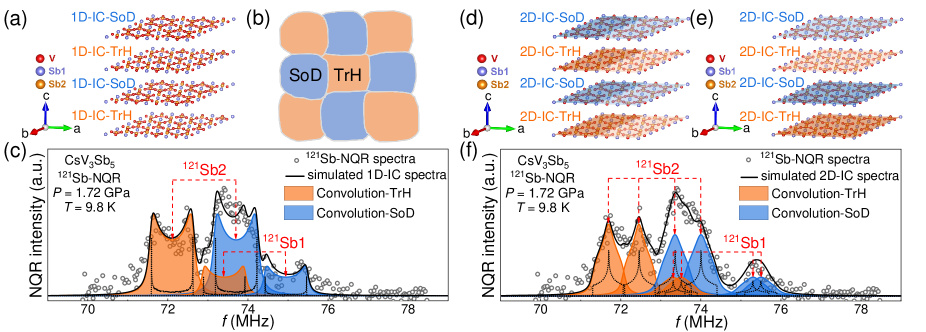
The observed broadening and emergence of new lines imply that the CDW modulation is totally different from the modulation at ambient pressure. Below we show that an incommensurate(IC) CDW order with superimposed SoD and TrH pattern stacking along the -axis can consistently account for the observed results. Generally speaking, in a commensurate CDW state, the NQR line reflects the small number of physically non-equivalent nuclear sites in the unit cell so that the spectrum with discrete peaks was observed. In an incommensurate state, however, since the translational periodicity is lost, the number of non-equivalent nuclear sites becomes much larger and leads to a larger broadeningBlinc . A modulation due to CDW order will cause an additional term in the resonance frequency at Sb site (). In our model, we consider both one-dimensional (1D) and two-dimensional (2D) incommensurate modulations. In the 1D case, we assume that the charge modulation along one in-plane direction is incommensurate and introduce an additional cosine function as Blinc . In the 2D case, we assume that the incommensurate modulation is in-plane and introduce an additional term be Blinc . and are the wave vectors along and -axis, respectively. is the angle between the two in-plane wave vectors and , which is for the kagome lattice studied in this work. For the 1D incommensurate case, we propose that the SoD and TrH patterns could be either superimposed as illustrated in Fig. 4(a) or formed two different domains as illustrated in Fig. 4(b). For the 2D incommensurate case, we assume an additional charge modulation on top of the superimposed SoD and TrH pattern, either along the -axis or -axis as illustrated in Fig. 4 (d) and (e). By only considering the structural distortion in the plane and convoluting with a Lorentz function (details about NQR spectra simulation are present in Supplementary Note 5)SM , we can reproduce the spectra at = 1.72 GPa for both 1D and 2D incommensurate modulation as shown in Fig. 4(c) and (f), respectively.
However, for the 1D incommensurate modulation, the Sb1 NQR spectra should have two peaks of equal intensities at 74.5 and 75.4 MHz, respectively (see Fig. 4(c)), which is not observed at = 0.84 GPa or 1.23 GPa (see Fig. 3). We note that a stripe CDW order was proposed by the previous 51V-NMR studystripe-like CDW , which is similar to our assumption of the additional modulation along the -axis. However, the incommensurability of CDW and the coexistence of SoD and TrH patterns were not caught by the 51V-NMR. This might be because Sb nuclei are sensitive to charge modulation from the Sb 5-orbitals, which was suggested to be different from the CDW originated from the V 3-orbitalsLi20222 . In addition, 121/123Sb-NQR spectra were found to have a much larger response to the CDW order compared to the 51V-NMR spectraPossible star-of-David pattern ; S-Wave Superconductivity . In any case, our results suggest that CDW modulation gradually changes from the commensurate CDW at ambient pressure to the incommensurate CDW with increasing pressure. However, the NMR line shape is independent of the value of the CDW wave vector for incommensurate modulations. Moreover, the present experimental results do not rule out the possibility of more complex CDW patterns beyond the proposed structures in Fig. 4. To further resolve this issue, high-pressure X-ray scattering measurements at 1.72 GPa are needed in the future.
In the range of 0.84GPa 1.23 GPa, we found that the NQR spectra consist of both narrow and broad peaks(see Supplementary Fig. S7)SM , indicating the coexistence of the commensurate and incommensurate CDWs. Then, there will be a large number of CDW domain walls between the commensurate and incommensurate CDWs in this pressure region. The enhanced interaction and scattering at the domain walls can strongly affect the superconductivityUnusual competition of superconductivity and charge-density-wave state ; Lee2021 , which is likely responsible for the inhomogeneous superconductivity as we found (see Supplementary Fig. S8 for the comparison between the commensurate CDW volume fraction and the superconducting transition width)SM .
A commensurate to incommensurate transition with increasing pressures as we found was recently proposed theoretically Mechanism of exotic density wave and beyond Migdal unconventional superconductivity , but a superimposed SoD and TrH pattern was not predicted. In CsV3Sb5, instead of electron-phonon coupling, electron correlations were suggested to be an important factor in forming the CDW orderLi2021 . Most interestingly, the incommensurate modulation was also reported in Sn-doped CsV3Sb5Kautzsch2022 . Then, one possible scenario is that the ordering wave vector connects parts of the Fermi surface or the hot spots. And with increasing pressure, due to the change of the Fermi surface, the ordering wave vector gradually becomes incommensurate. Such a scenario was proposed for the CDW order in cuprates, and the wave vector was found to have a monotonous doping-dependenceComin2016 . It would be interesting to measure the doping dependence of the wave vector by the high-pressure X-ray scattering.
II.2 Possible CDW quantum critical point
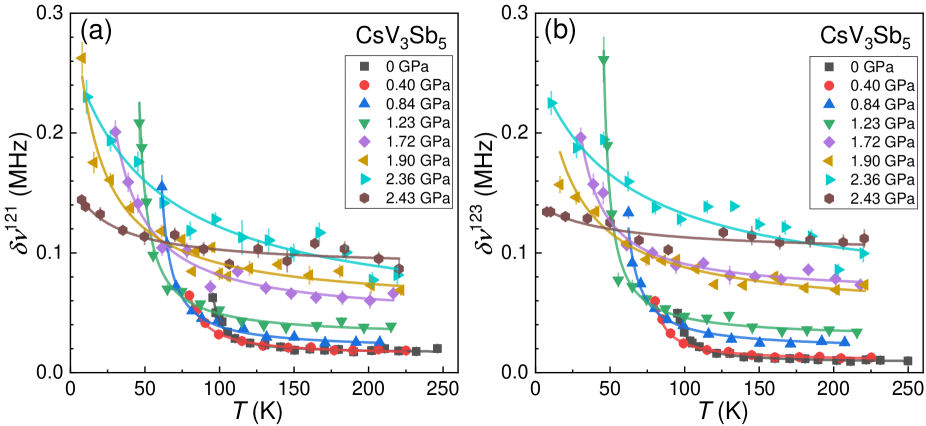
Next, we turn to the fluctuations above . By fitting the 121Sb2 and 123Sb2 spectra with the Lorentz function (see Supplementary Fig. S9 for 123Sb-NQR spectra of the Sb2 site)SM , we deduced the linewidth and at various pressures as shown in Fig. 5(a) and (b), respectively. Both and increases with decreasing temperature until , indicating the existence of the short-range CDW order due to CDW fluctuations pinned by quenched disorders, which was also observed in 2H-NbSe2 and underdoped cuprate YBa2Cu3OyBerthier1978 ; Ghoshray2009 ; Wu2015 . Our observation is consistent with the recent X-ray scattering and specific heat measurements at ambient pressure, which also show the existence of a short-range CDW order above Chen2022 . Moreover, we find that the temperature dependence of also follows the Curie-Weiss behavior as observed in YBa2Cu3OyVinograd2019 , and fit both and by the Curie-Weiss formula as,
| (1) |
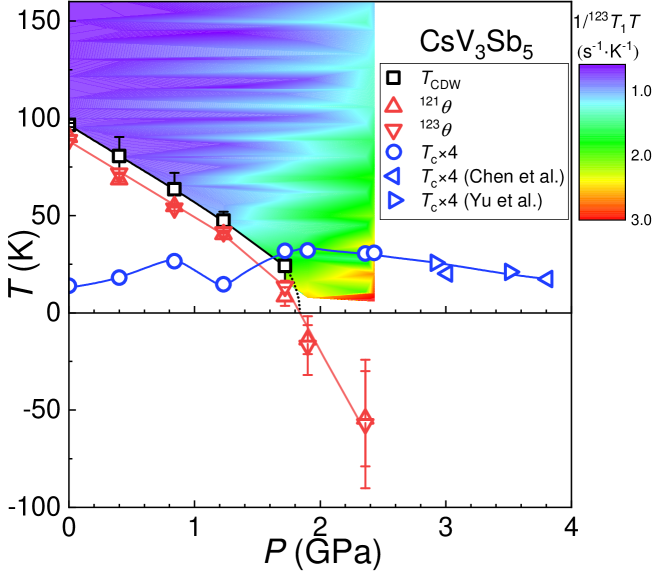
where represents the amplitude of the Curie-Weiss fit and is a constant. As shown in Fig. 5, both and are fitted very well, and the obtained and are plotted in the phase diagram(see red triangles in Fig. 6). Most surprisingly, we find that both and are very close to from the ambient pressure to = 1.72 GPa, indicating a divergent behavior of . Therefore, our results suggest that the NQR line broadening approaching is related to the CDW fluctuations. There is no present theory giving the quantitative relationship between the CDW susceptibility and the NQR line width , however, in analogy with the magnetic and nematic quantum phase transitionsHashimoto2012 ; Zhou2013 , we can take as an indicator of the QCP. If = 0, it means that the CDW susceptibility diverges at , indicating a CDW QCP. As shown in Fig. 6, both and are almost zero at 1.9 GPa, suggesting a CDW QCP at this pressure. We note that reaches the maximum at , implying the possible relationship between CDW fluctuations and the superconductivity. In order to make a firm conclusion, it will be important to make sure whether the CDW transition is of second-order at 1.72GPa, and whether the CDW QCP is beneath the superconducting domeShibauchi2014 ; Wang2018 .
II.3 Spin fluctuations
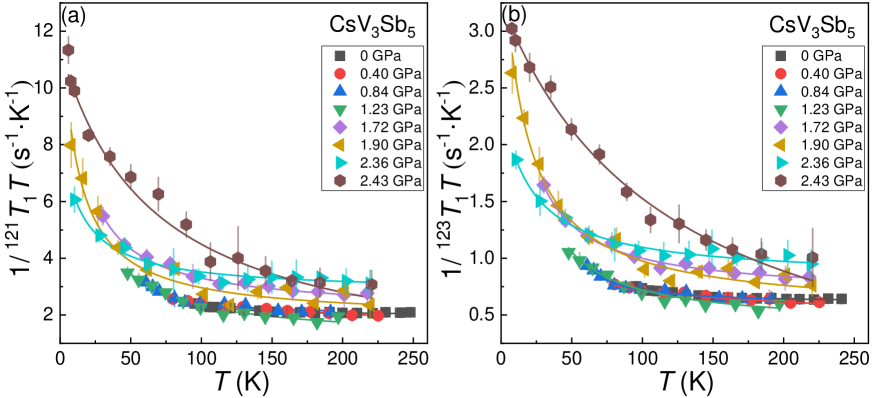
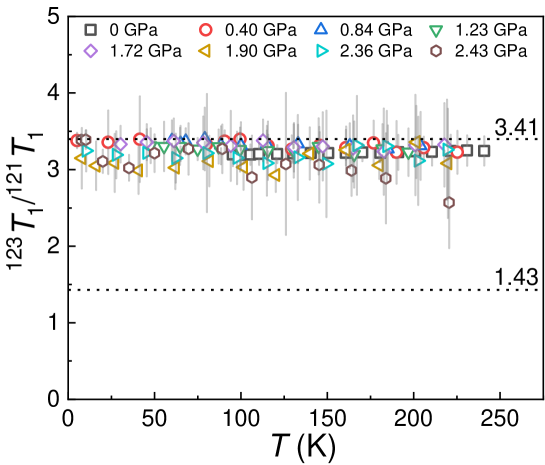
Lastly, we tried to obtain more information about fluctuations by measuring the spin-lattice relaxation rate 1/ at both 121Sb2 and 123Sb2 sites at various pressures as shown in Fig. 7. At all pressures, increases with decreasing temperature towards . To further show the evolution of 1/, we make a contour plot in Fig. 6. 1/ is almost identical for 1.72 GPa, but starts to be enhanced from = 1.9 GPa after the fully suppression of the CDW order, which shows a totally different behavior comparing to the NQR line broadening (see Fig. 5). The nuclear spin-lattice relaxation rate 1/ is mainly composed of two contributions including magnetic interaction and quadrupole interaction. If the quadrupole relaxation process is predominant, the 1/ ratio between 121Sb and 123Sb is expected to be Ishida , in which = cm2 and = cm2 are taken. If the magnetic relaxation process is predominant, the 1/ ratio between 121Sb and 123Sb is expected to be , in whcih = 10.189 MHz/T and = 5.51756 MHz/T are taken. As shown in Fig. 8, the 1/ ratio / is close to 3.41 for all pressures, indicating that is mainly contributed by spin fluctuations. Therefore, our results suggest the existence of spin correlations in CsV3Sb5. With increasing pressure, the spin correlations are significantly enhanced after the complete suppression of CDW order. More interestingly, as reported by previous transport studies, does not drop rapidly for 1.9 GPa(see Supplementary Fig. S10 for the complete phase diagram)Double superconducting dome and triple enhancement of Tc ; Unusual competition of superconductivity and charge-density-wave state ; SM . Our results suggest that the superconductivity is sustained by the spin fluctuations at high pressures, which seems to be consistent with recent theoretical studiesspin fluctuations ; Mechanism of exotic density wave and beyond Migdal unconventional superconductivity . In passing, we also note that a new superconducting state arises above 15 GPa with the pressure further increasingPressure-induced reemergence ; Highly robust reentrant superconductivity . Whether spin fluctuations still play a role for such a higher pressure phase needs high-pressure NMR measurements by using diamond anvils to clarify.
III Conclusions
In conclusion, we have presented the systematic 121/123Sb NQR measurements on CsV3Sb5 under hydrostatic pressures. We found that the CDW structure gradually changes from a commensurate SoD pattern at ambient pressure to a superimposed incommensurate SoD and TrH pattern at = 1.72 GPa. Above , we find that the linewidth of NQR spectra increases with decreasing temperature, indicating the existence of CDW fluctuations pinned by quenched disorders. The linewidth shows a Curie-Weiss temperature dependence and tends to diverge at 1.9 GPa where shows the maximum. Spin fluctuations are enhanced for , which is probably responsible for the slow decrease of at high pressures. Our results reveal the evolution of CDW structure and an emerged CDW QCP with increasing hydrostatic pressures, providing new insight into the superconducting pairing mechanism in CsV3Sb5.
Methods
Sample preparation and NQR measurement
Single crystal CsV3Sb5 was synthesized by the self-flux methoddiscovery of CsV3Sb5 . The typical size of the single crystal is around 3 mm 2 mm 0.1 mm. Several single crystals were mounted inside a piston-cylinder pressure-cell made of CuBe alloy. To maintain consistency and ensure the number of quenched disorders remains unchanged, all measurements were conducted on the same single crystals.
The NQR measurements were performed with a phase-coherent pulsed NQR spectrometer. The 121/123Sb-NQR spectra were acquired by sweeping the frequency point by point and integrating spin-echo signal. Since the EFG principal axis of 121/123Sb is along the -axisPossible star-of-David pattern , we stack the CsV3Sb5 single-crystal flakes along the direction to obtain better NQR signal. The nuclear spin-lattice relaxation rate 1/ was measured by the saturation-recovery method. The was obtained by fitting the nuclear magnetization with and was fitted by , where and are the nuclear magnetization respectively at thermal equilibrium and time after the comb pulse.
High Pressure NQR measurement
We used a commercial BeCu/NiCrAl clamp cell from CT Factory Co., Ltd. (Japan) and Daphne oil 7373 as a transmitting mediumYokogawa2007 . When we applied the pressure above 1.7 GPa, we heated the pressure cell up to 315 K to prevent the solidification of the pressure medium Daphne 7373Yokogawa2007 . Although cares have been taken, there is still a possibility that the pressure might be uniaxial at higher pressures, which could broaden the NQR lines at high temperatures as shown in Fig. 5. For 0.4 GPa 2.36 GPa, the applied pressure has been calibrated by the NQR frequency of Cu2OCuprous oxide manometer ; Space efficient opposed-anvil high-pressure cell . The Cu2O powder and single crystal CsV3Sb5 were placed together inside the NQR coil. There is a pressure deficit from room temperature to low temperature due to the solidification of Daphne oil 7373Yokogawa2007 , so the pressure-cell was pressurized at room temperature and the NQR frequency of 63vQ was measured at 5 K(see Supplementary Fig. S1)SM . The of Sb2 shows a linear pressure dependence(see Supplementary Fig. S2 (d))SM . For = 2.43 GPa, the applied pressure was obtained by the value of at = 100 K.
Data Availability
The data that support the findings of this study are available from the corresponding authors upon reasonable request.
Acknowledgements.
This work was supported by the National Natural Science Foundation of China (Grant Nos. 11974405, Nos. 11674377, Nos. 11634015, Nos. 51771224, Nos. 61888102 and Nos. 11904023), the National Key Research and Development Projects of China (Grant Nos. 2022YFA1403400, Nos. 2018YFA0305800 and 2019YFA0308500) and the Strategic Priority Research Program of the Chinese Academy of Sciences (Grant Nos. XDB33010100 and Nos. XDB33030100).Author contributions
The single crystals were grown by Z.Z., H.T.Y. and H.J.G. The NMR measurements were performed by X.Y.F., J.L., J.Y., A.F.F. and R.Z. R.Z. and G.Q.Z. wrote the manuscript with inputs from X.Y.Feng. All authors have discussed the results and the interpretation.
Competing Interests
The authors declare no competing interests.
References
- (1) Keimer, B., Kivelson, S. A., Norman, M. R., Uchida, S. & Zaanen, J. From quantum matter to high-temperature superconductivity in copper oxides. Nature 518, 179-186 (2015).
- (2) Chu, J. H., Kuo, H. H., Analytis, J. G. & Fisher, I. R. Divergent Nematic Susceptibility in an Iron Arsenide Superconductor. Science 337, 710-712 (2012).
- (3) Wu, T. et al. Magnetic-field-induced charge-stripe order in the high-temperature superconductor YBa2Cu3Oy. Nature 477, 191-194 (2011).
- (4) Stewart, G. R. Heavy-fermion systems. Rev.Mod.Phys. 56, 755 (1984).
- (5) Lee, P. A., Nagaosa, N. & Wen, X. G. Doping a Mott insulator: Physics of high-temperature superconductivity. Rev.Mod.Phys. 78, 17 (2006).
- (6) Stewart, G. R. Superconductivity in iron compounds. Rev.Mod.Phys. 83, 1589 (2011).
- (7) Hashimoto, K. et al. A Sharp Peak of the Zero-Temperature Penetration Depth at Optimal Composition in BaFe2(As1-xPx)2. Science 336, 1554-1557 (2012).
- (8) Zhou, R. et al. Quantum criticality in electron-doped BaFe2-xNixAs2. Nat. Comm. 4, 2265 (2013).
- (9) Wang, C. G. et al. Electron Mass Enhancement near a Nematic Quantum Critical Point in NaFe1-xCoxAs. Phys. Rev. Lett. 121, 167004 (2018).
- (10) Luo, J. et al. Tuning the Distance to a Possible Ferromagnetic Quantum Critical Point in A2Cr3As3. Phys. Rev. Lett. 123, 047001 (2019).
- (11) Gruner, T. et al. Charge density wave quantum critical point with strong enhancement of superconductivity. Nat. Phys. 13, 967-972 (2017).
- (12) Ortiz, B. R. et al. New kagome prototype materials: discovery of KV3Sb5, RbV3Sb5, and CsV3Sb5. Phys. Rev. Mater. 3, 094407 (2019).
- (13) Ortiz, B. R. et al. CsV3Sb5: A Z2 topological kagome metal with a superconducting ground state. Phys. Rev. Lett. 125, 247002 (2020).
- (14) Hu, Y. et al. Topological surface states and flat bands in the kagome superconductor CsV3Sb5. Sci. Bull. 67, 495-500 (2020).
- (15) Kang, M. et al. Twofold van Hove singularity and origin of charge order in topological kagome superconductor CsV3Sb5. Nat. Phys. 18, 301-308 (2022).
- (16) Hu, Y. et al. Rich nature of Van Hove singularities in Kagome superconductor CsV3Sb5. Nat. Commun. 13, 2220 (2022).
- (17) Jeong, M. Y. et al. Crucial role of out-of-plane Sb orbitals in Van Hove singularity formation and electronic correlations in the superconducting kagome metal CsV3Sb5. Phys. Rev. B 105, 235145 (2022).
- (18) Hao, Z. Y. et al. Dirac nodal lines and nodal loops in the topological kagome superconductor CsV3Sb5. Phys. Rev. B 106, L081101 (2022).
- (19) Feng, X. L., Jiang, K., Wang, Z. Q. & Hu, J. P. Chiral flux phase in the Kagome superconductor AV3Sb5. Sci. Bull. 66, 1384-1388 (2021).
- (20) Wang, Z. W. et al. Electronic nature of chiral charge order in the kagome superconductor CsV3Sb5. Phys. Rev. B 104, 075148 (2021).
- (21) Guo, C. Y. et al. Switchable chiral transport in charge-ordered kagome metal CsV3Sb5. Nature 611, 461-466 (2022).
- (22) Denner, M. M., Thomale, R. & Neupert, T. Analysis of Charge Order in the Kagome Metal AV3Sb5 (A= K, Rb, Cs). Phys. Rev. Lett. 127, 217601 (2021).
- (23) Nie, L. P. et al. Charge-density-wave-driven electronic nematicity in a kagome superconductor. Nature. 604, 59-64 (2022).
- (24) Khasanov, R. et al. Time-reversal symmetry broken by charge order in CsV3Sb5. Phys. Rev. Research 4, 023244 (2022).
- (25) Hu, Y. et al. Time-reversal symmetry breaking in charge density wave of CsV3Sb5 detected by polar Kerr effect. Preprint at https://arxiv.org/abs/2208.08036 (2022).
- (26) Li, H. X. et al. Observation of Unconventional Charge Density Wave without Acoustic Phonon Anomaly in Kagome Superconductors AV3Sb5 (A = Rb, Cs). Phys. Rev. X 11, 031050 (2021).
- (27) Luo, J. et al. Possible star-of-David pattern charge density wave with additional modulation in the kagome superconductor CsV3Sb5. npj Quantum Mater. 7, 30 (2022).
- (28) Gupta, R. et al. Two types of charge order with distinct interplay with superconductivity in the kagome material CsV3Sb5. Commun. Phys. 5, 232 (2022).
- (29) Lin, Y. P. & Nandkishore, R. M. Multidome superconductivity in charge density wave kagome metals. Phys. Rev. B. 106, L060507 (2022).
- (30) Chen, K. Y. et al. Double superconducting dome and triple enhancement of in the kagome superconductor CsV3Sb5 under high pressure. Phys. Rev. Lett. 126, 247001 (2021).
- (31) Yu, F. H. et al. Unusual competition of superconductivity and charge-density-wave state in a compressed topological kagome metal. Nat. Commun. 12, 3645 (2021).
- (32) Zhang, Z. et al. Pressure-induced reemergence of superconductivity in the topological kagome metal CsV3Sb5. Phys. Rev. B. 103, 224513 (2021).
- (33) Chen, X. et al. Highly robust reentrant superconductivity in CsV3Sb5 under pressure. Chinese Phys. Lett. 38, 057402 (2021).
- (34) Zheng, L. X. et al. Emergent charge order in pressurized kagome superconductor CsV3Sb5. Nature 611, 682-687 (2022).
- (35) Tazai, R., Yamakawa, Y., Onari, S. & Kontani, H. Mechanism of exotic density-wave and beyond-Migdal unconventional superconductivity in kagome metal AV3Sb3 (A = K, Rb, Cs). Sci. Adv. 8, eabl4108 (2022).
- (36) Wang, C. Z., Liu, S. Y., Jeon, H., Jia, Y. & Cho, J. H. Charge density wave and superconductivity in the kagome metal CsV3Sb5 around a pressure-induced quantum critical point. Phys. Rev. Materials. 6, 094801 (2022).
- (37) Bai, X. C. et al. Effective minimal model and unconventional spin-singlet pairing in Kagome superconductor CsV3Sb5. Preprint at https://arxiv.org/abs/2201.10088 (2022).
- (38) See Supplementary Material for additional data and analysis.
- (39) Mu, C. et al. S-Wave Superconductivity in Kagome Metal CsV3Sb5 Revealed by 121/123Sb NQR and 51V NMR Measurements. Chinese Phys. Lett. 38, 077402 (2021).
- (40) Blinc, R. & Apih, T. NMR in multidimensionally incommensurate and CDW systems, Prog. Nucl. Mag. Res. Spec. 41, 49 (2002).
- (41) Li, H. X. et al. Discovery of conjoined charge density waves in the kagome superconductor CsV3Sb5. Nat. Commun. 13, 6348 (2022).
- (42) Lee, K., et al. Metal-to-insulator transition in Pt-doped TiSe2 driven by emergent network of narrow transport channels. npj Quantum Materials 6, 8 (2021).
- (43) Kautzsch, L. et al. Incommensurate charge-stripe correlations in the kagome superconductor CsV3Sb5-xSnx. Preprint at https://arxiv.org/abs/2207.10608v1 (2022).
- (44) Comin, R. & Damascelli, A. Resonant x-ray scattering studies of charge order in cuprates. Annu. Rev. Condens. Matter Phys. 7, 369-405 (2016).
- (45) Berthier, C., Jerome, D. & Molinie, P. NMR study on a 2H-NbSe2 single crystal: a microscopic investigation of the charge density waves state. J. Phys. C: Solid State Phys. 11, 797-814 (1978).
- (46) Ghoshray, K. et al. 93Nb NMR study of the charge density wave state in NbSe2. J. Phys.: Condens. Matter 21, 155701 (2009).
- (47) Wu, T. et al. Incipient charge order observed by NMR in the normal state of YBa2Cu3Oy. Nat. Commun. 6, 6438 (2015).
- (48) Chen, Q., Chen, D., Schnelle, W., Felser, C. & Gaulin, B. D. Charge Density Wave Order and Fluctuations above and below Superconducting in the Kagome Metal CsV3Sb5. Phys. Rev. Lett. 129, 056401 (2022).
- (49) Vinograd, I. et al. Nuclear magnetic resonance study of charge density waves under hydrostatic pressure in YBa2Cu3Oy. Phys. Rev. B. 100, 094502 (2019).
- (50) Shibauchi, T., Carrington, A. & Matsuda, Y. A Quantum Critical Point Lying Beneath the Superconducting Dome in Iron Pnictides. Annu. Rev. Condens. Matter Phys. 5, 113-135 (2014).
- (51) Kitagawa, S., Ishida, K., Nakano, K., Yajima, T. & Kageyama, H. s-wave superconductivity in superconducting BaTi2Sb2O revealed by 121/123Sb-NMR/nuclear quadrupole resonance measurements. Phys. Rev. B. 87, 060510 (2013).
- (52) Yokogawa, K., Murata, K., Yoshino, H. & Aoyama, S. Solidification of High-Pressure Medium Daphne 7373. Jpn. J. Appl. Phys. 46, 3636 (2007).
- (53) Reyes, A. P., Ahrens, E. T., Heffner, R. H., Hammel, P. C. & Thompson, J. D. Cuprous oxide manometer for high-pressure magnetic resonance experiments. Rev. Sci. Instrum. 63, 3120 (1992).
- (54) Kitagawa, K. et al. Space efficient opposed-anvil high-pressure cell and its application to optical and NMR measurements up to 9 GPa. J. Phys. Soc. Jpn. 79, 024001 (2010).