Spin-crossover assisted metallization of few-layer FePS3
at 1.45 GPa
Abstract
Magnetic insulators in reduced dimension are the ideal model systems to study spin-crossover (SCO) induced cooperative behavior under pressure. Similar to the external perturbations like light illumination or temperature, external pressure may provide new pathway to accelerate giant lattice collapse, and subsequently Mott transition in van der Waals (vdW) materials with diminishing effect of the third dimension. Here, we investigate room-temperature layer-dependent SCO and insulator-metal transition (IMT) in vdW magnet, FePS3, under high pressure using micro-Raman scattering. Experimentally obtained spectra, in agreement with the computed Raman modes, indicates evidence of IMT of FePS3 started off with a spin-state transition from a high (S = 2) to low spin state (S = 0) with a thickness dependent critical pressure () which reduces to 1.45 GPa in 3-layer flakes compared to 10.8 GPa for the bulk counterpart. Additionally, a broad Raman mode (P∗) emerges between 310 cm-1 and 370 cm-1 at elevated pressure for three different thicknesses of FePS3 flakes (3 - 100 layers), also corroborated with computational results which suggests the pressure dependent decrease of metal-ligand bond distance (Fe-S) with lowering of magnetic moment in FePS3. Phenomenologically, our results in few-layer flakes with strong structural anisotropy which enhances the in-plane strain with applied pressure can be understood by adopting Hubbard model and considering the spectral-range (bandwidth ) as a function of layer numbers () and pressure () with a power-law scaling. Reduction of the critical pressure for phase transition in few-layer vdW magnets to 1-2 GPa marks the possibility of using nano-enclosure fit for use in device electronics where the pressure is induced due to interfacial adhesion, like in vdW heterostructure or molecules trapped between layers, and thereby, avoiding the conventional use of diamond anvil cell (DAC).
I Introduction
Strong correlation between electronic and magnetic properties in quantum materials can be realized in spatially confined 2D flakes of vdW magnets under high pressure. Moreover, with varying layer thickness i.e. thinning the flakes down to few-atomic layer, electronic band strcture and spin texture can be altered, as a result of which charge transport and magnetism can be controlled [1, 2, 3, 4, 5, 6, 7]. Also, stacking of isolated monolayer and multilayers of dissimilar materials led to the finding of van der Waals heterostructures and superlattices with exotic behaviour resulting in practical electronic and spintronic devices [8, 9]. Recently, the discovery of 2D long-range magnetic ordering and strong coupling in spin-valley degree of freedom in 2D semiconductors have generated considerable interest as these materials would be ideal building block to design multistate spin logic [10, 11]. Further, 2D electronic system with quasi-one-dimensional triangular spin lattice show antiferromagnetic ordering at ambient pressure, but superconductivity under high pressure [12]. Even though theoretical studies have proposed a number of 2D magnets down to monolayer limit [13, 14, 15, 16, 17], very few experimental reports concerns strictly-2D flakes [18, 19, 21, 20]. Thus, tunable spin-ordering in few-layer magnets respective to their bulk counterpart is important for exploring exotic phases in new device architecture. A substantial amount of work has been done on the magnetism of bulk 2D transition metal phosphorous trichalcogenide (MPX3) materials [22]. The magnetization of these materials vary with the -electron configurations of the transition metal (M): Ising type ordering in FePS3, Heisenberg type ordering in MnPS3 and XY type ordering in NiPS3 [22, 23, 24]. Among these, FePS3 has attracted particular interest as Ising type magnetic ordering in the bulk FePS3 which persists down to monolayer [22] and is stable in air [21].
In bulk FePS3 with monoclinic crystal structure (space group C2/m), each Fe2+ atom is bonded to six S2- atoms to form edge-sharing FeS6 octahedra, while Fe atoms forms a honeycomb lattice. The S atoms are connected with P atom just above and below Fe honeycomb plane which constitutes P2S6 unit [22]. These arrangements are stacked along the axis where each plane is bonded via very weak interlayer vdW interaction. The anisotropic magnetic behavior of the system is governed by the competing direct Fe-Fe exchange and indirect Fe-S-Fe superexchange interactions within layers (0.31 meV/cell), as well as by interlayer exchange interactions (1.41 meV/cell) [22].
Utilizing hydrostatic pressure as external stimuli and Raman scattering as an experimental probe to identify changes in phonon modes of a 2D magnet in few-layers may facilitate detection of correlated structural change in a progressive manner with enhancement of - metal-ligand charge transfer, and possible SCO [26, 27]. To the best of our knowledge, except the study on quantifying vdW interactions in the layered MoS2 by measuring the valence band maximum (VBM) splitting under pressure [28], pressure driven phase transition in few-layer vdW magnets, where the effects of the third dimension is diminutive, unlike its bulk counterpart [26, 25, 29, 30], have not yet been systematically investigated. Consequently, nature of volume collapse in finite-sized 2D, and the effect of the crystal field splitting with transition metal elements while thinning the bulk sample, and a possible concurrent IMT may add new scaling laws, originating from the dimensional effect, to the existing band theory of Mott insulators. .
Herein, we methodically investigate room-temperature pressure driven SCO and IMT in FePS3 from the bulk (100 layers) to nearly 2D limit (3 layers) following characteristic phonon modes using micro-Raman scattering. Raman modes, corroborated with the first-principle density functional theory (DFT) calculations, reveal a prior SCO from a high (S = 2) to low spin state (S = 0) with a thickness dependent critical pressure () which reduces to 1.45 GPa in 3-layer flakes compared to 10.8 GPa for the bulk counterpart to the complete metallization. Moreover, evidence of a non-Lorentzian broad mode (P∗) evolves between 310 cm-1 and 370 cm-1 at elevated pressure, varies with different thicknesses of FePS3 flakes, also supported by computational results, suggests the pressure dependent decrease of metal-ligand bond distance (Fe-S) with lowering of magnetic moment in FePS3. We have adopted a phenomenological model where a macroscopic structural change due to the variation of the effective in-plane strain with layer numbers may result in reduction of the critical pressure in few layer samples. Considering the electronic Hubbard model, using modified bandwidth () as a function of layer numbers () and pressure () with a power-law scaling stipulates the lessening effect of the third dimension on the critical pressure for IMT. Practically, pressure as low as 1-2 GPa can be realized via interfacial adhesion utilizing the stacked vdW heterostructure or molecules trapped between layers where conformational/magnetic changes can be achieved bypassing the tricky, as well as delicate, use of the DAC, and most importantly, engineered flakes can be employed in the conventional three terminal field-effect transistor (FET) device architecture.
II Experimental Details
Bulk crystals of FePS3 with 99.999 purity from 2D Semiconductors (USA) was used in the present study. Three types of FePS3 samples, namely thin layer FePS3 flake, thick layer FePS3 flake and bulk FePS3, were investigated during the experiment. Thin and thick layer of FePS3 flakes were mechanically exfoliated from the bulk crystal using mechanical exfoliation technique by scotch tape. The thickness of the target flakes were estimated following previous experience as reported in the earlier studies [31, 32]. The samples were loaded in Diacell Bragg-Mini diamond anvil cell (DAC) with culet diameter of 500 m. A stainless steel gasket was used as sample holder. The gasket was preindented to thickness of 60 m and a hole of 180 m diameter was drilled at the center of indentation to create the sample chamber. Ruby sphere was placed with the sample to determine pressure inside sample chamber during the experiment. The chamber was filled with methanol-ethanol mixture in 4:1 ratio which act as hydrostatic pressure transmitting medium in the studied pressure range. Raman spectra was collected using Horiba T64000 Raman set-up. The spectra were taken in backscattering geometry using DPSS laser ( = 532 nm) as excitation source, and the beam was focused to a spot size of 1 m by 50x objective. Raman spectra were fitted with Lorenzian to determine peak positions and linewidth. Also, consistency of Raman modes for a particular thickness has been verified at different spots with similar contrast under optical microscope.
III Computational Details
All the spin-polarized calculations were performed within the framework of density functional theory (DFT) using the plane-wave technique as implemented in the Vienna Ab Initio Simulation Package (VASP) [33]. The generalized gradient approximation method (GGA) parameterized by the Perdew-Burke-Ernzerhof (PBE) was used to account for the exchange-correlation energy [34]. DFT+ method (Hubbard correction parameter) was used to account for the on-site coulomb repulsion and improve the description of localized Fe d-electrons in FePS3 systems with = 4.2 eV as recommended by the previous studies [22]. The projector augmented wave potential (PAW) was used to treat the ion-electron interactions. The DFT-D2 empirical correction method proposed by Grimme was applied to describe the effect of van der Waals interactions [35]. Structural optimization at a specific external pressure was performed by adding the required pressure to the diagonals of the stress tensor. In all computations, the kinetic energy cut-off is set to be 520 eV in the plane-wave expansion. All the structures were fully relaxed (both lattice constant and atomic position) using the conjugated gradient method and the convergence threshold was set to be 10-4 eV in energy and 0.01 eV/Å in force. The Brillouin zone was sampled using a 5×5×5 Monkhorst-Pack k-point mesh for geometry optimization of bulk FePS3 while a 5×5×1 Monkhorst-Pack grid was used for the thick and thin layered FePS3 [22] systems. A higher Monkhorst-Pack grid of 7×7×7 and 7×7×1 was used to calculate the electronic density of states (DOS) respectively for bulk and layered FePS3 systems. The Raman intensity for each mode was calculated using the following equation [36]
| (1) |
Where and are the mean polarizability derivative and the anisotropy of the polarizability tensor derivative respectively and can be written as
| (2) |
| (3) |
Where is the polarizability tensor and the respective derivatives are taken with respect to normal mode coordinate (Q), signifying the amount of displacement along one eigenvector of the system. The eigenvectors were obtained through direct diagonalization of the hessian matrix. (per volume) was calculated with the VASP simulation package using density functional perturbation theory [33] by displacing the atoms along the eigenvectors of each mode twice. was approximated as a finite difference quotient and hence the Raman intensity of the mode was found. All these calculations were performed using a python script [37] interfaced with VASP simulation code [33].
Bulk FePS3 was modelled considering the unit cell of monoclinic FePS3 (space group C2/m) consisting of 20 atoms with lattice parameters a = 5.95 Å, b = 10.30 Å, c = 6.72 Å. In order to model thick-layered FePS3, we considered a three-layered periodic slab with 60 atoms while the thin-layered surface was modelled with the single-layered periodic slab with 20 atoms. In the case of thick and thin-layered FePS3 surfaces, a vacuum layer of 20 Å was used in the direction perpendicular to the surfaces (along the Z-direction) to avoid spurious interactions between the slabs.
IV Results and Discussion
IV.1 Experimental Results
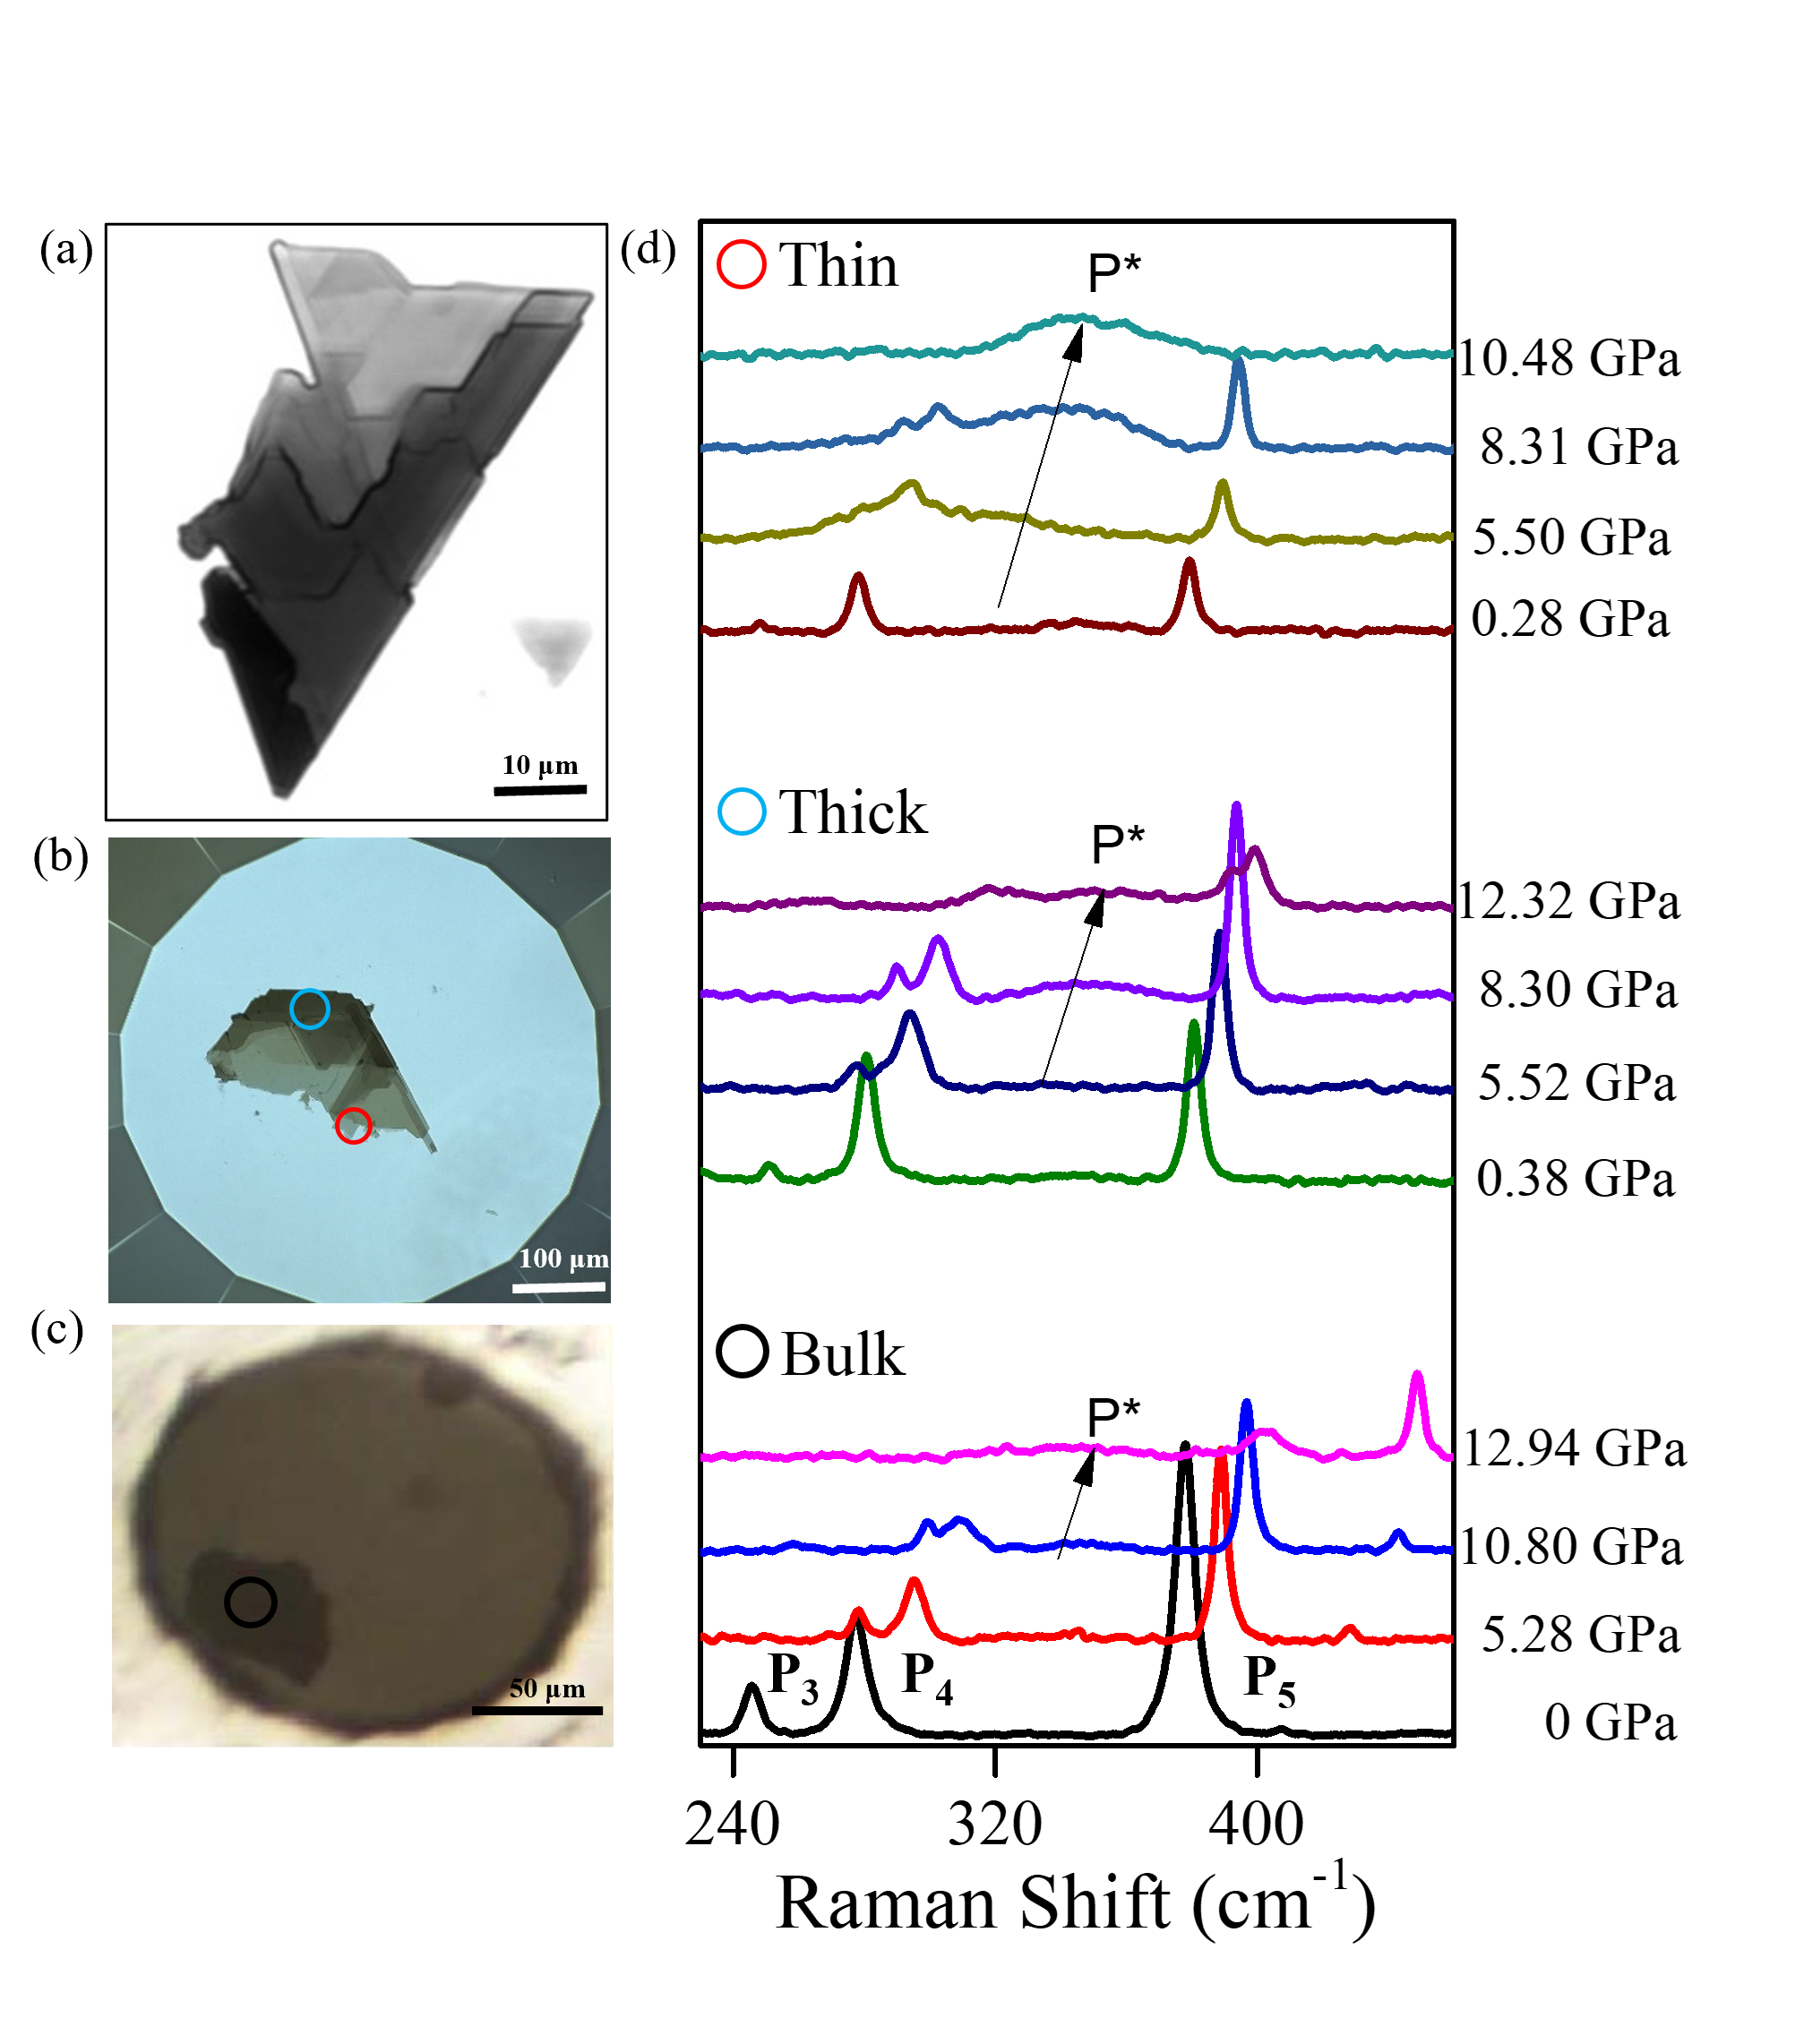
Three types of FePS3 samples were transferred on to the diamond culet. Fig. 1(c) depicts the image of the samples locked inside the gasket hole in the DAC. Substrate-free FePS3 samples were directly loaded into the DAC to investigate the intrinsic properties of the two dimensional system, minimizing the effect of strain, substrate-material charge transfer or optical interference. The measured Raman spectra at ambient condition from the three samples is plotted in Fig. S1 and is similar to the previous reports [22, 25, 38]. At ambient condition, bulk FePS3 adopts C2/m symmetry group, which has 30 vibrational modes at Brillouin zone center: =8Ag+6Au+7Bg+9Bu. Among these, Raman active Ag and Bg modes are observed in the Raman scattering experiment. Note that only seven Raman peaks have been detected from the bulk sample and six peaks from both thin and thick sample. Previous Raman scattering data on FePS3 as reported by Wang et al. [26] identified the phonon symmetries of the observed modes (Fig. S1) P1, P2 and P4 as Ag/Bg (156, 224 & 277 cm-1) and P3 and P5 as Ag (246 and 378 cm-1); these modes are due to molecular like vibration from (P2S6)4- bipyramid structure. The low frequency peak at 98 cm-1 and 156 cm-1 are from vibration including Fe atom and broadening of these modes are due to local fluctuation or disorder as suggested by Lee et al [22]. Another new weak peak detected form the bulk sample at 407 cm-1 (P6) was not reported in any of the studies. Earlier, a Raman peak at 480 cm-1 was reported by Scagliotti et al. [38] and assigned the mode as Ag mode which originates from P-P bond stretching of (P2S6)4- unit. We could not detect the 480cm-1 peak, also no other reference experimental study detected the concerned vibrational mode. Therefore, we may assign the observed new peak P6 at 407 cm-1 as Ag mode.
First, high pressure Raman measurement on layered FePS3 for three different layer numbers up to 20 GPa is reported in the rest of the paper. Fig. 1(d) depicts the pressure-dependent Raman spectra of the thin layer (3 layers), thick layer (30 layers) and bulk (more than 100 layers) FePS3 at room temperature. Approximate layer thickness has been determined from the intensity ratio of P4 and P5 modes. This has been reconfirmed by optical micrograph in transmission mode of the exfoliated samples on diamond culet where dark contrast indicate higher number of layers. In the bulk FePS3 Fig. 1(d), with increasing pressure, the Raman spectrum shows hardening of P3 to P6 upto 12.2 GPa. Note that P2 at 224 can not be detected with considerable clarity (Fig. S2). At 12.94 GPa, P3 and P4 vanishes. The intensity of P5 decreases and P6 becomes more intense. With application of pressure, all the detectable Raman peaks shifts to the higher frequencies because of the strengthening of intra-atom interactions under hydrostatic pressure. Unlike the other peaks, frequency shift of the mode at 98 with pressure has not been observed, rather a change in its shape is detected with the increasing pressure (Fig. S2). All the modes seem to be broadening with pressure above 10 GPa and P3 and P4 become difficult to be recognized beyond 12.2 GPa. The P5 mode is found to persist till 15 GPa with reduced intensity, whereas P6 peak is seen to dominate above 12 GPa and disappear at 17.4 GPa (Fig. S2). The pressure-induced line broadening for all the peaks, along with the complete loss of Raman intensity can be attributed to pressure driven metallization of FePS3. Alternative studies on bulk samples, like in the pressure-induced resistivity measurement, Haines et al. [27] found metallization of FePS3 at 5 GPa, whereas Tsurubayashi et al. [39] observed IMT at higher pressure, between 10 and 11 GPa. In the current study, from the Raman scattering data, it can be predicted that metallization in bulk FePS3 occurs around 10 GPa.
Further, X-ray diffraction study on bulk FePS3 by Haines et al. [27] suggested an alignment of vdW planes after metallisation, where Fe atoms directly comes above one another, and likewise for the P atoms. As a result, out-of-plane P6 vibrational mode originates from P-P bond stretching and becomes favorable in this pressure range. Also, the evolution of the peak at 98 under compression can be attributed to the gradual shift of the Fe atom in the hexagon plane with pressure during the alignment of vdW planes. Note that the Raman modes are well recovered below 12 GPa while releasing the pressure.
Concerning thick-layer FePS3 flake, all the characteristics Raman modes can be identified, except the P6 mode. Importantly, the Raman spectra exhibit same trend to that observed in the bulk sample. The spectra collected at different pressure from thick sample is depicted in Fig. 1(d). Similar to the bulk sample, broadening of all the Raman modes are observed above 10 GPa and all the modes vanish below 14 GPa. Thus, complete metallization of thick layered FePS3 occur at this pressure. A broad peak P∗ in the Raman spectra appears above 6 GPa between 310 and 370 which exist till complete metallization of the FePS3. While releasing the pressure,P5 peak is seen to appears at 10.23 GPa with the broad peak and persists till 5.72 GPa. All the modes are recovered at 3.6 GPa.
Unlike bulk or thick sample, for the thin-layered FePS3, only P3, P4 and P5 characteristic modes are present. The similar trend in peak shift has been observed with the increasing pressure, but noticeably, P3, P4 modes become broad and asymmetric above 2 GPa. The asymmetric line shape of the Raman spectra at the onset of metallization has also been observed for several other magnetic compounds [40, 41, 42]. The phenomenon is found to be associated with Fano resonance occurs at the beginning of metallization phase. Therefore, metallization of thin layer FePS3 begins below 2 GPa. The broad peak P∗ between 310 and 370 detected for the thick sample at 6 GPa and become prominent with the increase of pressure. This mode is also observed for the thin sample at above 1 GPa. The black arrow in Fig. 1(d) shows the development of the broad peak with the pressure. All the modes vanish at around 10 GPa, suggesting complete metallization of thin layer FePS3 at this pressure. The decrease of metallization pressure with the decreasing thickness suggests interlayer interactions of FePS3 opposing IMT. Out of plane vibration P6 which is prominent above 12 GPa in bulk sample, is not detected in thin and thick layered sample due to lower metallization pressure for these samples and the less number vdW plane. The P5 vibration mode is recovered with the decrease of pressure but broad peak exits upto 2 GPa. The sharp Raman peak from thin layer sample is recovered at 0.96 GPa.
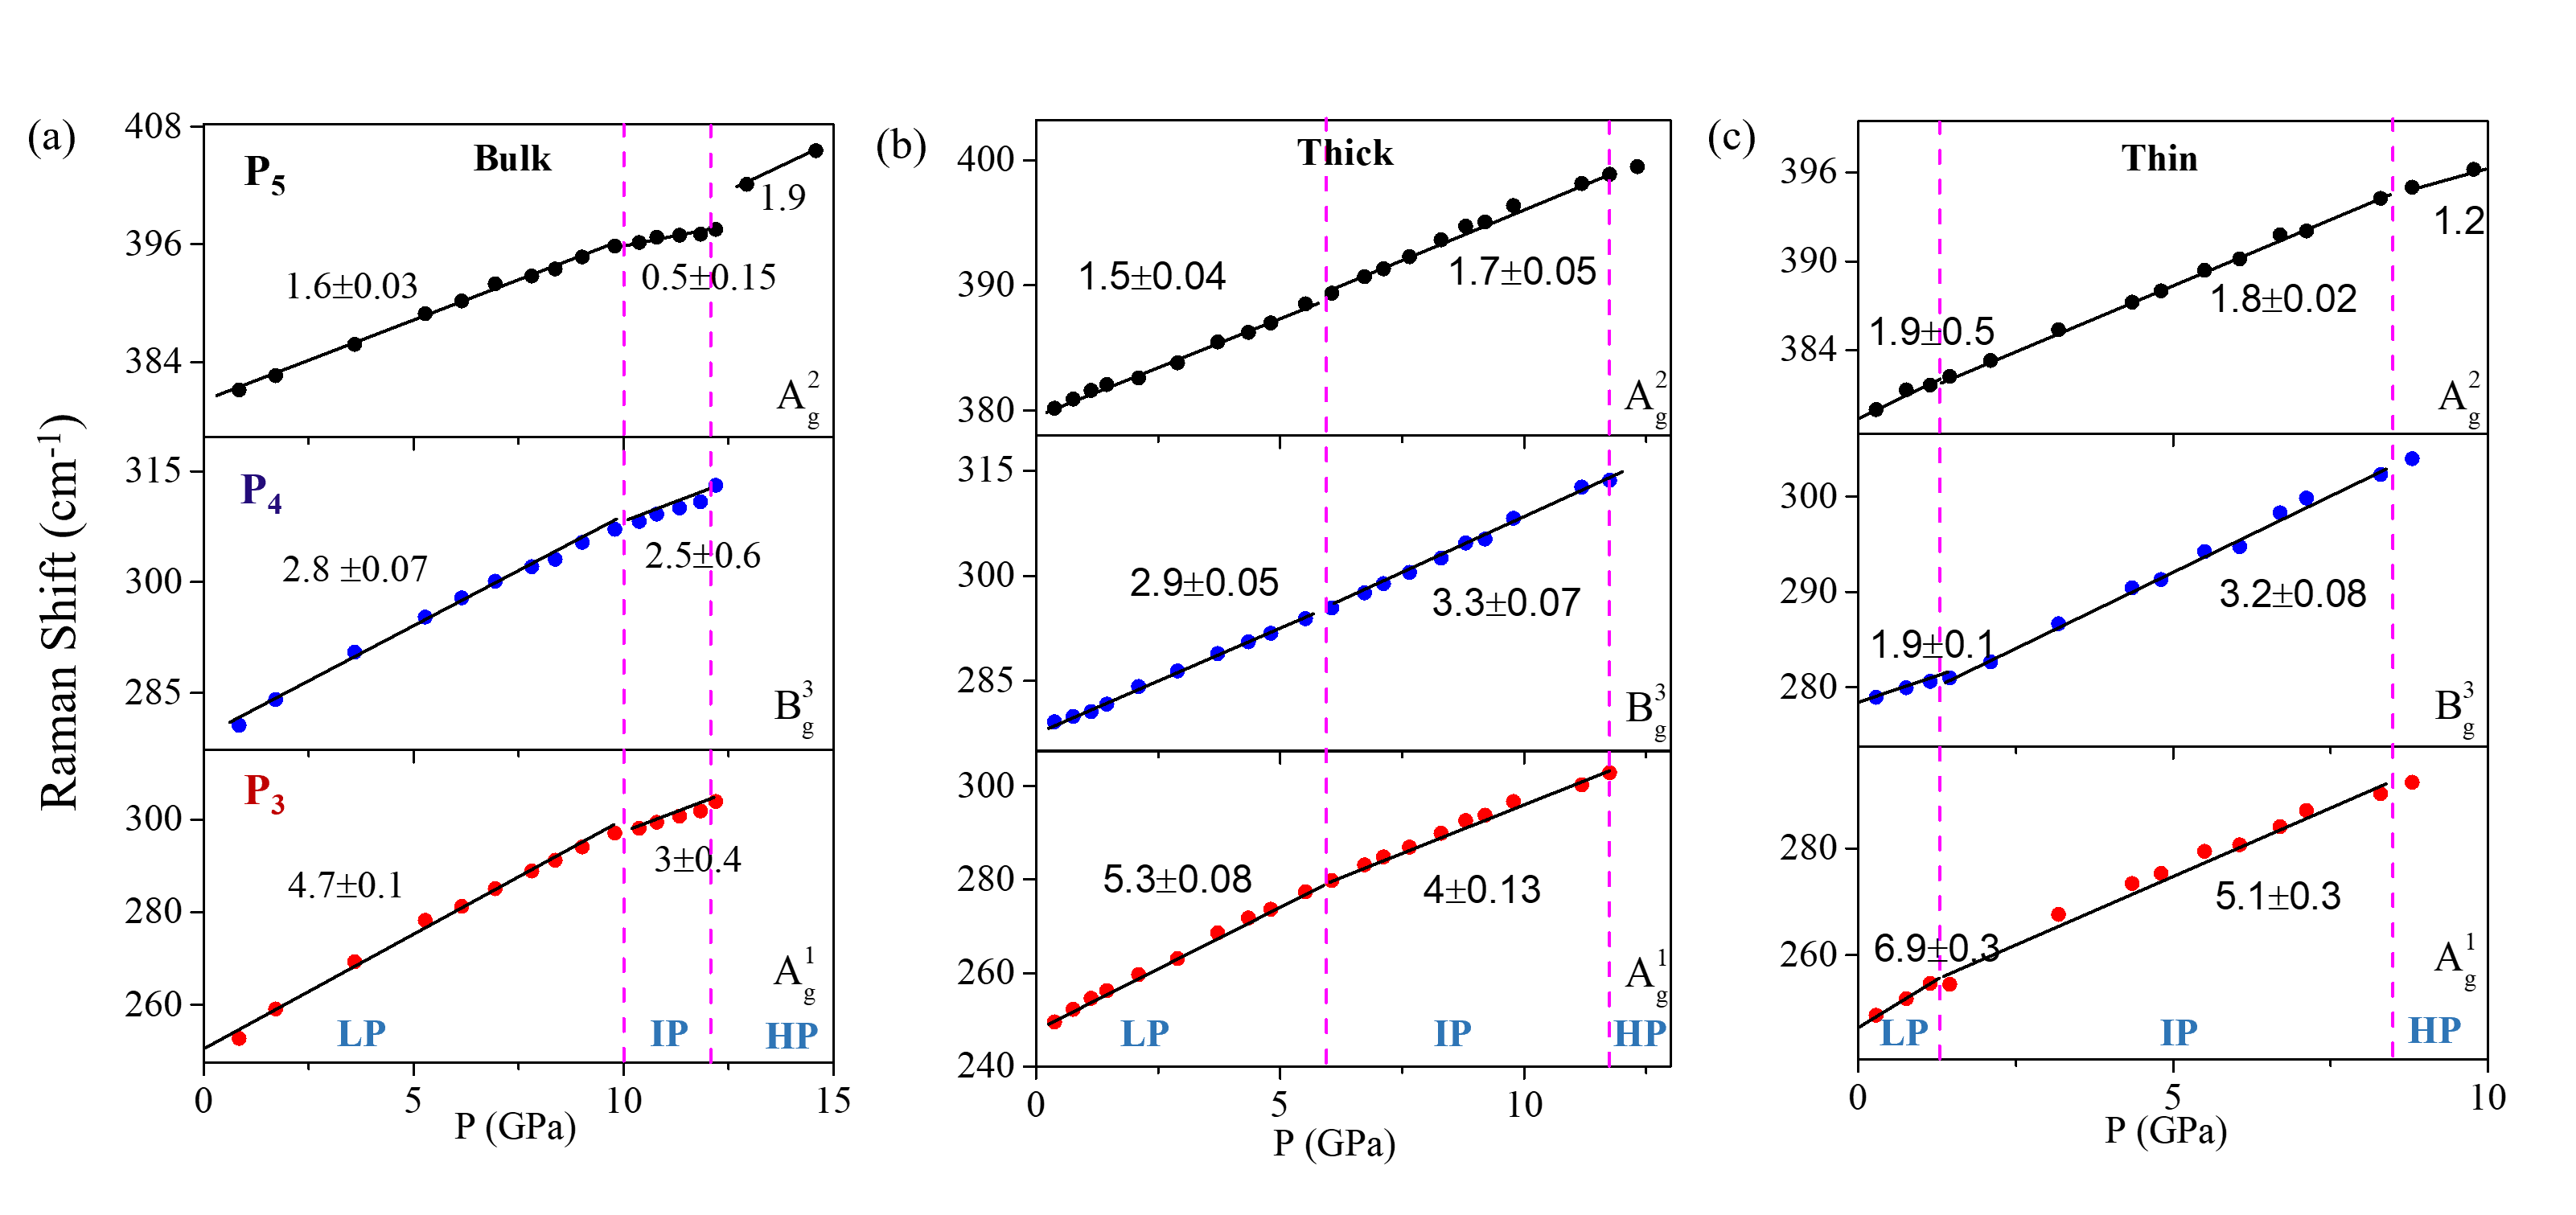
To study the pressure dependence of the Raman modes of the three samples, we fit each mode of the Raman spectra to Lorentzian line shape and plotted the positions of the peaks with pressure in Fig. 2(a), (b) & (c). The figures show the peak shift of the vibrational modes P3, P4 and P5 during compression cycle. The pressure dependence of the Raman modes for bulk, thick and thin layer of FePS3 indicates a slope change, which are distinct in three regions namely low pressure region (LP), intermediate pressure region (IP), and high pressure region (HP). These regions are defined differently for the three samples. The modes exhibit a linear increase in all the three regions and the rate of these linear blue shift with pressure is shown in Fig. 1(a), (b) & (c).
The rate of blue shift of the Raman modes is larger in thin layer FePS3 than in the thicker sample. A Similar trend is observed for graphene [43, 44] and TMDs [45] under pressure. This is because with the thin layer sample, there is less van der Waals plane to buffer the pressure, hence more pronounced hardening of the vibrations and higher rate of blue shift. The rate of increase of P3 mode with pressure is higher than P4 and P5 mode for all the considered cases. The different rate of pressure gradient of peak shift can be understood by analyzing the types of vibrations involve in these modes. The P3 breathing mode involve out of plane vibration of sulphur atoms, whereas P5 originates from symmetric stretching vibration of the P-S bonds and P4 mode corresponds to in-plane stretching of P2S6 cluster [38, 46]. With the increase of pressure, the out-of-plane P3 mode compression becomes more favourable than the in-plane P4 and P-S bonds stretching. The similar hardening of out of plane vibration with pressure is also evidenced in other van der Waals material. Further, in case of bulk sample separation between P5 and P6 increases with the pressure as hydrostatic pressure strengthen out of plane P-P stretching P6 vibration.
In our Raman measurement, broad Raman scattering peaks are detected from all the three FePS3 samples between 300 and 370 Fig. 1(d) and Fig. S2; the pressure at which the peak starts to appear are different for the three samples. For bulk FePS3 the broad peak is observed at 10.8 GPa, whereas for thick and thin layered sample the peak is detected at 6 GPa and 1.45 GPa respectively; which is at beginning of the IP region for all three cases. To the best of our knowledge, this broad peak have not been reported in any of the previous Raman studies of FePS3 and linewidth of this peak is several times larger than those of the observed phonon modes. The black arrow in Fig. 1(d) and Fig. S2 shows the development of the broad peak with the increasing pressure. The development of this peak is prominent for thick and thin layered sample but not clearly detected for bulk sample. To understand the appearance of P∗, first principle calculation together with computation of Raman spectra was carried out for the bulk, 3-layered and mono-layered FePS3 which will be discussed in details in the next section.
IV.2 Computational Results
To rationalize the pressure-driven electronic phase transition (metal-insulator) as well as spin state transition, we have performed electronic structure calculations based on first-principles density functional theory (DFT) using Vienna Ab Initio Simulation Package (VASP).
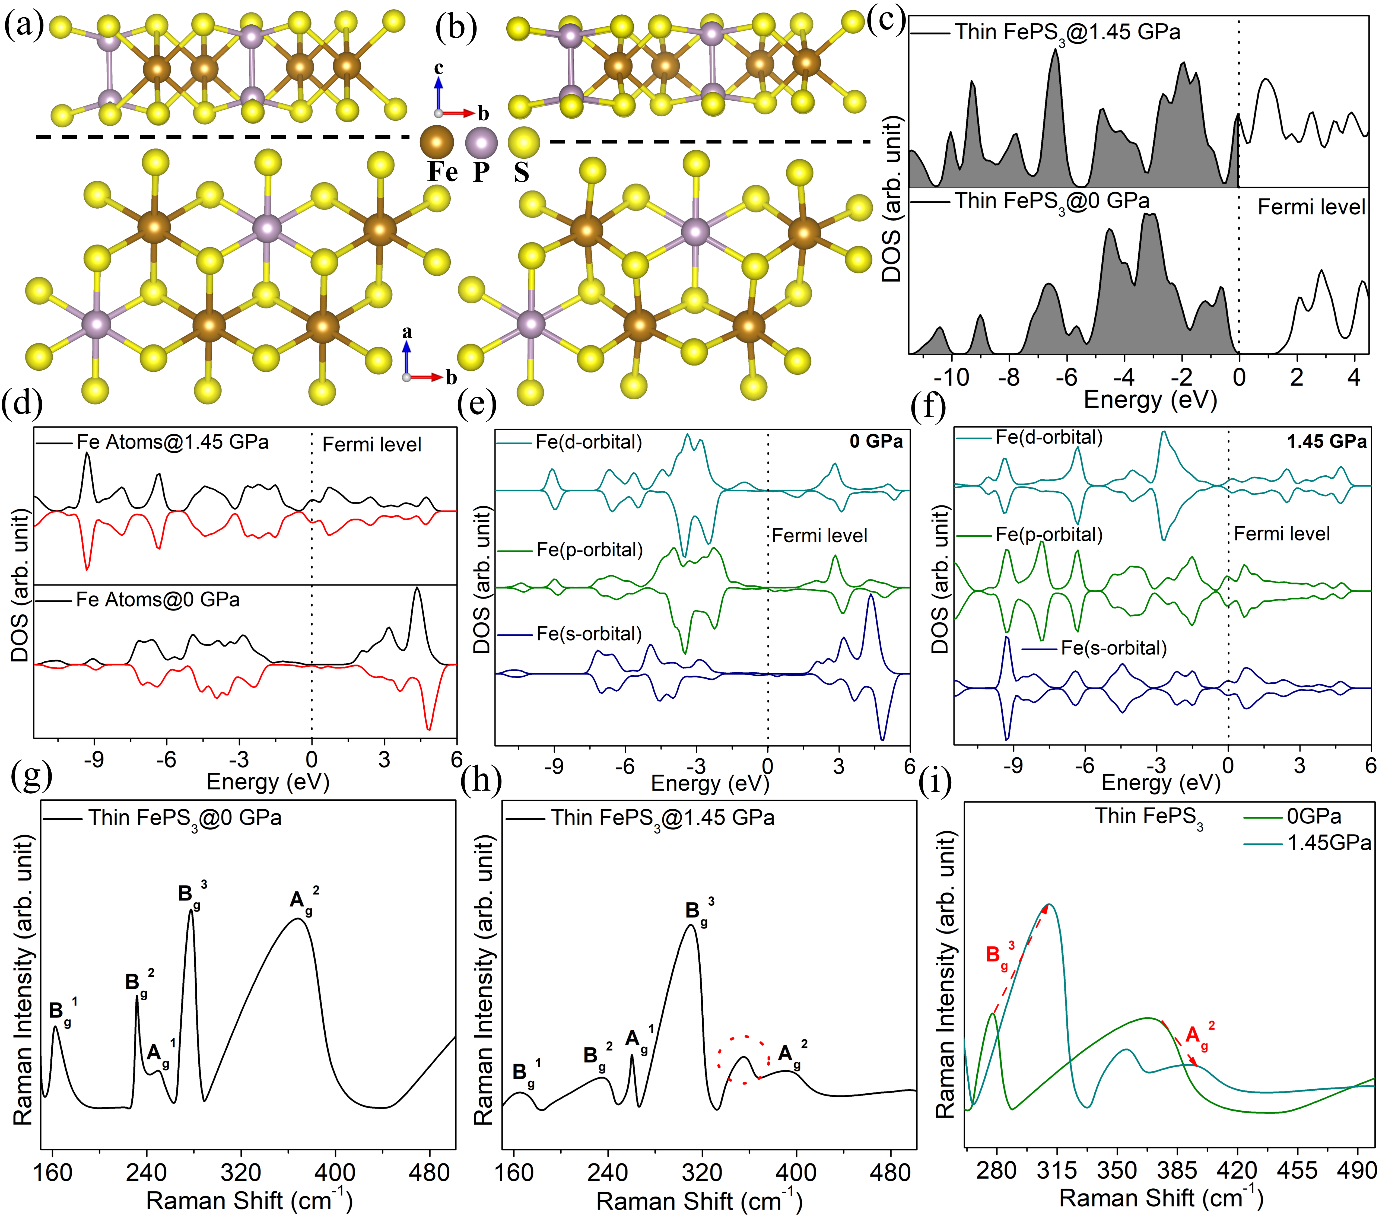
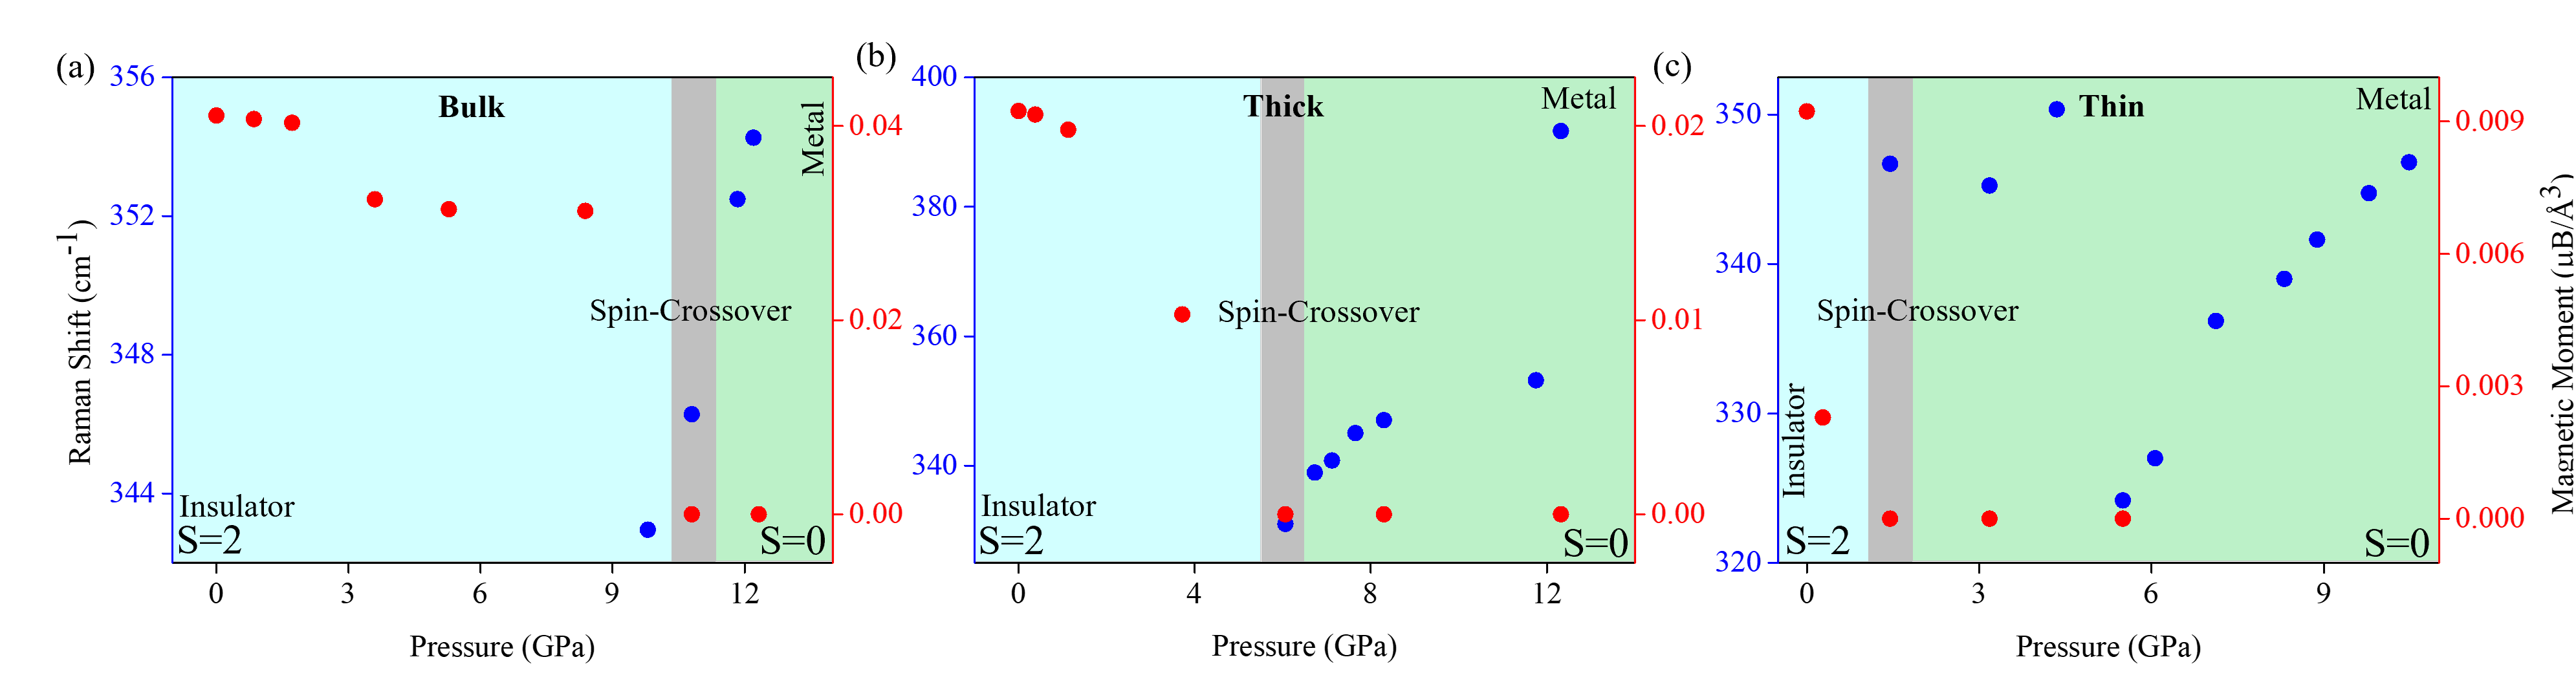
The in-plane lattice parameters (a and b), the distance between Fe atoms, and bond length between Fe and S atoms as well as P atoms are 5.88 (a), 10.19 (b), 3.40, 2.50 and 2.20 Årespectively at P = 0 GPa. The in-plane lattice parameters as well as interatomic distances decrease as pressure increases (Fig. S1(a) and Table S1). In addition, the calculated magnetic moment of Fe atom (3.34 B) at 0 GPa [22, 47, 48] indicates that Fe2+ ions in bulk FePS3 are in a high spin state (S = 2) while the gradual increase of external pressure on FePS3 leads to spin-crossover from high spin (HS) to low spin (LS) where S = 0. This spin-state transition can be overwhelmingly observed from the calculated magnetic moment value which decreases with the increase in pressure and finally becomes 0.00 B/Fe atom at the spin-state transition pressure of 10.80 GPa (Table S1).
Bulk FePS3 at 10.80 GPa undergoes a considerable decrease of in-plane lattice parameters (a = 5.65 Å, b = 9.75 Å), specially Fe-S distance indicating strain induced lattice deformation and structural transition (Fig. S3(b) and Table S1).
Interestingly, this spin-state transition phenomenon is also associated with the electronic phase transition of bulk FePS3 from insulator to metal. Density of states (DOS) analysis shown in Fig. S3(c) vividly exhibits that bulk FePS3 at 0 GPa is an insulator with a band gap () of 1.3 eV while the band gap narrows down with the increase of pressure and finally transforms into a metallic phase ( = 0.00 eV) at 10.80 GPa indicating insulator to metal phase transition (as the PBE functional highly underestimates the band gap [49], band gaps were not determined from band structure calculation). Besides, the local and projected density of states (LDOS and PDOS) analysis further justifies pressure-driven spin-crossover in bulk FePS3. At P = 0 GPa, both the LDOS and PDOS of Fe atom demonstrate the asymmetric nature of electron density of states for up and down spin while at transition pressure of 10.80 GPa, the nature eventually transforms to symmetric indicating complete spin ordering with the transition of spin state (Fig. S3(d-f)).
Further, we have computed Raman spectra to probe spin-state in FePS3 unveiling the structure-property relationship between pressure-driven structures with different Raman modes (Ag and Bg). Bg modes at 237 and 262 cm-1 along with Ag modes at 253 and 392 cm-1 are due to molecular-like vibrations from [P2S6]4- bipyramidal units whereas the low-frequency peak at 165 cm-1 is indicative of vibrations from Fe atoms (Fig. S3(g)). Besides, broad high-frequency Ag mode in the range 330-450 cm-1 also has the contribution from P-P bond stretching of [P2S6]4- originating peak at 410 cm-1. Shifting to higher frequencies as well as broadening of Raman peaks (Fig. S3(h-i)) with the increase of pressure suggests the strengthening of interatomic interactions which is evident from interatomic distances (Table S1). Interestingly, higher frequency Ag mode at 410 cm-1 gets shifted to 442 cm-1 and becomes more intense and distinct at the transition pressure (10.80 GPa) which vividly suggests that P-P bond stretching becomes more favorable at this pressure. Besides, the broadening and shifting of Raman peaks, two new peaks generate at 326 and 342 cm-1 due to structural distortion arising from the shift of Fe atoms in the hexagonal plane along with P atoms resulting change in the alignment of van der Waals planes at transition pressure (Fig. S3(h)). This structural change of bulk FePS3, as well as generation of new Raman peaks above 10 GPa, is in line with the earlier studies [22, 27, 48, 50]. Hence, calculated Raman spectra further correlate the structural transition of bulk FePS3 during spin state transition at 10.80 GPa.
Similar pressure-induced lattice distortion, as well as structural transition, is also observed for the thick and thin-layer FePS3 (Figs. S4(b) and Fig. 3(b)). In the case of thick FePS3, both the interlayer separation as well as the interlayer distance between two Fe planes decrease with the increase of pressure and finally become 3.40 and 5.72 Årespectively (Fig. S4(b)). The abrupt change in in-plane lattice parameters and ditance of Fe-S has similary been observed here (Tasble S1). However, unlike bulk, thick and thin layer FePS3 demonstrate spin state transition accompanying insulator-metal transition at a relatively lower external pressure of 6.06 GPa and 1.45 GPa respectively (Table S1 and Figs. S4(c) and Fig. 3(c)). This reduction of transition pressure may be due to the gradual decrease of van der Waal planes from bulk to thick to monolayer FePS3 which indirectly justifies the opposing effect of interlayer interactions towards spin state and electronic phase transition in FePS3. DOS, LDOS and PDOS analysis further confirm the spin state and electronic phase transition in thick and thin layer FePS3 (Figs. S4(d-f) and Fig. 3(d-f)).
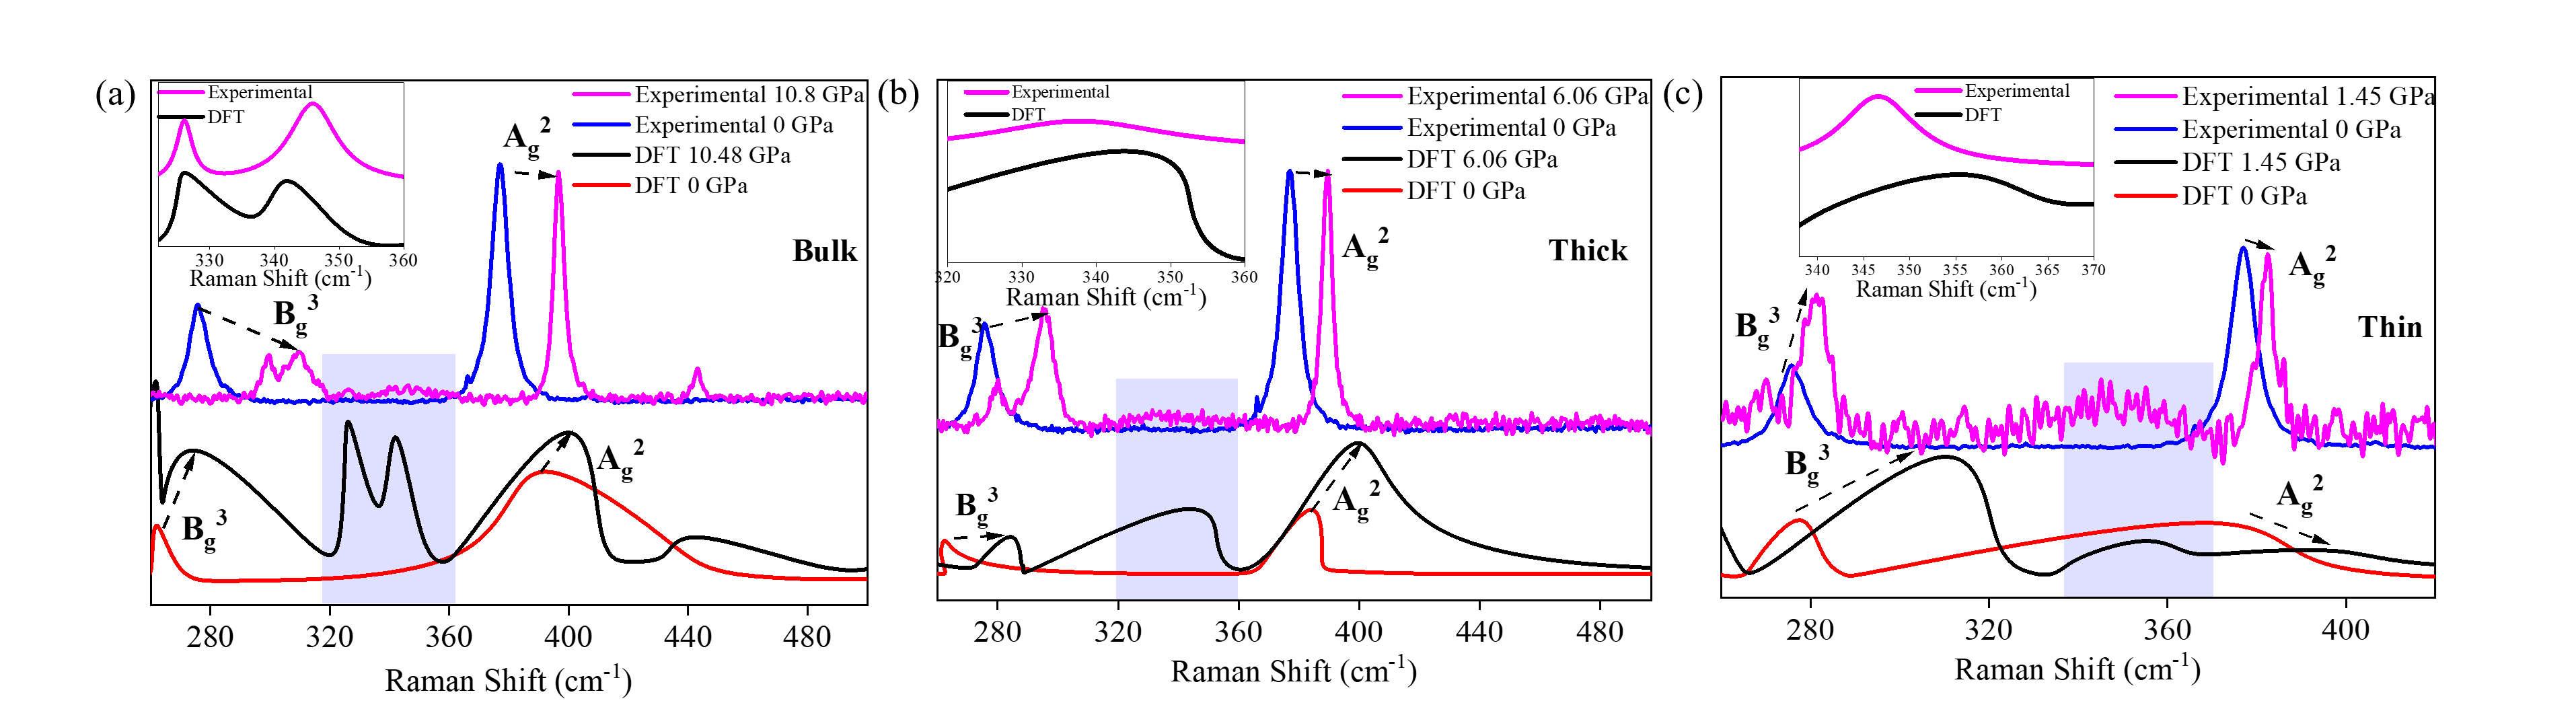
Both the thick and thin layer FePS3 exhibits similar Raman spectra except for higher frequency Ag mode beyond 410 cm-1 which is suppressed here in contrast to bulk FePS3 (Figs. S4(g) and Fig. 3(g)). Interestingly, unlike bulk, the thick and thin layer FePS3 shows larger peak width of Ag and Bg Raman modes with the order bulk thick thin. This is quite reasonable because in thin layer FePS3, the effect of external pressure resulting in structural disorders will be more pronounced and hence the extent of ordering will be shorter compared to thick and bulk structures [22]. It is noteworthy to mention that the pressure-dependent blue shift of Raman peaks is also well observed in thick and thin layer FePS3 (Figs. S4(h-i) and Fig. 3(h-i). However, the extent of blue shift of two high-frequency and Raman modes is higher in thin FePS3 compared to thick and bulk due to the presence of less van der Waals plane to buffer the pressure resulting in a higher rate of blue shift with hardening of vibrations. These changes in Raman spectra are in good agreement with the experimentally observed Raman modes. The comparison of the experimental and the computational Raman spectra at zero pressure and the critical pressure i.e. at the onset of intermediate pressure zone, reveals the evolution of P∗ in Fig. 4. The spin state transition is accompanied by the evolution of P∗ as evidenced by the collapse of calculated magnetic moment per unit volume for Fe2+ ion (Fig. 5) at the intermediate pressure zone.
Using current computational studies and previous works on the same sample, three distinct zones can be detected via Raman spectroscopy. The pressure-driven spin-crossover of the Fe2+ ion from S = 2 () to S = 0 () in the computational studies predicts an enchantment of d-p metal-ligand hybridization almost at the onset of IP region. The IP region might be viewed as the beginning of the metallic phase . The spin-crossover also tends to be progressive with the decreasing layer numbers, and accordingly, metallic behaviour is introduced gradually for the few-layer flakes. However, this situation also involves a structural change. In contrast to out-of-plane collapse, weak vdW force favours slippage between layers [28]. A sudden slippage among the layers takes place where the crystallographic -axis will become perpendicular to the a-axis and Fe atoms in one layer are placed on another layer [27]. It may be anticipated that this particular sliding will require higher pressure for a large number of layers. Because of this, as the number of layers decreases, the transition pressure for the initial structural phase transition that leads to the formation of the new peak will also decrease. Moreover, the IP region could be considered to be a bad metal, as Kim et al. predicted [51]. It has been proposed that the IMT is mediated in the IP zone by orbital of Fe2+ ion, leaving gapped. At the beginning of the HP zone, an experimentally observed sudden volume collapse is accompanied by the creation of an in-plane Fe-Fe intermetallic bonding, which delocalizes electrons. Thus, complete metallization is occurring at this regime [26, 27].
.
IV.3 Discussion
From the macroscopic viewpoint, any 2D stacking can be conceptualized as thin sheets experiencing anisotropic strain under isotropic stress (see Fig. S5). In this configuration, each layer/sheet encounters same amount of force () along the transverse direction. On the other hand, the force () acting along the stairs will be equally distributed among all of the sheets (, is the number of sheets). As a result, when the same amount of force is applied in all the three directions, the out-of-plane strain will be thickness invariant, but the in-plane strain () will be larger with fewer sheets, since . Thus, it may be anticipated that any structural transition involving in-plane deformation will hold for a smaller number of sheets at a substantially lower external pressure. Importantly, our experimental results (see Fig. 2 for details) justify the above argument if we consider the first transition point for the FePS3 flakes which occurs at lower pressure (1.45 GPa for thin and 10.8 GPa for the bulk) for the thin layered samples. Furthermore, at a critical pressure the in-plane inter-atomic distance will be small enough to obtain substantial orbital overlap due to the effective high in-plane strain. As a result, it will also be projected that the transition from insulator to metal for thin layer will occur at a lower external pressure than that for the thick layer.
Further, to understand our results concerning the layer dependent phase transition, we attempt to predict the insulator-to-metal transition by adopting Hubbard model where the bandgap () between the upper and lower Hubbard subbands is ( is the onsite interaction and is the bandwidth). For strongly correlated Mott insulators, as in the case of FePS3, we may consider . Since bandwidth increases with the reduction of inter-atomic spacing, metallic behaviour could be observed in the Mott insulator () by lowering the inter-atomic distance. For strongly correlated multielectron system, is modulated by crystal-field splitting (), Hund’s exchange coupling () and orbital degeneracy, and conventionally replaced by . In our experiment, as reduction of inter-atomic distance occurs due to external hydrostatic Pressure (), we may consider , where is positive number, c is a constant and is the bandwidth at the ambient pressure. However, experimental data suggests that the transition pressure for IMT is decreasing with lowering the thickness or the layer number (). Therefore, can be expressed as , which may be assumed to scale as ( positive number). Note that, controls the rate of change of with pressure which is analogous to the experimental data, fitting well with the linear approximation for all three different thicknesses, but with different slopes (see Fig. 2). We believe that further analytical model is required to improve the microscopic picture which might be useful to correlate SCO and metallization.
V Conclusions
In conclusion, layer dependence of the critical pressure for the spin-crossover and the insulator-to-metal transition in a layered vdW magnet, FePS3, has been systematically investigated via micro-Raman spectroscopy, supported by the first-principle DFT calculations. From the Raman scattering data, three distinct pressure regimes can be identified by following the slopes of the characteristic phonon modes with pressure. Detailed analysis of the experimental results shows the SCO from a high (S = 2) to low spin state (S = 0) with a thickness dependent critical pressure () which reduces to 1.45 GPa in 3-layer flakes compared to 10.8 GPa for the bulk counterpart. In addition, an evolution of a broad peak (around 340 cm-1), detected in the intermediate zone, signifies SCO, as reflected in the computational studies. Though the disappearance of Raman modes in the experimental data indicates complete metallization at the high-pressure zone, computational studies suggest that IMT may be initiated with the metal-ligand charge transfer through spin-crossover at much lower pressure. A phenomenological model explained that sructurally anisoptropic FePS3 flake experiences more in-plane strain with decreasing layer numbers at a fixed pressure. Electronic Hubbard model where the layer number dependence in the form of power-law scaling, is introduced along with pressure in the bandwidth, suggests IMT at relatively low pressure for few-atomic layer flake. Possibility of realizing 1-2 GPa in functional vdW materials with interfacial adhesion may open up alternative strategies towards exploring novel phases in atomic-layer magnets for spintronic devices applications.
Acknowledgements.
The financial supports (fellowships) from IACS, DST-INSPIRE and CSIR-UGC are greatly acknowledged. SD acknowledges the financial support from DST-SERB grant No. CRG/2021/004334. SD also acknowledges technical research center, IACS. AD thanks SERB grant CRG/2020/000301 for partial funding. S.D., and B.M. conceived the project and designed the experiments. A.G., and S.M. prepared the samples and performed the initial characterization. B.M., S.D. and S.J. initiated the experiments at JNCASR taking inputs from C.N. Further, M.P., SDas, T.K. and S.M. carried out the pressure dependent studies at IACS and confirmed the results. All DFT calculations were performed by R.J. with the inputs from A.D. SDas and S.D. developed the analytical model. All authors discussed the results and actively commented on the manuscript written by M.P., B.M., R.J. and S.D.References
- [1] K. Mak, C. Lee, J. Hone, J. Shan and T. F. Heinz. Atomically Thin MoS2: A New Direct-Gap Semiconductor. Phys. Rev. Lett., 105, 136805, (2010).
- [2] Q. H. Wang, K. Kalantar-Zadeh, A. Kis, J. N. Coleman and M. S. Strano. Electronics and optoelectronics of two-dimensional transition metal dichalcogenides . Nat. Nanotechnol., 7, 699–712, (2012).
- [3] S. Tongay, J. Zhou, C. Ataca, K. Lo, T. S. Matthews, J. Li, J. C. Grossman and J. Wu. Thermally driven crossover from indirect toward direct bandgap in 2D semiconductors: MoSe2 versus MoS2. Nano Lett., 12, 5576–5578, (2012).
- [4] S. Dai, Z. Fei, Q. Ma, A. S. Rodin, M. Wagner, A. S. McLeod, M. K. Liu, W. Gannett, W. Regan, K. Watanabe, T. Taniguchi, M. Thiemens, G. Dominguez, A. H. C. Neto, A. Zettl, F. Keilmann, P. Jarillo-Herrero, M. M. Fogler and D. N. Basov. Tunable phonon polaritons in atomically thin van der Waals crystals of boron nitride . Nano Lett., 343, 1125, (2014).
- [5] Y. Liu, X. Hua , C. Xiao, T. Zhou, P. Huang, Z. Guo, B. Pan and Y. Xie. Heterogeneous Spin States in Ultrathin Nanosheets Induce Subtle Lattice Distortion To Trigger Efficient Hydrogen Evolution. J. Am. Chem. Soc., 138, 5087 (2016).
- [6] A. P. Nayak, T. Pandey, D. Voiry, J. Liu, S. T. Moran, A. Sharma, C. Tan, C. Chen, L. Li, Ma. Chhowalla, J. Lin, A. K. Singh, and D. Akinwande. Heterogeneous Spin States in Ultrathin Nanosheets Induce Subtle Lattice Distortion To Trigger Efficient Hydrogen Evolution. Nano Lett., 15, 346 (2015).
- [7] Z. Chi, X. Zhao, H. Zhang, A. F. Goncharov, S. S. Lobanov, T. Kagayama, M. Sakata and Xiao-Jia Chen. Pressure-Induced Metallization of Molybdenum Disulfide. Phys. Rev. Lett., 113, 036802 (2014).
- [8] A. K. Geim and I. V. Grigorieva. Van der Waals heterostructures. Nature, 499,419–425 (2013).
- [9] K. S. Novoselov, A. Mishchenko, A. Carvalho and A. H. C. Neto. 2D materials and van der Waals heterostructures. Science, 353(6298), 9439 (2016).
- [10] S. A. Wolf, D. D. Awschalom, R. A. Buhrman, J. M. Daughton, S. von Molnár, M. L. Roukes, A. Y. Chtchelkanova and D. M. Treger. Spintronics: A Spin-Based Electronics Vision for the Future. Science, 294,1488–1495 (2001).
- [11] T. Jungwirth, X. Marti, P. Wadley and J. Wunderlich. Antiferromagnetic spintronics . Nat. Nanotechnol. , 11, 231-241 (2016).
- [12] H. Ito, T. Asai, Y. Shimizu, H. Hayama, Y. Yoshida, and G. Saito. Pressure-induced superconductivity in the antiferromagnet -(ET)2CF3SO3 with quasi-one-dimensional triangular spin lattice. Phys. Rev. B , 94, 020503(R) (2016).
- [13] Y. Ma, Y. Dai, M. Guo, C. Niu, Y. Zhu and B. Huang. Evidence of the existence of magnetism in pristine VX2 monolayers (X = S, Se) and their strain-induced tunable magnetic properties . ACS Nano, 6, 1695 (2012).
- [14] S. Lebegue, T. Bjorkman, M. Klintenberg, R. M. Nieminen and O. Eriksson. Two-Dimensional Materials from Data Filtering and Ab Initio Calculations. Phys. Rev. X, 3, 031002 (2013)
- [15] N. Sivadas, M. W. Daniels, R. H. Swendsen, S. Okamoto and Di Xiao. Magnetic ground state of semiconducting transition-metal trichalcogenide monolayers. Phys. Rev. B, 91, 235425 (2015).
- [16] H. L. Zhuang, Y. Xie, P. R. C. Kent and P. Ganesh. Computational discovery of ferromagnetic semiconducting single-layer CrSnTe3. Phys. Rev. B, 92, 035407 (2015).
- [17] W. Zhang,Q. Qu,P. Zhua and C. Lam. Robust intrinsic ferromagnetism and half semiconductivity in stable two-dimensional single-layer chromium trihalides. J. of Mat. Chem. C, 3, 12457(2015).
- [18] L. J. Sandilands, J. X. Shen, G. M. Chugunov, S. Y. F. Zhao, Shimpei Ono, Yoichi Ando and K. S. Burch. Stability of exfoliated Bi2Sr2DyxCa1-xCu2O8+δ studied by Raman microscopy. Phys. Rev. B, 82, 064503 (2010).
- [19] C. Kuo, M. Neumann, K. Balamurugan, H. J. Park, S. Kang, H. W. Shiu, J. H. Kang, B. H. Hong, M. Han, T. W. Noh and J.-G. Park. Exfoliation and Raman Spectroscopic Fingerprint of Few-Layer NiPS3 Van der Waals Crystals . Sci. Rep., 6, 20904 (2016).
- [20] Y. Tian, M. J. Gray, H. Ji, R. J. Cava and K. S. Burch. Magneto-elastic coupling in a potential ferromagnetic 2D atomic crystal. 2D Mater., 3(2),25035(2016).
- [21] K. Du, X. Wang, Y. Liu, P. Hu, M. I. B. Utama, C. K. Gan, Q. Xiong and C. Kloc. Weak Van der Waals Stacking, Wide-Range Band Gap, and Raman Study on Ultrathin Layers of Metal Phosphorus Trichalcogenides . ACS Nano, 10, 1738 (2016).
- [22] J. Lee, S. Lee, J. H. Ryoo, S. Kang, T. Y. Kim, P. Kim, C. Park, J.-G. Park and H. Cheong. Ising-Type Magnetic Ordering in Atomically Thin FePS3. Nano Lett., 16, 7433 (2016).
- [23] A. R. Wildes, V. Simonet, E. Ressouche, G. J. McIntyre, M. Avdeev, E. Suard, S. A. J. Kimber, D. Lançon, G. Pepe, B. Moubaraki and T. J. Hicks. Magnetic structure of the quasi-two-dimensional antiferromagnet NiPS3. Phys. Rev. B, 92, 224408 (2015).
- [24] Y. Sun, Q. Tan, X. Liu, Y. Gao and J. Zhang. Probing the Magnetic Ordering of Antiferromagnetic MnPS3 by Raman Spectroscopy. J. Phys. Chem. Lett. , 10, 3087 (2019).
- [25] X. Wang, K. Du, Y. Y. F. Liu, P. Hu, J. Zhang, Q. Zhang, M. H. S. Owen, X. Lu, C. K. Gan, P. Sengupta, C. Kloc and Q. Xiong. Raman spectroscopy of atomically thin two-dimensional magnetic iron phosphorus trisulfide (FePS3) crystals. 2D Materials, 3, 031009.(2016).
- [26] Y. Wang, J. Ying, Z. Zhou, J. Sun, T. Wen, Y. Zhou, N. Li, Q. Zhang, F. Han, Y. Xiao, P. Chow, W. Yang, V. V. Struzhkin, Y. Zha and H. Mao. Emergent superconductivity in an iron-based honeycomb lattice initiated by pressure-driven spin-crossover. Nature Communications, 9, 1914 (2018).
- [27] C. R. S. Haines, M. J. Coak, A. R. Wildes, G. I. Lampronti, C. Liu, P. Nahai Williamson, H. Hamidov, D. Daisenberger and S. S. Saxena. Pressure-Induced Electronic and Structural Phase Evolution in the van der Waals Compound FePS3. Phys. Rev. Lett., 121, 266801 (2018).
- [28] P. Ci, Y. Chen, J. Kang, R. Suzuki, H. S. Choe, J. Suh, C. Ko, T. Park, K. Shen, Y. Iwasa, S. Tongay, J. W. Ager, L.-W. Wang, and J. Wu. Quantifying van der Waals Interactions in Layered Transition Metal Dichalcogenides from Pressure-Enhanced Valence Band Splitting. Nano Lett., 17, 8, 4982–4988 (2017).
- [29] I. Breslavetz, A. Delhomme, T. Pelini, A. Pawbake, D. Vaclavkova, M. Orlita, M. Potemski, M.-A. Measson and C. Faugeras. Spatially resolved optical spectroscopy in extreme environment of low temperature, high magnetic fields and high pressure. Rev. Sci. Instrum., 92, 123909 (2021).
- [30] A. Pawbake, T. Pelini, A. Delhomme, D. Romanin, D. Vaclavkova, G. Martinez, M. Calandra, M.-A. Measson, M. Veis, M. Potemski, M. Orlita and C. Faugeras. High-Pressure Tuning of Magnon-Polarons in the Layered Antiferromagnet FePS3. ACS Nano, 16, 12656–12665 (2022).
- [31] A. Ghosh, M. Palit, S. Maity, V. Dwij, S. Rana and S. Datta. Spin-phonon coupling and magnon scattering in few-layer antiferromagnetic FePS3. Phys. Rev. B , 103, 064431, (2021).
- [32] D Vaclavkova, M Palit, J Wyzula, S Ghosh, A Delhomme, S Maity, P Kapuscinski, A Ghosh, M Veis, M Grzeszczyk, C Faugeras, M Orlita, S Datta and M Potemski. Magnon polarons in the van der Waals antiferromagnet FePS3. Phys. Rev. B , 104, 134437, (2021).
- [33] G. Kresse and J. Hafner. Ab initio molecular dynamics for liquid metals. Phys. Rev. B, 47(1), 1993 (1993).
- [34] J. P. Perdew, K. Burke and M. Ernzerhof. Generalized gradient approximation made simple. Phys. Rev. Lett. , 77 (18), 3865 (1996).
- [35] S. Grimme. Semiempirical GGA‐type density functional constructed with a long‐range dispersion correction. J. Comput. Chem., 27(15), 1787-1799 (2006).
- [36] D. Porezag and M. R. Pederson. Infrared Intensities and Raman Scattering Activities Within Density Functional Theory. Phys. Rev. B , 54, 7830-7836 (1996).
- [37] P. Gain, R. Jana and A. Datta. Formation of Metallic Polyferrocene Chains under Pressure. J. Phys. Chem. A , 125, 3362-3368 (2021).
- [38] M. Scagliotti, M. Jouanne, M. Balkanski, G. Ouvrard and G. Benedek. Raman scattering in antiferromagnetic FePS3 and FePSe3 crystals. Phys. Rev. B, 35(13), 7097-7104 (1987).
- [39] M. Tsurubayashi, K. Kodama, M. Kano, K. Ishigaki, Y. Uwatoko, T. Watanabe, K. Takase1 and Y. Takano. Metal-insulator transition in Mott-insulator FePS3. AIP Advances, 8, 101307 (2018).
- [40] D. Marrocchelli, P. Postorino, D. Di Castro, E. Arcangeletti, P. Dore, M. Cestelli Guidi, S. Ray and D. D. Sarma. Pressure and temperature dependence of the Fano resonance in the Raman spectrum of A2FeMoO6 systems (A=Sr,Ca). Phys. Rev. B, 76, 172405 (2007).
- [41] J. L. Her, H. L. Liu, C. H. Shen, R. S. Liu and H. S. Sheu Effect of Ca doping on the optical properties of LaSrMn2O7. Journal of Applied Physics, 99, 1013905 (2006).
- [42] M. Baldini, V. V. Struzhkin, A. F. Goncharov, P. Postorino and W. L. Mao. Persistence of Jahn-Teller Distortion up to the Insulator to Metal Transition in LaMnO3. Phys. Rev. Lett., 106, 066402 (2011)
- [43] J. E. Proctor, E. Gregoryanz, K. S. Novoselov, M. Lotya, J. N. Coleman and M. P. Halsall High-pressure Raman spectroscopy of graphene. Phys. Rev. Lett., 80, 073408 (2009).
- [44] K. Filintoglou, N. Papadopoulos, J. Arvanitidis, D. Christofilos, O. Frank, M. Kalbac, J. Parthenios, G. Kalosakas, C. Galiotis and K. Papagelis. Raman spectroscopy of graphene at high pressure: Effects of the substrate and the pressure transmitting media. Phys. Rev. B, 88, 045418 (2013).
- [45] X. Cheng, Y. Li, J. Shang, C. Hu, Y. Ren, M. Liu and Z. Qi. Thickness-dependent phase transition and optical behavior of MoS2 films under high pressure. Nano Research, 11, 855 (2018).
- [46] M. Bernasconi, G. L. Marra, G. Benedek, L. Miglio, M. Jouanne, C. Julien, M. Scagliotti and M. Balkanski. Lattice dynamics of layered MPX3 (M=Mn,Fe,Ni,Zn; X=S,Se) compounds. Phys. Rev. B, 38, 12089(1988)
- [47] Y. Zheng, X.Jiang, X. Xue, J. Dai and Y. Feng. Ab initio study of pressure-driven phase transition in FePS3 and FePSe3. Phys. Rev. B , 100, 174102 (2019).
- [48] S. Das, S. Chaturvedi,D. Tripathy, S. Grover, R. Singh,D. V. S. Muthu, S. Sampath, U. V. Waghmare and A. K. Sood. Raman and frst-principles study of the pressure-induced Mott-insulator to metal transition in bulk FePS3. J. Phys. Chem. Solids, 164 , 110607 (2022).
- [49] R. Jana, C. Chowdhury and A. Datta. Transition-Metal Phosphorus Trisulfides and its Vacancy Defects: Emergence of a New Class of Anode Material for Li-Ion Batteries. ChemSusChem , 13, 3855 – 3864 (2020).
- [50] M. J. Coak, D. M. Jarvis,H. Hamidov, A. R. Wildes, J. A. M. Paddison, C. Liu, C. R. S. Haines,N. T.Dang, S. E. Kichanov, B. N. Savenko, S. Lee, M. Kratochvílová, S. Klotz, T. C.Hansen, D. P.Kozlenko,J.-G. Park and S. S Saxena,. Emergent Magnetic Phases in Pressure-Tuned van der Waals Antiferromagnet FePS3. Phys. Rev. X , 11, 011024 (2021).
- [51] M. Kim , H.-S. Kim, K. Haule and D. Vanderbilt Orbital-selective Mott phase and non-Fermi liquid in FePS3 Phys. Rev. B , 105, L041108 (2022).