Cross calibration of gamma-ray detectors (GRD) of GECAM-C
Abstract\\
The gamma-ray detectors (GRDs) of GECAM-C onborad SATech-01 satellite is designed to monitor gamma-ray transients all over the sky from 6 keV to 6 MeV. The energy response matrix is the key to do spectral measurements of bursts, which is usually generated from GEANT4 simulation and partially verified by the ground calibration. In this work, energy response matrix of GECAM-C GRD is cross-calibrated with Fermi/GBM and Swift/BAT using a sample of Gamma-Ray Bursts (GRBs) and Soft Gamma-Ray Repeaters (SGRs). The calibration results show there is a good agreement between GECAM-C and other reasonably well calibrated instrument (i.e. Fermi/GBM and Swift/BAT). We also find that different GRD detectors of GECAM-C also show consistency with each other. All these results indicate that GECAM-C GRD can provide reliable spectral measurements.
Keywords: GECAM-C; Cross calibration; Energy response matrix
1 INTRODUCTION
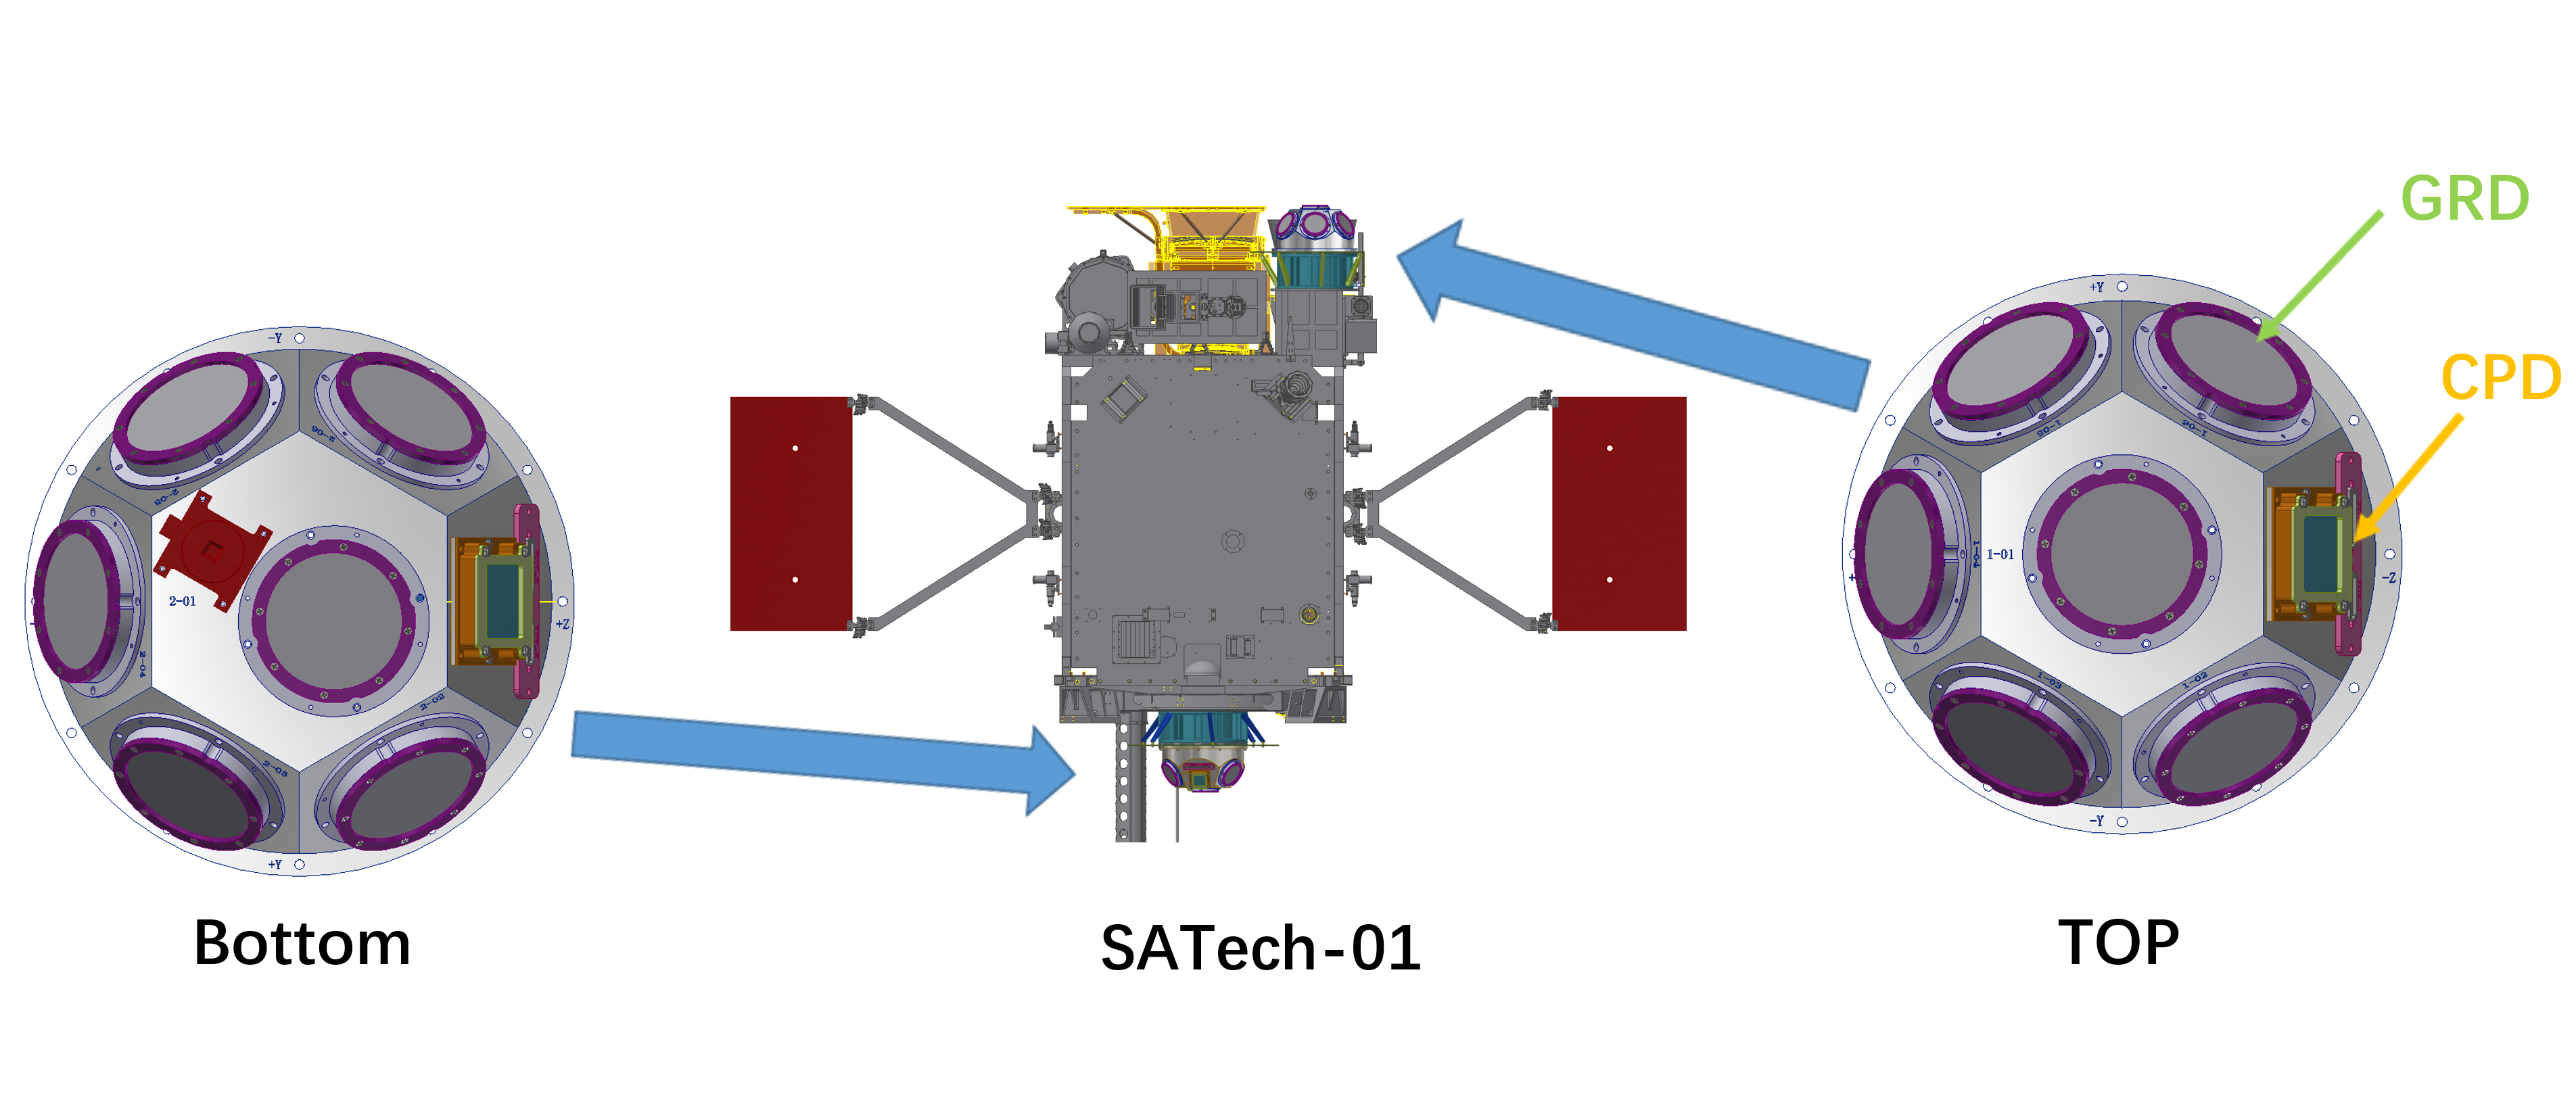
GECAM-C [1] (also called High Energy Burst Researcher, HEBS) is one of the payloads on the New Space Technology Test Satellite (SATech-01) launched on July 27,2022 [2]. It consists of two hemispherical domes, which follows the design of the Gravitational wave high-energy Electromagnetic Counterpart All-sky Monitor (GECAM) [3]. These two domes are installed on the top and bottom of SATech-01 satellite. There are six gamma-ray detectors (GRDs) [4] and one charge particle detector (CPD) [5] on each dome, therefore, GECAM-C has a total of 12 GRDs and two CPDs, as shown in Fig 1.
For each dome, there are two types of GRDs: the detectors composed of LaBr3 crtystals (LGRDs) and the detectors composed of NaI crystals (NGRDs). Both types of GRD are readout by SiPM array [6][7][1]. There are two types of readout case: the single channel and the dual channels (i.e. High-Gain and Low-Gain). All the basic information are listed in the Table LABEL:The_basic_information_of_GECAM-C. The designed energy range for LGRD is 10-332 keV for High-Gain channel and 122-4500 keV for Low-Gain channel, and for NGRD is 10-355 keV for High-Gain channel and 122-5889 keV for Low-Gain channel. But for the NGRD with single gain channel, its designed detection energy range is 10 to 700 keV.
The energy response matrix of the GECAM-C GRDs are generated from GEANT4 simulation, similar as the case for GECAM-A and GECAM-B [8]. The simulation results are partially validated using the ground calibration tests [9]. These help us to establish the response matrix for GECAM-C. In this paper, we focus on the cross-calibration of the response matrix through joint analysis with Fermi/GBM and Swift/BAT.
The basic information of GECAM-C
Detectors type
Electronic readout channel
Detector number
Detector orientations
(∘)
(∘)
Top dome cabin
LGRD
High-Gain and Low-Gain
GRD01
0
0
NGRD
High-Gain and Low-Gain
GRD02
60
210
LGRD
High-Gain and Low-Gain
GRD03
60
150
NGRD
High-Gain and Low-Gain
GRD04
60
90
LGRD
High-Gain and Low-Gain
GRD05
60
30
NGRD
Single
GRD06
60
330
CPD
Single
1-01C
60
270
Bottom dome cabin
LGRD
High-Gain and Low-Gain
GRD07
180
0
NGRD
High-Gain and Low-Gain
GRD08
120
150
LGRD
High-Gain and Low-Gain
GRD09
120
210
NGRD
High-Gain and Low-Gain
GRD10
120
270
LGRD
High-Gain and Low-Gain
GRD11
120
330
NGRD
Single
GRD12
120
30
CPD
Single
2-01C
120
90
The Detectors type means GRD composed of two crystals: LaBr3 and NaI;
High-Gain and Low-Gain mean the two read out channels;
Detector orientations mean the normal pointing of GRDs in the GECAM-C payload coordinate system.
2 JOINT SPECTRUM FITTING
Cross calibration is implemented by joint spectrum fitting of burst events that are observed by GECAM-C and other well-calibrated instruments (here we choose Fermi/GBM and Swift/BAT to do cross calibration). The correctness of the GECAM-C response matrix can be judged from the consistency of the fitting results. This method has been used in cross calibration of many instruments[10][11] .
In this paper, we will also multiply GECAM-C by a constant factor and the constant factor of reference instruments (i.e. Fermi/GBM or Swift/BAT) is fixed to one, and judge whether the response matrix of GECAM-C can well describe the scientific data of GECAM-C. In this section we will introduce the instruments used to perform the cross calibration as well as the analytical process and results.
2.1 Instruments
2.1.1 Fermi/GBM
As one of the two instruments on the Fermi Gamma-ray Space Telescope, Fermi Gamma-ray Burst Monitor (Fermi/GBM) is composed of NaI(Tl) detectors (8-1000 keV) and BGO detectors ( 200 keV to 40 MeV) [12]. From the detection energy range of Fermi/GBM, it is very suitable for the cross-calibration work with GECAM-C, because they have the same detection energy band. And the Fermi/GBM has been reasonably well calibrated [13][14][15].
2.1.2 Swift/BAT
The Swift Burst Alert Telescope (Swift/BAT) is one of the instruments on the Swift Gamma-ray Burst Explorer [16]. The detector of Swift/BAT is made of CdZnTe (CZT), and the detectable energy range is 15–150 keV [17], which can be used to cross-calibrate GECAM-C response matrix at the low-energy band. It is worth mentioning that the Swift burst usually has accurate location, which is very helpful for cross calibration.
| GRB Name | GRB 220921A | GRB 220930A |
|---|---|---|
| Trigger Time (UTC) | 2022-09-21T11:05:59.070 | 2022-09-30T11:11:52.000 |
| (Ra[∘],Dec[∘],error[′′]) | (66.47, -40.41, 3.8) | (64.72, 13.35, 2.2) |
| Time Interval (s) | [0,15] | [-2,8] |
| ([∘],[∘]) | (29.69, 34.07) | (141.52, 115.48) |
| Joint Instrument | Fermi/GBM (n2,na,b0,b1) | Swift/BAT |
| GECAM-C Detectors | GRD 01,04,05 | GRD 07,08,09 |
The time interval for joint calibration represent the selected time relative to Fermi/GBM trigger time;
Ra and Dec are the location of the GRB burst;
[∘],[∘] denote the incident angle of the source in the GECAM-C payload coordinate system;
GECAM-C Detectors mark the three brightest GRD detectors of GECAM-C used for calibration;
2.2 Jonit Analysis of GRBs
2.2.1 GRB 220921A
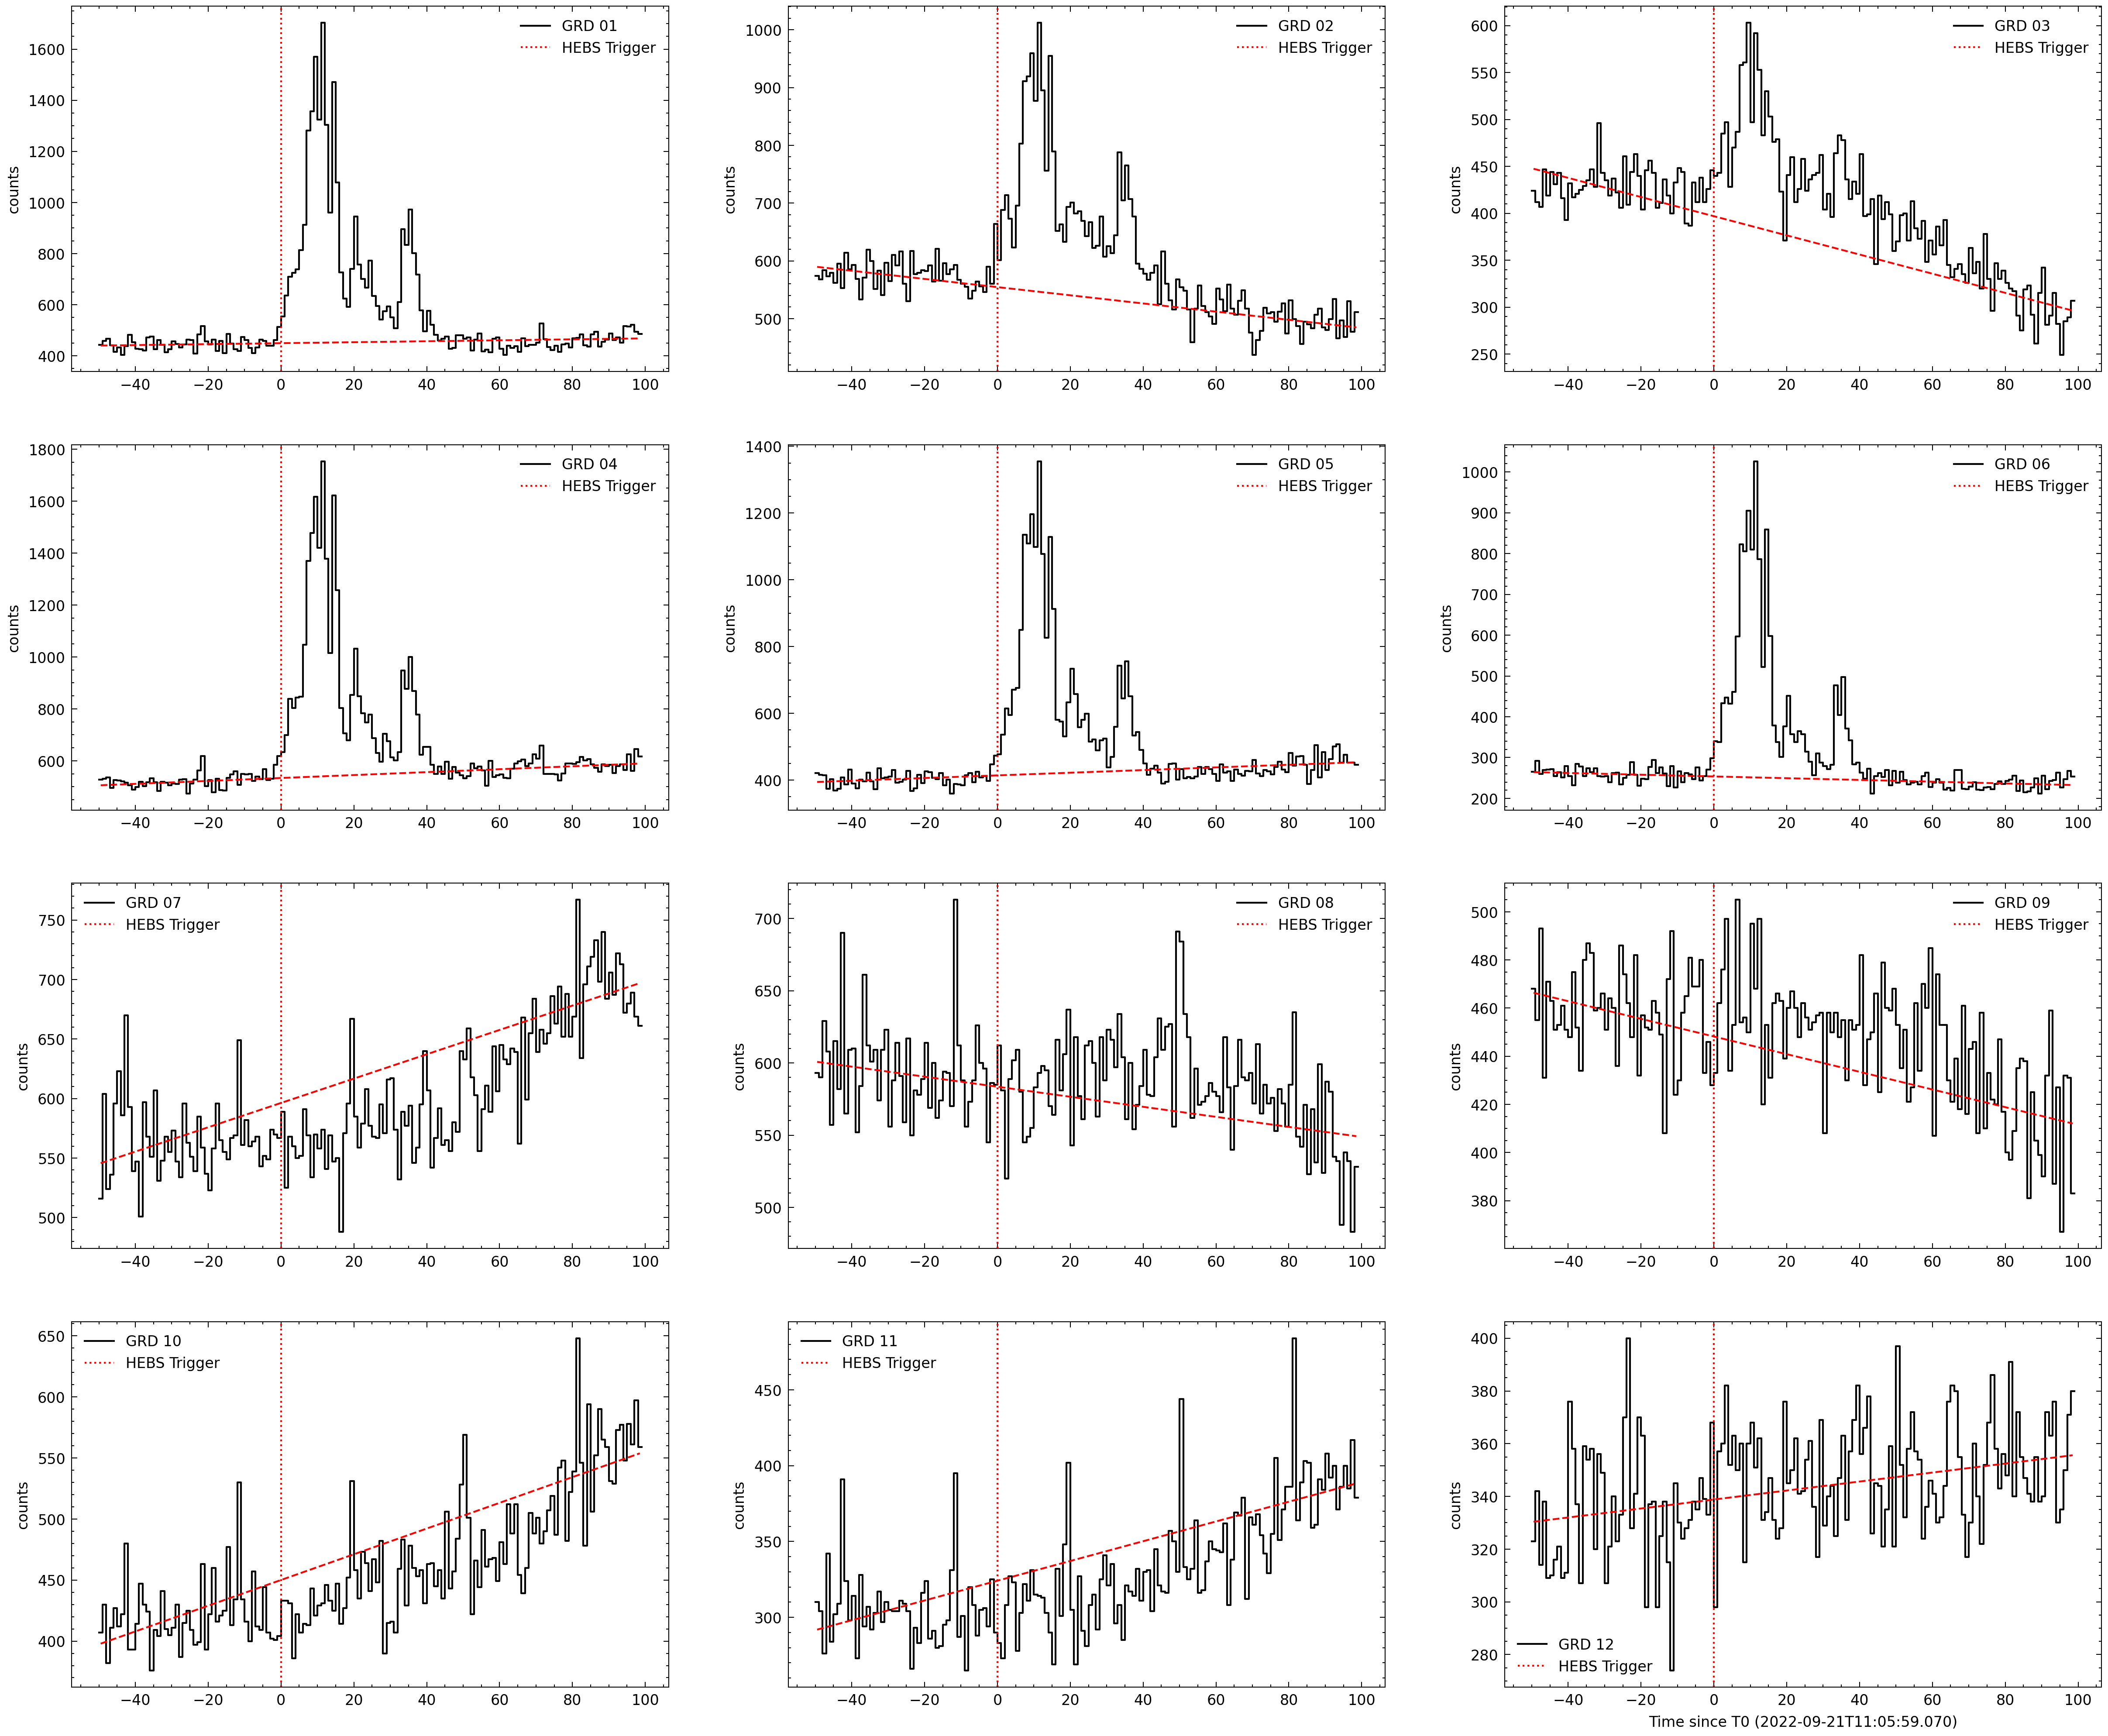
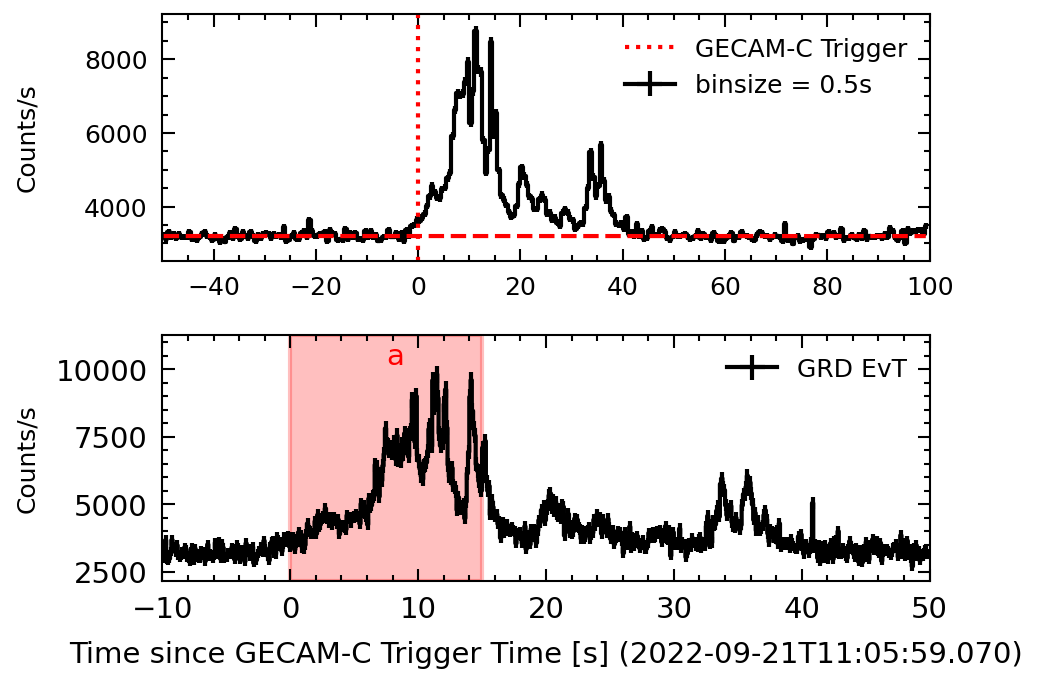
The trigger time of GRB 220921A111https://gcn.gsfc.nasa.gov/other/220921A.gcn3 is at 2022-09-21T11:05:59.070 (UTC), and this is the Fermi/GBM trigger time. The light curves detected by GECAM-C are shown in Fig 10. This burst is located at RA=66.47 deg, Dec=-40.41 deg, with an error of 3.8 arc seconds. It is worth mentioning that accurate location is beneficial to cross calibration, which can rule out the effect of inaccurate location on the response matrix. In addition, we used this burst to cross-calibrate Fermi/GBM and GECAM-C.
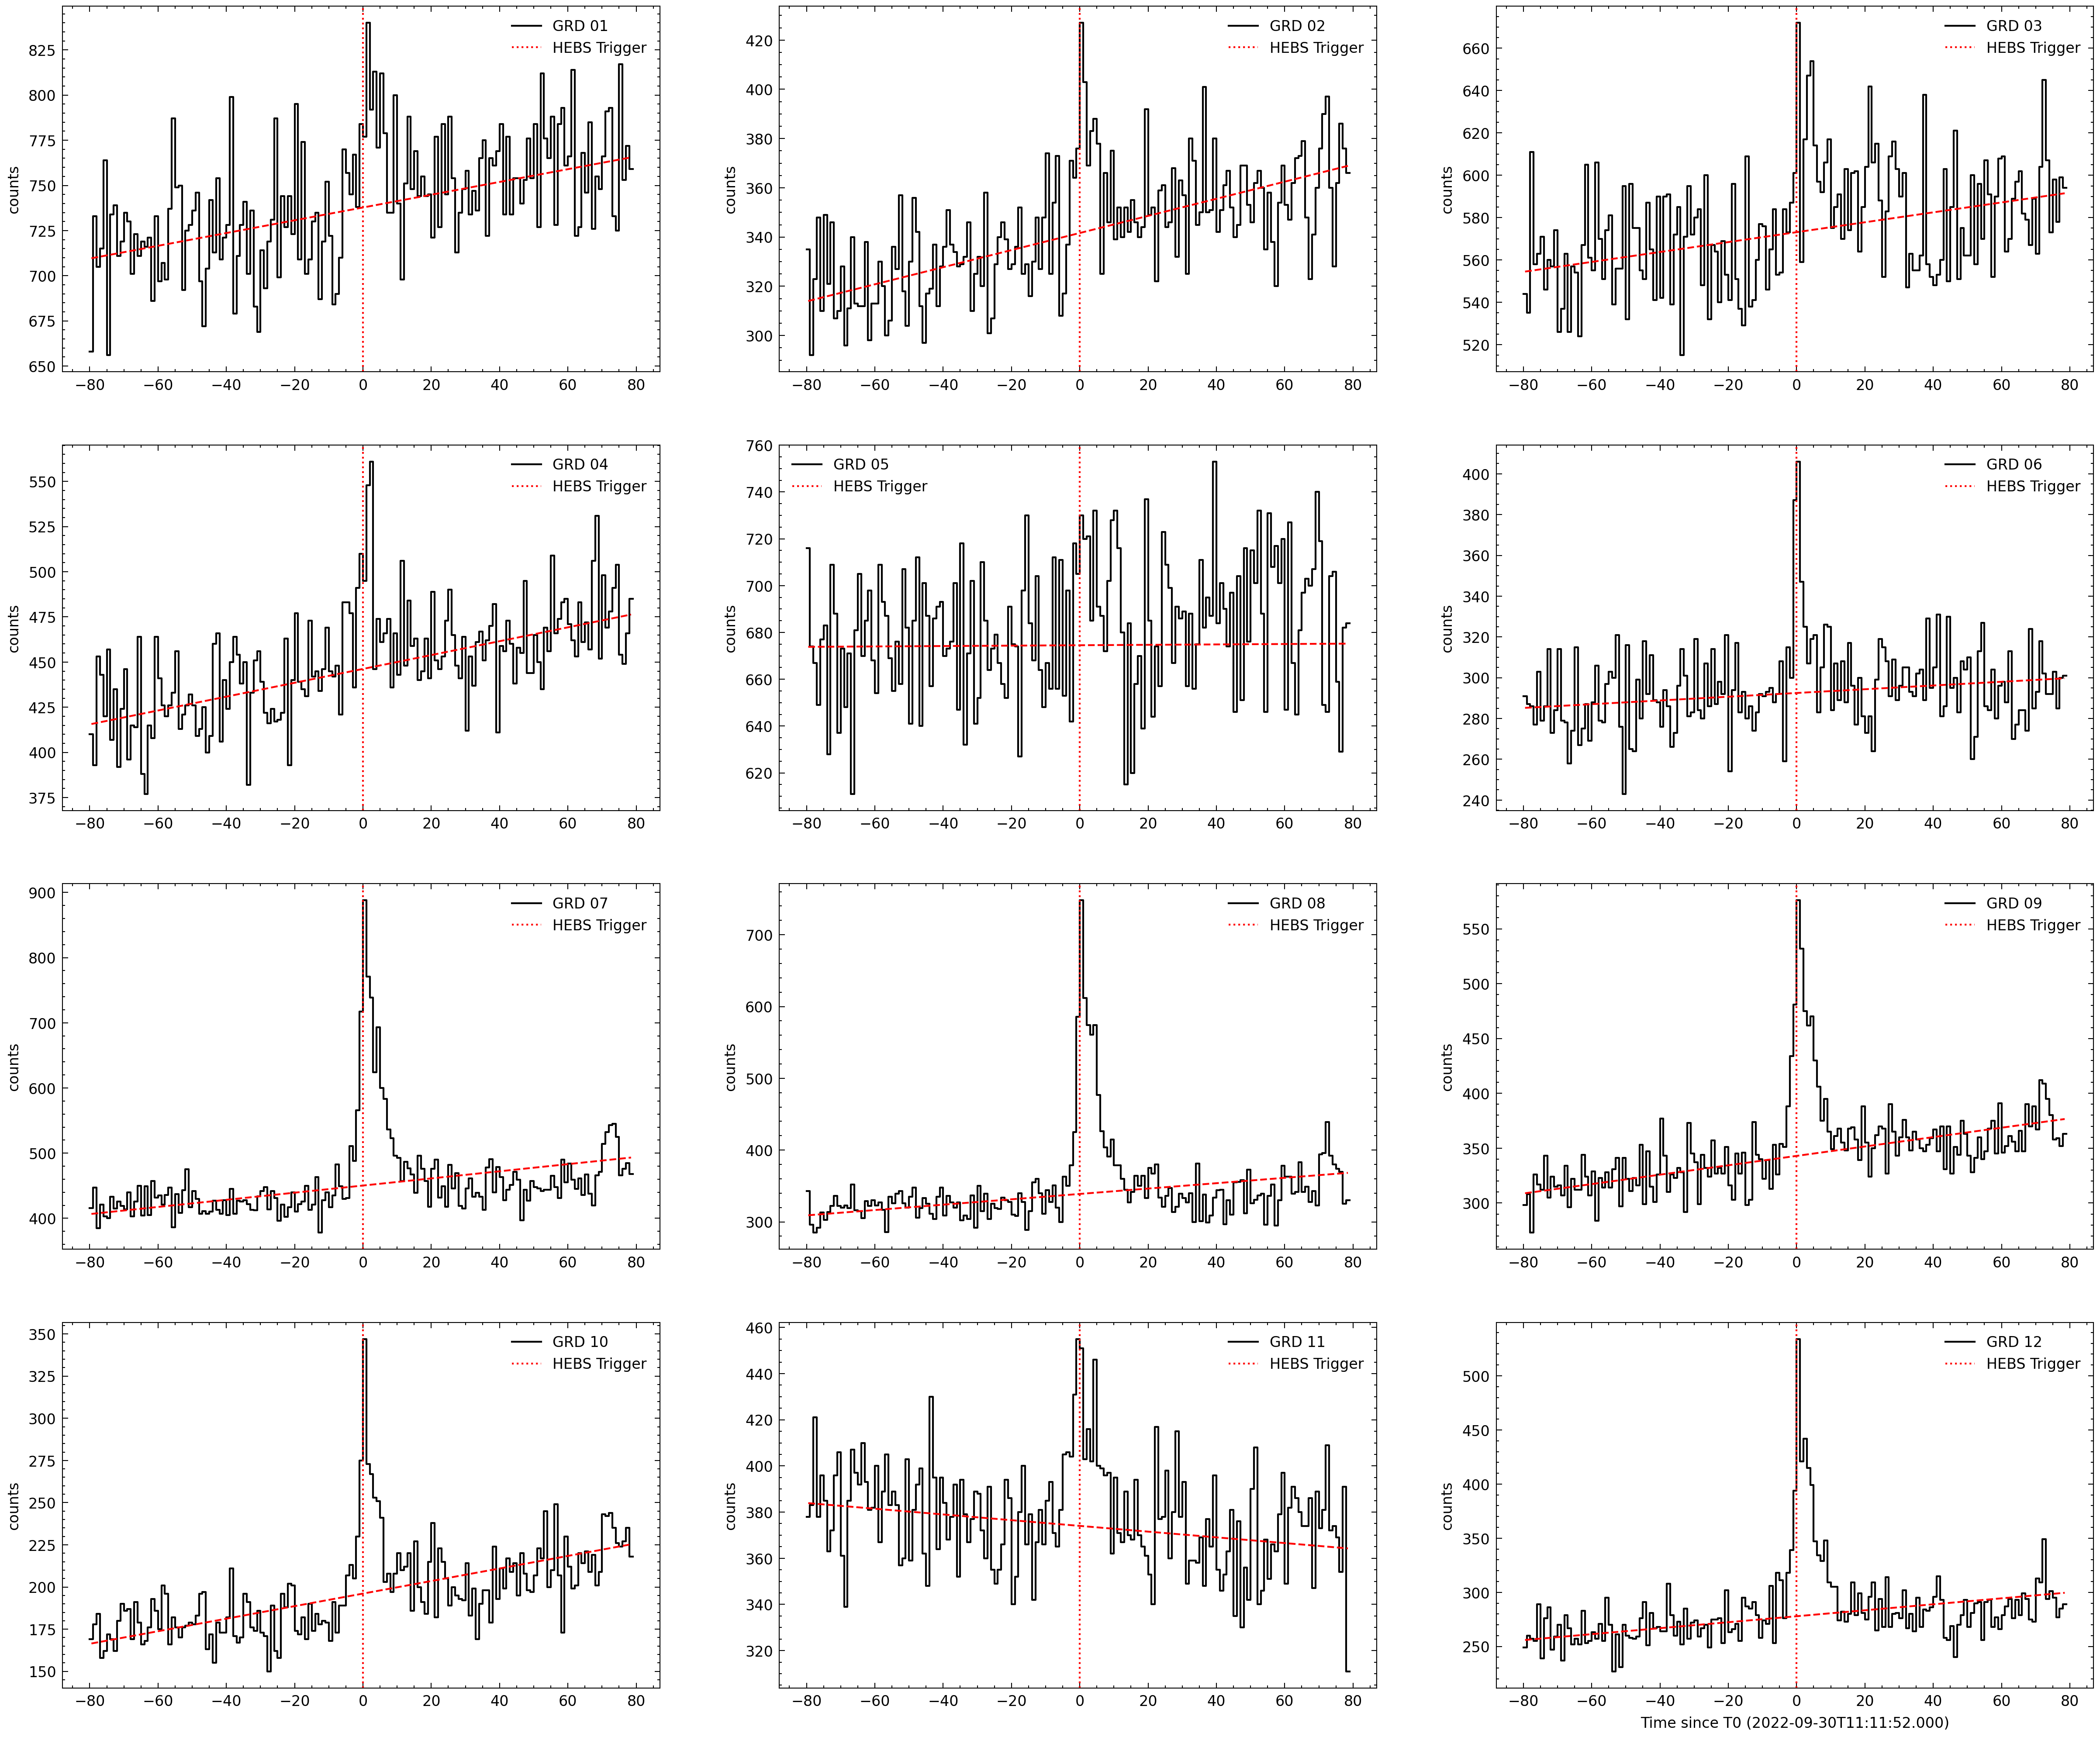
For this GRB, we choose the two NaI(Tl) of Fermi/GBM with highest count rate, respectively are n2 and na. According to the official example of an burst analysis: when we have chosen NaI(Tl) detectors between 0 and 5, we also select BGO0, and if we have chosen NaI detectors 6-11, we would use BGO1222https://fermi.gsfc.nasa.gov/ssc/data/analysis/scitools/rmfit_tutorial.html. Therefore, b0 and b1 all will be selected for GRB 220921A. In addition, as we can see from Fig 10, GRD01, GRD04 and GRD05 are the three brightest detectors. So we will use these detectors for joint calibration. All of this information can be found in the Table LABEL:Basic_information_of_the_GRB_sample, including the following GRB 220930A 333https://gcn.gsfc.nasa.gov/other/220930A.gcn3.
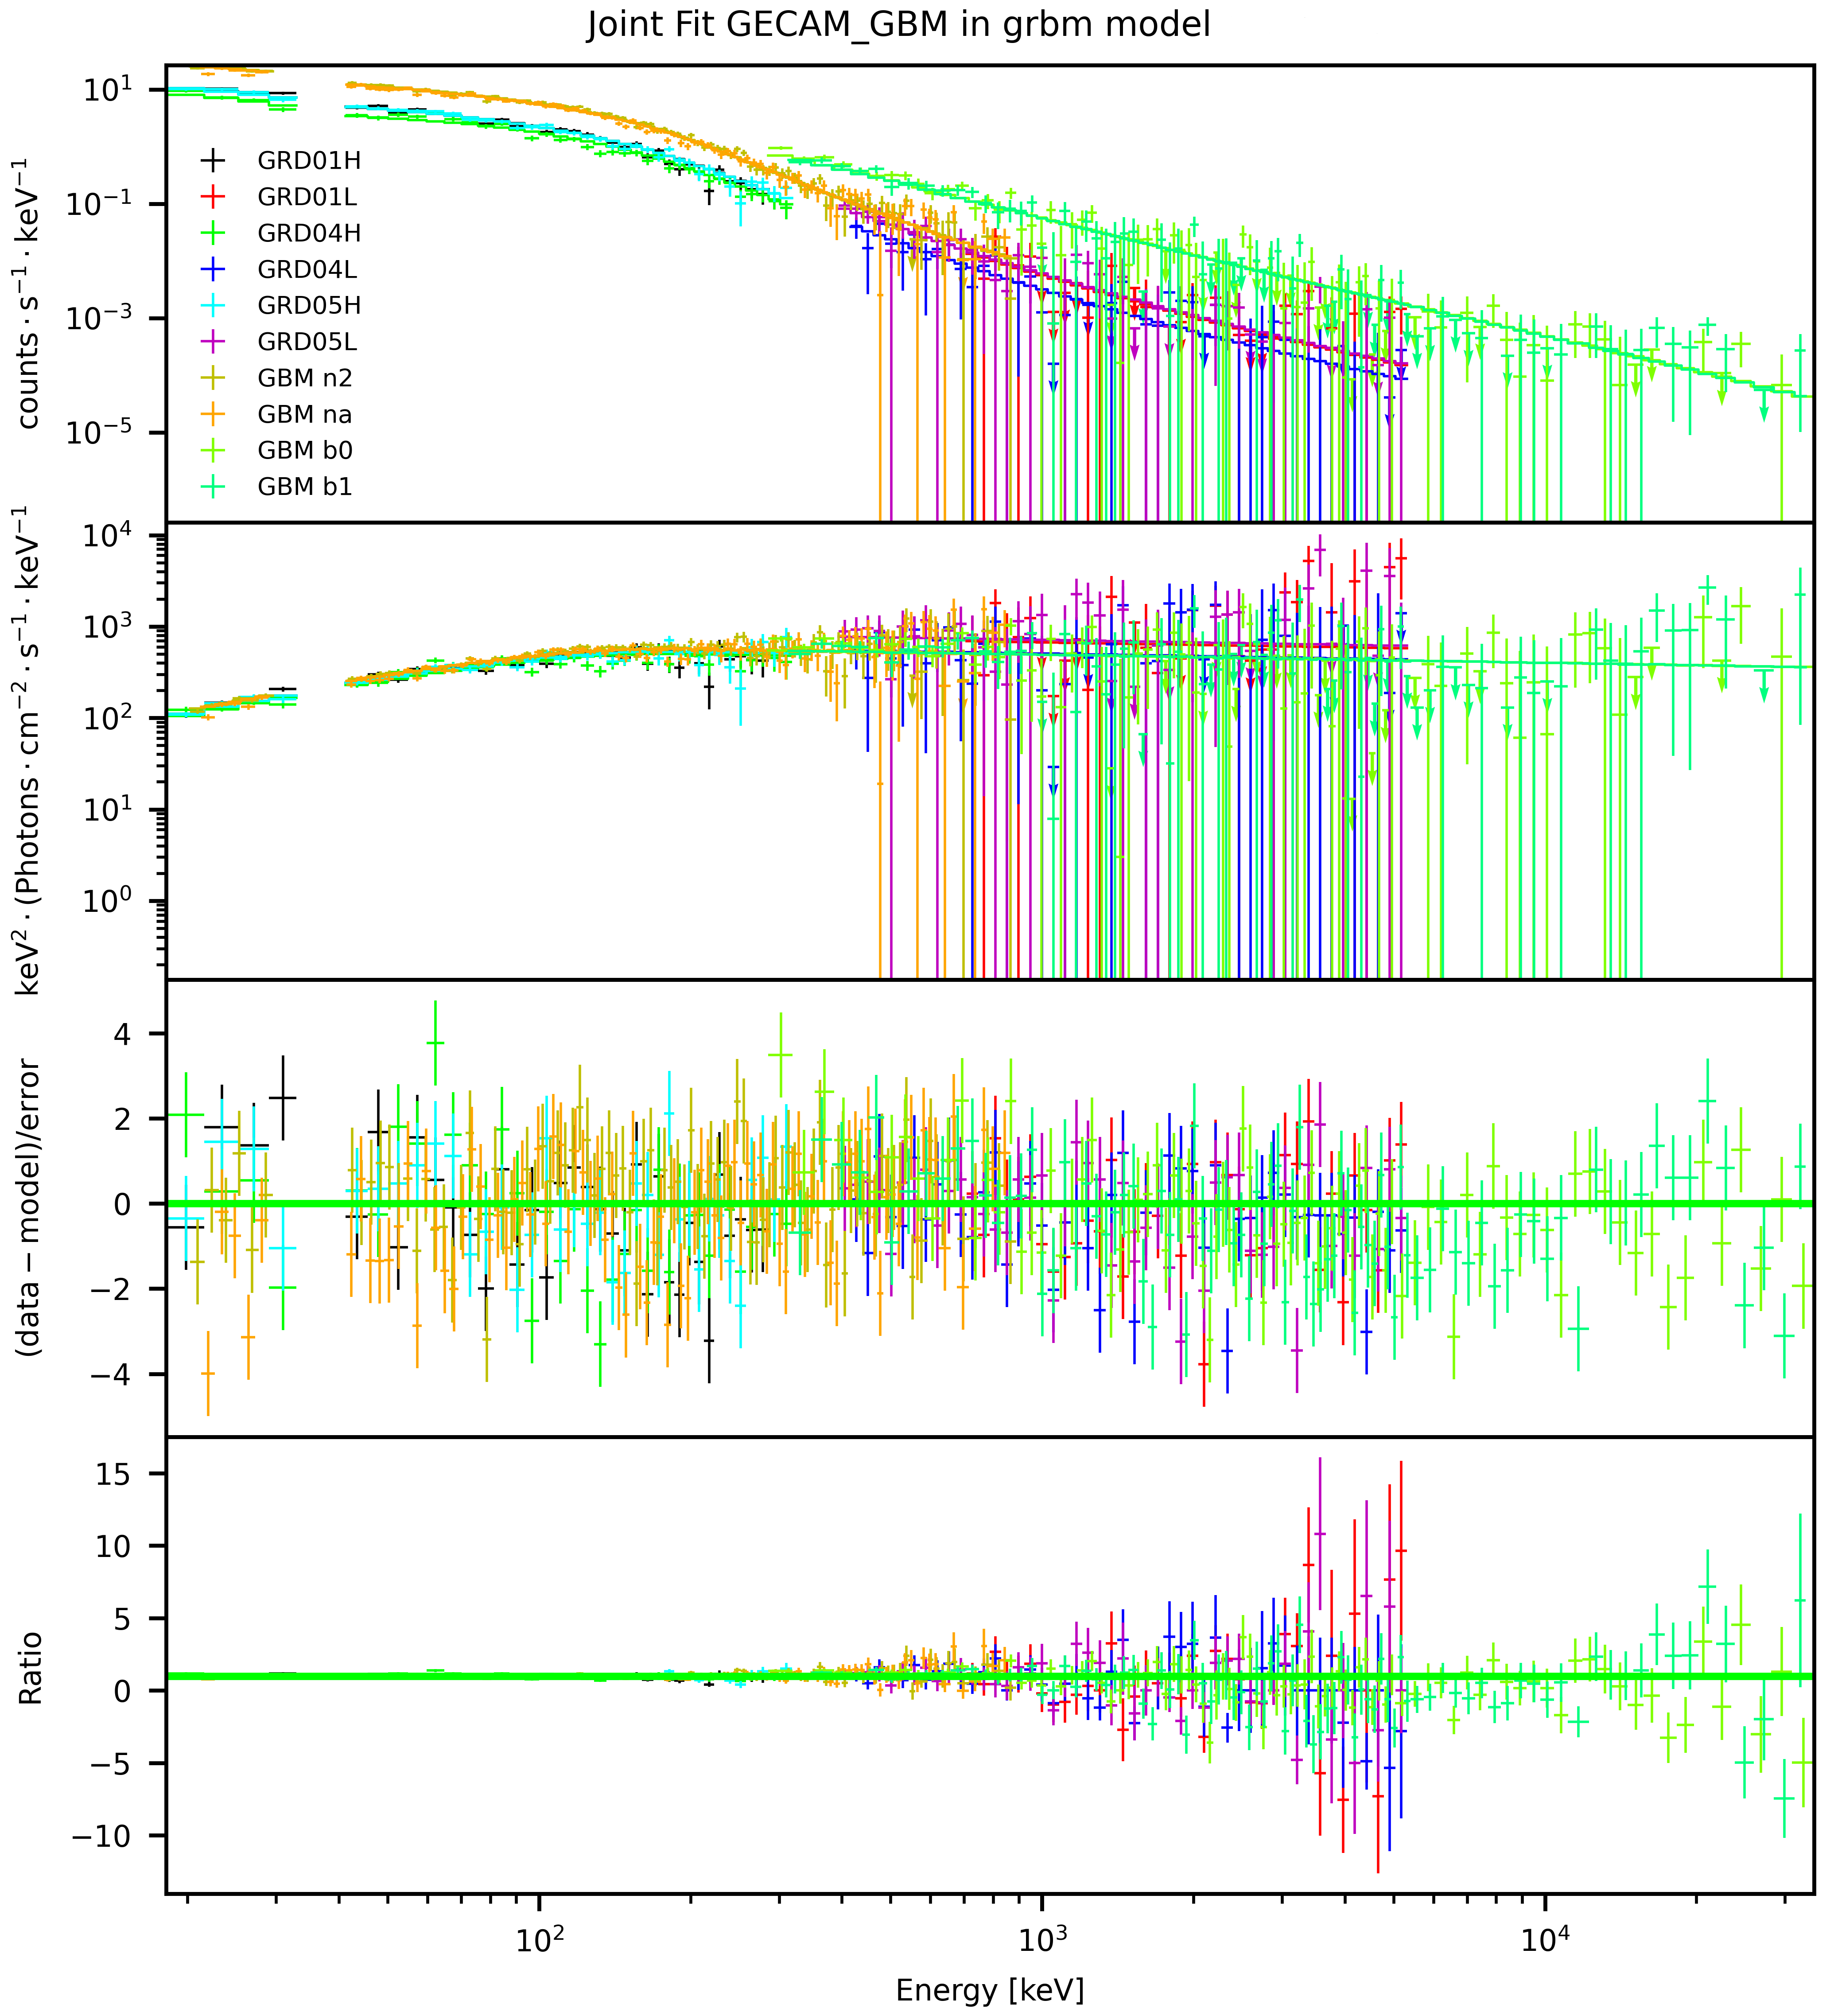
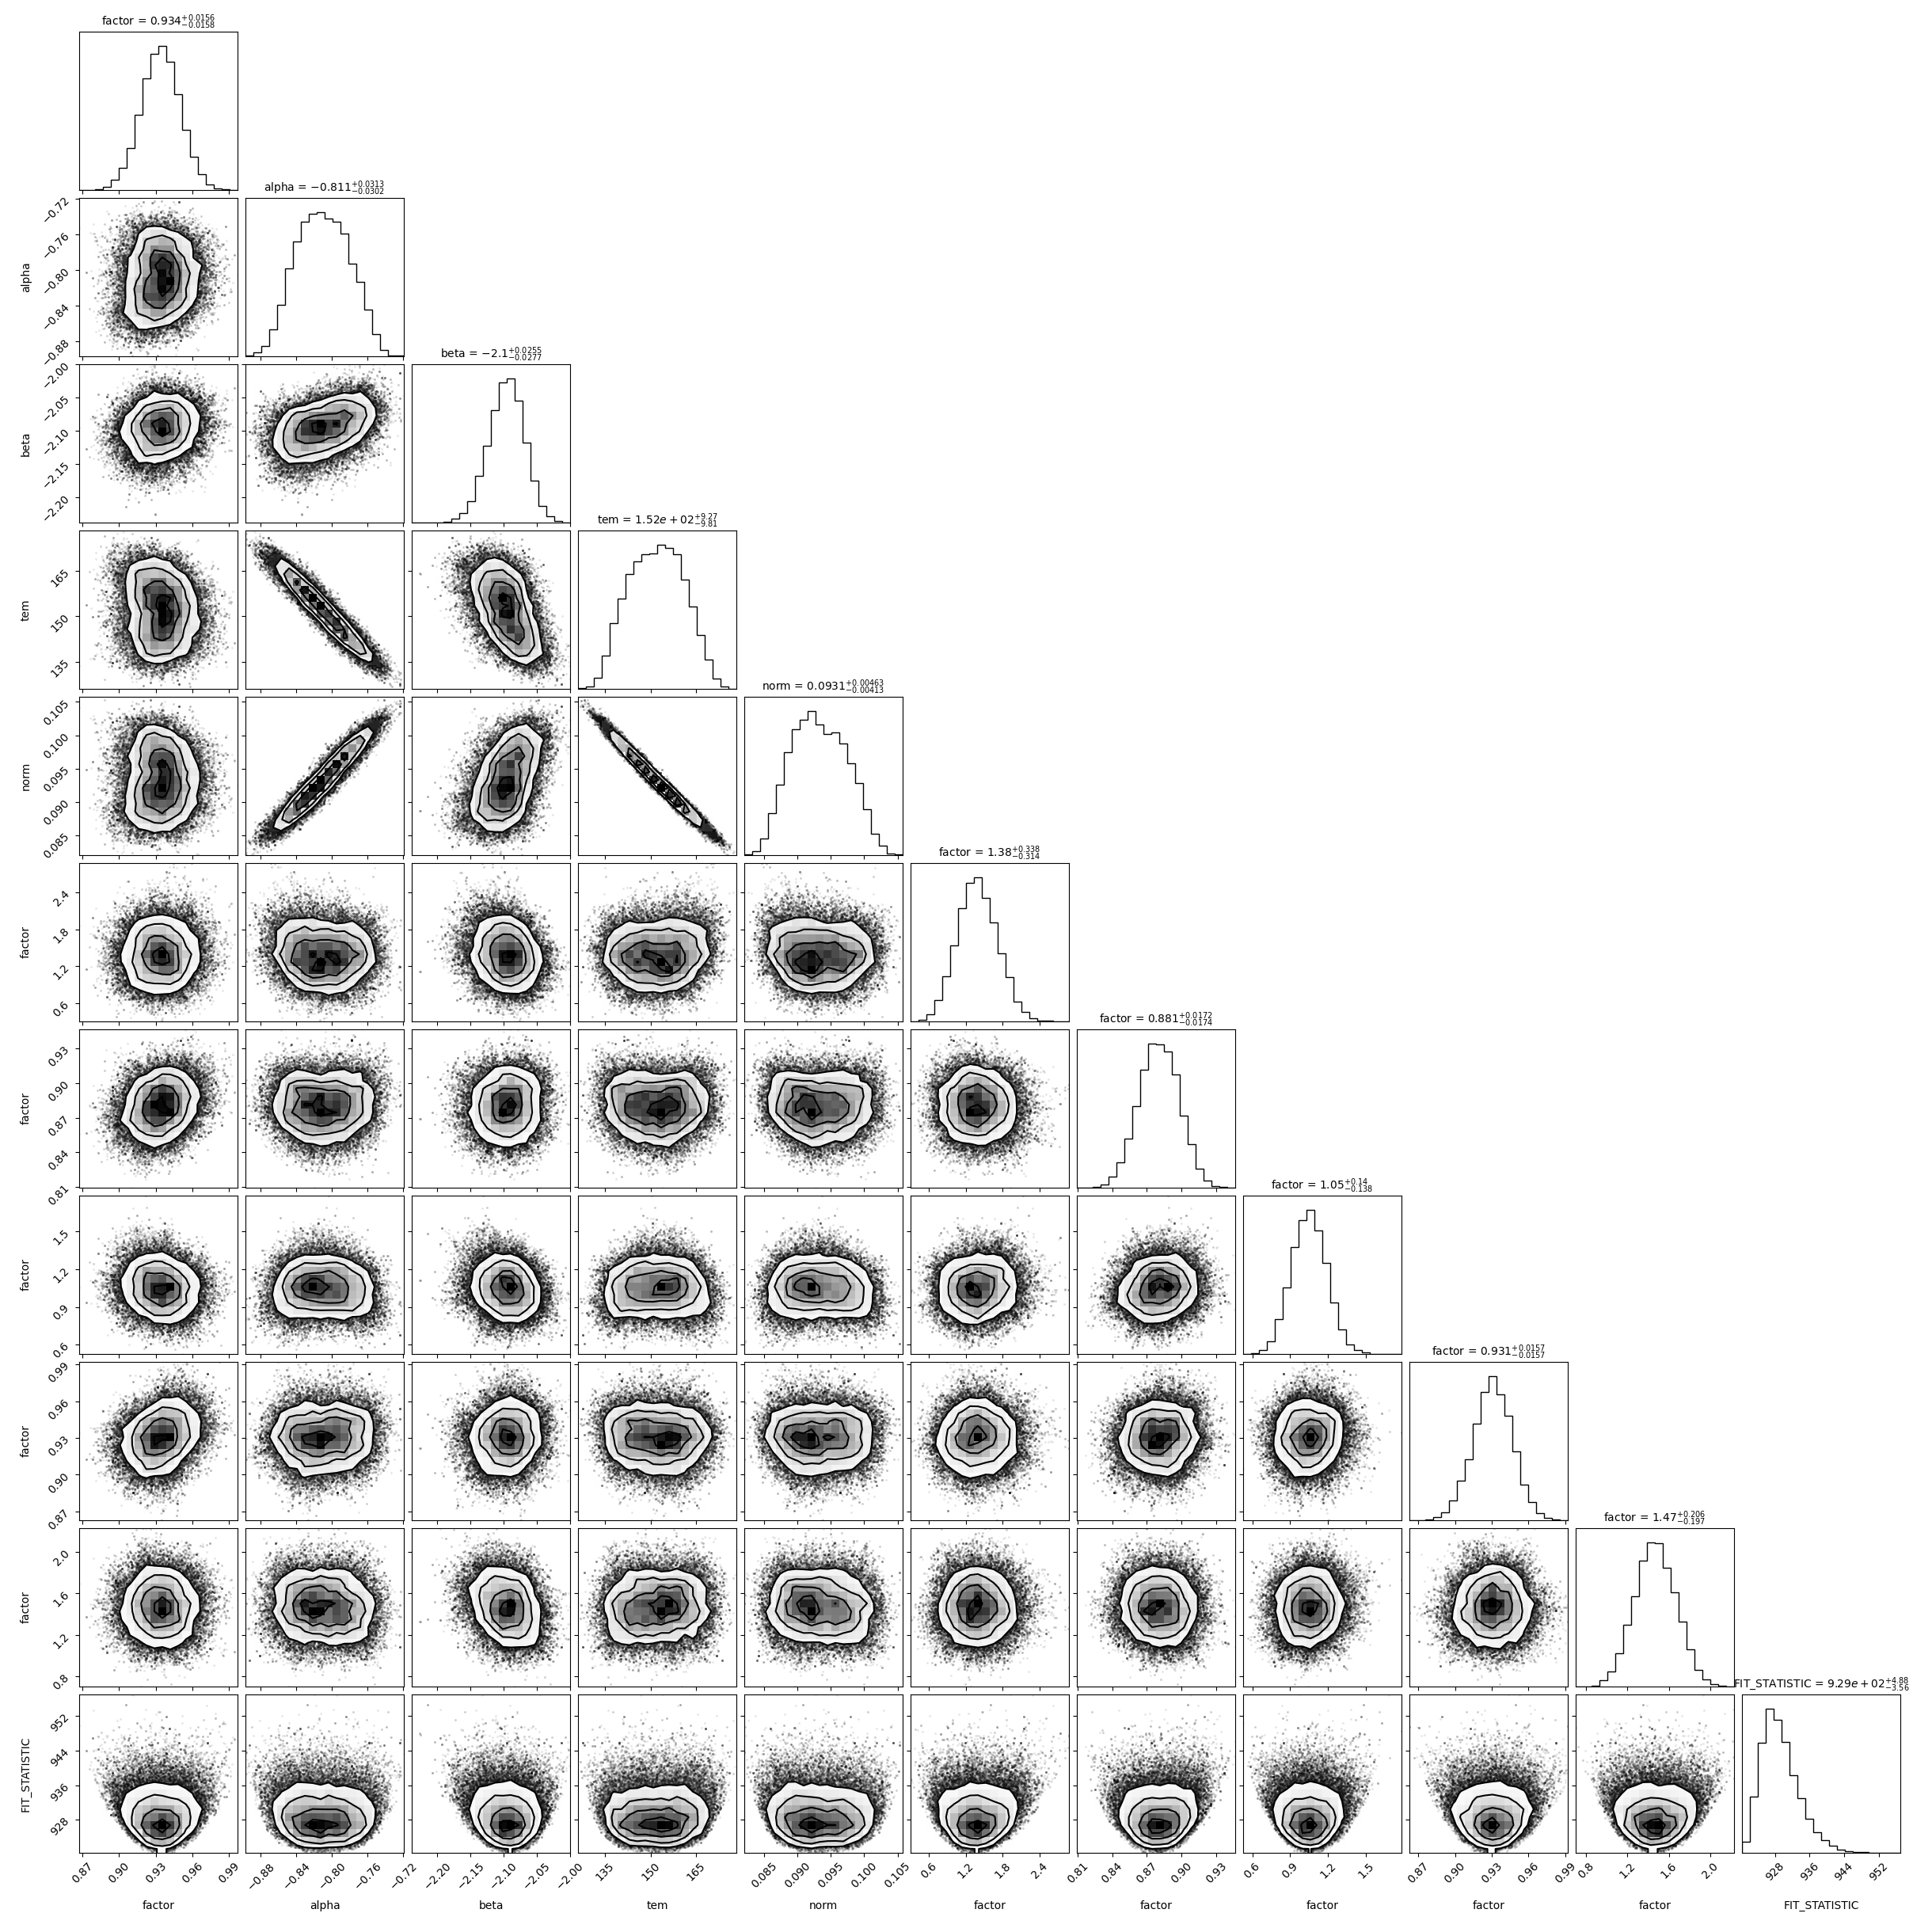
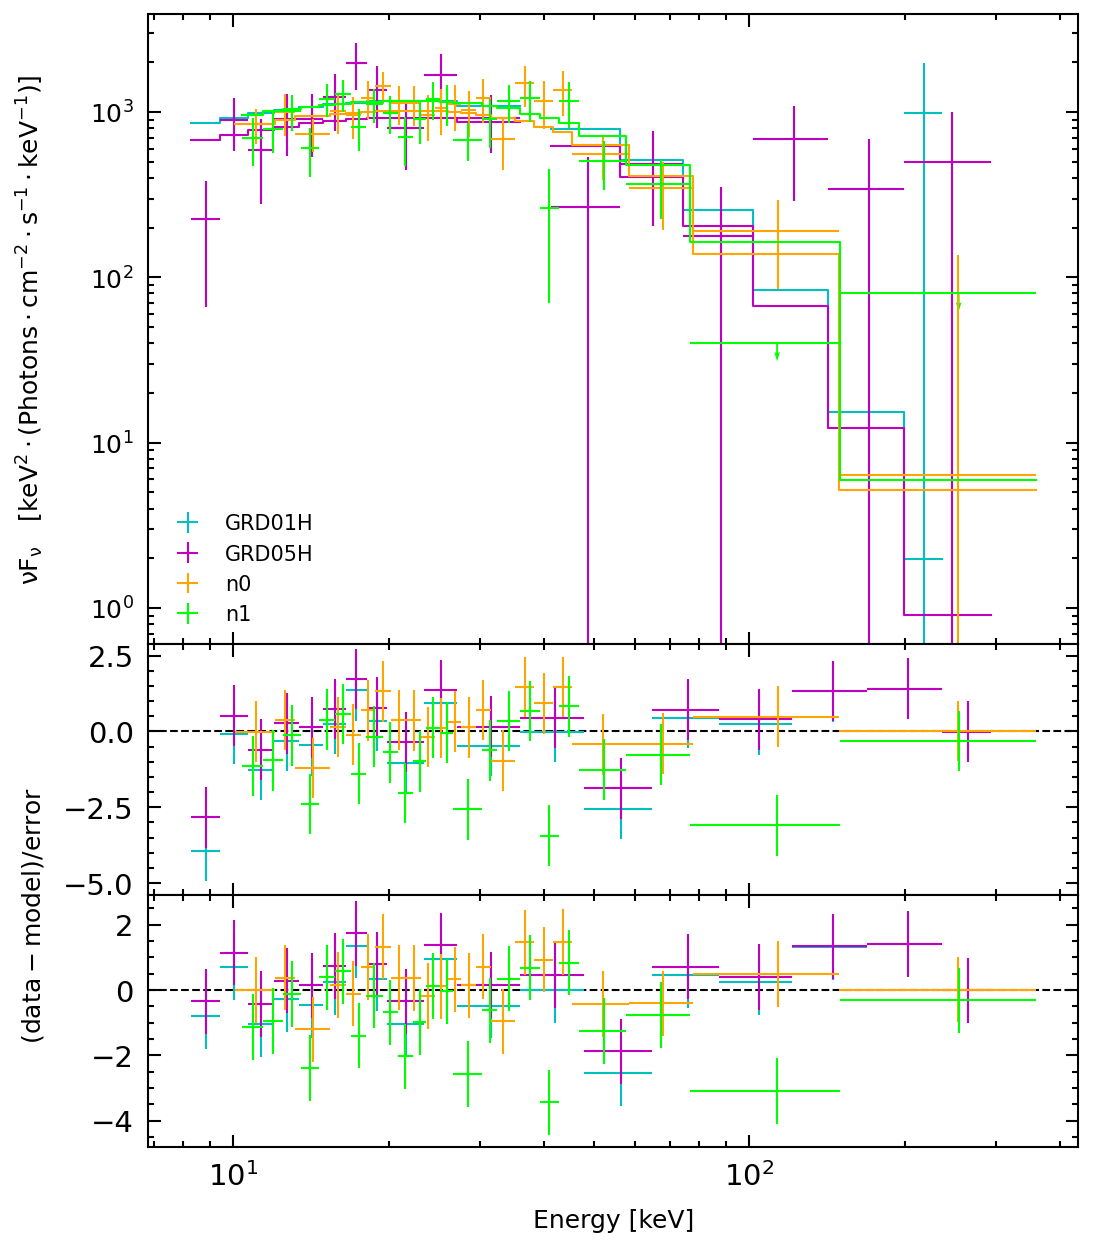
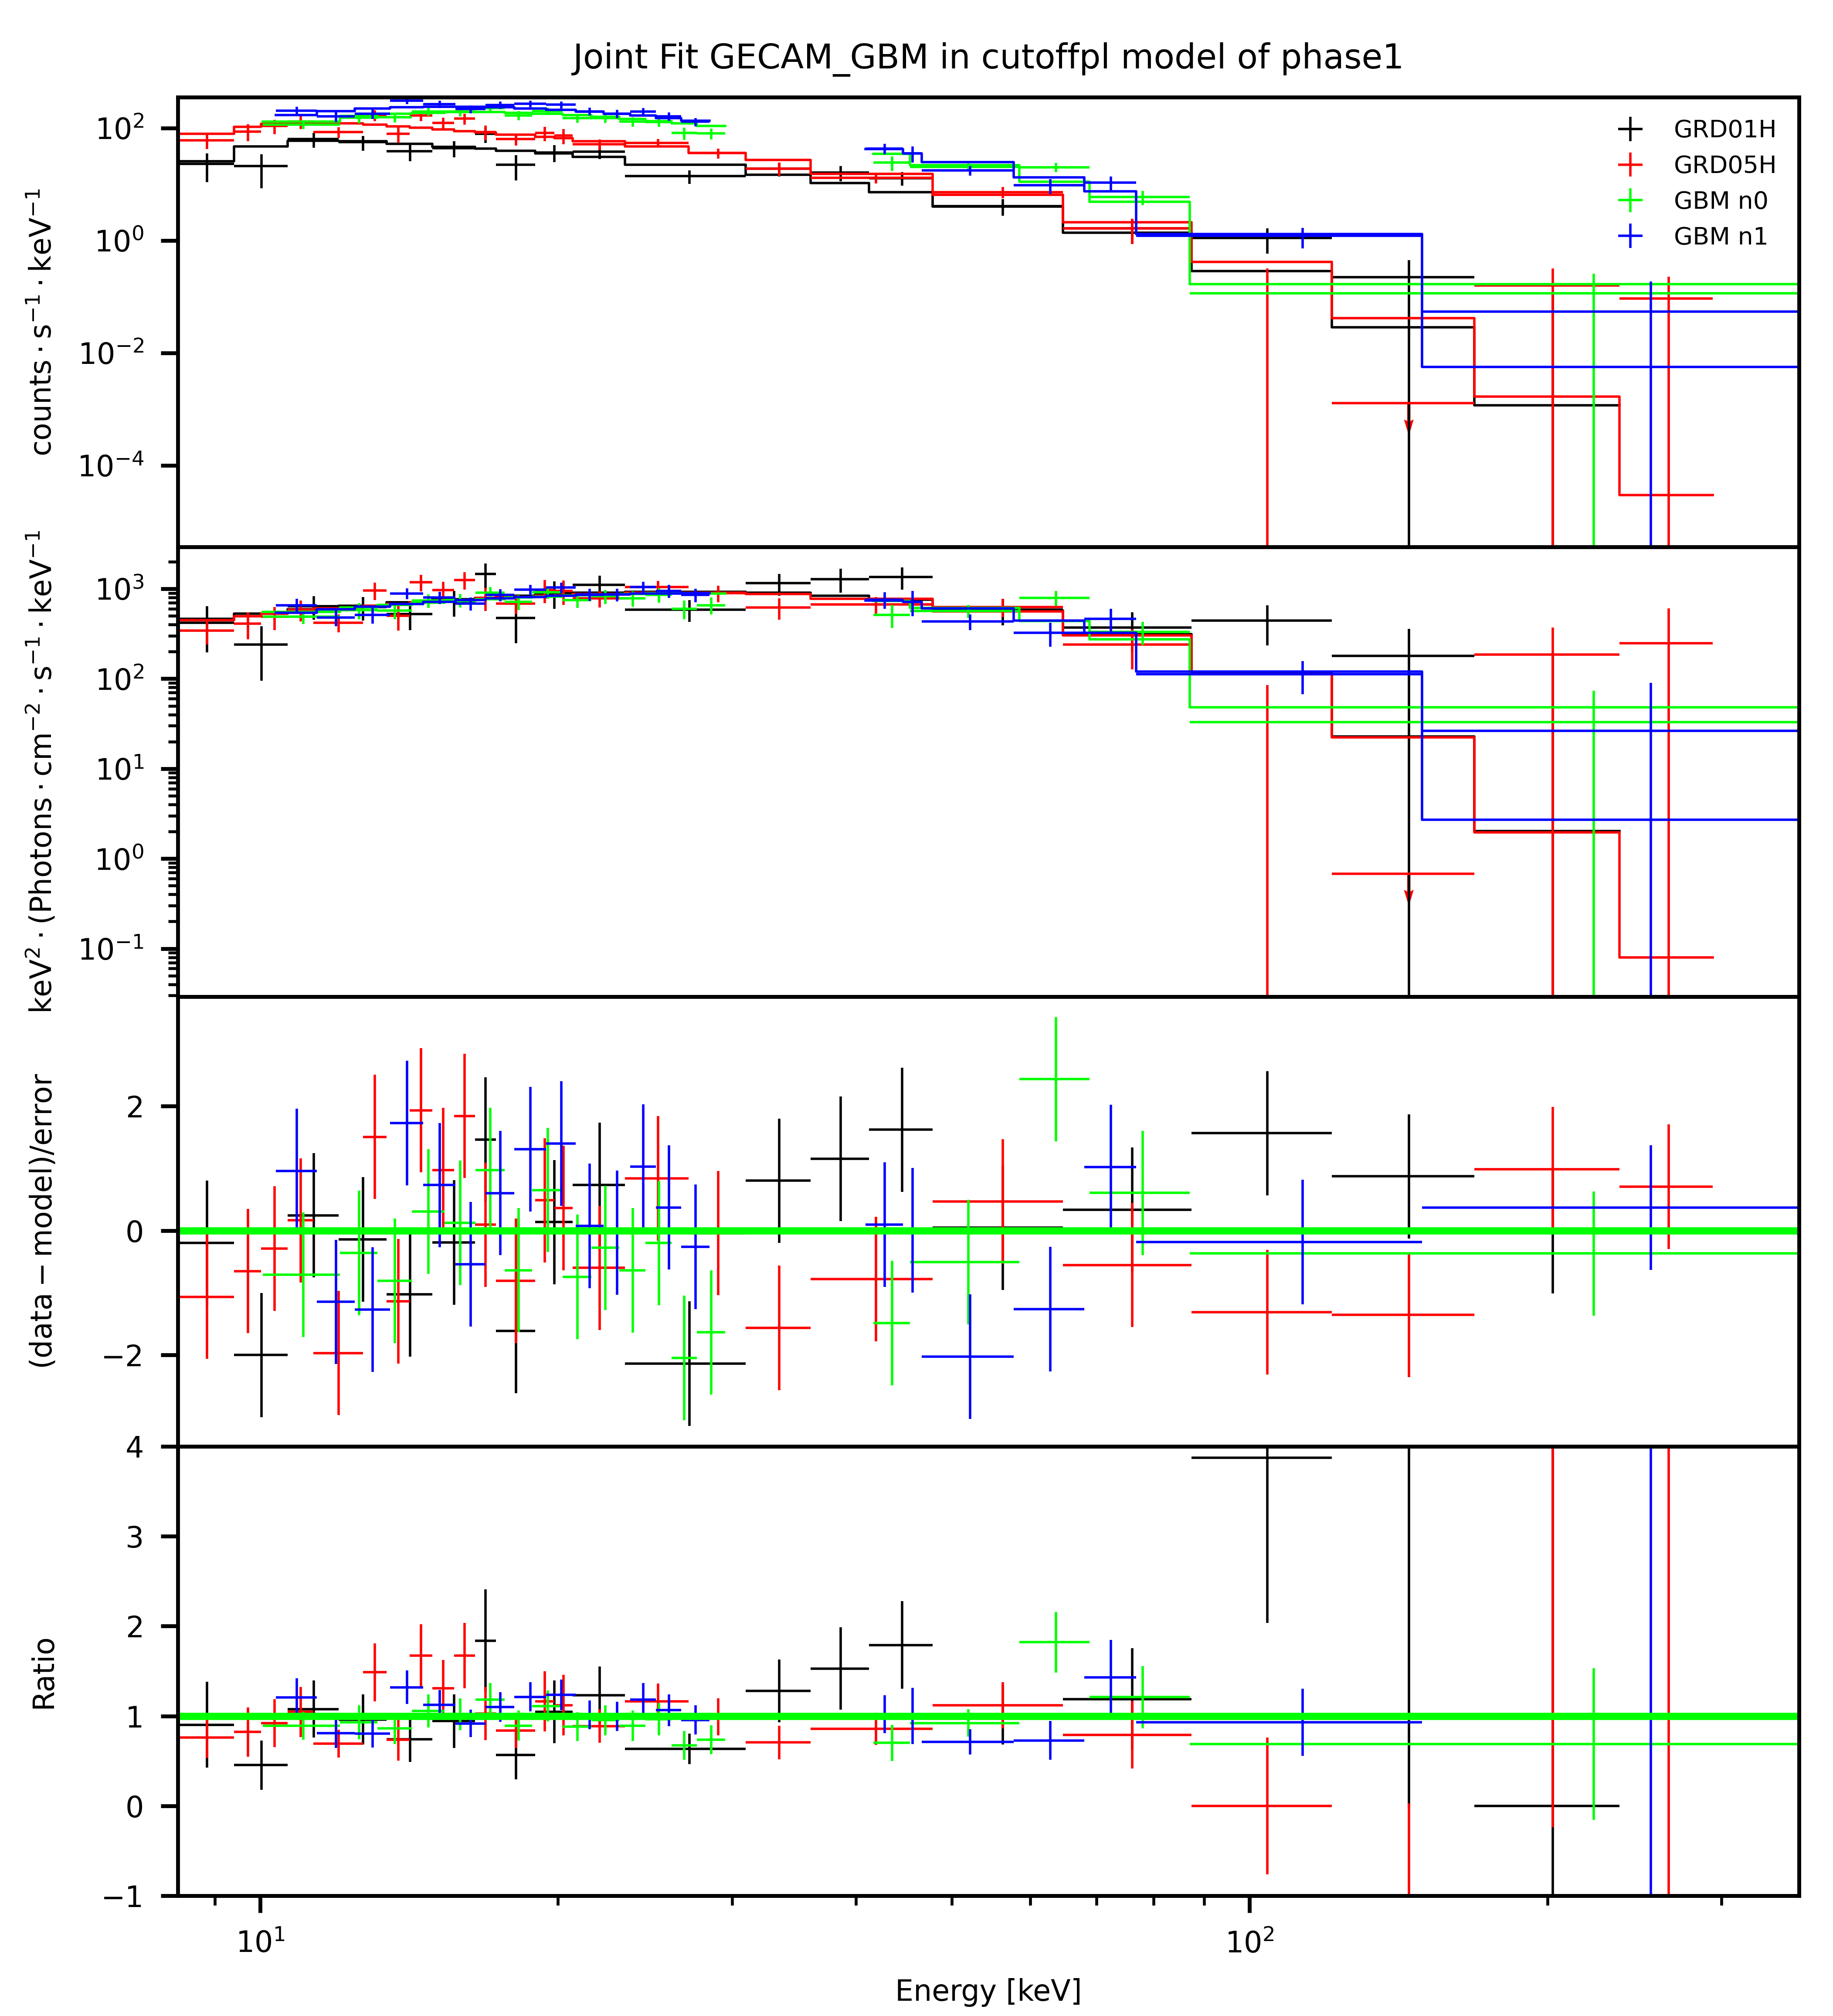
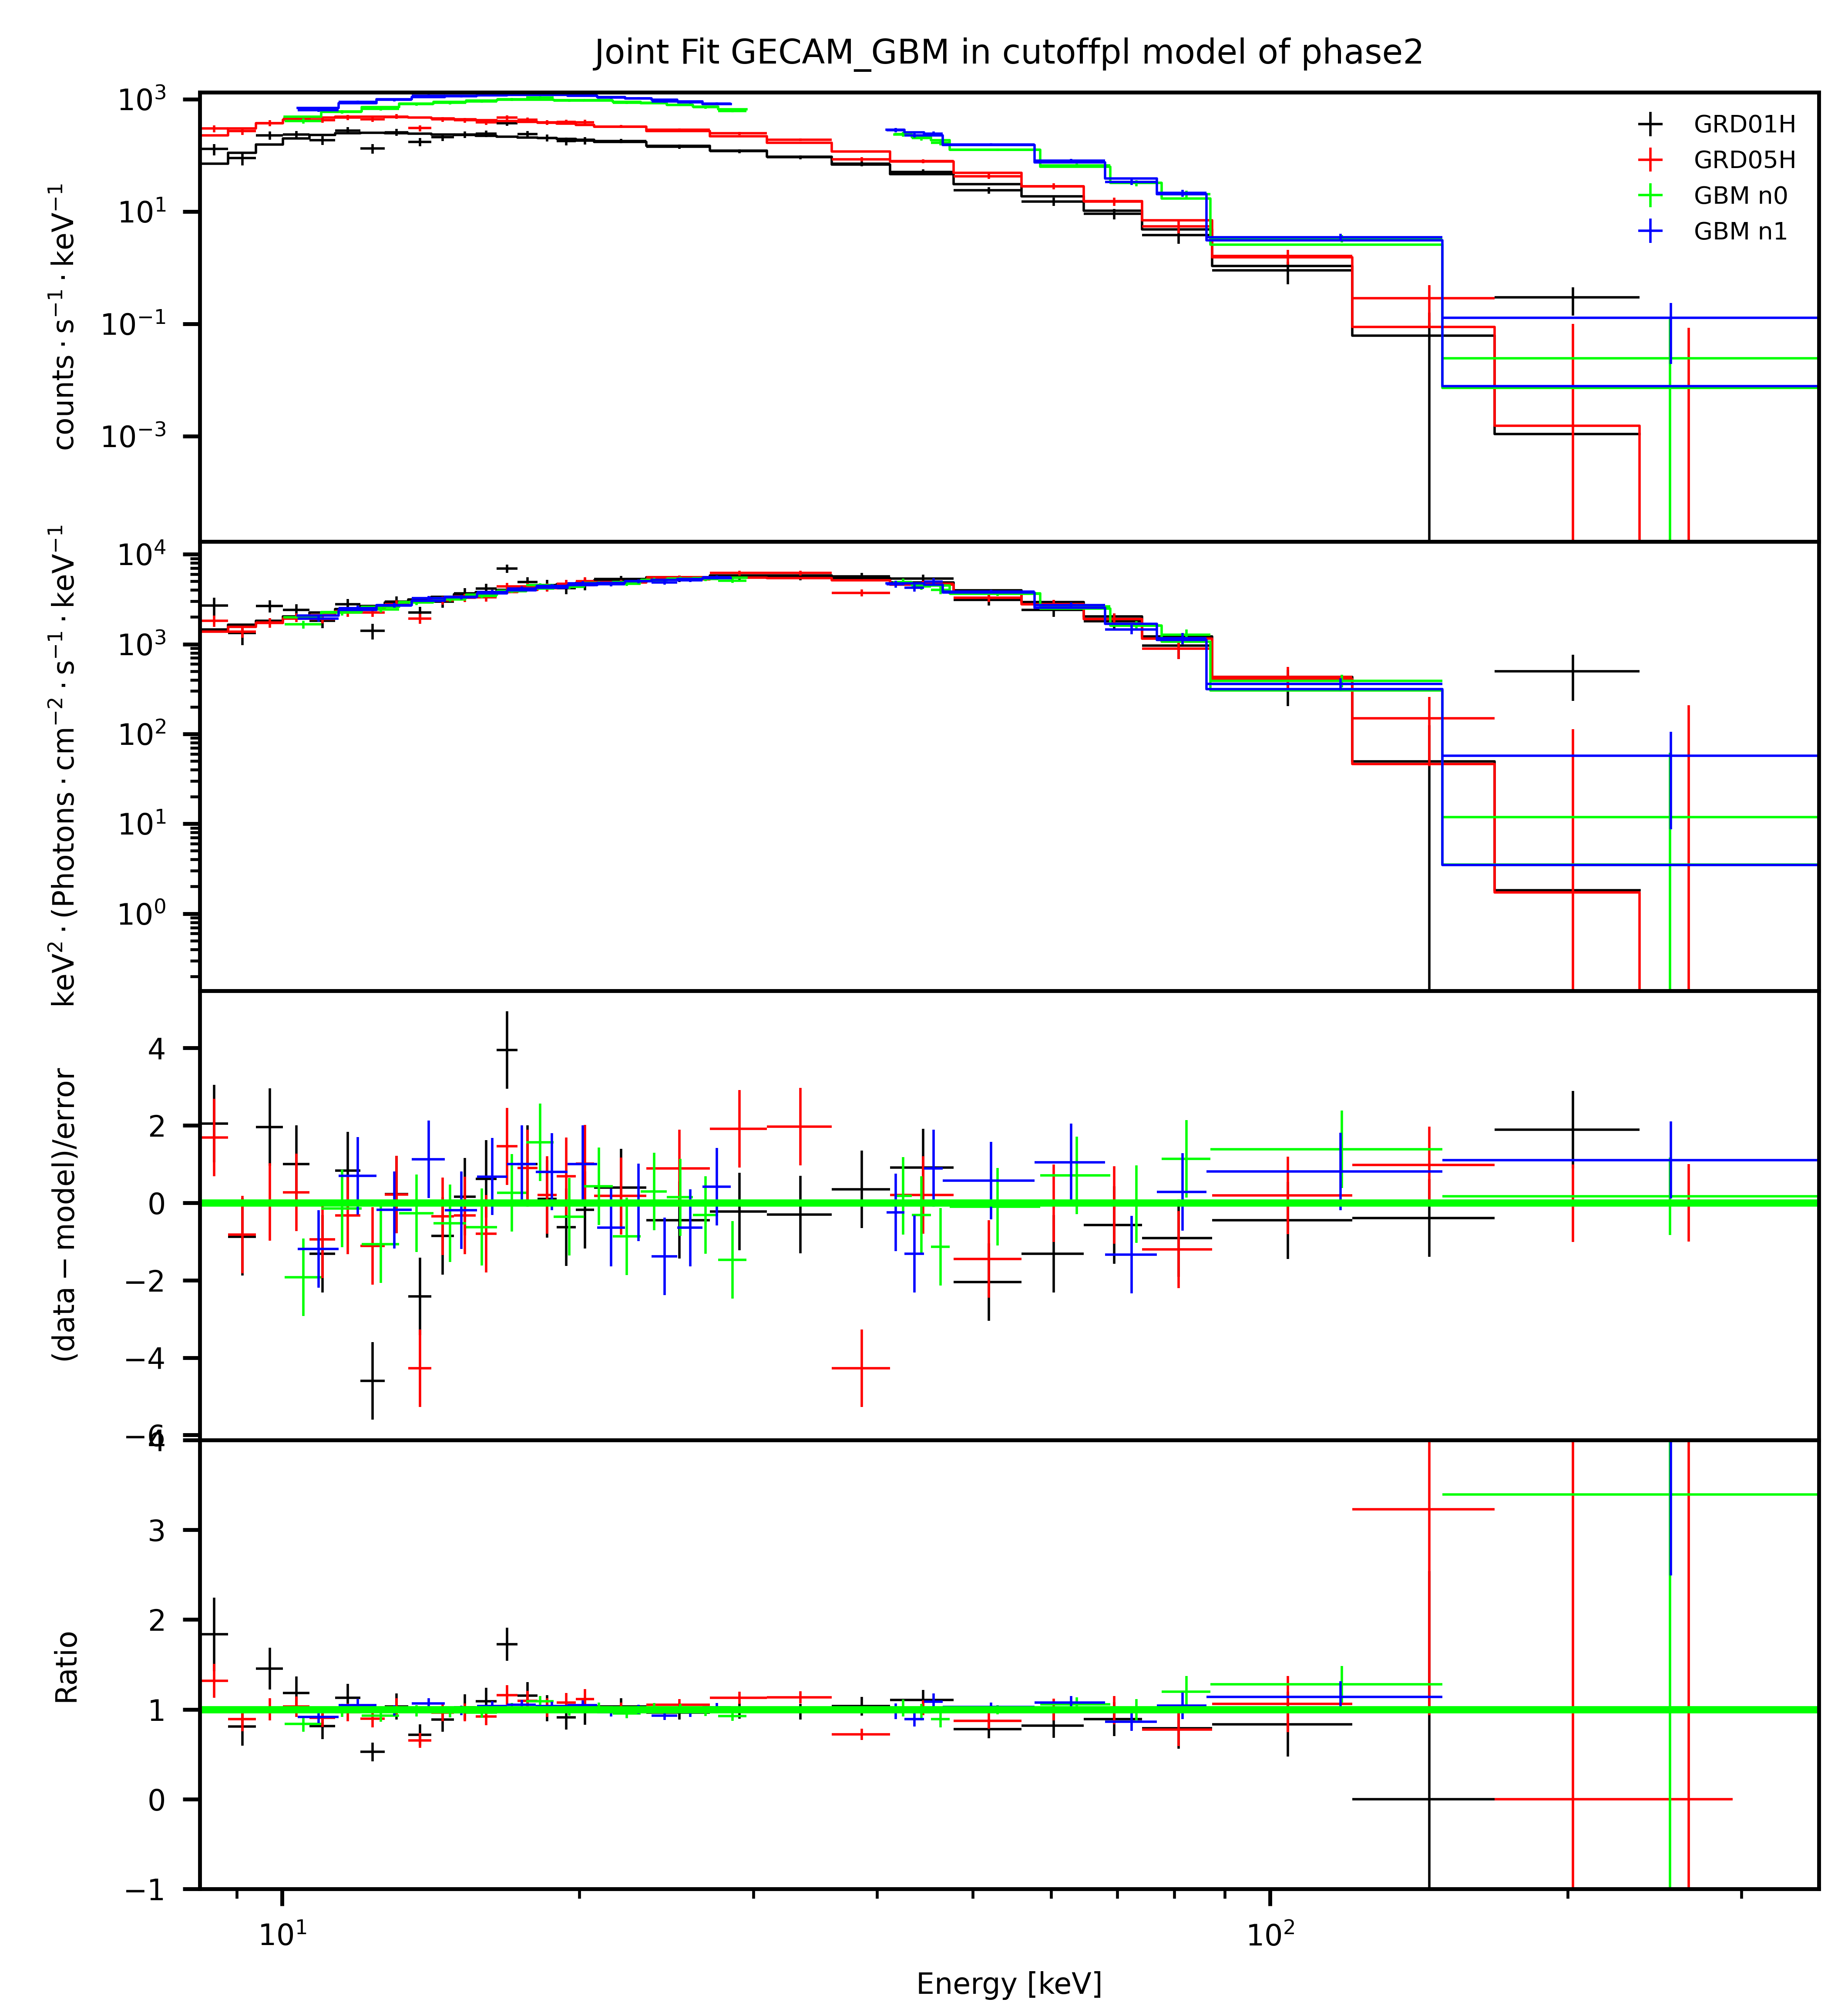
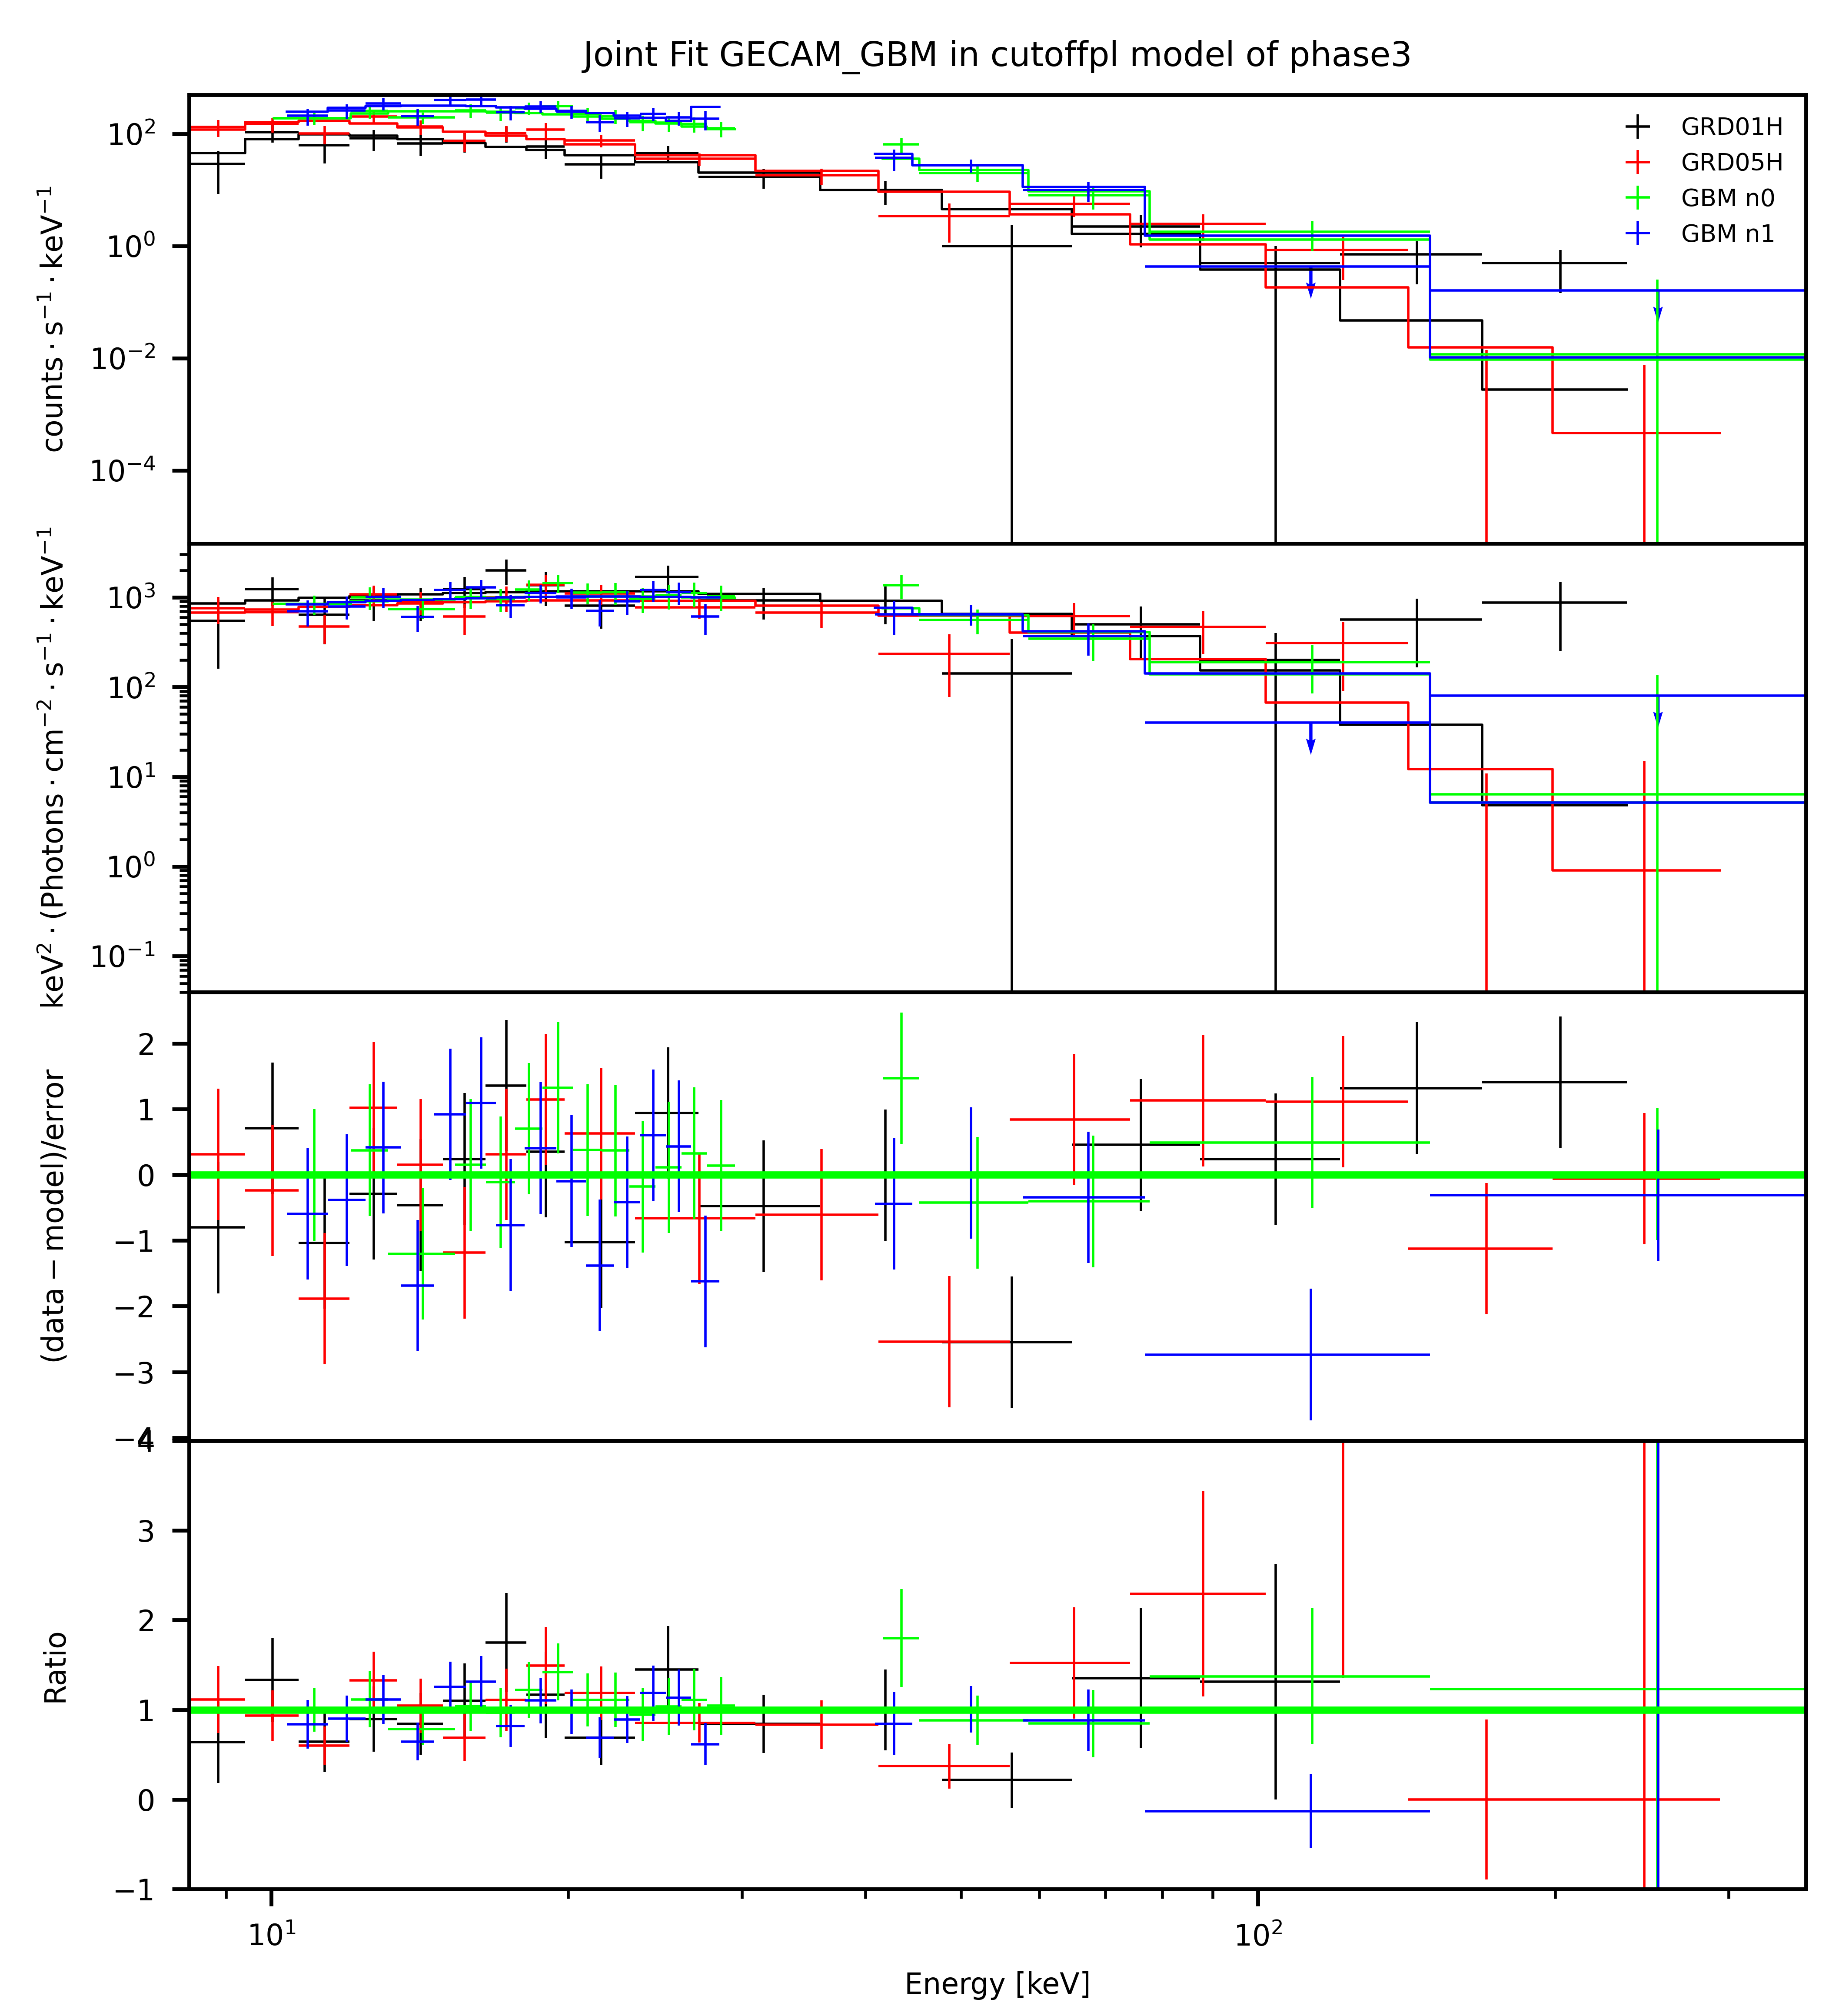
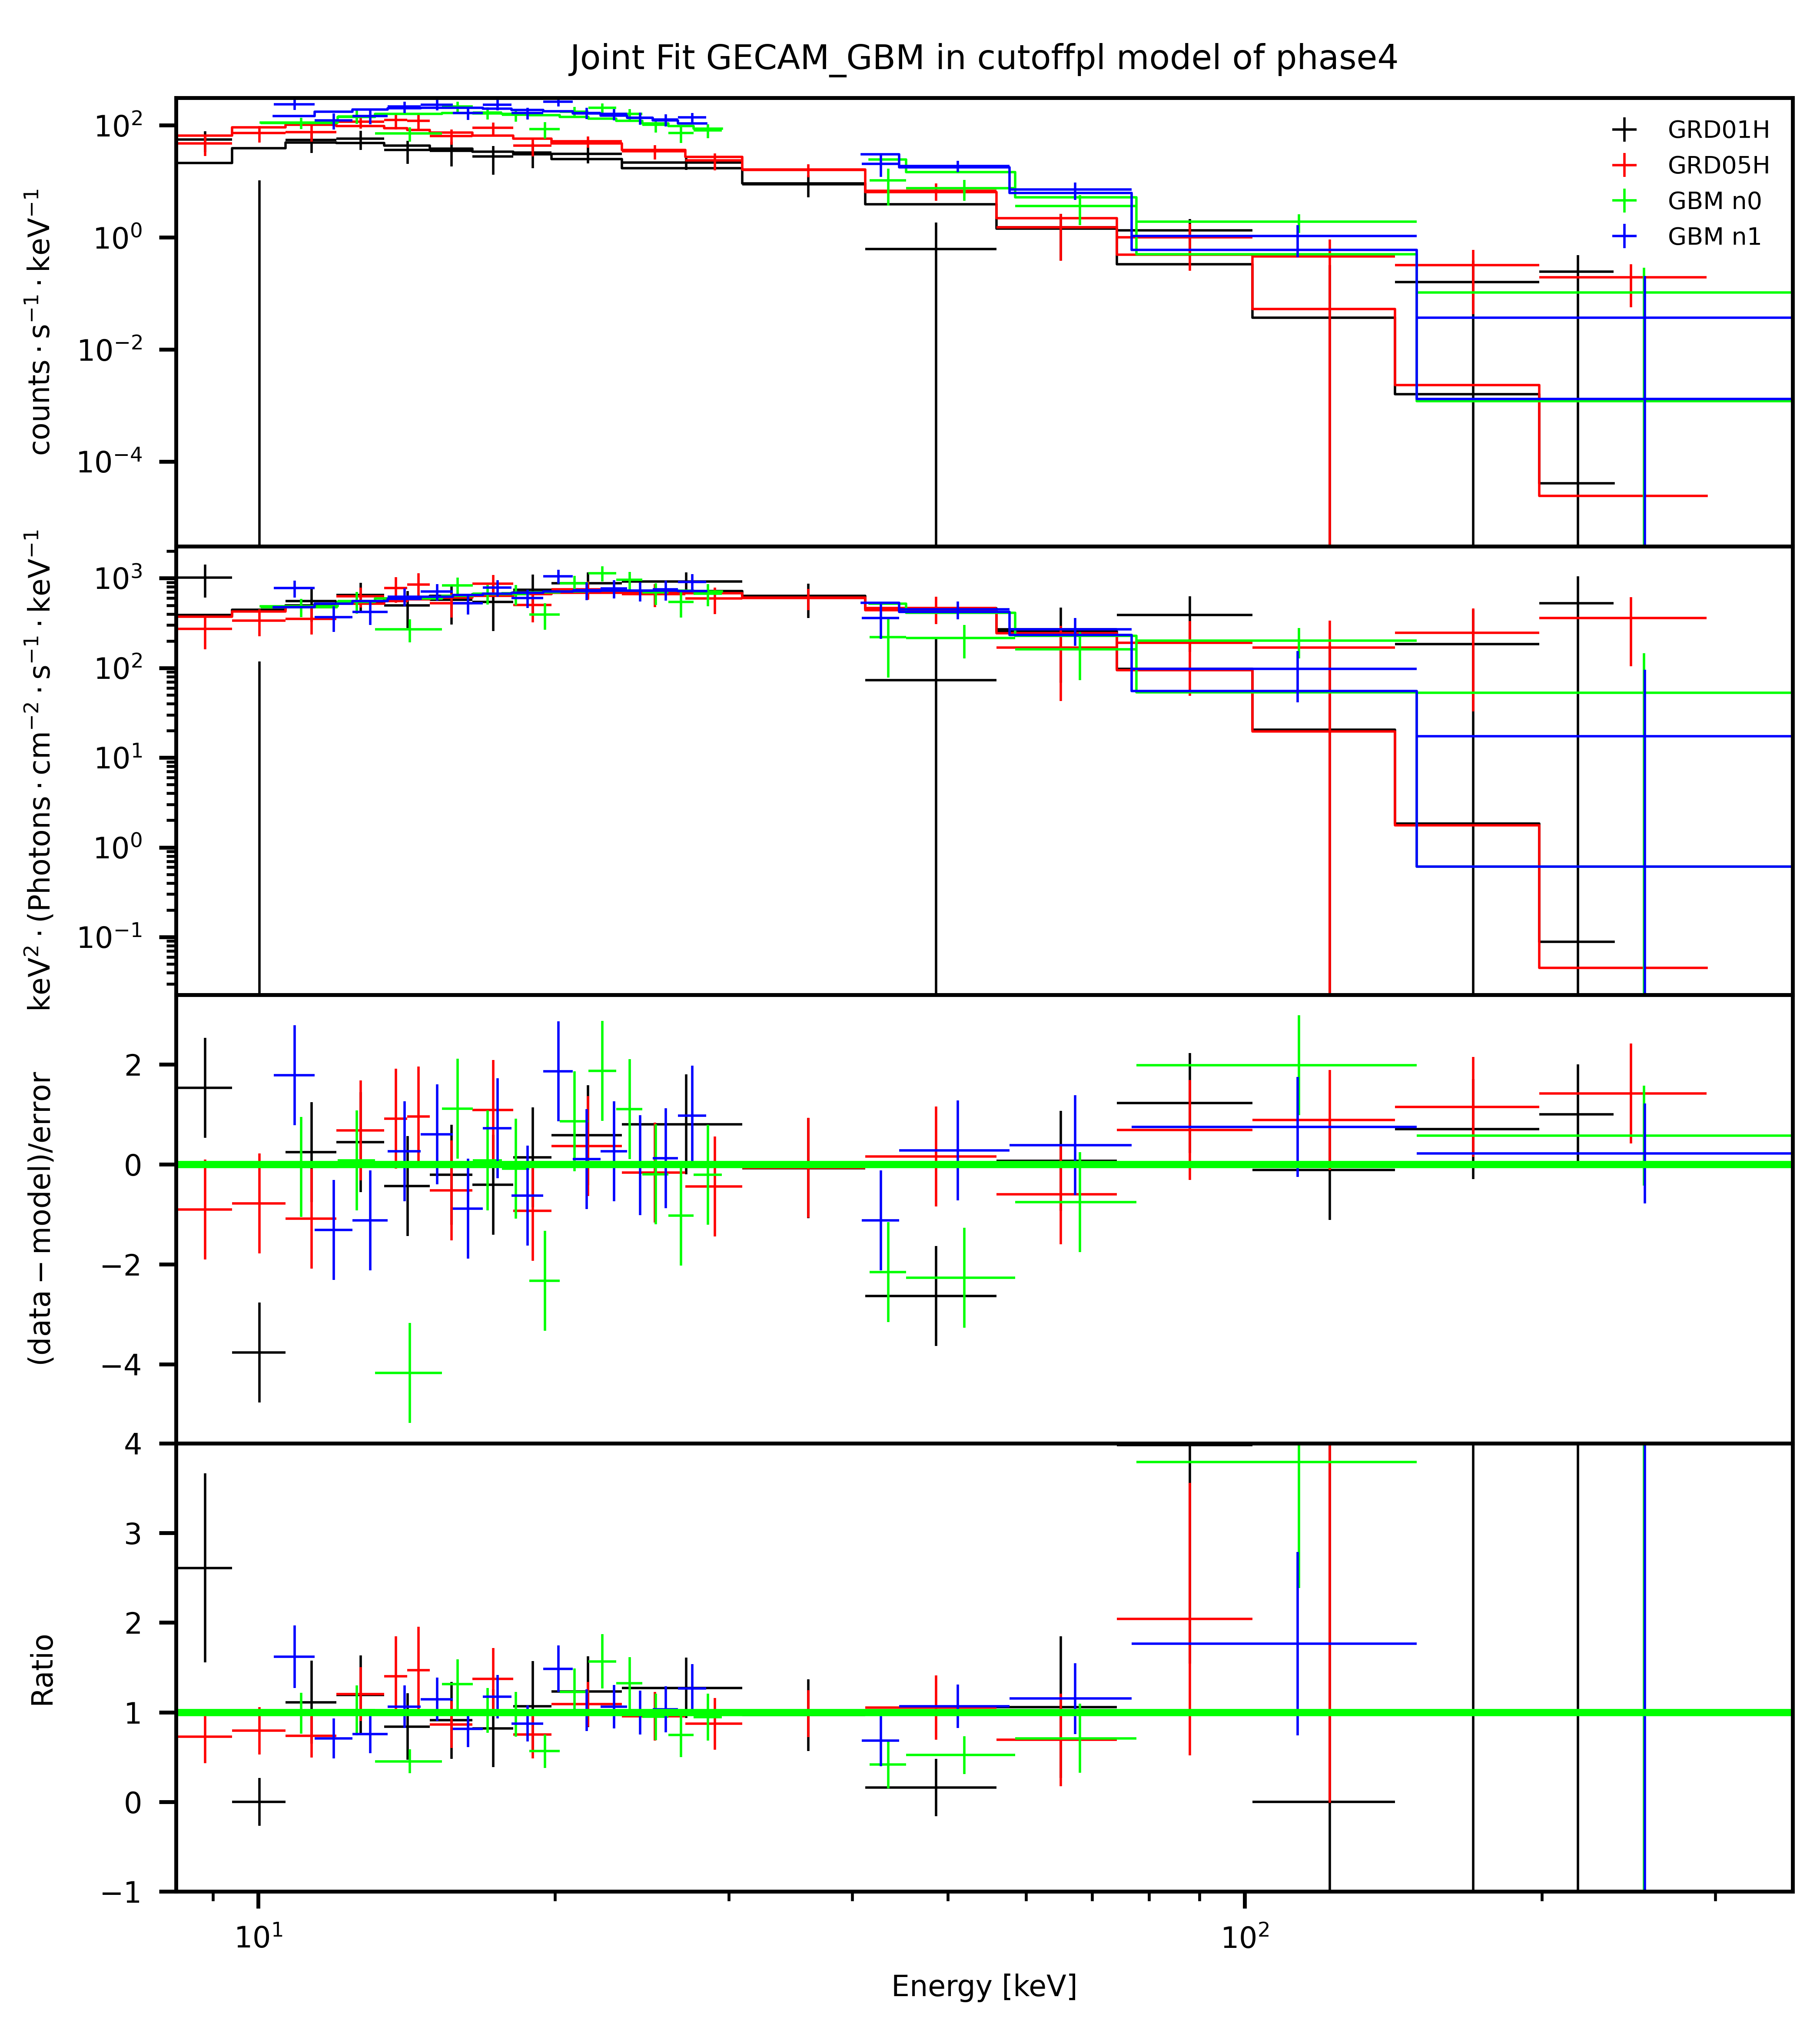
In addition, we have tried some spectrum models and the best model for this GRB is Band model[18]. Different fitting strategies are implemented which include: (1) High-Gain and Low-Gain fit together; (2) High-Gain and Low-Gain separate untie. The result using the second fitting method is shown in the Fig 2, the residual plot fluctuates around zero and the ratio plot fluctuates around one, which all mean the Band model fits the data points very well. The MC corner plot of the model parameters is presented in Fig 3, we can see that the parameters converge very well. In conclusion, it is certain that the results of joint fitting are very good. The fitted parameter results in both ways will be listed in the Table LABEL:Model_fit_results_for_GRB_220921A_fit_together and Table LABEL:Model_fit_results_for_GRB_220921A_untie, respectively, and we can see that all the spectral parameters of the two kinds of fitting strategies are consistent within the error. From the table we also can see that the constant factors describing the consistency of the GECAM-C response matrix are essentially close to one but with some statistical fluctuations. From the above various results we can draw a conclusion, the response matrixs of GECAM-C can basically describe the scientific data well.
2.2.2 GRB 220930A
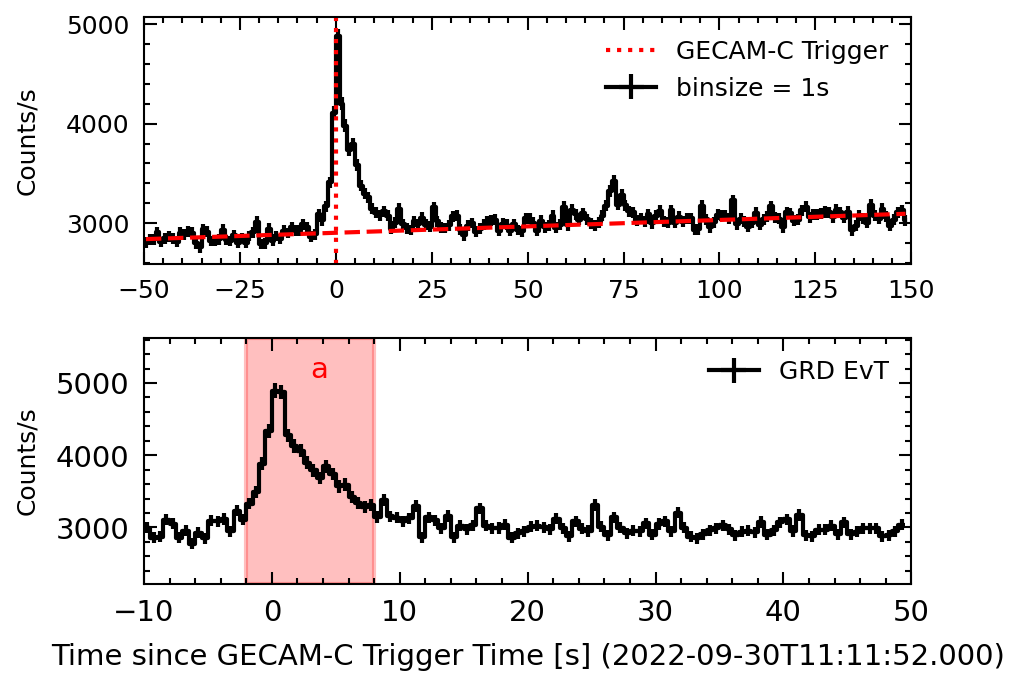
GRB 2209030A triggered at T0: 2022-09-30T11:11:52.000 (UTC), Swift/BAT also was triggered by it and provided a precise location (ra: 64.72 deg, dec:13.35 deg, with with an error of 2.2 arc second), which means we can use this burst to do a joint analysis with Swift/BAT to calibrate the correctness of the low-energy range of the GECAM-C response matrixs.
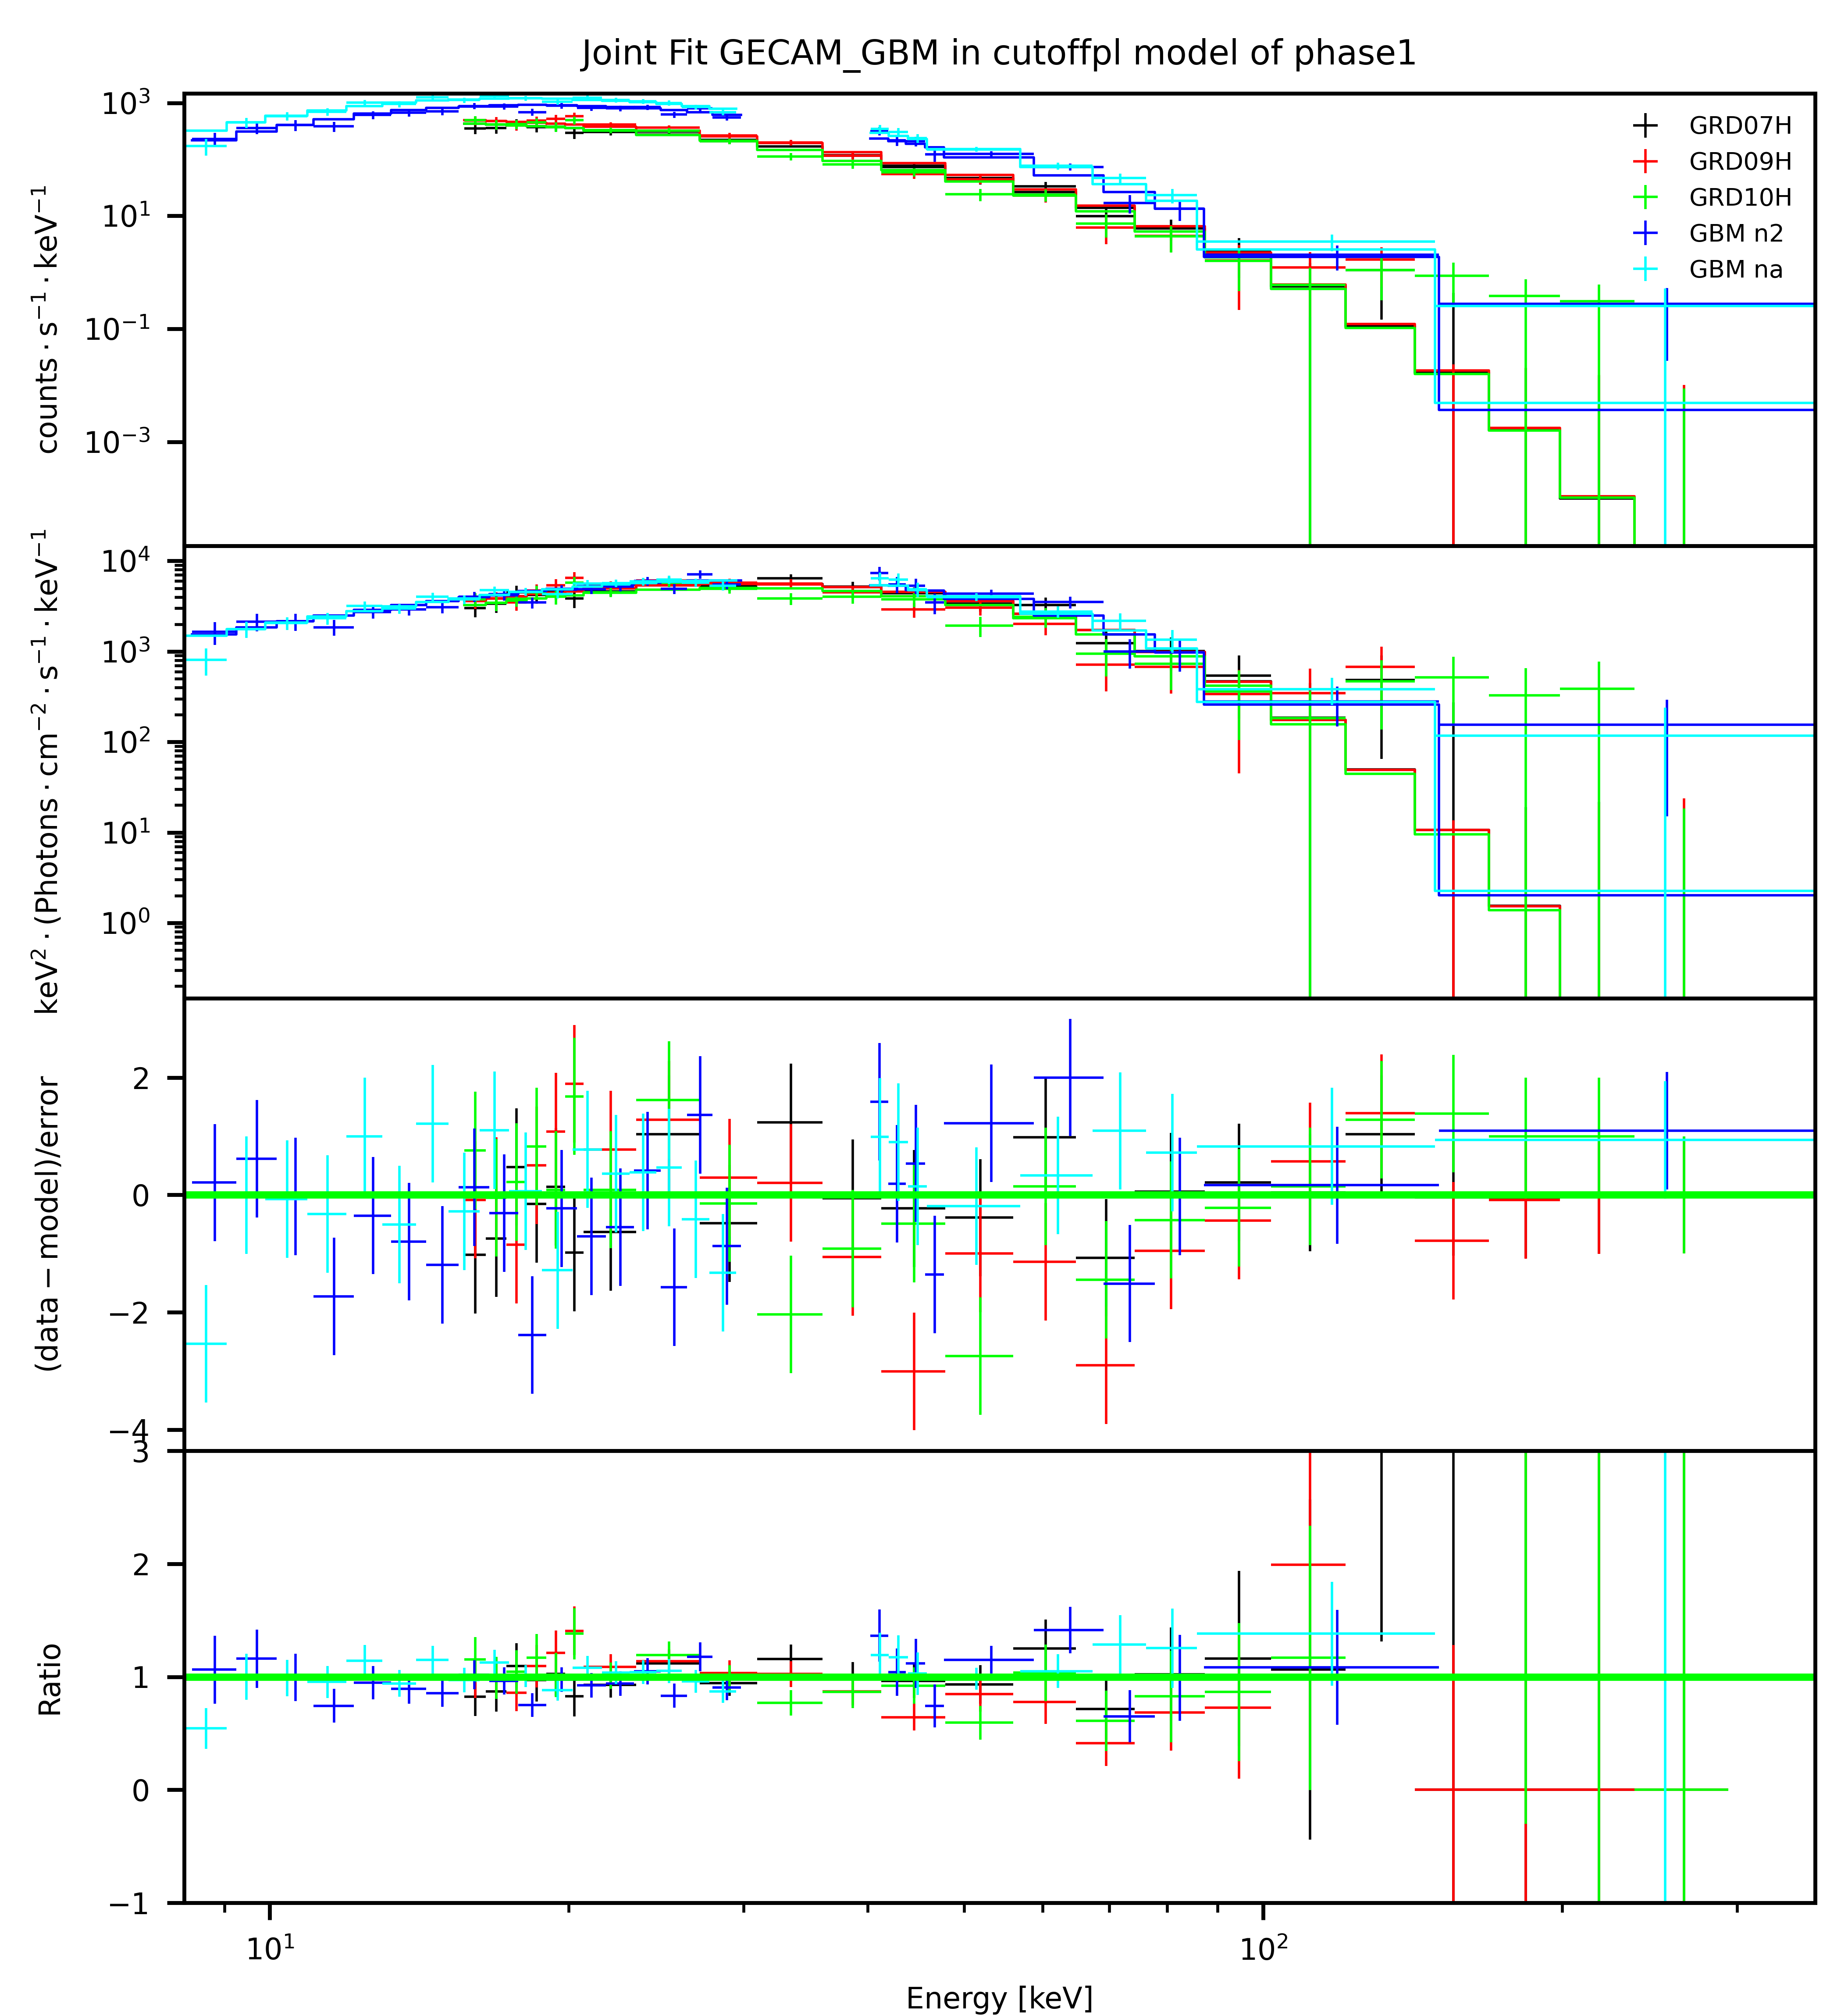
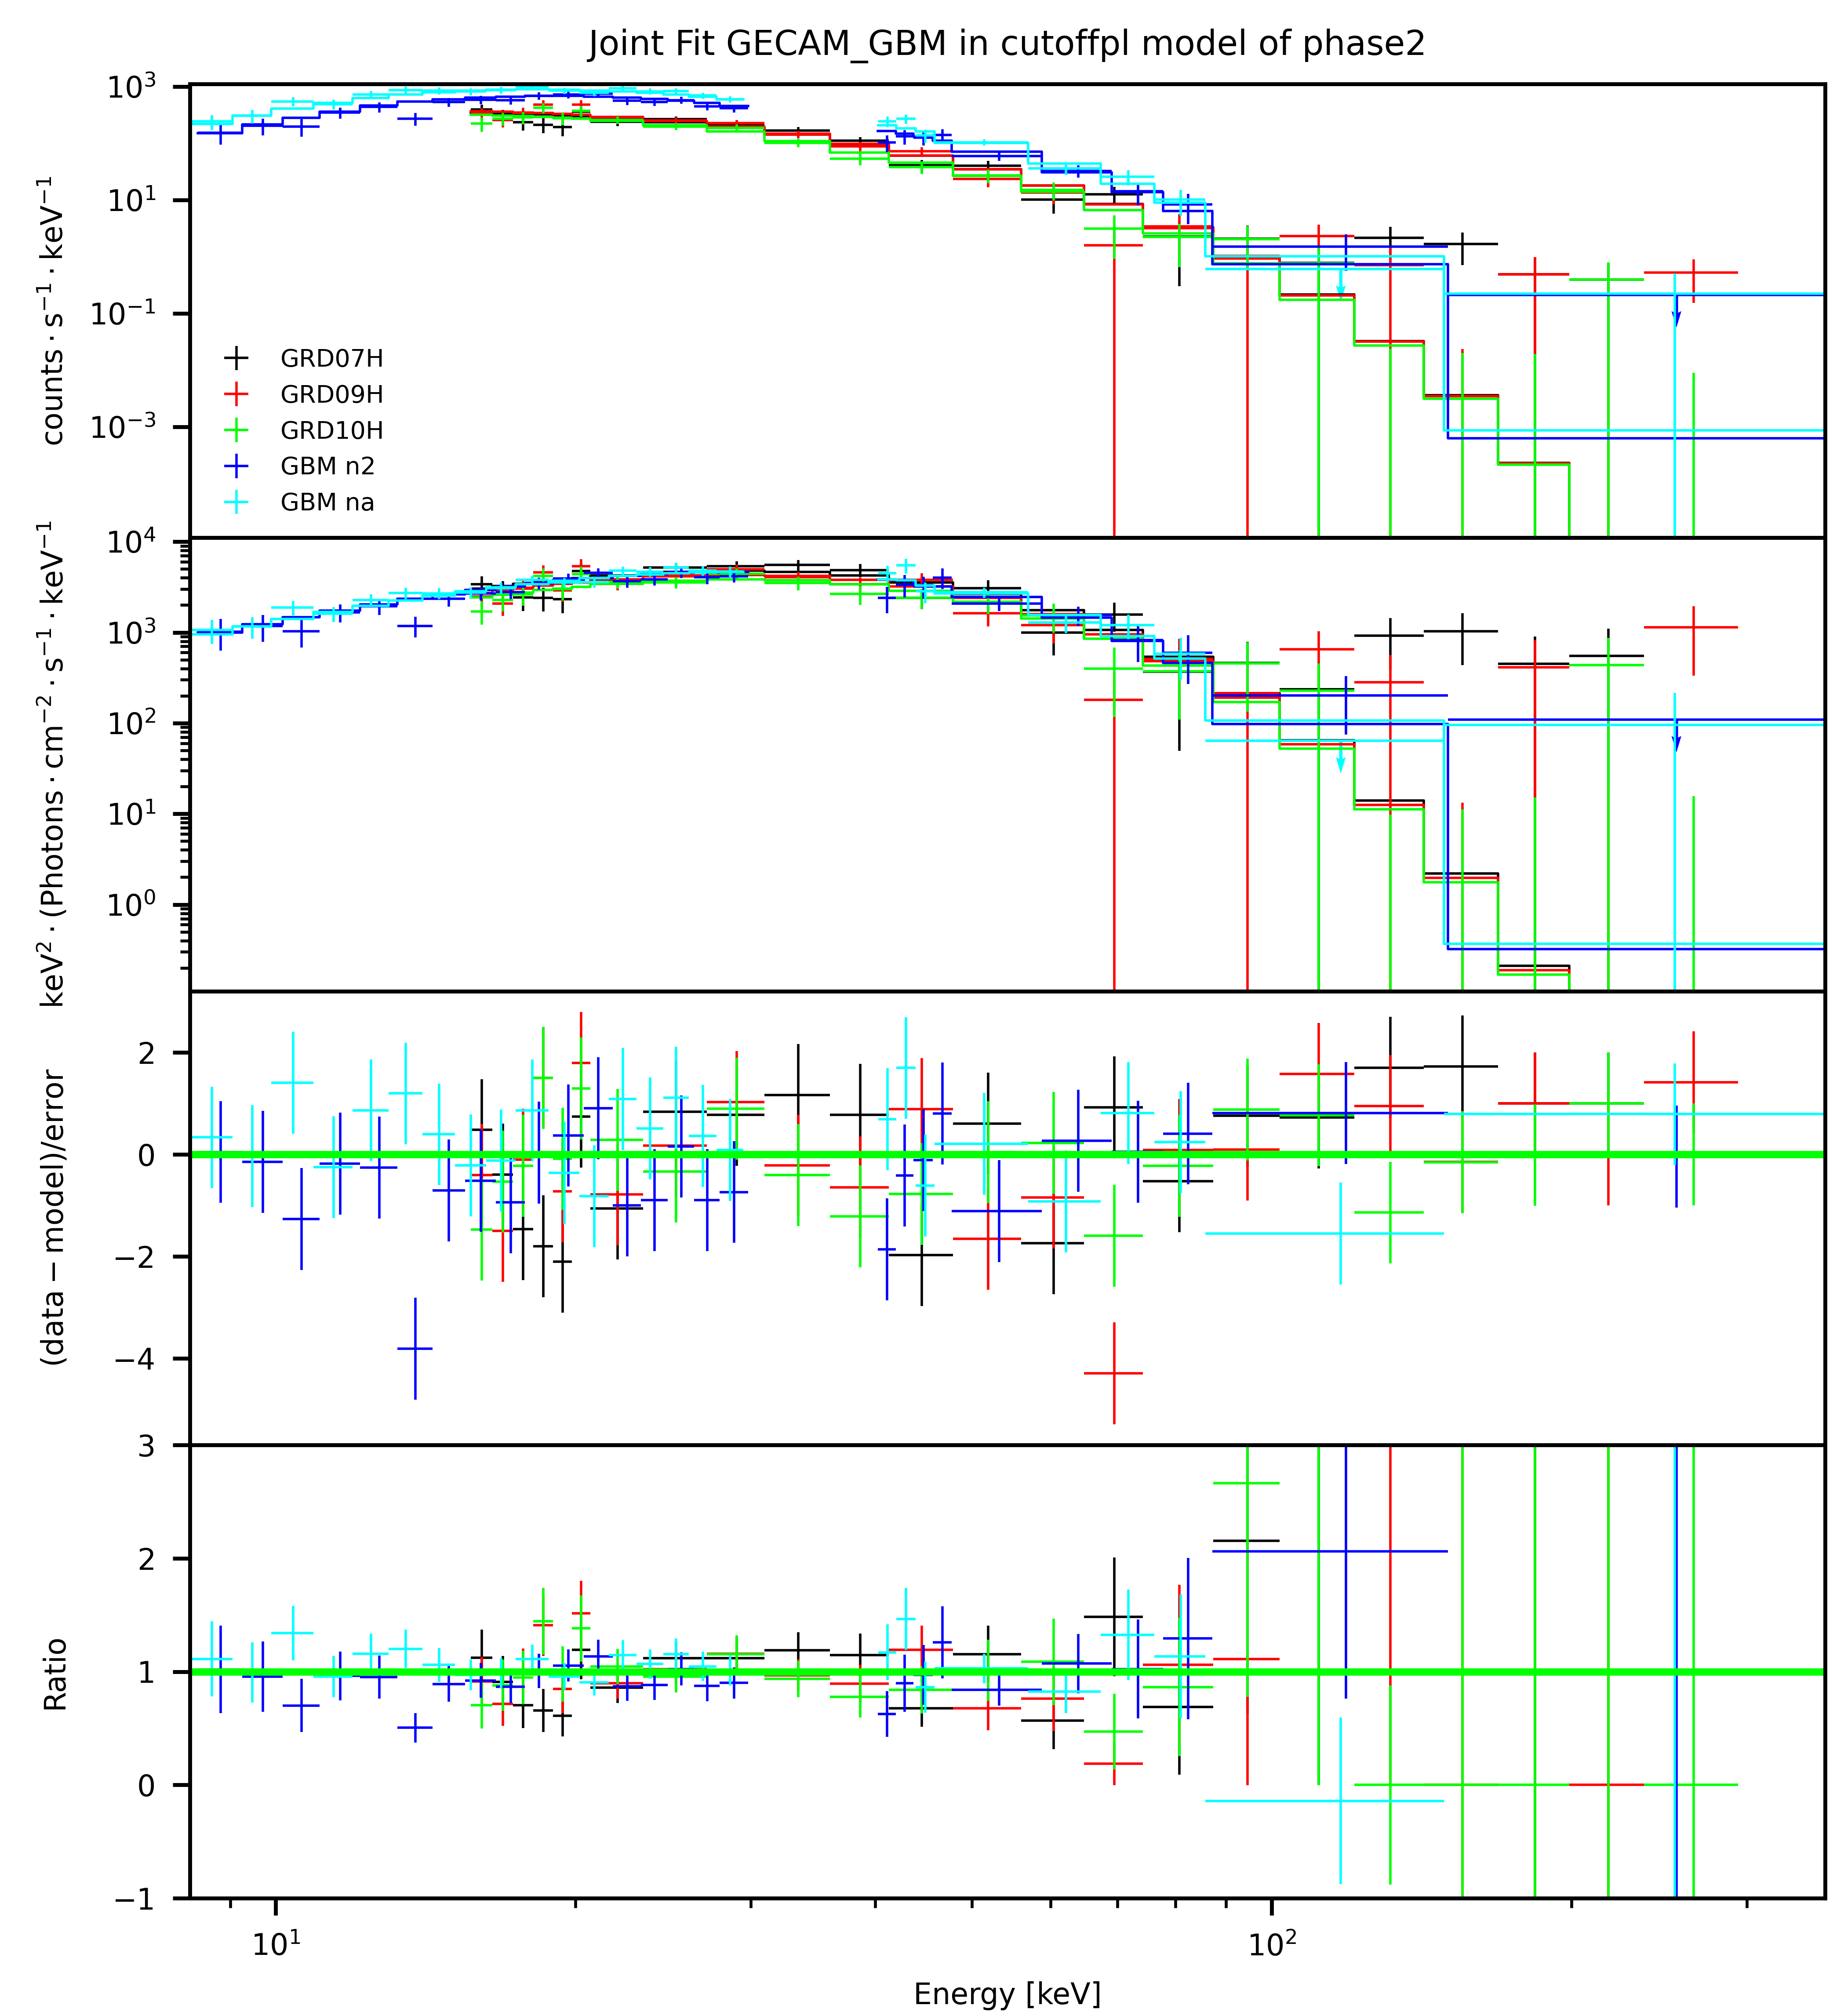
GECAM-C light curves of this GRB are shown in Fig 12. From this figure we can see, this burst is slightly weaker than GRB 220921A due to a larger incident angle. We also calibrated three of the brightest detectors: GRD07, GRD08 and GRD09, with the time interval (T0+[-2,8] s) we choose is shown in Fig 13, this is the brightest time period of the burst.
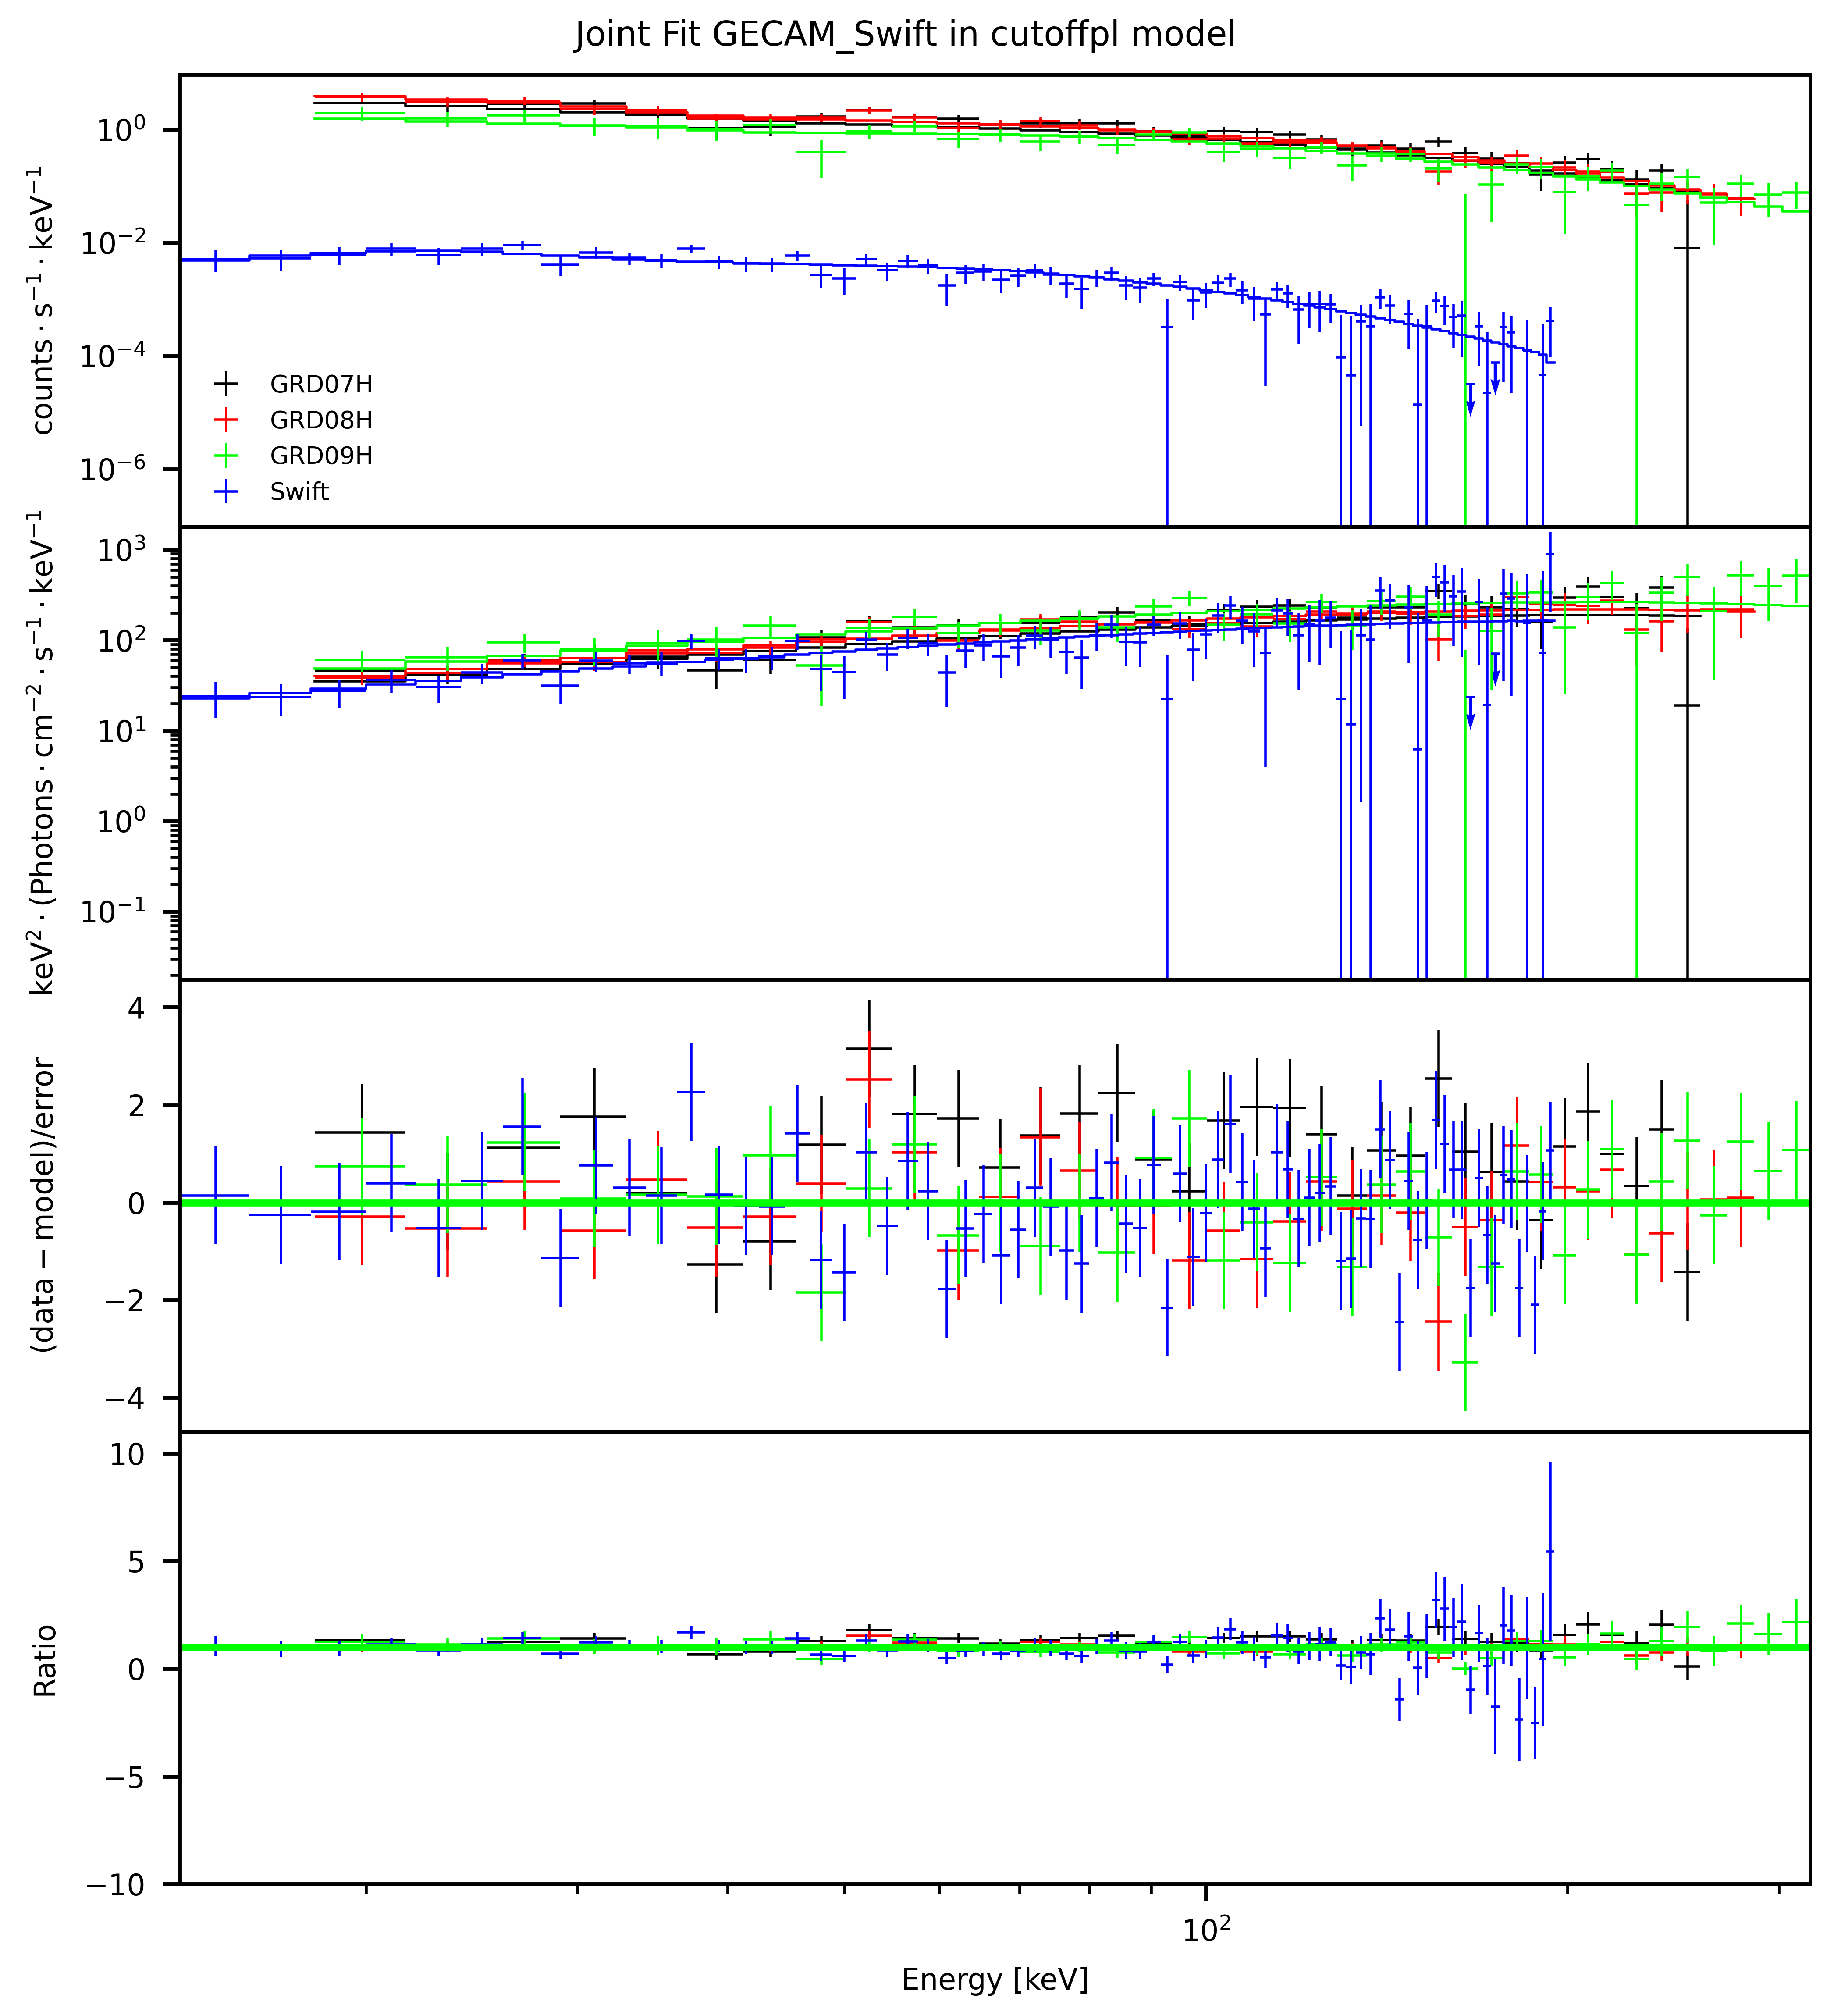
One thing to notice is that for GRB 220930A, there are very few photons at high energies, and the statistical fluctuations are very large for the Low-Gain of GECAM-C, so the constant factor cannot be limited. In other words, this burst can only be used to calibrate the High-Gain of GECAM-C. As shown in Fig 4, there is clearly a cut-off in the spectrum, and fortunately using only Swift/BAT and GECAM-C High-Gain data can limit the spectral Model, and the fit results can be found in Table LABEL:Model_fit_results_for_GRB_220930A_fit_with_High-Gain. From the Fig 4 and Table LABEL:Model_fit_results_for_GRB_220930A_fit_with_High-Gain, we can conclude that the consistency between GECAM-C and Swift/BAT is pretty good because the constant factor of GECAM-C is 1 within the error range and meanwhile spectrum parameters are well constrained.
From the calibration results of this burst, GECAM-C High-Gain response matrix is a good description of its scientific data and is in good agreement with Swift/BAT that has been calibrated.
| (keV) | GRD01 | GRD04 | GRD05 | ||
|---|---|---|---|---|---|
GRD01,04,05 represent the constant factors of the respective detectors
| (keV) | GRD01 | GRD04 | GRD05 | |||||
| High | Low | High | Low | High | Low | |||
GRD01,04,05 represent the constant factors of the respective detectors: High and Low represent High-Gain and Low-Gain read out channels
| (keV) | norm | GRD07 | GRD08 | GRD09 | |
|---|---|---|---|---|---|
GRD07,08,09 represent the constant factors of the respective detectors
2.3 Jonit Analysis of SGRs
Bright SGRs can also be used in cross-calibration as GRBs. However, since the energy spectrum of SGR is relatively soft, so it can only be used to calibrate the low energy range. In the case of GECAM-C, it is High-Gain.
Since the GECAM-C was launched not long ago, there are not enough GRB samples for calibration, so we single out two bright SGRs (SGR 1935+2154) with Fermi/GBM joint observation for calibration, and the lightcurves are shown in Fig 5 and Fig 6 respectively. In addition, for each SGR we split several time segments for fitting. At the same time, because SGR is a short-time scale outbreak, therefore, before we do the spectrum fitting we will correct the optical travel difference between the two satellites first. The exact values are shown in the Table LABEL:Basic_information_of_the_SGRs_sample.
As mentioned before, SGR samples can only be used to calibrate the low-energy part of the instruments, therefore, for this sample, we only selected two relatively bright NaI(Tl) detectors of Fermi/GBM and the High-Gain of GECAM-C for joint data analysis. Additional details about the SGRs are listed in the Table LABEL:Basic_information_of_the_SGRs_sample.
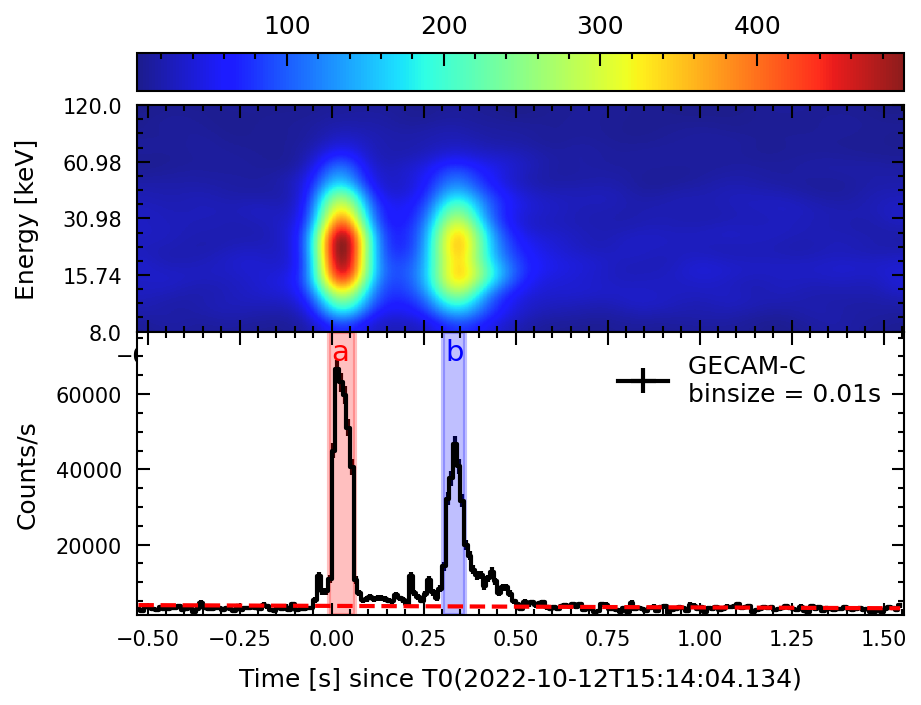
2.3.1 SGR 22110916
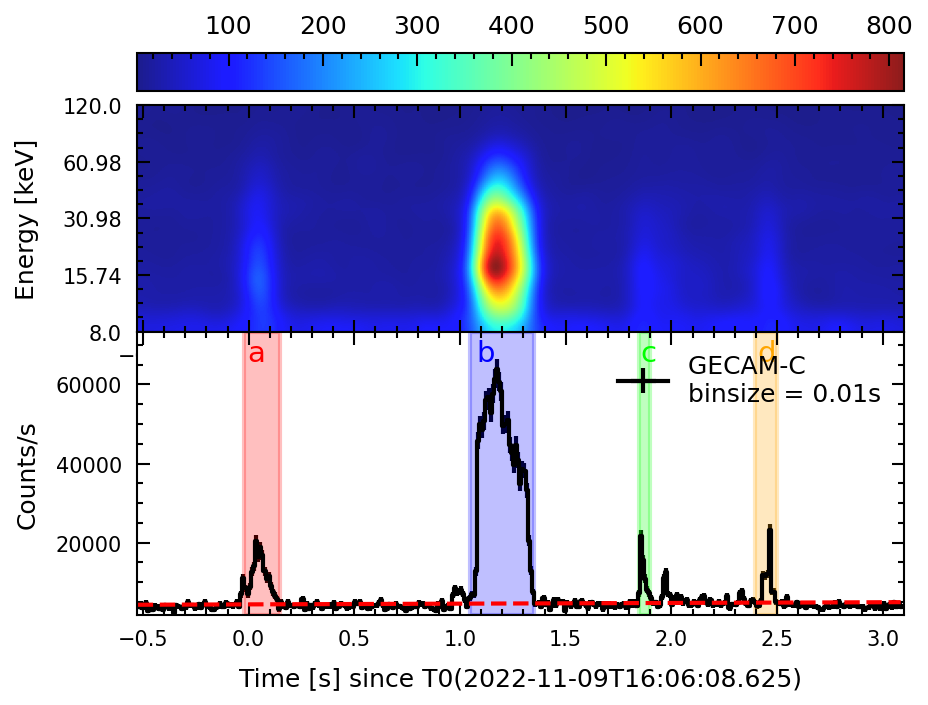
We selected four time segments of SGR 22110916 for the joint data analysis, and the results are organized in the Table LABEL:Model_fit_results_for_SGR_22110916_fit_with_High-Gain. In addition, the spectrum fitting results are shown in the Fig 14. Even though the statistical fluctuation of the data points is more obvious because the number of photons is a little less than that of GRB, the overall fitting residuals are around zero, which mean that the fitting results are very good. What’s more, from the constant factor in the Table LABEL:Model_fit_results_for_SGR_22110916_fit_with_High-Gain, it’s almost always 1, all these indicate that the GECAM-C GRD01,05 detectors are well calibrated for the High-Gain.
2.3.2 SGR 22101215
As with SGR 22110916, we also performed a time-resolved spectrum analysis of this burst. The results are presented in Fig 15 and Table LABEL:Model_fit_results_for_SGR_22101215_fit_with_High-Gain. Even though it has similar brightness to SGR 22110916, the duration of the time segment is shorter, so the statistical fluctuation is going to be a little bit larger. However, within the margin of error it can be said that GECAM-C GRD07, 09, 10 detectors and Fermi/GBM have relatively good agreement, at the same time, the three detectors also have good agreement with each other.
| GRB Name | GRB SGR22101215 | SGR22110916 |
|---|---|---|
| Trigger Time (UTC) | 2022-10-12T15:14:04.134 | 2022-11-09T16:06:08.625 |
| (Ra[∘],Dec[∘],error[′]) | (293.743, +21.896, 3) | (293.743, +21.896, 3) |
| Time Interval (s) | [0.01,0.08],[0.32,0.38] | [-0.04,0.13], [1.03,1.33], [1.83,1.88], [2.38,2.48] |
| ([∘],[∘]) | (141.62,231.78) | (63.16,346.62) |
| Joint Instrument | Fermi/GBM (n2,na) | Fermi/GBM (n0,n1) |
| GECAM-C Detectors | GRD 07,09,10 | GRD 01,05 |
| Aberration | -0.0177 | 0.0179 |
The trigger time is the Fermi/GBM trigger time;
The time interval for joint calibration represent the selected time relative to the trigger time;
Ra and Dec are the location of the GRB burst;
[∘],[∘] denote the incident angle of the source in the GECAM-C payload coordinate system;
GECAM-C Detectors mark the three brightest GRD detectors of GECAM-C used for calibration;
If the aberration is less than zero, it means that GECAM-C triggered later than Fermi/GBM;
| Time range (s) | (keV) | norm | GRD01 | GRD05 | |
|---|---|---|---|---|---|
| (-0.04,0.13) | |||||
| (1.03,1.33) | |||||
| (1.83,1.88) | |||||
| (2.38,2.48) |
GRD01,05 represent the constant factors of the respective detectors
| Time range (s) | (keV) | norm | GRD07 | GRD09 | GRD10 | |
|---|---|---|---|---|---|---|
| (0.01,0.08) | ||||||
| (0.32,0.38) |
GRD07,09,10 represent the constant factors of the respective detectors
3 EFFECT OF THRESHOLD ON EFFICIENCY
The trigger threshold is commonly implemented in the electronics to exclude the low energy noise. There are two types of trigger threshold: the hard-threshold where the trigger efficiency is a heaviside step function, and the soft-threshold where the trigger efficiency goes from 0% to 100% gradually as the signal amplitude increase. The GECAM-C GRDs use a soft trigger threshold as a compromise between lower count rates and the lower energy range. Through our research, it is found that the effect of threshold on the detection efficiency of the detector can be described by a Gaussian CDF function, and the Gaussian parameters are related to the threshold and the noise level:
| (1) |
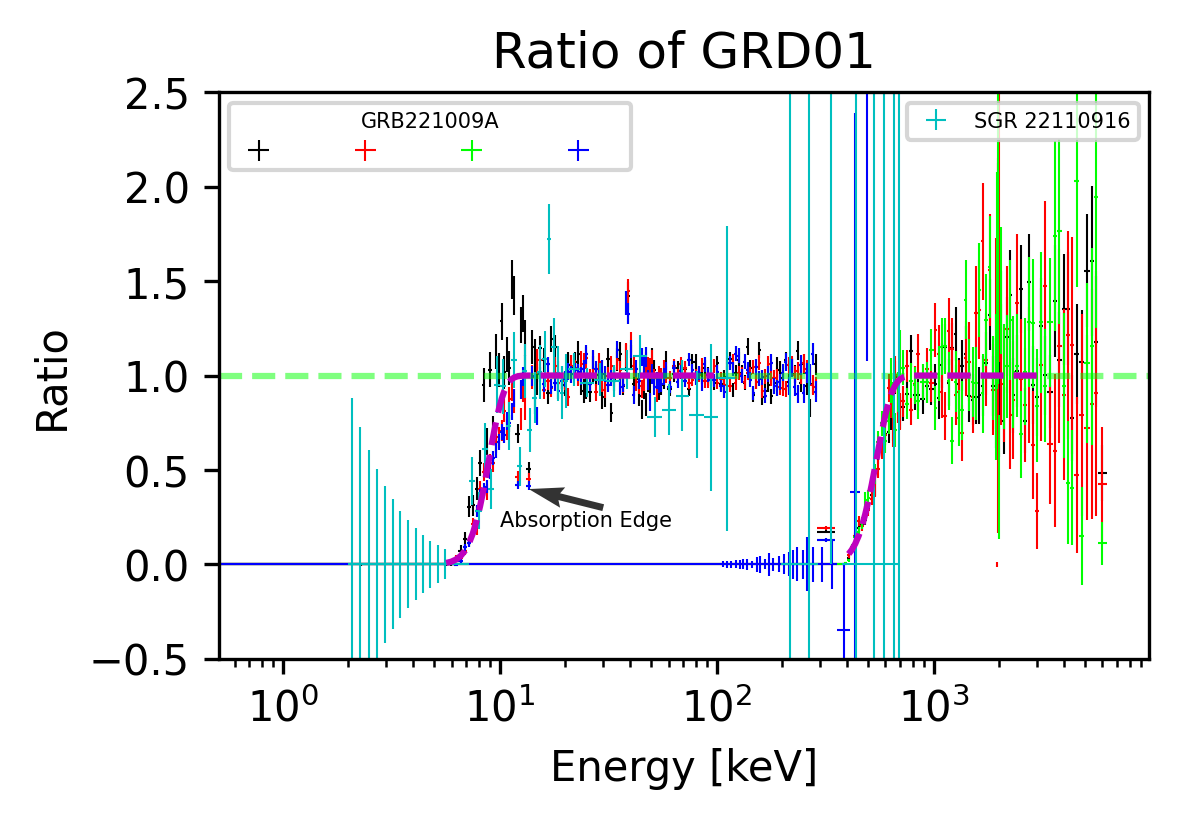
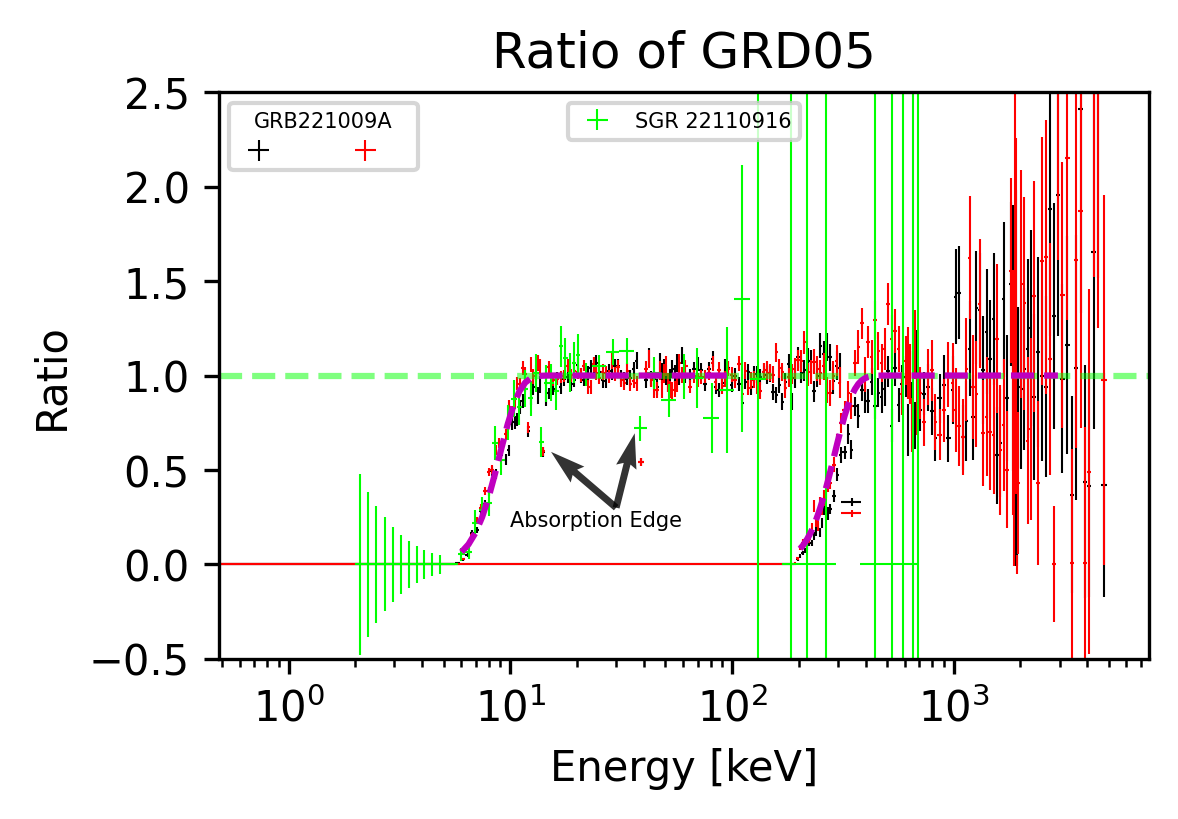
As shown in Fig 7 and Fig 8, the ratio is defined as the net number of photons deposited at the detector by the source divided by the number of photons incident from the source, and this characterizes the effective area or detection efficiency of the detector to a certain extent. However, due to the effect of the threshold and noise we can see that there is a changing trend at the low energy end of both high and low gains, rather than the 100 percent detection efficiency. In addition, this trend is well described by the Gaussian CDF, which means that we can modify the effect of the threshold on the detection efficiency:
| (2) |
where is the existing corresponding matrix that mainly considers the energy resolution and detection efficiency, is the correction component of the threshold on the detection efficiency, and it’s the inverse of the CDF.
We tried this correction for GRD01 and GRD05 as discussed above, and the effect of the correction can be shown in the Fig 9. As can be seen from the residual comparison plot, the effect of correction is very good, this can help us make better use of the GECAM-C scientific data in detectable energy range.
4 CONCLUSION AND SUMMARY
In this paper, we used two relatively bright GRBs and some SGRs with joint observations for the cross-calibration work of the GECAM-C GRD detectors, respectively. For GRB220921A, we calibrate both the High-Gain and Low-Gain channel of the GRDs. For the other samples, due to the soft spectrum, we only use the High-Gain of GECAM-C. All calibration results show that the constant factors for the GECAM-C GRDs are close to one, and the spectral model can also be well constrained. These results demonstrate that there is a very good agreement between GECAM-C GRDs and the other well calibrated instruments (i.e. Fermi/GBM and Swift/BAT). Meanwhile, we also find good agreement between GRD detectors of GECAM-C.
Besides, we try to correct the effect of the threshold of GRD01,05 on the detection efficiency with a Gaussian CDF function. As shown in Fig 9, the effect of correction is reasonably good. This can help us make better use of the data at the low energy range (8-10 keV at present) in our analysis.
-
Acknowledgements
We thank supports from the staff of the Key Laboratory of Particle Astrophysics, Center for Space Science who offered great help in the development and calibration tests of GECAM-C. This research is supported by National Key R&D Program of China (Grant No. 2021YFA0718500), the Strategic Priority Research Program of Chinese Academy of Sciences (GranNo. XDA15360102), the National Natural Science Foundation of China (Grant No. 12273042).
—————————————————————————–
References
- [1] DL Zhang et al. The performance of sipm-based gamma-ray detector onboard gecam-c. In-prepare.
- [2] Xiaoyu Qie, Siming Guo, Jiang He, Zheng Jiang, Tao Yu, Xing Wen, Shiwei Ren, Zhenghua An, and Jinjie Wu. Study on the performance of sy-01 satellite gamma-ray detector. In 2021 IEEE 15th International Conference on Electronic Measurement & Instruments (ICEMI), pages 254–258. IEEE, 2021.
- [3] XQ Li, XY Wen, ZH An, C Cai, Z Chang, G Chen, C Chen, YY Du, M Gao, R Gao, et al. The technology for detection of gamma-ray burst with gecam satellite. Radiation Detection Technology and Methods, pages 1–14, 2021.
- [4] ZH An, XL Sun, DL Zhang, S Yang, XQ Li, XY Wen, K Gong, XH Liang, XJ Liu, YQ Liu, et al. The design and performance of grd onboard the gecam satellite. Radiation Detection Technology and Methods, 6(1):43–52, 2022.
- [5] YB Xu, XQ Li, XL Sun, S Yang, H Wang, WX Peng, XH Liang, K Gong, YQ Liu, DY Guo, et al. The design and performance of charged particle detector onboard the gecam mission. Radiation Detection Technology and Methods, 6(1):53–62, 2022.
- [6] P Lv, SL Xiong, XL Sun, JG Lv, and YG Li. A low-energy sensitive compact gamma-ray detector based on labr3 and sipm for gecam. Journal of Instrumentation, 13(08):P08014, 2018.
- [7] DL Zhang, XL Sun, ZH An, XQ Li, XY Wen, K Gong, C Cai, Z Chang, G Chen, C Chen, et al. Dedicated sipm array for grd of gecam. Radiation Detection Technology and Methods, 6(1):63–69, 2022.
- [8] Dongya Guo, Wenxi Peng, Yue Zhu, Gang Li, Jinyuan Liao, Shaolin Xiong, Rui Qiao, Xinqiao Li, Zhenghua An, Yanbing Xu, et al. Energy response and in-flight background simulationfor gecam. SCIENTIA SINICA Physica, Mechanica & Astronomica, 50(12):129509, 2020.
- [9] C Zheng et al. Ground calibration of gamma-ray detectors of gecam-c. In-prepare.
- [10] Qi Luo, Jin-Yuan Liao, Xu-Fang Li, Gang Li, Juan Zhang, Cong-Zhan Liu, Xiao-Bo Li, Yue Zhu, Cheng-Kui Li, Yue Huang, et al. Calibration of the instrumental response of insight-hxmt/he csi detectors for gamma-ray monitoring. Journal of High Energy Astrophysics, 27:1–13, 2020.
- [11] Takanori Sakamoto, Valentin Pal’Shin, Kazutaka Yamaoka, Masanori Ohno, Goro Sato, Rafail Aptekar, Scott D Barthelmy, Wayne H Baumgartner, Jay R Cummings, Edward E Fenimore, et al. Spectral cross-calibration of the konus-wind, the suzaku/wam, and the swift/bat data using gamma-ray bursts. Publications of the Astronomical Society of Japan, 63(1):215–277, 2011.
- [12] Charles Meegan, Giselher Lichti, PN Bhat, Elisabetta Bissaldi, Michael S Briggs, Valerie Connaughton, Roland Diehl, Gerald Fishman, Jochen Greiner, Andrew S Hoover, et al. The fermi gamma-ray burst monitor. The Astrophysical Journal, 702(1):791, 2009.
- [13] Michael Stamatikos. The cross-calibration of swift-bat and fermi-gbm via correlative spectral analysis of grbs. arXiv preprint arXiv:0907.3190, 2009.
- [14] Dave Tierney, Sheila McBreen, Lorraine Hanlon, Suzanne Foley, Antonio Martin-Carrillo, Martin Topinka, Seamus Meehan, and Fermi GBM Team. Spectral cross-calibration of fermi-gbm and integral-isgri using gamma-ray bursts. In AIP Conference Proceedings, volume 1358, pages 397–400. American Institute of Physics, 2011.
- [15] A Von Kienlin, MS Briggs, V Connoughton, S McBreen, RD Preece, Sergey Sazonov, Sergey Tsygankov, and CA Wilson-Hodge. Using grb 080723b to cross-calibrate fermi/gbm and integral. In AIP Conference Proceedings, volume 1133, pages 446–448. American Institute of Physics, 2009.
- [16] Neil Gehrels, Guido Chincarini, P ea Giommi, KO Mason, JA Nousek, AA Wells, NE White, SD Barthelmy, DN Burrows, LR Cominsky, et al. The swift gamma-ray burst mission. The Astrophysical Journal, 611(2):1005, 2004.
- [17] Masaya Suzuki, Makoto Tashiro, Goro Sato, Shin Watanabe, Tadayuki Takahashi, Yuu Okada, Hiromitsu Takahashi, Ann Parsons, Scott Barthelmy, Jay Cummings, et al. Hard x-ray response of cdznte detectors in the swift burst alert telescope. In 2003 IEEE Nuclear Science Symposium. Conference Record (IEEE Cat. No. 03CH37515), volume 5, pages 3550–3554. IEEE, 2003.
- [18] D Band, J Matteson, L Ford, B Schaefer, D Palmer, B Teegarden, T Cline, M Briggs, W Paciesas, G Pendleton, et al. Batse observations of gamma-ray burst spectra. i-spectral diversity. The Astrophysical Journal, 413:281–292, 1993.
Appendix A Thre light curves of GECAM-C
A.1 GRB 220921A
A.2 GRB 220930A
A.3 SGR 22110916
A.4 SGR 22101215