Colossal magnetoresistance in EuZn2P2 and its electronic and magnetic structure
Abstract
We investigate single crystals of the trigonal antiferromagnet EuZn2P2 () by means of electrical transport, magnetization measurements, X-ray magnetic scattering, optical reflectivity, angle-resolved photoemission spectroscopy (ARPES) and ab initio band structure calculations (DFT+U). We find that the electrical resistivity of EuZn2P2 increases strongly upon cooling and can be suppressed in magnetic fields by several orders of magnitude (CMR effect). Resonant magnetic scattering reveals a magnetic ordering vector of , corresponding to an -type antiferromagnetic (AFM) order, below = 23.7 K. We find that the moments are canted out of the plane by an angle of about degrees and aligned along the [100] direction in the plane. We observe nearly isotropic magnetization behavior for low fields and low temperatures which is consistent with the magnetic scattering results. The magnetization measurements show a deviation from the Curie-Weiss behavior below , the temperature below which also the field dependence of the material’s resistivity starts to increase. An analysis of the infrared reflectivity spectrum at allows us to resolve the main phonon bands and intra-/inter-band transitions, and estimate indirect and direct band gaps of and , respectively, which are in good agreement with the theoretically predicted ones. The experimental band structure obtained by ARPES is nearly -independent above and below . The comparison of the theoretical and experimental data shows a weak intermixing of the Eu 4 states close to the point with the bands formed by the phosphorous 3 orbitals leading to an induction of a small magnetic moment at the P sites.
I Introduction
Today, more and more trigonal Eu-based compounds of the EuT2X2 (T = Cd, Zn; X = P, Sb, As) family with CaAl2Si2-type structure in the space group (164) come into focus as magnetic topologically non-trivial materials. In recent studies, antiferromagnetic (AFM) EuCd2As2, [1] with -type AFM structure and in-plane moments [2], has attracted considerable attention due to the observation of strong coupling between charge transport and magnetism [3] as well as the emergence of topological phases [4].
In the paramagnetic phase of EuCd2As2, a "spin-fluctuation-induced" Weyl semimetal state [4] and its tunability by pressure [5] was discovered. Using first-principles band structure calculations it was predicted that EuCd2As2 in a ferromagnetic configuration (with out-of-plane moments) can host a single pair of Weyl points due to the half-metallic nature of the material [6]. This has recently been confirmed experimentally [7] making EuCd2As2 a model semimetal suitable for fundamental tests of Weyl physics. Furthermore, the related AFM material EuCd2P2, [1], shows a colossal magnetoresistance (CMR) effect [8]. Recently, Sunko et al. discovered the onset of ferromagnetic order above in the temperature range of a pronounced resistivity peak [9].
Using Monte-Carlo simulations, Heinrich et al. explored the magnetic phases predicted by a microscopic classical magnetic model for EuCd2P2, providing qualitative numerical evidence that the CMR effect is related to a magnetic Berezinskii-Kosterlitz-Thouless (BKT) transition [10].
This variety of interesting topological and magnetic phenomena in the trigonal EuT2X2 systems also led to the first investigation of a related compound, namely EuZn2P2 [11]. Insulating behavior was found, when measured down to and -type AFM order with magnetic Eu2+ moments aligned in the plane has been inferred from combined magnetic measurements and density functional theory (DFT) calculations [11].
Anticipating a strong coupling of the charge transport with the system’s magnetization, we investigate the magnetic and electronic properties of EuZn2P2 in detail down to low temperatures.
We performed a comprehensive study of the magnetic ground state of the material combining magnetization measurements and X-ray magnetic scattering. In transport measurements, we observe a CMR effect at low temperatures in EuZn2P2, a system not being a mixed-valent perovskite manganite and not a ferromagnet [12, 13, 14].
Similar to the CMR effect in EuCd2P2, we find that in EuZn2P2 the resistivity becomes strongly suppressed in a magnetic field upon approaching the AFM ordering temperature with the onset of the large negative magnetoresistance (MR) occurring at temperatures as high as six times .
Furthermore, we present ARPES data together with the modeling of the band structure using DFT+U calculations as well as optical reflectivity data allowing us to determine the indirect and direct band gaps.
II Experimental details
II.1 Crystal growth
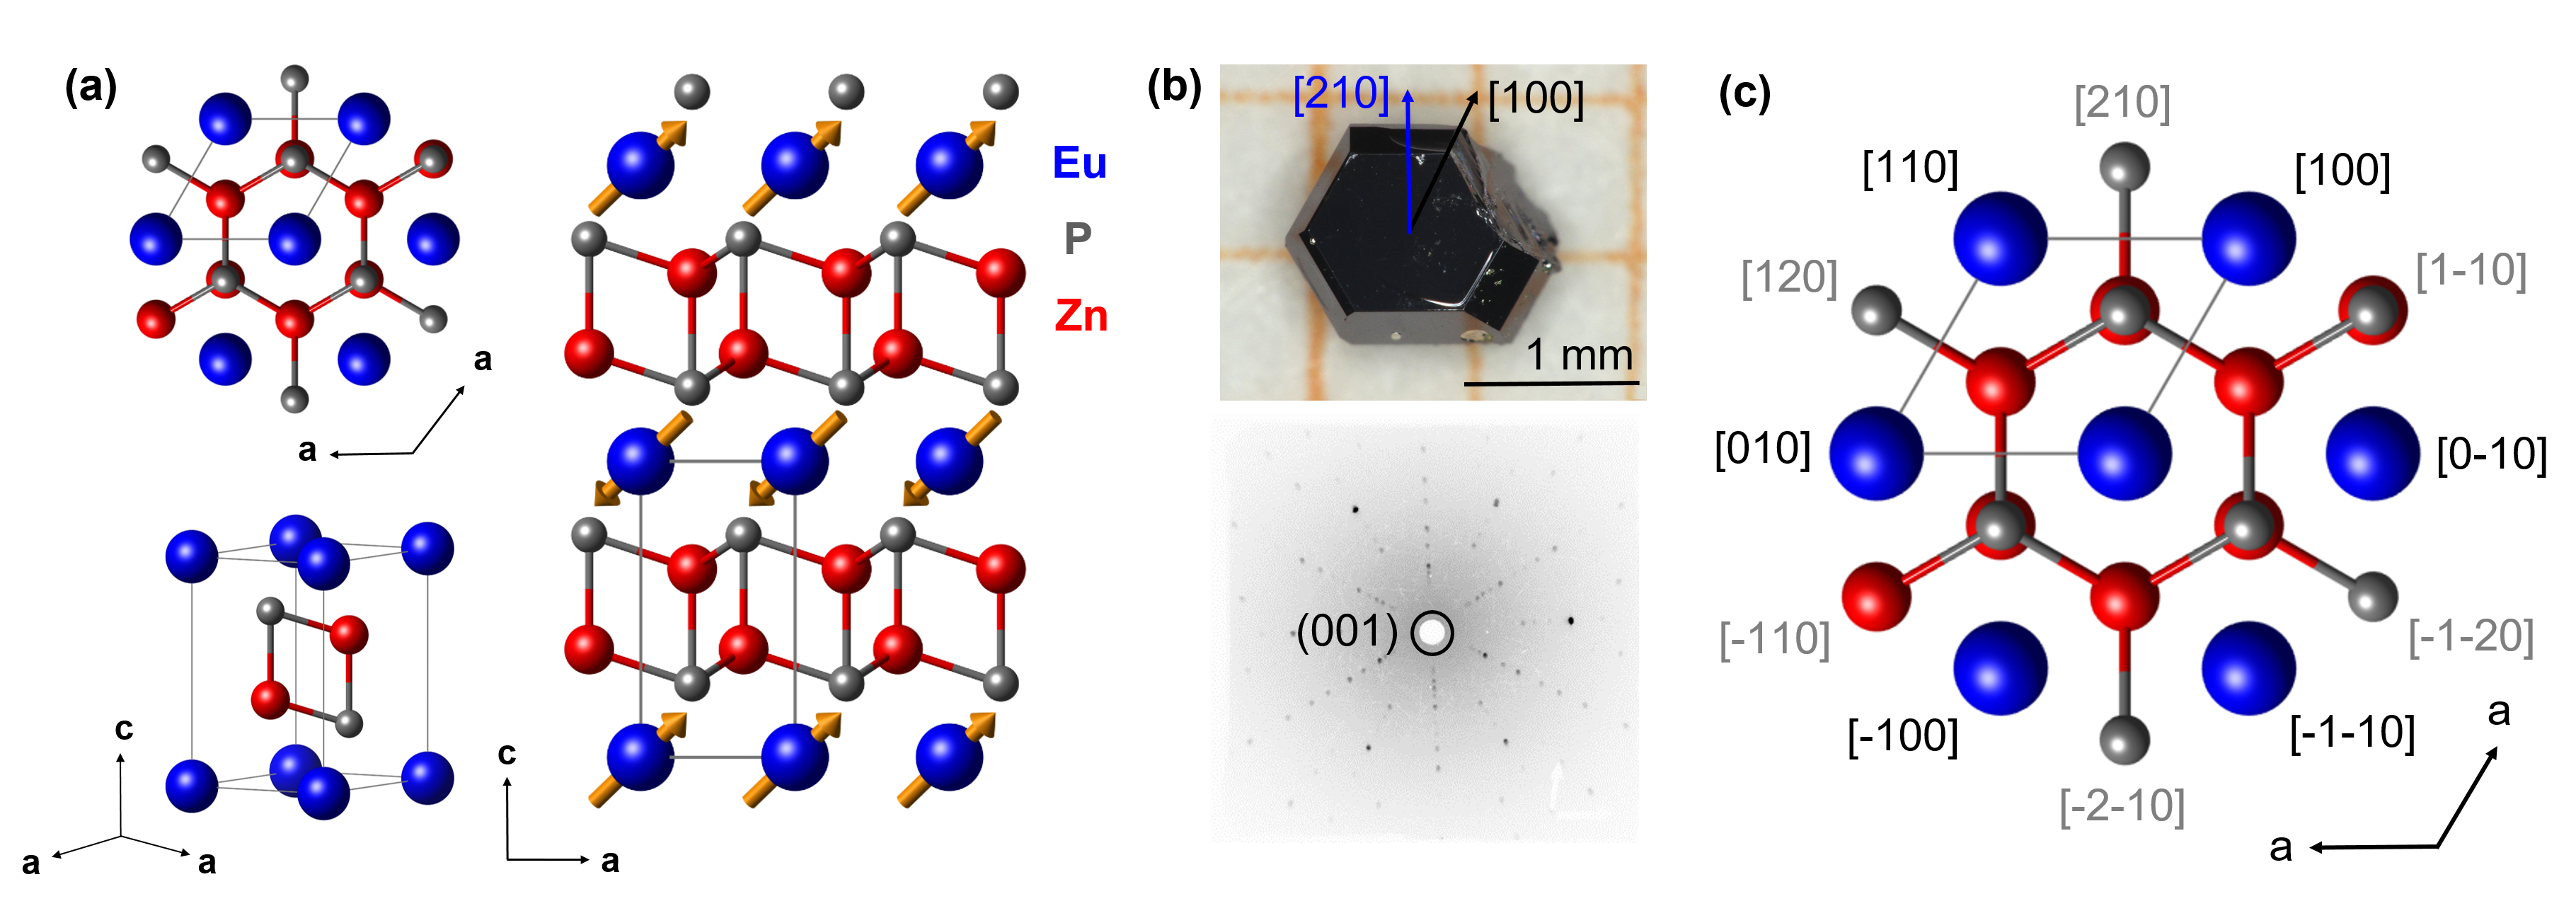
Single crystals of trigonal EuZn2P2, Fig. 1, were grown from an external Sn flux by using ingots of europium (99.99 %, Evochem), red phosphorous (99.9999 %, Chempur), tin (99.999 %, Evochem) and teardrops of zinc (99.9999 %, Chempur). All elements were cut into small pieces and mixed together with a molar ratio of Eu:Zn:P:Sn = 1:2:2:20. This stoichiometry was initially utilized in analogy to the recipe used in [8] for EuCd2P2. All reactants and products were handled under an inert Ar atmosphere inside a glove box. The starting materials were put in a graphite crucible inside an evacuated quartz ampule. The ampule was then loaded into a box furnace (Thermconcept), heated up to and held for . This ensures that the phosphorous slowly reacts with the other materials. Afterwards, the temperature was raised to and held there for a few hours in order to homogenize the melt. The temperature was then slowly lowered to with a rate of /h, where the liquid flux was then removed by centrifuging. Several optimization steps with respect to stoichiometry and temperature profile were carried out in order to obtain large and high-quality single crystals. Hexagonal-shaped single crystals with an average size of were obtained, see Fig. 1(b). Remaining tin on the surfaces of the crystals was removed mechanically.
II.2 Structural, chemical and magnetic characterization
X-ray powder diffraction (PXRD) was used to confirm the trigonal space group (No. 164) on powdered single crystals, Fig. 1. The refined lattice parameters Å and Å are in good agreement with the literature [15, 11]. The diffraction patterns were recorded on a diffractometer with Bragg-Brentano geometry and copper Kα radiation.
Additionally, we performed single crystal X-ray diffraction on a small platelet selected from a EuZn2P2 sample. This data were collected at 212 K on STOE IPDS II two-circle diffractometer equipped with the Genix 3D HS microfocus Mo K X-ray source ( = 0.71073 Å). The finalization of the data, including empirical absorption corrections, was done using the CrysAlisPro software (Rigaku Oxford Diffraction, 2022). The initial structural model was taken from the literature [11]. The structure was refined in the anisotropic approximation against with full-matrix least-squares techniques using the program SHELXL-2018/3 [16]. Crystallographic data and parameters of the diffraction experiments are given in Table 1. The CIF file is deposited in Cambridge Crystallographic Data Center under the code CSD 2262937 [17]. The results show that the crystal structure is fully consistent with the previously reported data by [11]. At that, the refinement of the site occupancy factor of the phosphorous atom gives no signs for any off-stoichiometry and the diffraction pattern can be fully indexed in the hexagonal unit cell without any traces of modulation. Therefore, we can exclude pronounced structural defects in our crystals of EuZn2P2.
| Material | EuZn2P2 |
|---|---|
| Mr | 344.64 |
| Crystal system | Trigonal |
| Space group | Pm1 (No. 164) |
| Temperature (K) | 212 |
| Lattice parameters | |
| a ( Å ) | 4.08582(10) |
| c ( Å ) | 7.0041(3) |
| V ( Å 3) | 101.26(1) |
| Z | 1 |
| F(000) | 153 |
| Dx (Mg m-3) | 5.652 |
| Radiation type | Mo K |
| (mm-1) | 27.59 |
| Crystal size (mm) | 0.07 × 0.06 × 0.03 |
| Crystal shape, colour | Platelet, black |
| R | 0.081 |
| 2 (°) | 67.2 |
| 0.016, 0.037, 1.16 | |
| No. of parameters | 10 |
| , () | 1.11, -1.32 |
| for F2 | |
| for all reflections | |
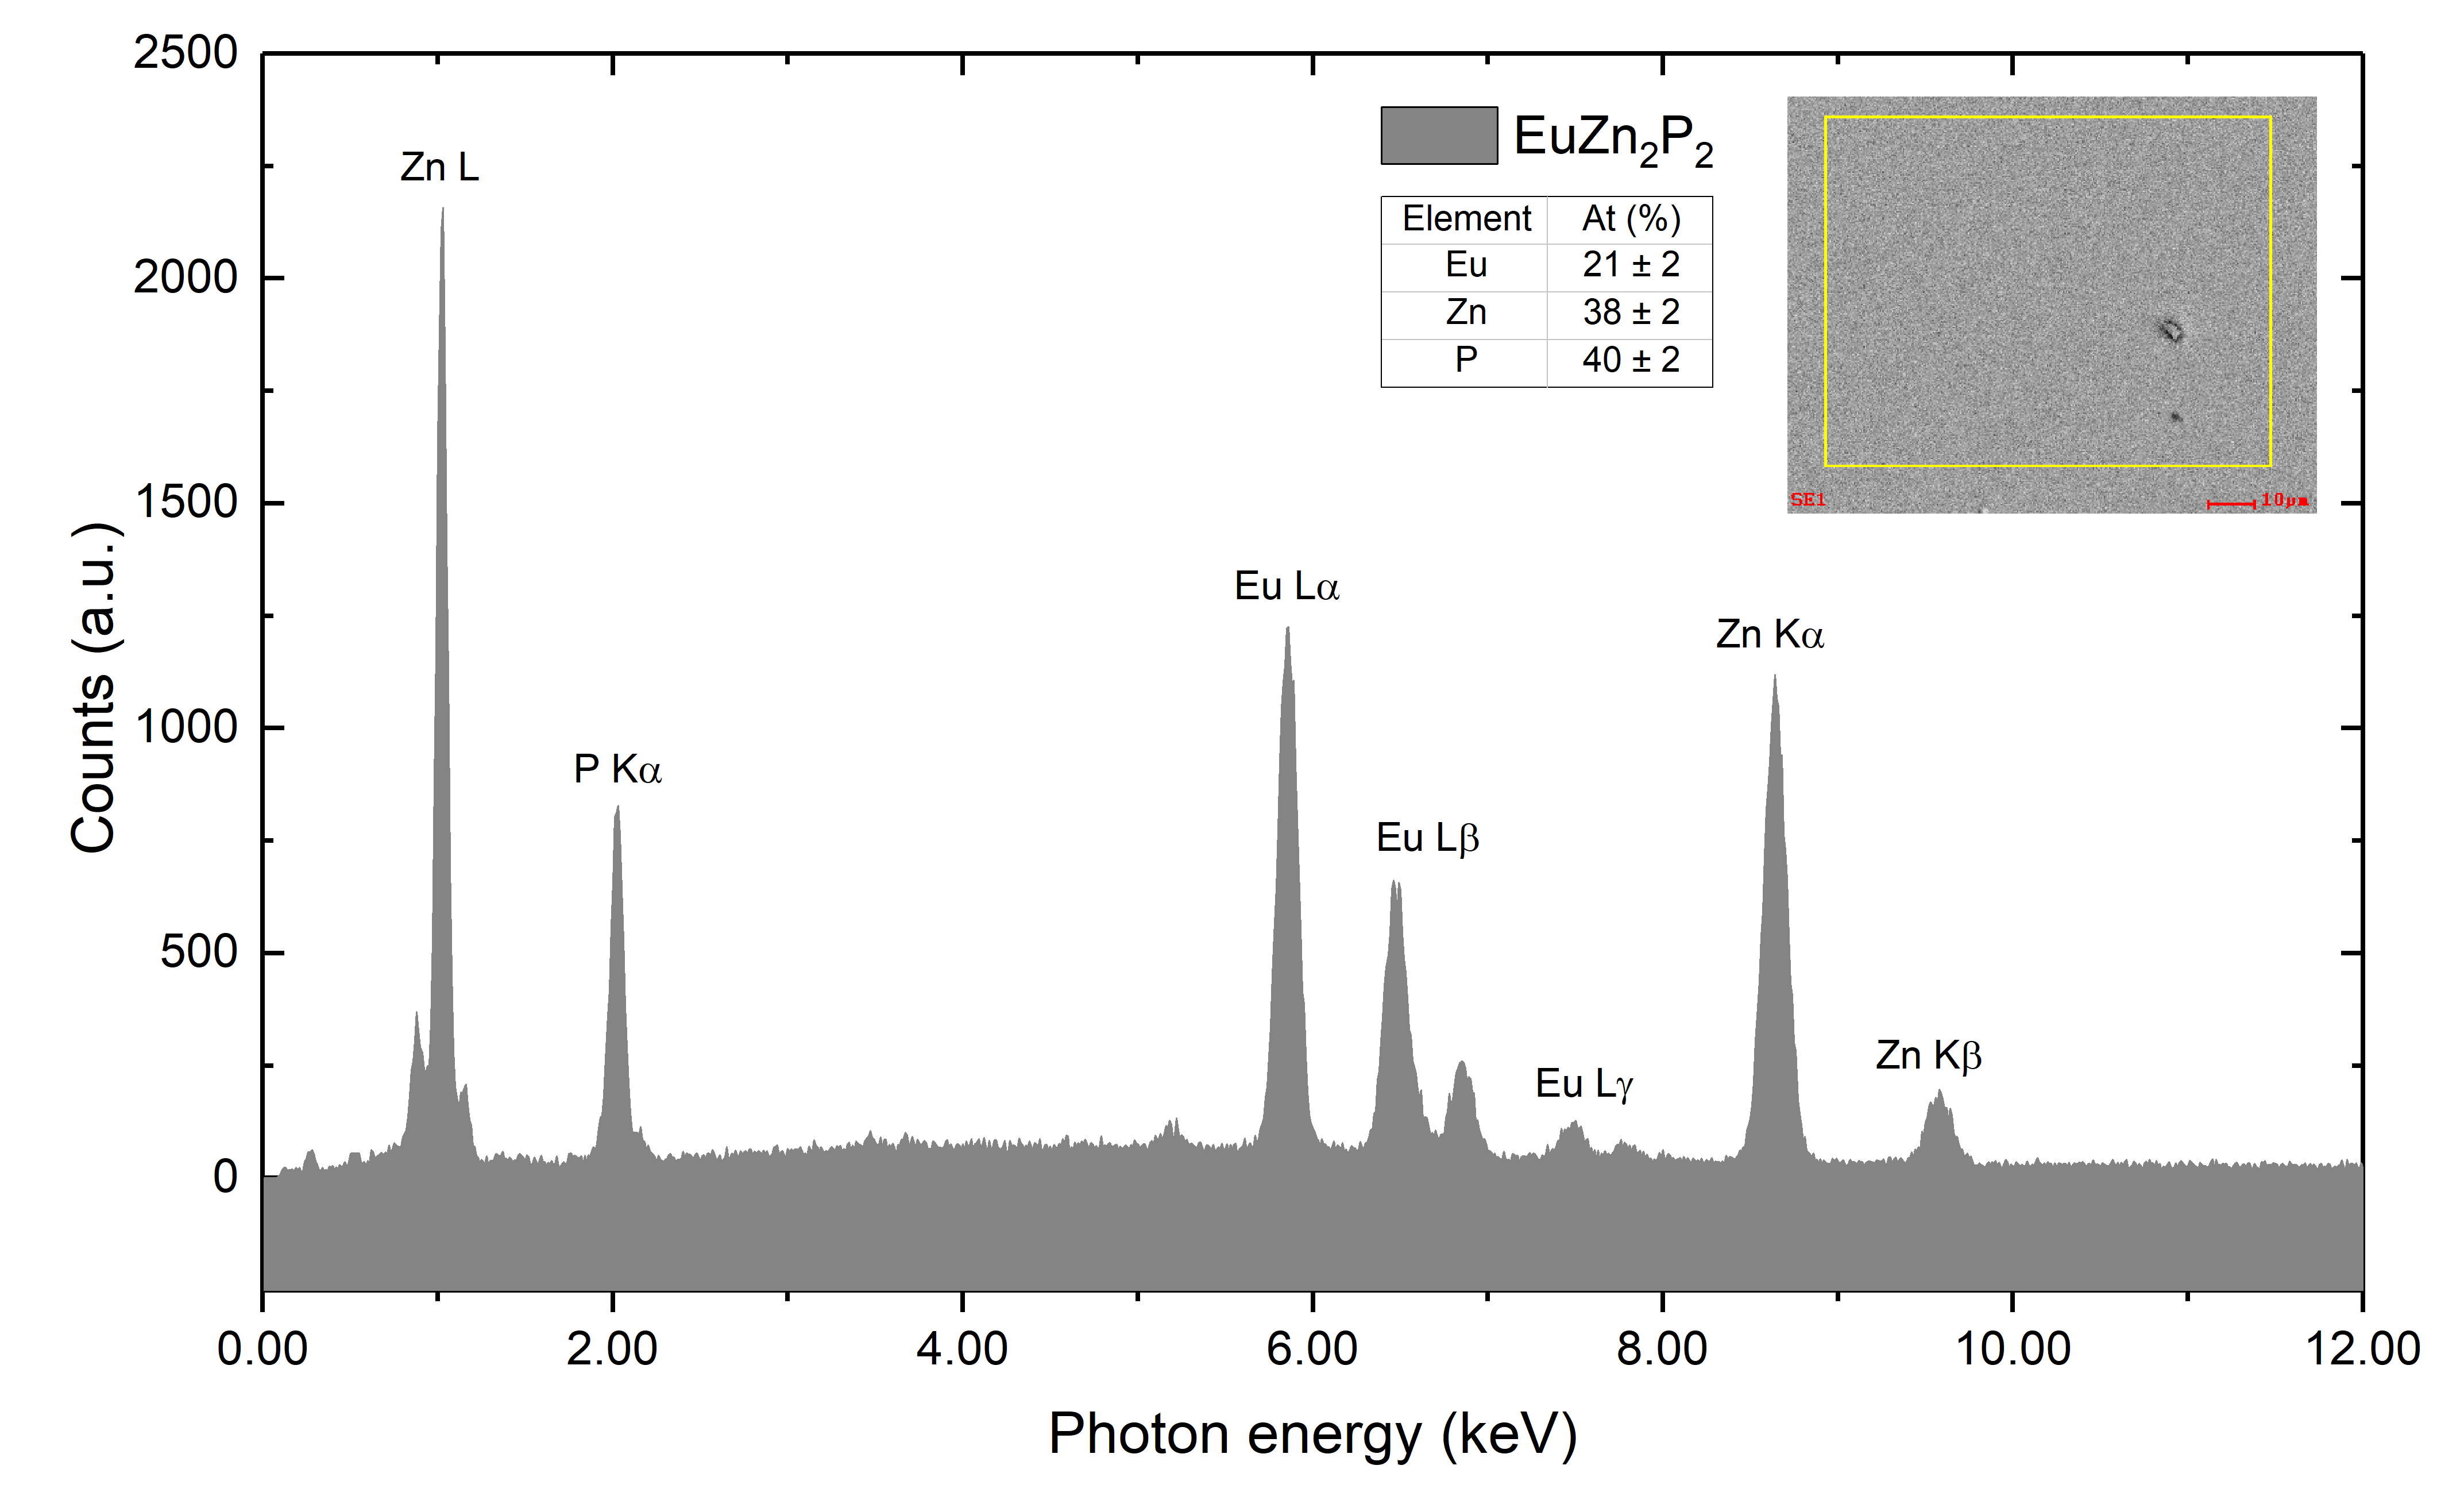
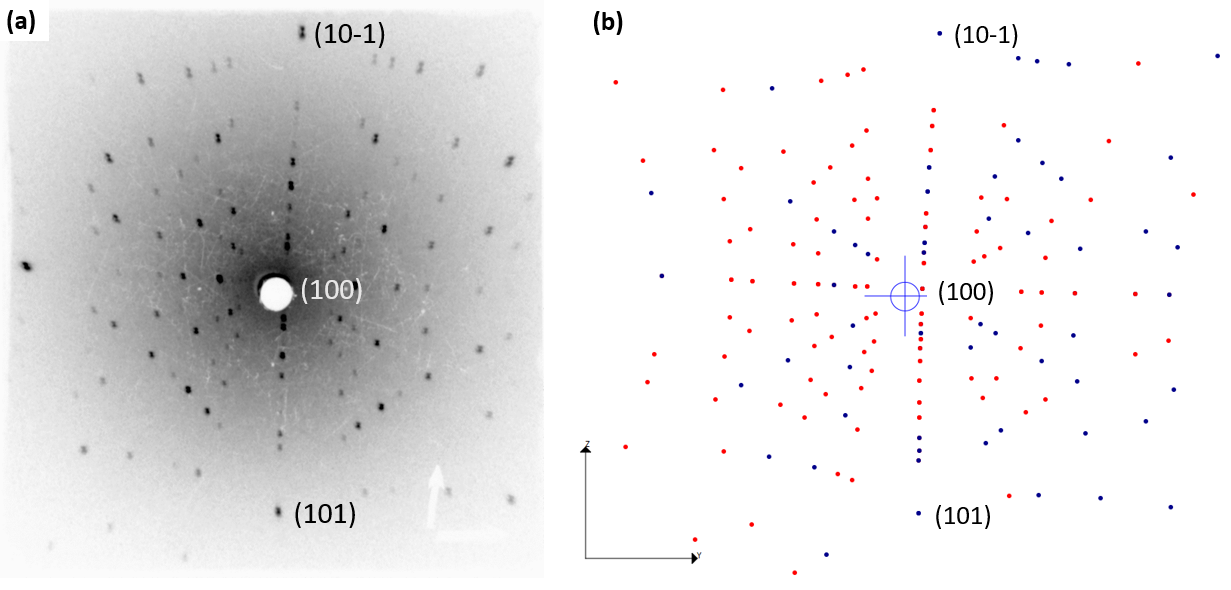
The orientation of the single crystals was determined using the Laue method and the spectra were simulated using QLaue software as shown in the appendix S6. Fig. 1(b) shows the recorded Laue pattern with the beam parallel to the -axis. The sharp spots in the pattern suggest a high crystallinity of the samples and additionally the sixfold symmetry of the samples can be seen. The chemical composition of the EuZn2P2 single crystals was confirmed with energy-dispersive X-ray spectroscopy (EDX). A Quantum Design physical property measurement system (PPMS) was used to investigate the magnetic properties and the heat capacity of EuZn2P2. The heat capacity measured on our single crystals, Fig. S1, confirms the occurrence of the AFM transition at and is consistent with the previously published data in Ref. [11]. The grown crystals are hexagonal shaped platelets, where the direction perpendicular to the platelet is along the [001]-direction. The natural crystal edges are perpendicular to the -direction in real space and the corners of the crystal are along the -direction, Fig. 1(c). This notation will be used to describe the direction of the applied magnetic field in the magnetization measurements. Note that in the trigonal space group 164, the angle between the basis vector in real space and the basis vector in reciprocal space is 30∘.
II.3 Electrical transport
Electrical transport measurements were carried out on polished EuZn2P2 samples with thermally evaporated chromium/gold layers (7 nm/200 nm thickness) contacted by conducting silver paste in order to ensure ohmic behavior of the contacts, which were checked by measuring the - characteristics at different temperatures. The evaporation process also allows for a well-defined contact geometry on the - surface in a desired four-point configuration. We used a low-frequency lock-in technique to measure the resistance in the ohmic regime and calculated the resistivity from the contact geometry in the - plane and the dimensions along . Furthermore, we found that without polishing the crystals and with contacts painted with silver epoxy directly on the surface of the crystals we observe nonlinear I-V curves and the temperature dependence down to 150 K was similar to what was observed in Ref. [11].
II.4 Resonant magnetic X-ray diffraction
Resonant magnetic diffraction measurements were performed at the ID32 soft X-ray beamline of the ESRF [18]. We used the four-circle diffractometer with a photodiode detector in horizontal diffraction geometry mounted in the RIXS endstation. An Apple-II type undulator operated on its first harmonic delivered the and polarized incident beam. The photon energy was set to slightly below the white line in the Eu2+ M5 absorption spectrum. The beam spot size at the sample was µm2. We cleaved the sample inside the vacuum chamber in order to obtain a surface with larger terraces compared to the as-grown surface. In this way, we were able to obtain magnetic domains larger than the beam spot size on which we could measure the azimuth dependence of the intensity ratio of the magnetic Bragg peak.
II.5 DFT+U calculations
The electronic structure calculations were performed using the OpenMX code which provides a fully relativistic DFT implementation with localized pseudoatomic orbitals [19, 20, 21] and norm-conserving pseudopotentials [22]. The exchange-correlation energy in local spin density approximation was employed [23]. The accuracy of the real-space numerical integration was specified by the cutoff energy of 200 Ry, and the total energy convergence criterion was eV. The -mesh for Brillouin zones were specified as . The basis functions were taken as P7.0-s2p2d1f1, Zn6.0H-s3p2d1, Eu8.0-s3p2d2f1 (the pseudopotential cutoff radius is followed by a basis set specification). Experimental unit cell parameters were used, while the atomic positions in the unit cell were relaxed until the forces on each atom were less than 0.0005 Hartree/Bohr ( 10-2 eV/Å). To account for the strong correlations of the electrons, the Eu 4 states were treated within the DFT+U approach [24] using the Dudarev scheme [25]. The Hubbard parameter was varied and the corresponding band structure was found to best match the experimental ARPES pattern for eV.
II.6 Angle-resolved photoemission spectroscopy
The presented ARPES measurements were performed at the UARPES beamline of the SOLARIS National Synchrotron Radiation Centre with a photon energy of 137 eV and linear horizontal light polarization at a temperature of around 30 K. The endstation is equipped with a Scienta DA30L analyzer. The EuZn2P2 single crystals were cleaved in situ at a pressure better than 10-10 mbar to ensure an atomically clean surface. Due to the high resistivity of EuZn2P2 at low temperatures, charging of the sample resulted in an energy shift of the spectrum which was corrected by high-temperature reference measurements performed at the BLOCH beamline of the MAX-IV synchrotron radiation facility.
II.7 Infrared spectroscopy
The ground-state infrared excitations were investigated at K via the near-normal-incidence reflectivity spectrum of the (001)-surface (polished with 0.3 µm grain size) using a rapid-scan Michelson-type Fourier-transform spectrometer, covering the spectral range from 10 meV to 1 eV. To obtain absolute values of , the sample was coated in situ with gold and then used for measuring the reference spectrum. To avoid any artifacts that might arise from extrapolation outside the measured spectral range, as needed for a Kramers-Kronig analysis to estimate the complex conductivity [26], we fit the reflectivity spectrum directly with a multi-band model, comprising a standard Drude response [26], two phonon bands, and two bands at higher energy to account for both, indirect and direct interband transitions (note we employ the complex sign convention here). As discussed in Sec. III.5 below, the phonon signatures indicate that their bands deviate from a basic Lorentzian model, (which did not allow a detailed fit of around each phonon), and hence we employ the more general Fano lineshape [27], where corresponds to a finite coupling between the phonon response with the spectrally overlapping Drude “continuum” response, resulting in an oscillatory distortion of the phonon bands (essentially mixing the real and imaginary parts of ). For the interband transitions, we employ a Tauc-Lorentz band model with explicit onset bandgap energies (), where the real part of the conductivity is given by , and one can obtain also in closed form [28, 29]. Note that the Lorentzian factor in then provides a phenomenological model of the interband joint-density of states, where has a peak near and decays for . The fitting procedure calculates the complex field reflection coefficient with (where is the sum over all model bands) and minimizes the least-squares error of , where is also treated as a fit parameter.
II.8 Carrier density calculations
We estimate the carrier density at T=300 K from the fitted Drude conductivity parameters, and compare this to the value predicted on the basis of thermally excited, intrinsic carriers, using the effective masses based on the mass tensor elements (about the -points in the conduction band and -point for the valence band), and predicted an indirect band gap eV. The mass elements are given by along the directions , respectively, and ( the free electron mass). For the Drude approach, we use the relation to solve for , where is the total effective conductivity mass [30]. For the electrons at the -point (Fig. 6), we take the effective electron conductivity mass for motion in the plane to be given by , which yields , and hence . For the prediction based on thermal excitation of intrinsic carriers, one has , where and are the conduction- and valence-band density of states [30], respectively, is the valley degeneracy of the 6 boundary-edge points where .
III Results and discussion
III.1 Electronic transport measurements
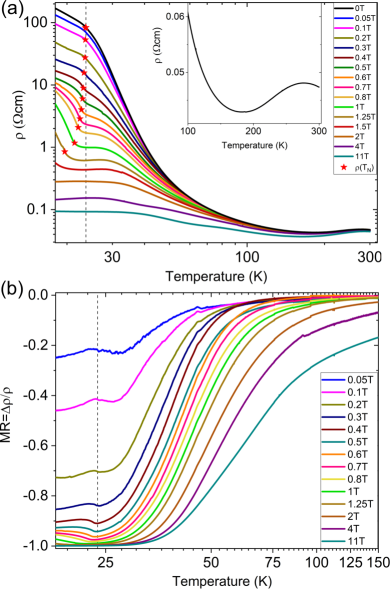
Electrical transport measurements were carried out on polished EuZn2P2 samples. The temperature-dependent resistivity is shown in Fig. 2(a) in a double logarithmic plot for various magnetic fields up to T applied along the -axis. In contrast to a previous report [11], we do not observe an Arrhenius behavior at zero field below room temperature but rather a small maximum upon cooling followed by a positive temperature coefficient above a minimum around K, see the inset of Fig. 2(a). Such behavior at elevated temperatures may be attributed to in-gap states which donate additional carriers and freeze out upon lowering the temperature which is in agreement with findings from infrared spectroscopy, see Sec. III.5. Below about 180 K a semiconducting behavior is resumed with a strongly increasing resistance down to a few Kelvin above K, where the slope changes and a flattening is observed below the magnetic transition. It is important to note that the - curves become increasingly nonlinear for temperatures below . Therefore, we refrain from discussing the resistivity behavior below K. For increasing magnetic fields, the resistivity is suppressed at all temperatures as discussed in the following.
Fig. 2(b) highlights the resistivity behavior in finite magnetic fields applied along the -axis plotted as the magnetoresistance ratio MR . Even for small fields, a considerable negative magnetoresistance of order a few % is observed already at temperatures as high as 150 K. The MR then becomes increasingly stronger in increasing magnetic fields upon lowering the temperature down to (see below).
Such a strong negative MR, reaching saturation values of % at T and % at T, is rather similar to the colossal negative magnetoresistance (CMR) observed in rare earth chalcogenides, Cr-based spinel systems, europium hexaboride or mixed-valence perovskite manganites, see e.g. [31, 32, 33, 34, 35, 36].
Whereas most of these materials are ferromagnets, the CMR effect in antiferromagnetically ordered materials is less studied and recently has attracted considerable interest [37, 38, 8, 9].
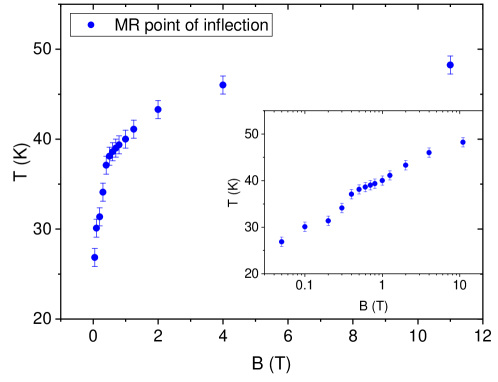
Another striking observation is a pronounced change of slope of the resistivity at which shifts with increasing field to lower temperatures following , see Fig. 2(a). In addition, the flattening of the resistivity below a kink at at small magnetic fields develops into a plateau-like behavior for fields T the onset of which shifts to higher temperatures with increasing field. Likewise, the crossover temperature from weak to strong negative MR behavior characterized by the inflection point of the MR vs. temperature curves shifts to higher temperatures with increasing fields with an initial strong increase, i.e. for small fields up to 0.5 T (see Fig. S2 in the appendix) followed by a more moderate increase for higher fields. Remarkably, for fields of order 1 T the relative MR amounts to % up to a temperature of twice the value of , and a significant negative MR is observed at even higher temperatures in rather large fields (measured up to 11 T). As mentioned above, in fields of order 1 T, a significant negative MR sets in at about 150 K, i.e. six times TN. Strikingly, this temperature roughly coincides with the temperature where the magnetic susceptibility at T shows deviations from a Curie-Weiss law, see Fig. 3. In other materials, such a behavior has been understood as the onset temperature of the formation of ferromagnetic clusters (magnetic polarons) [38], which become stabilized in systems with low carrier density and strong magnetic exchange between local Eu2+ moments and charge carrier spins. Magnetic polarons grow in size upon lowering the temperature and couple to external (or internal) magnetic fields such that the mobility of the localized carriers, which can be estimated to at room temperature and zero magnetic field, see Sec. III.5, becomes drastically enhanced thereby explaining large negative MR. If such a scenario involving electronic and magnetic phase separation as well as strong coupling to the lattice degrees of freedom [39, 40] applies to EuZn2P2 will be the subject of future investigations.
III.2 Magnetic measurements
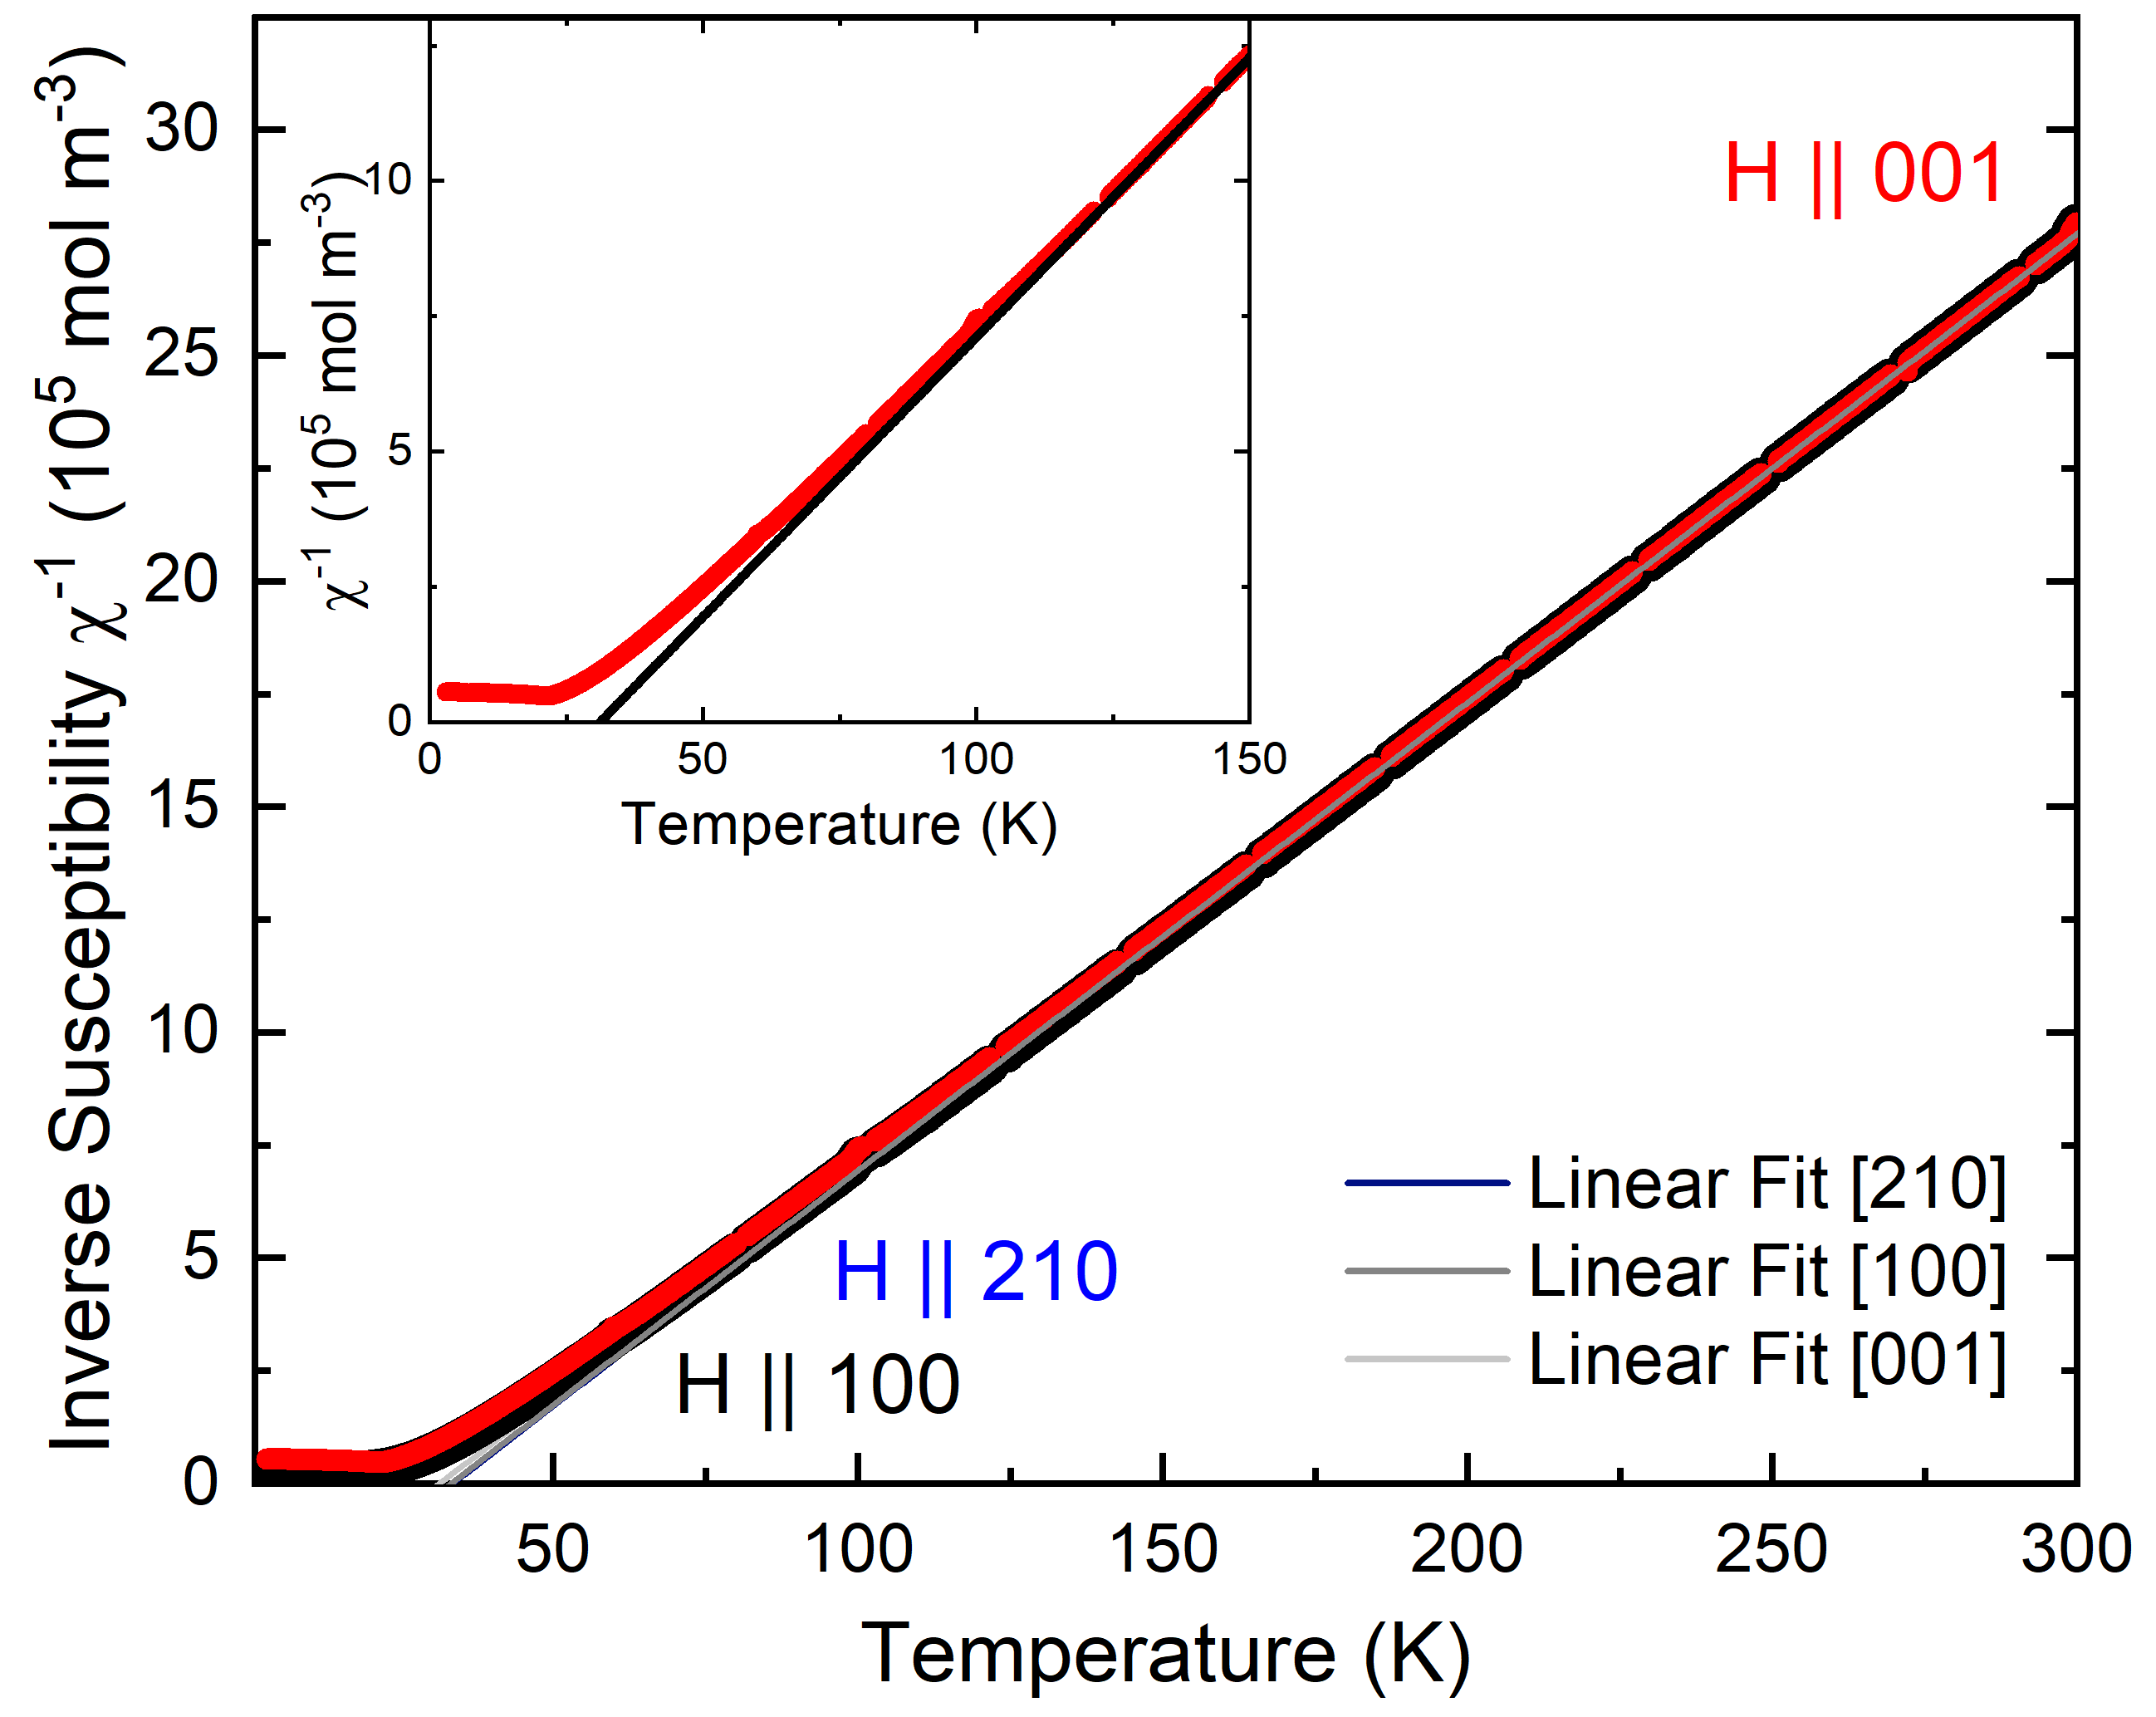
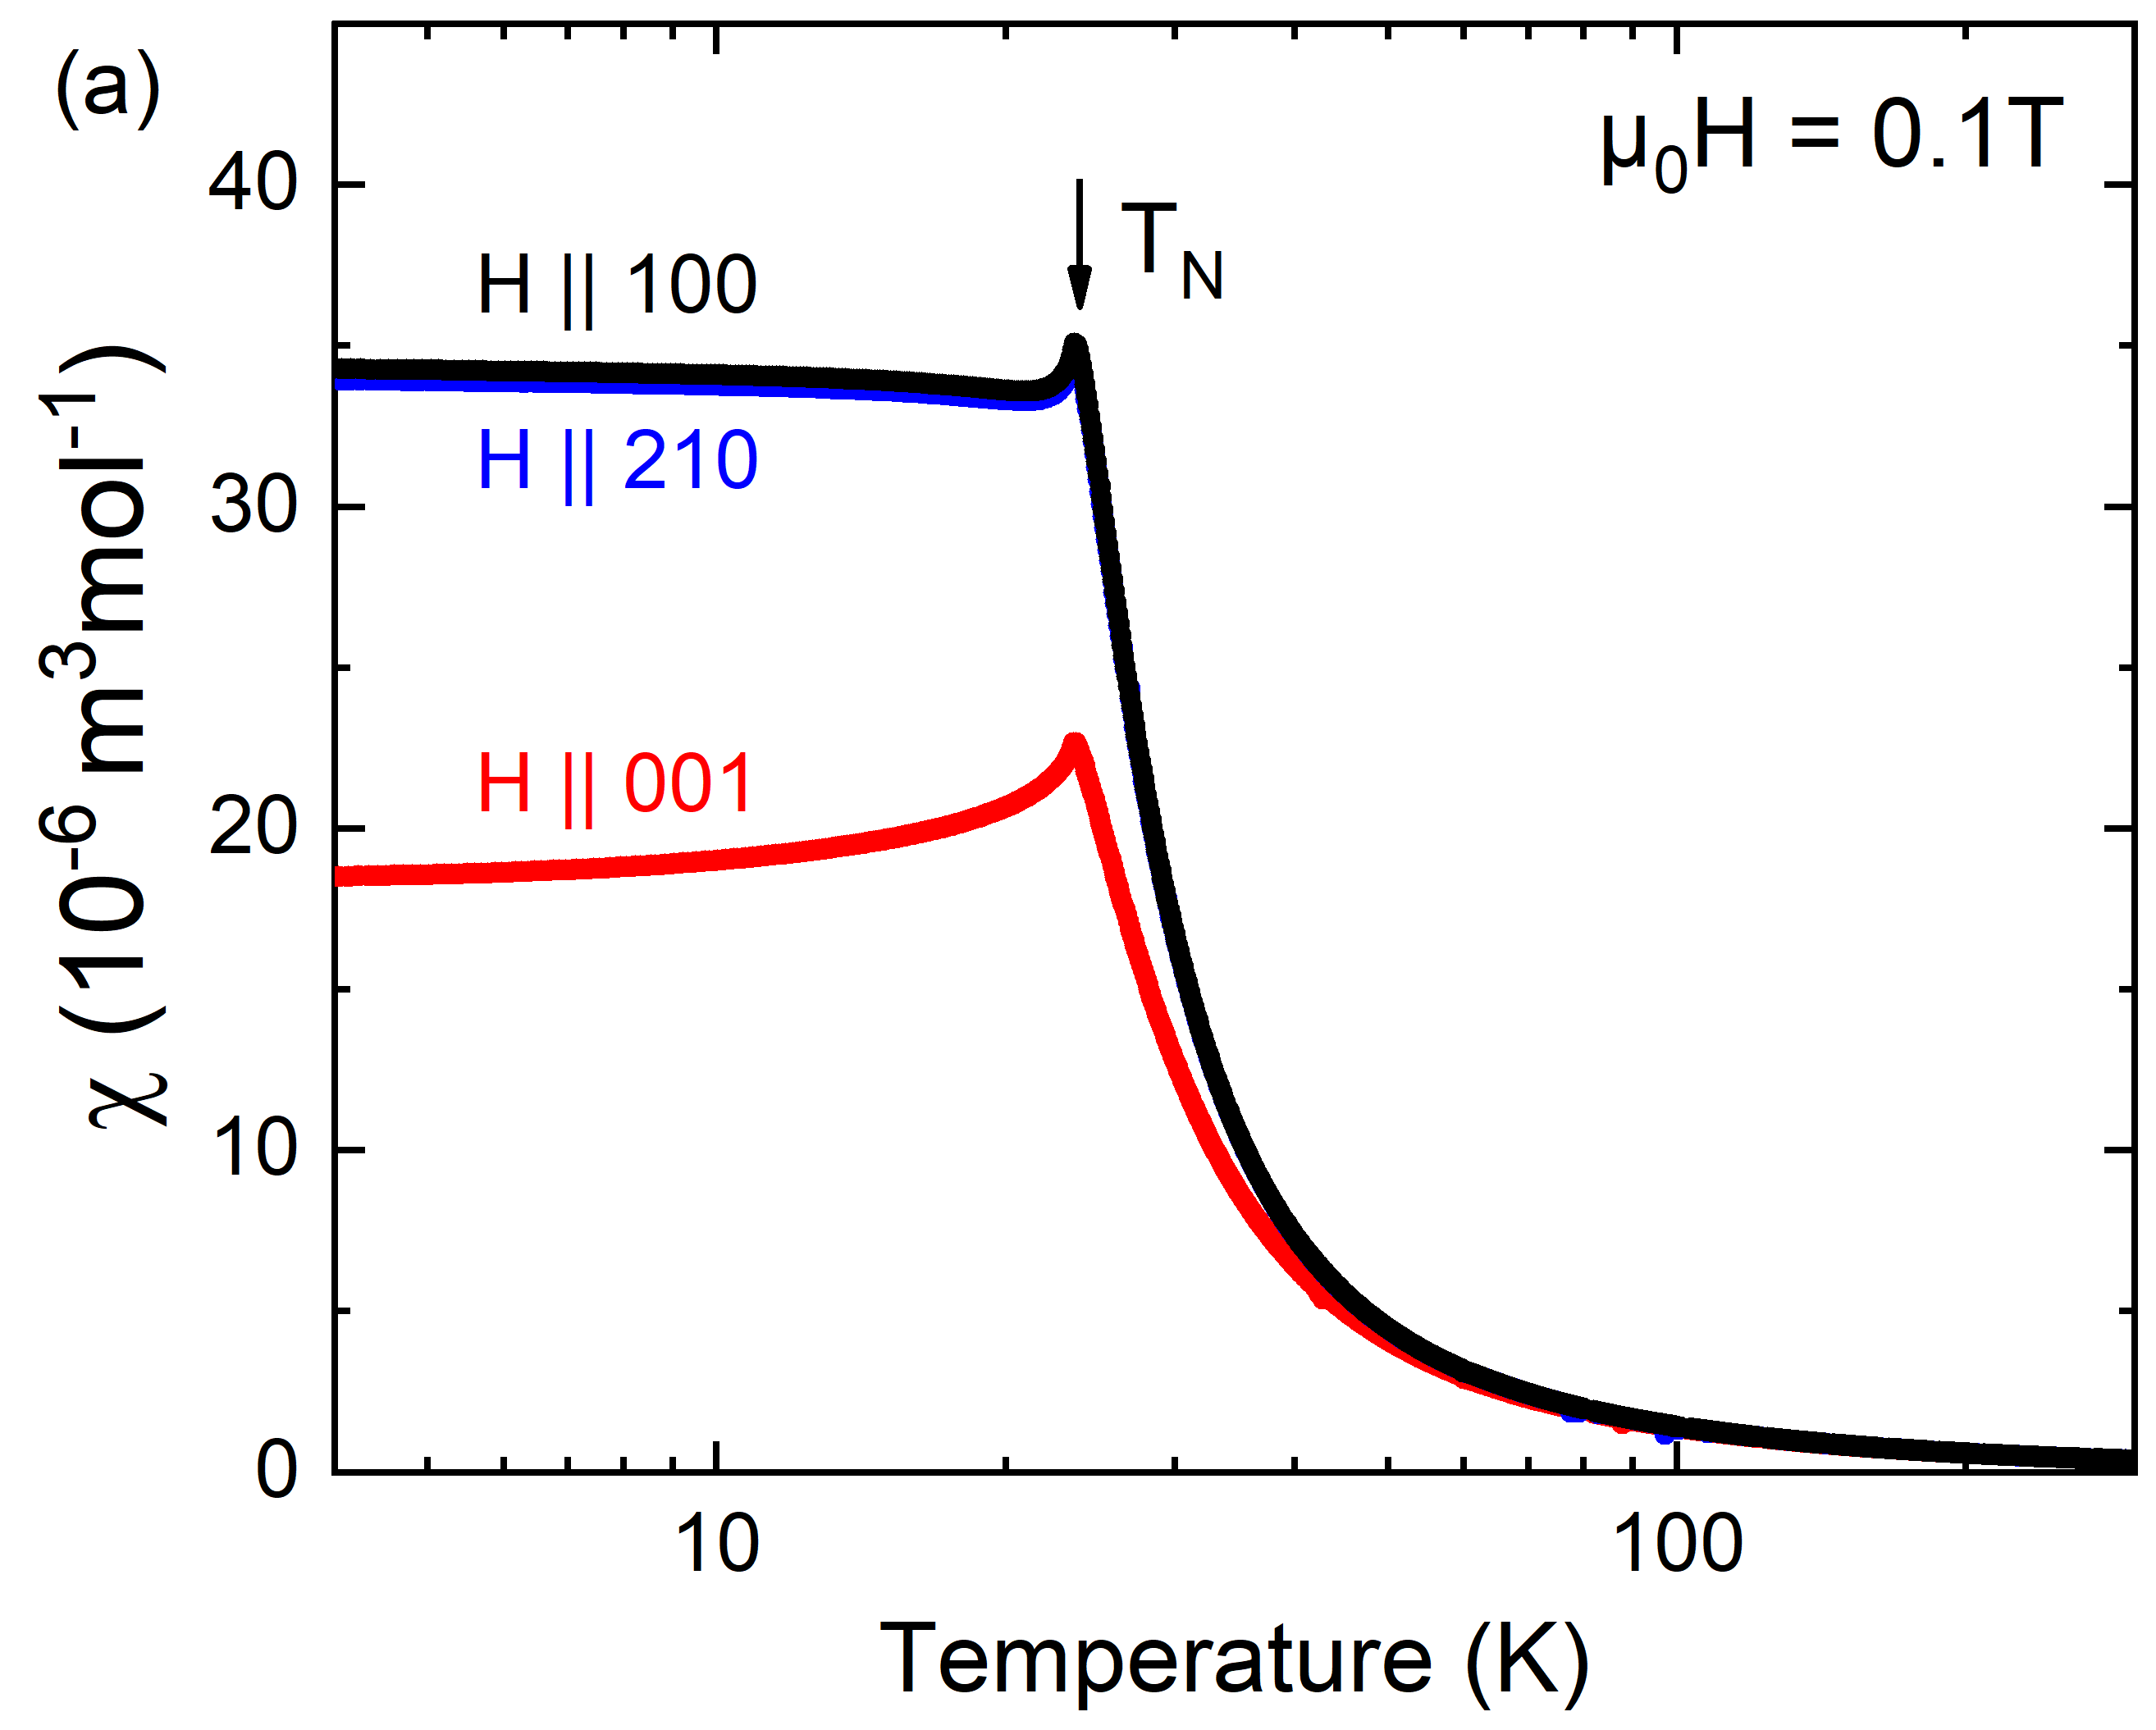
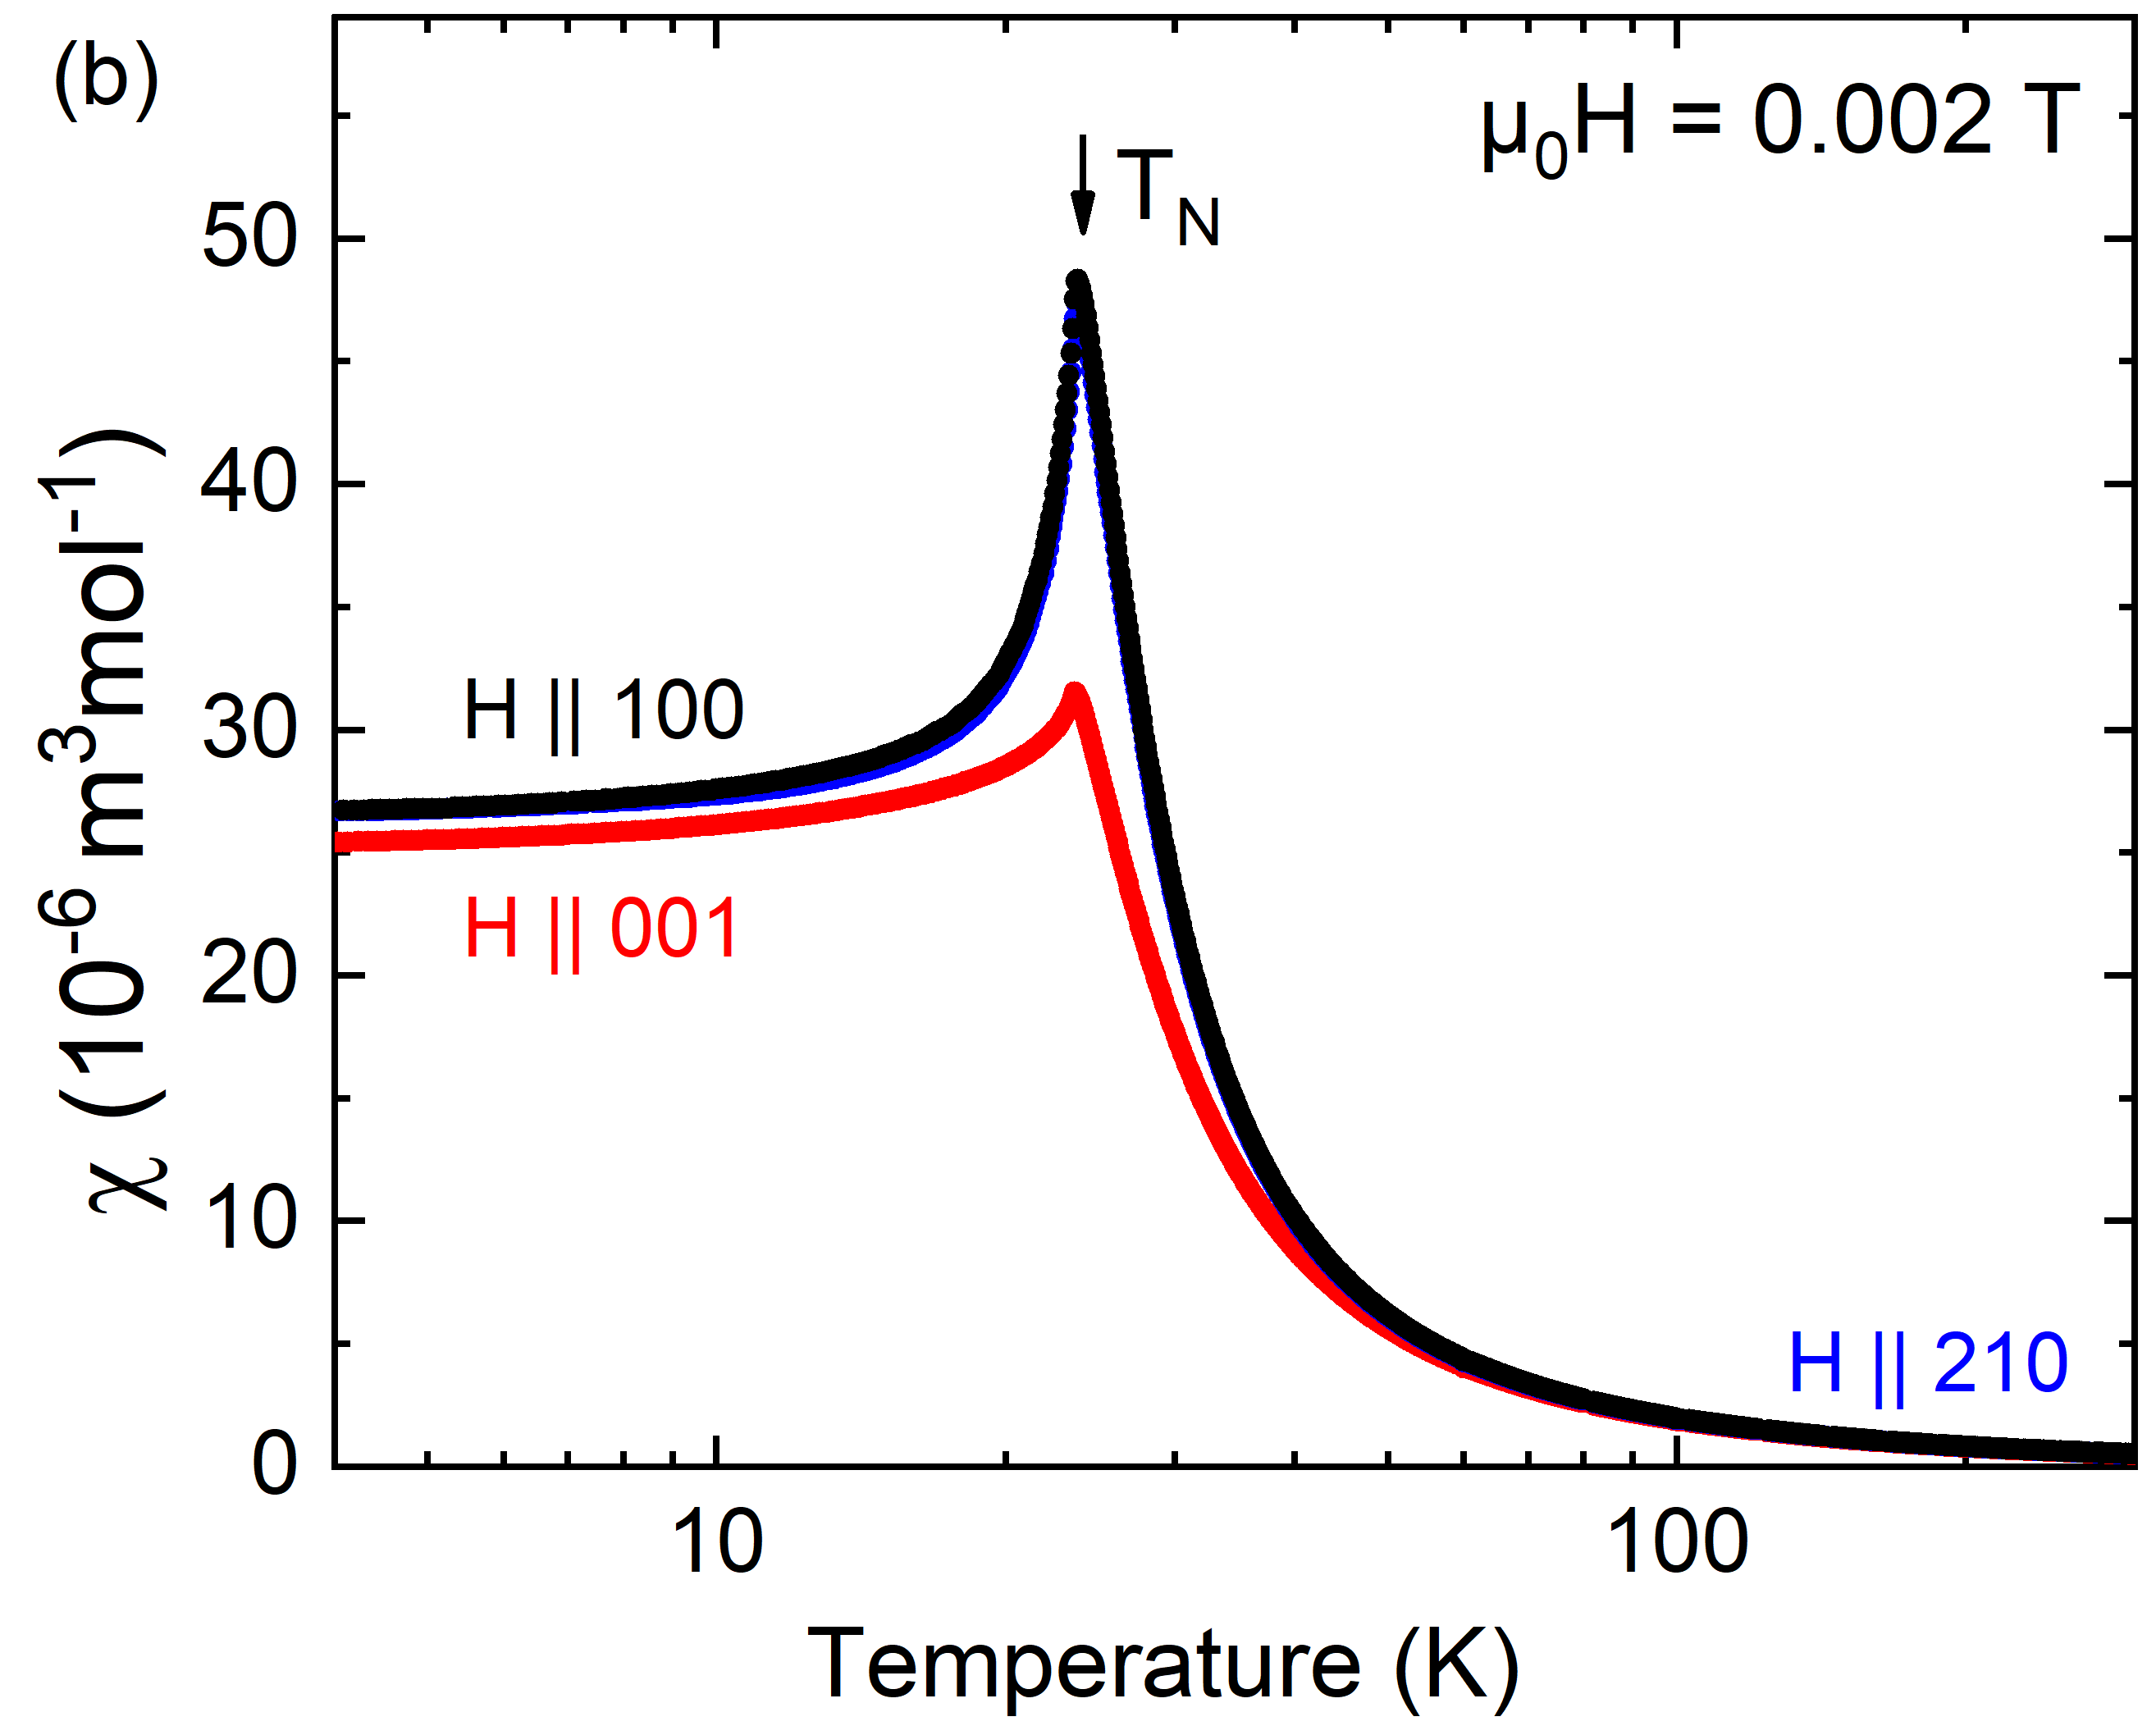
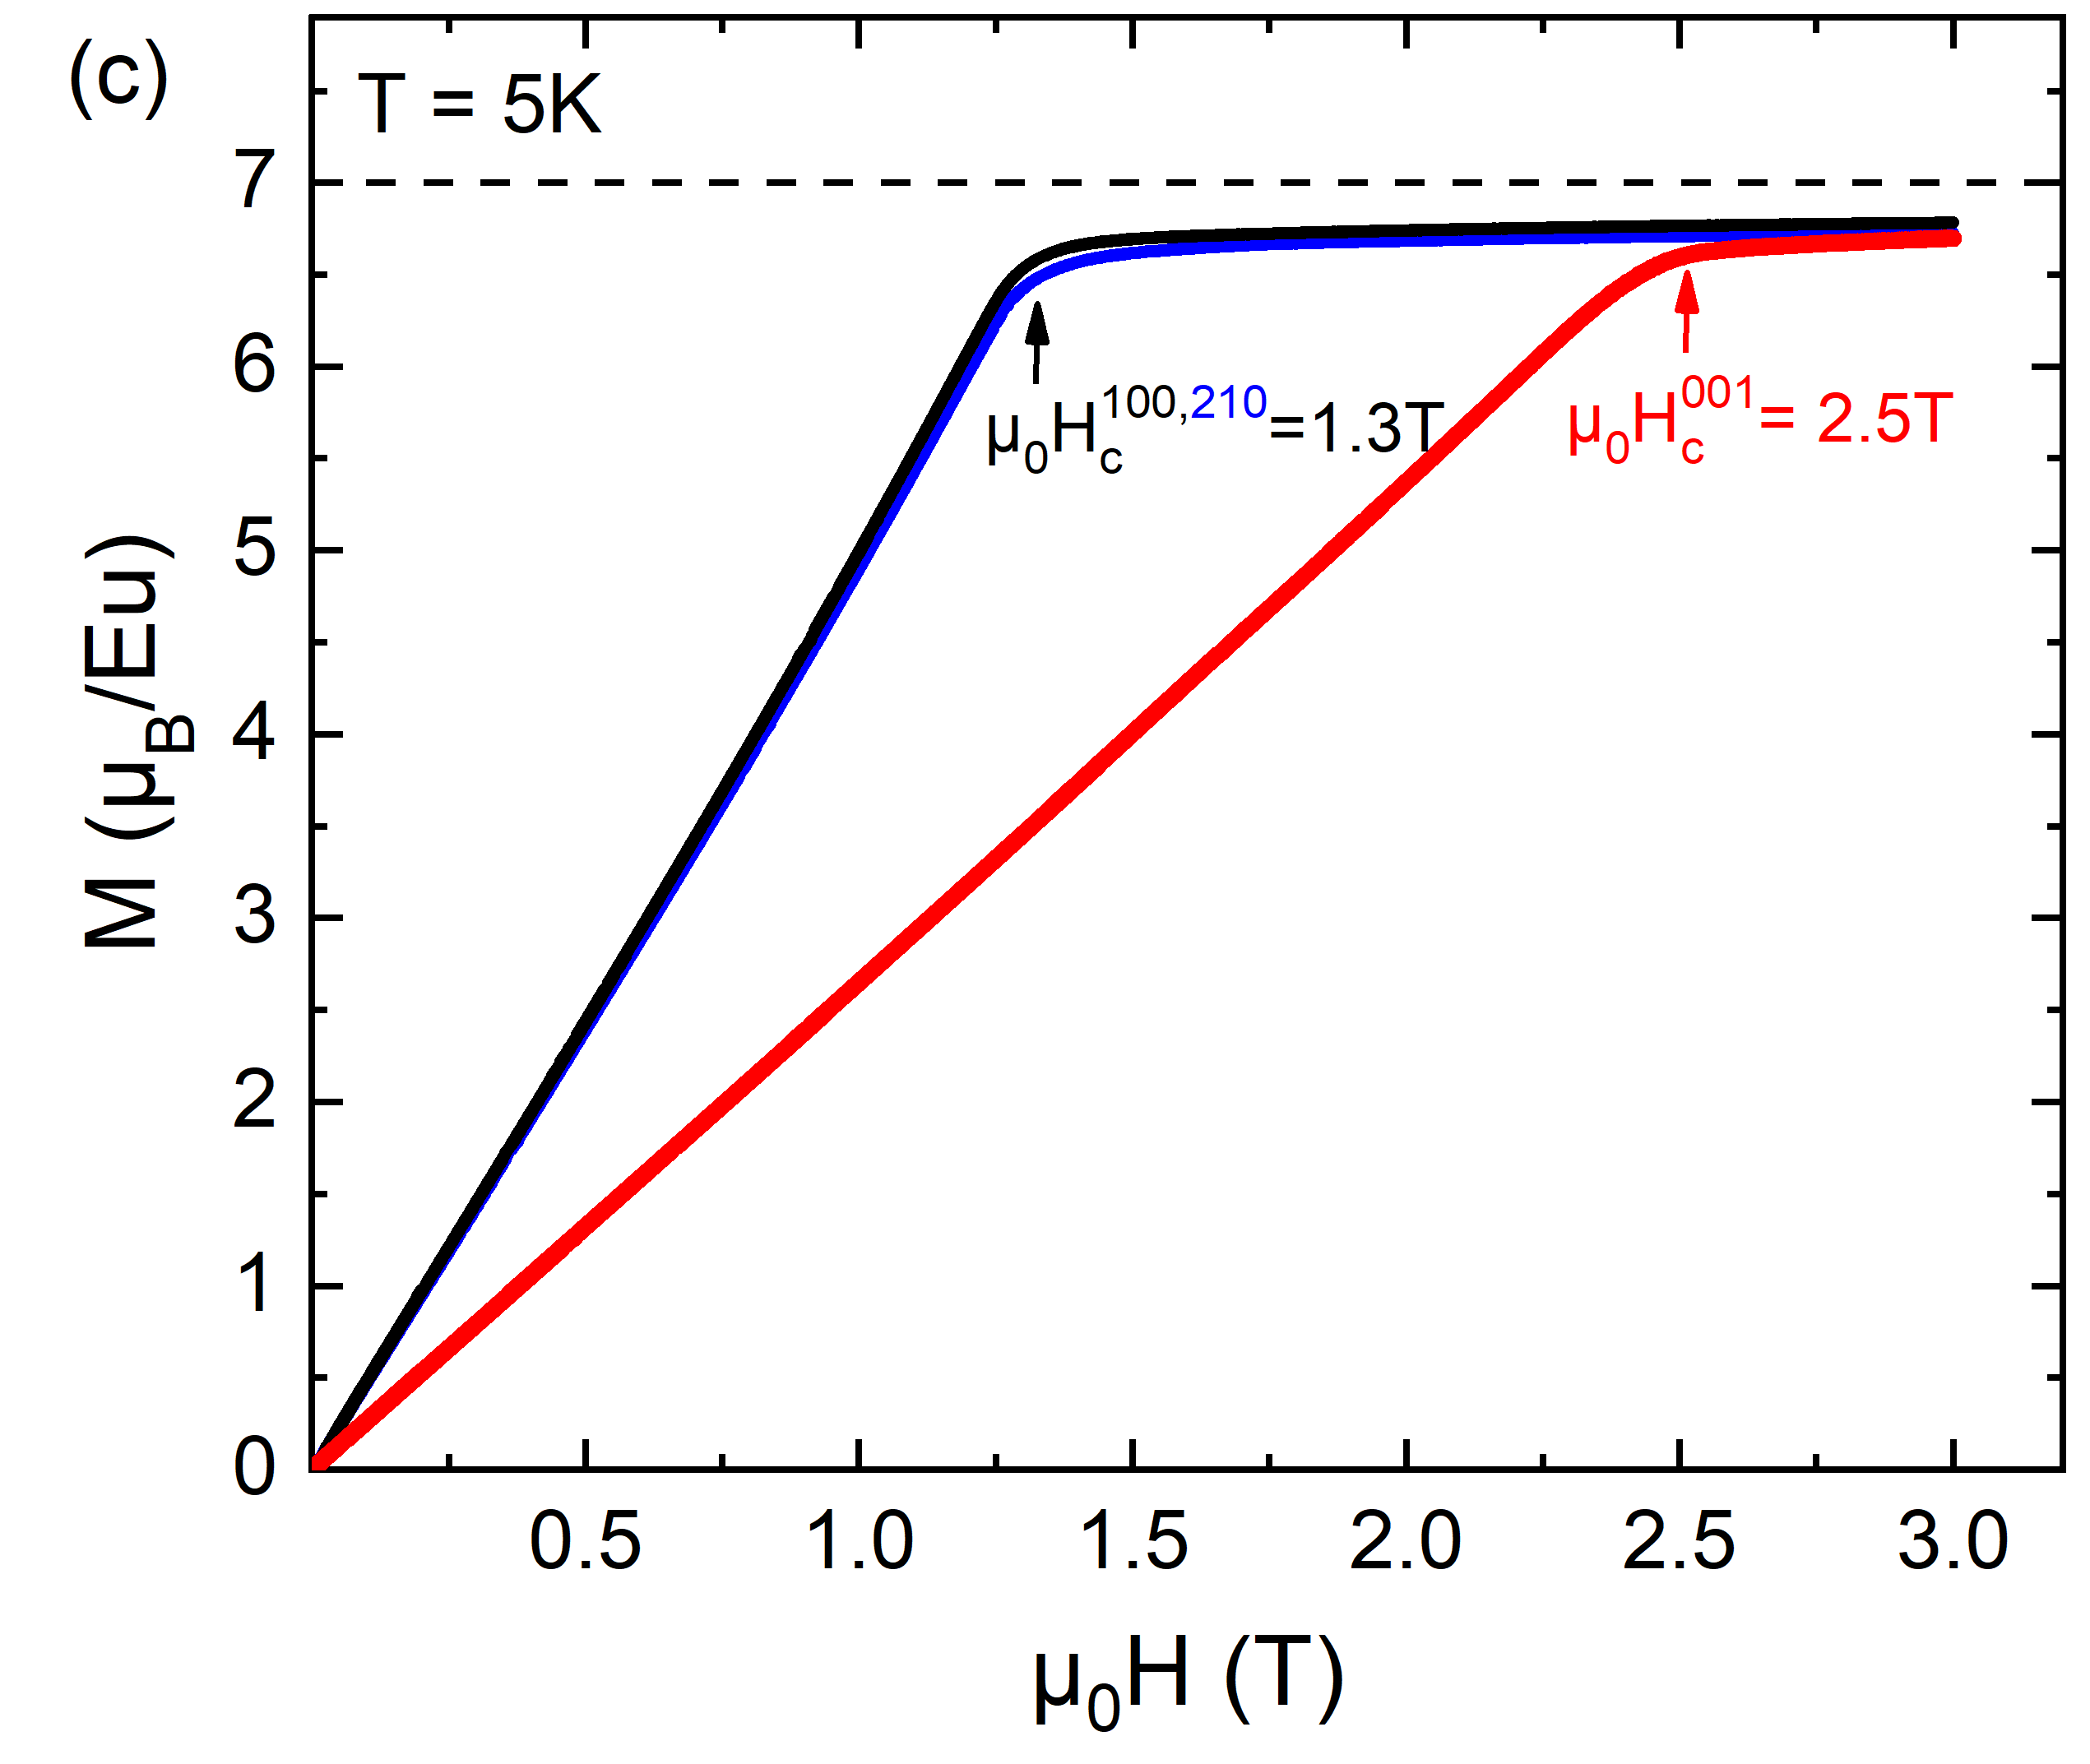
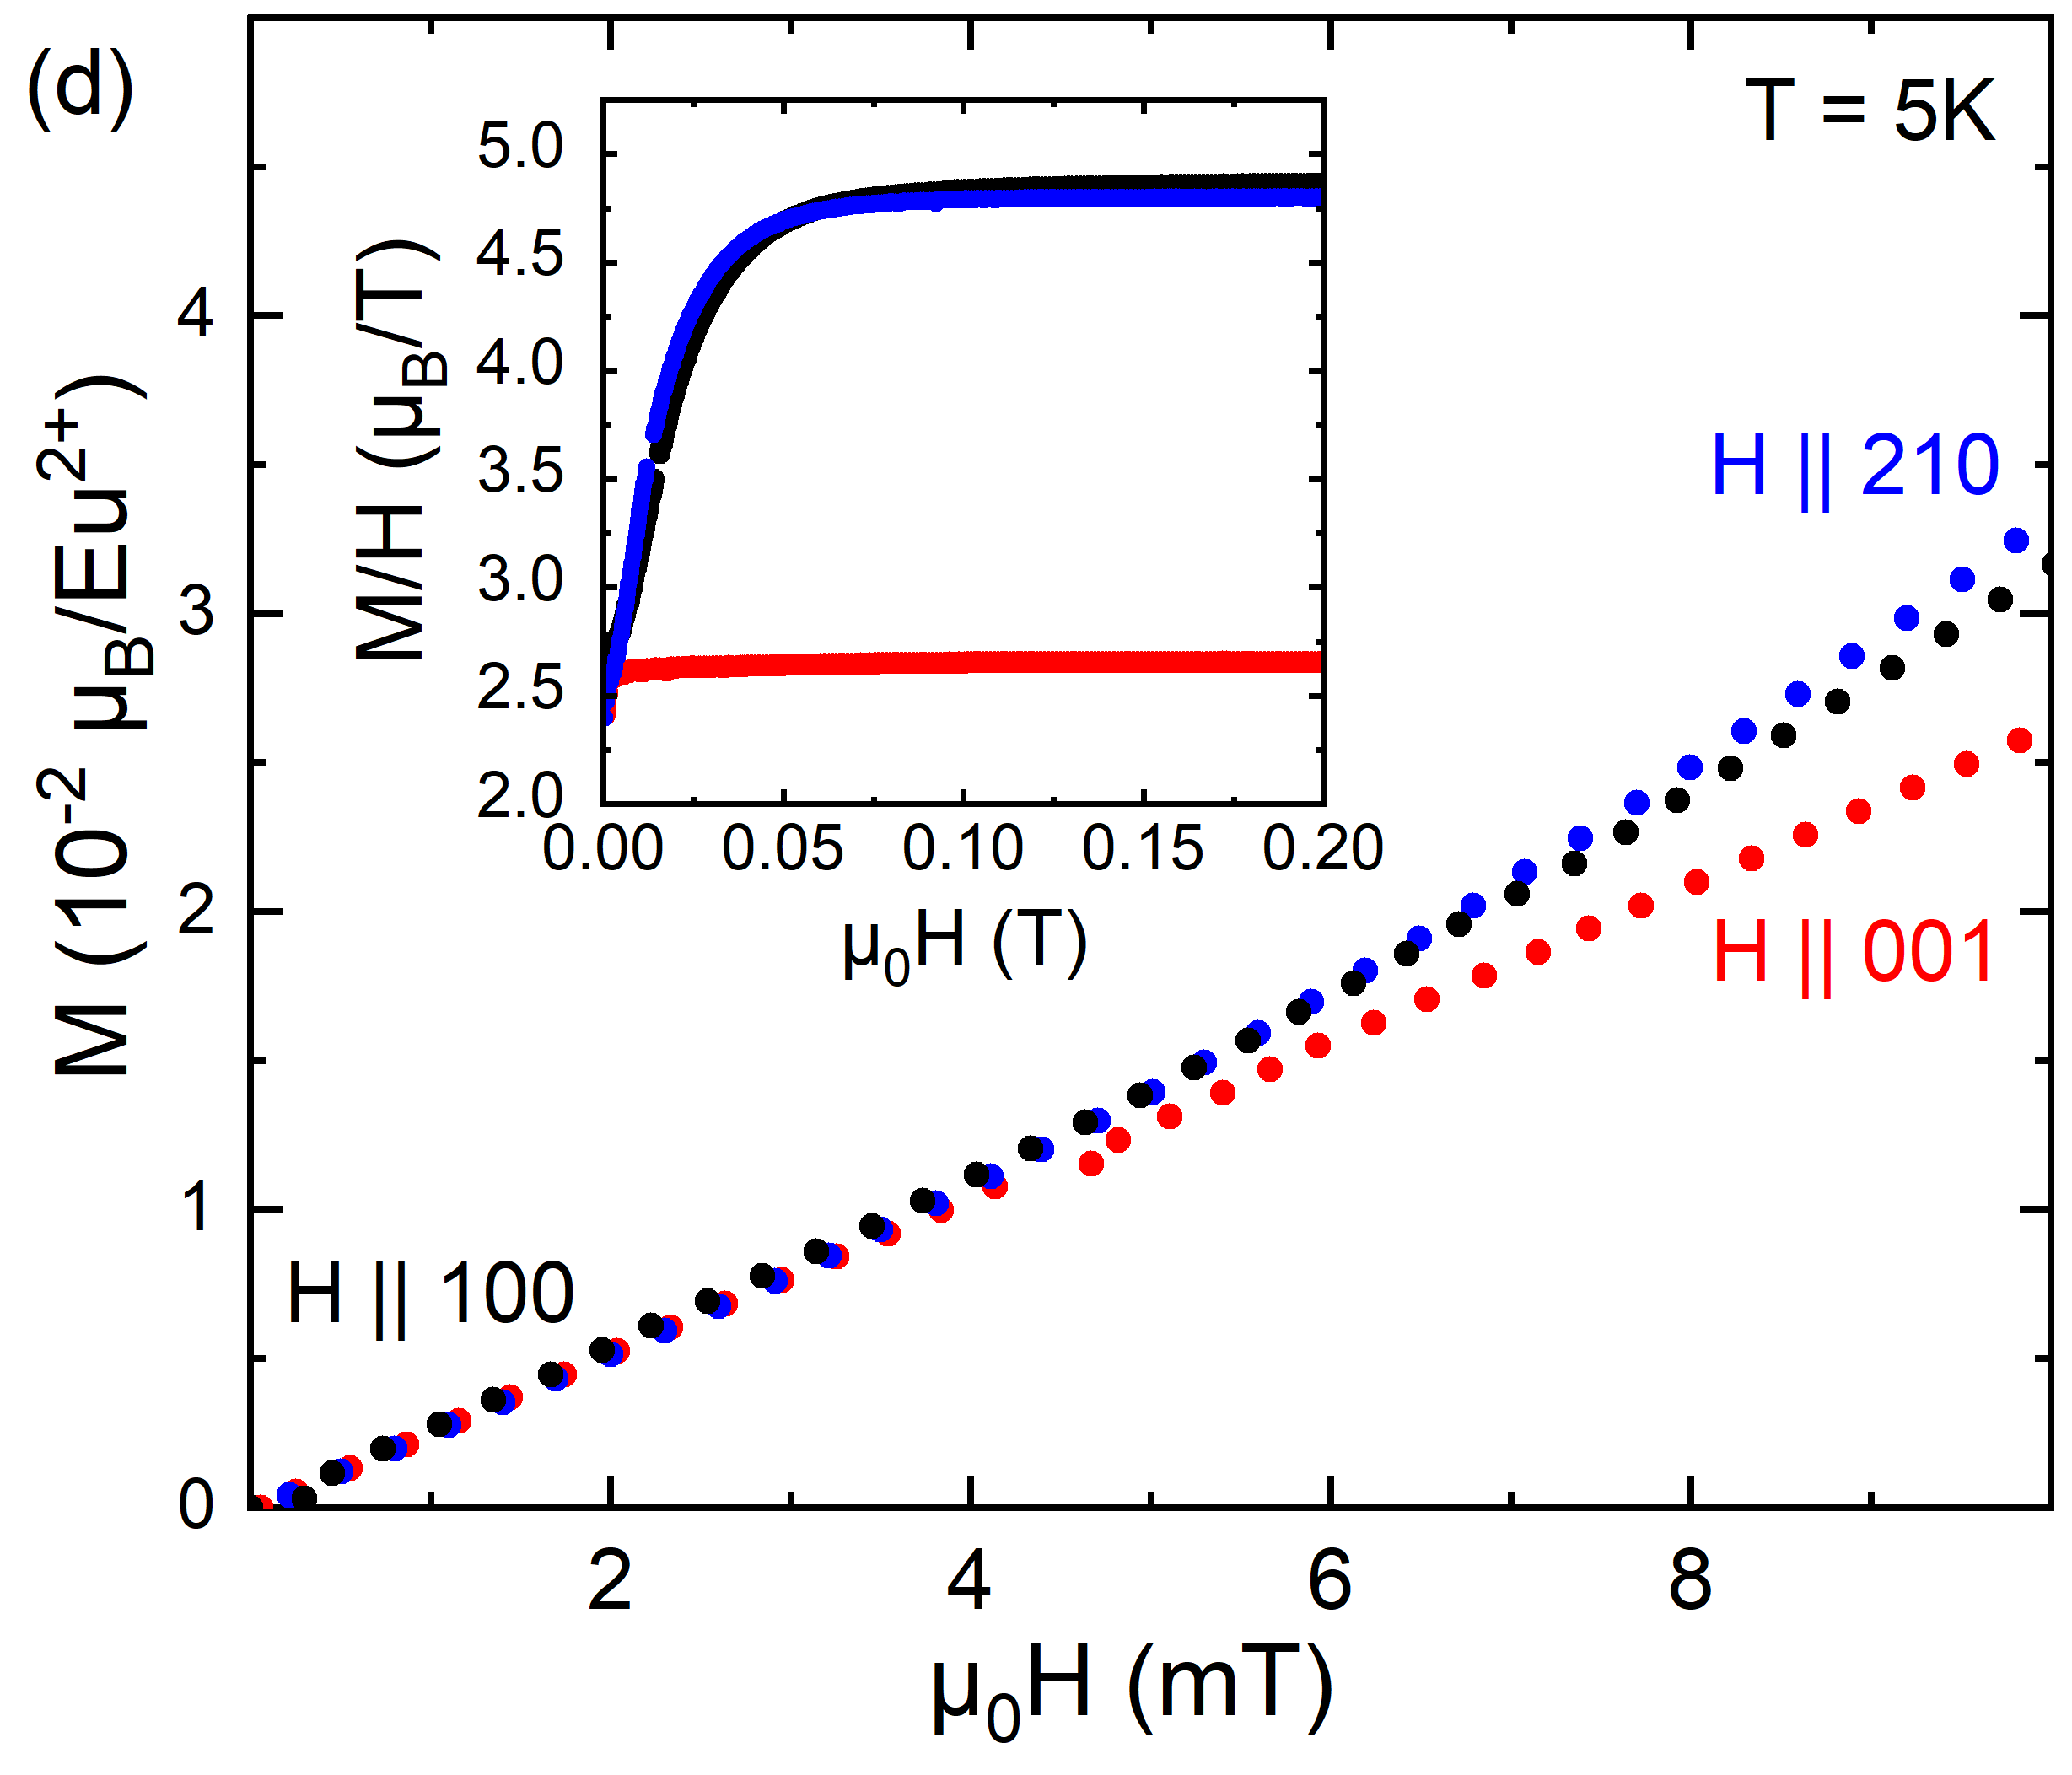
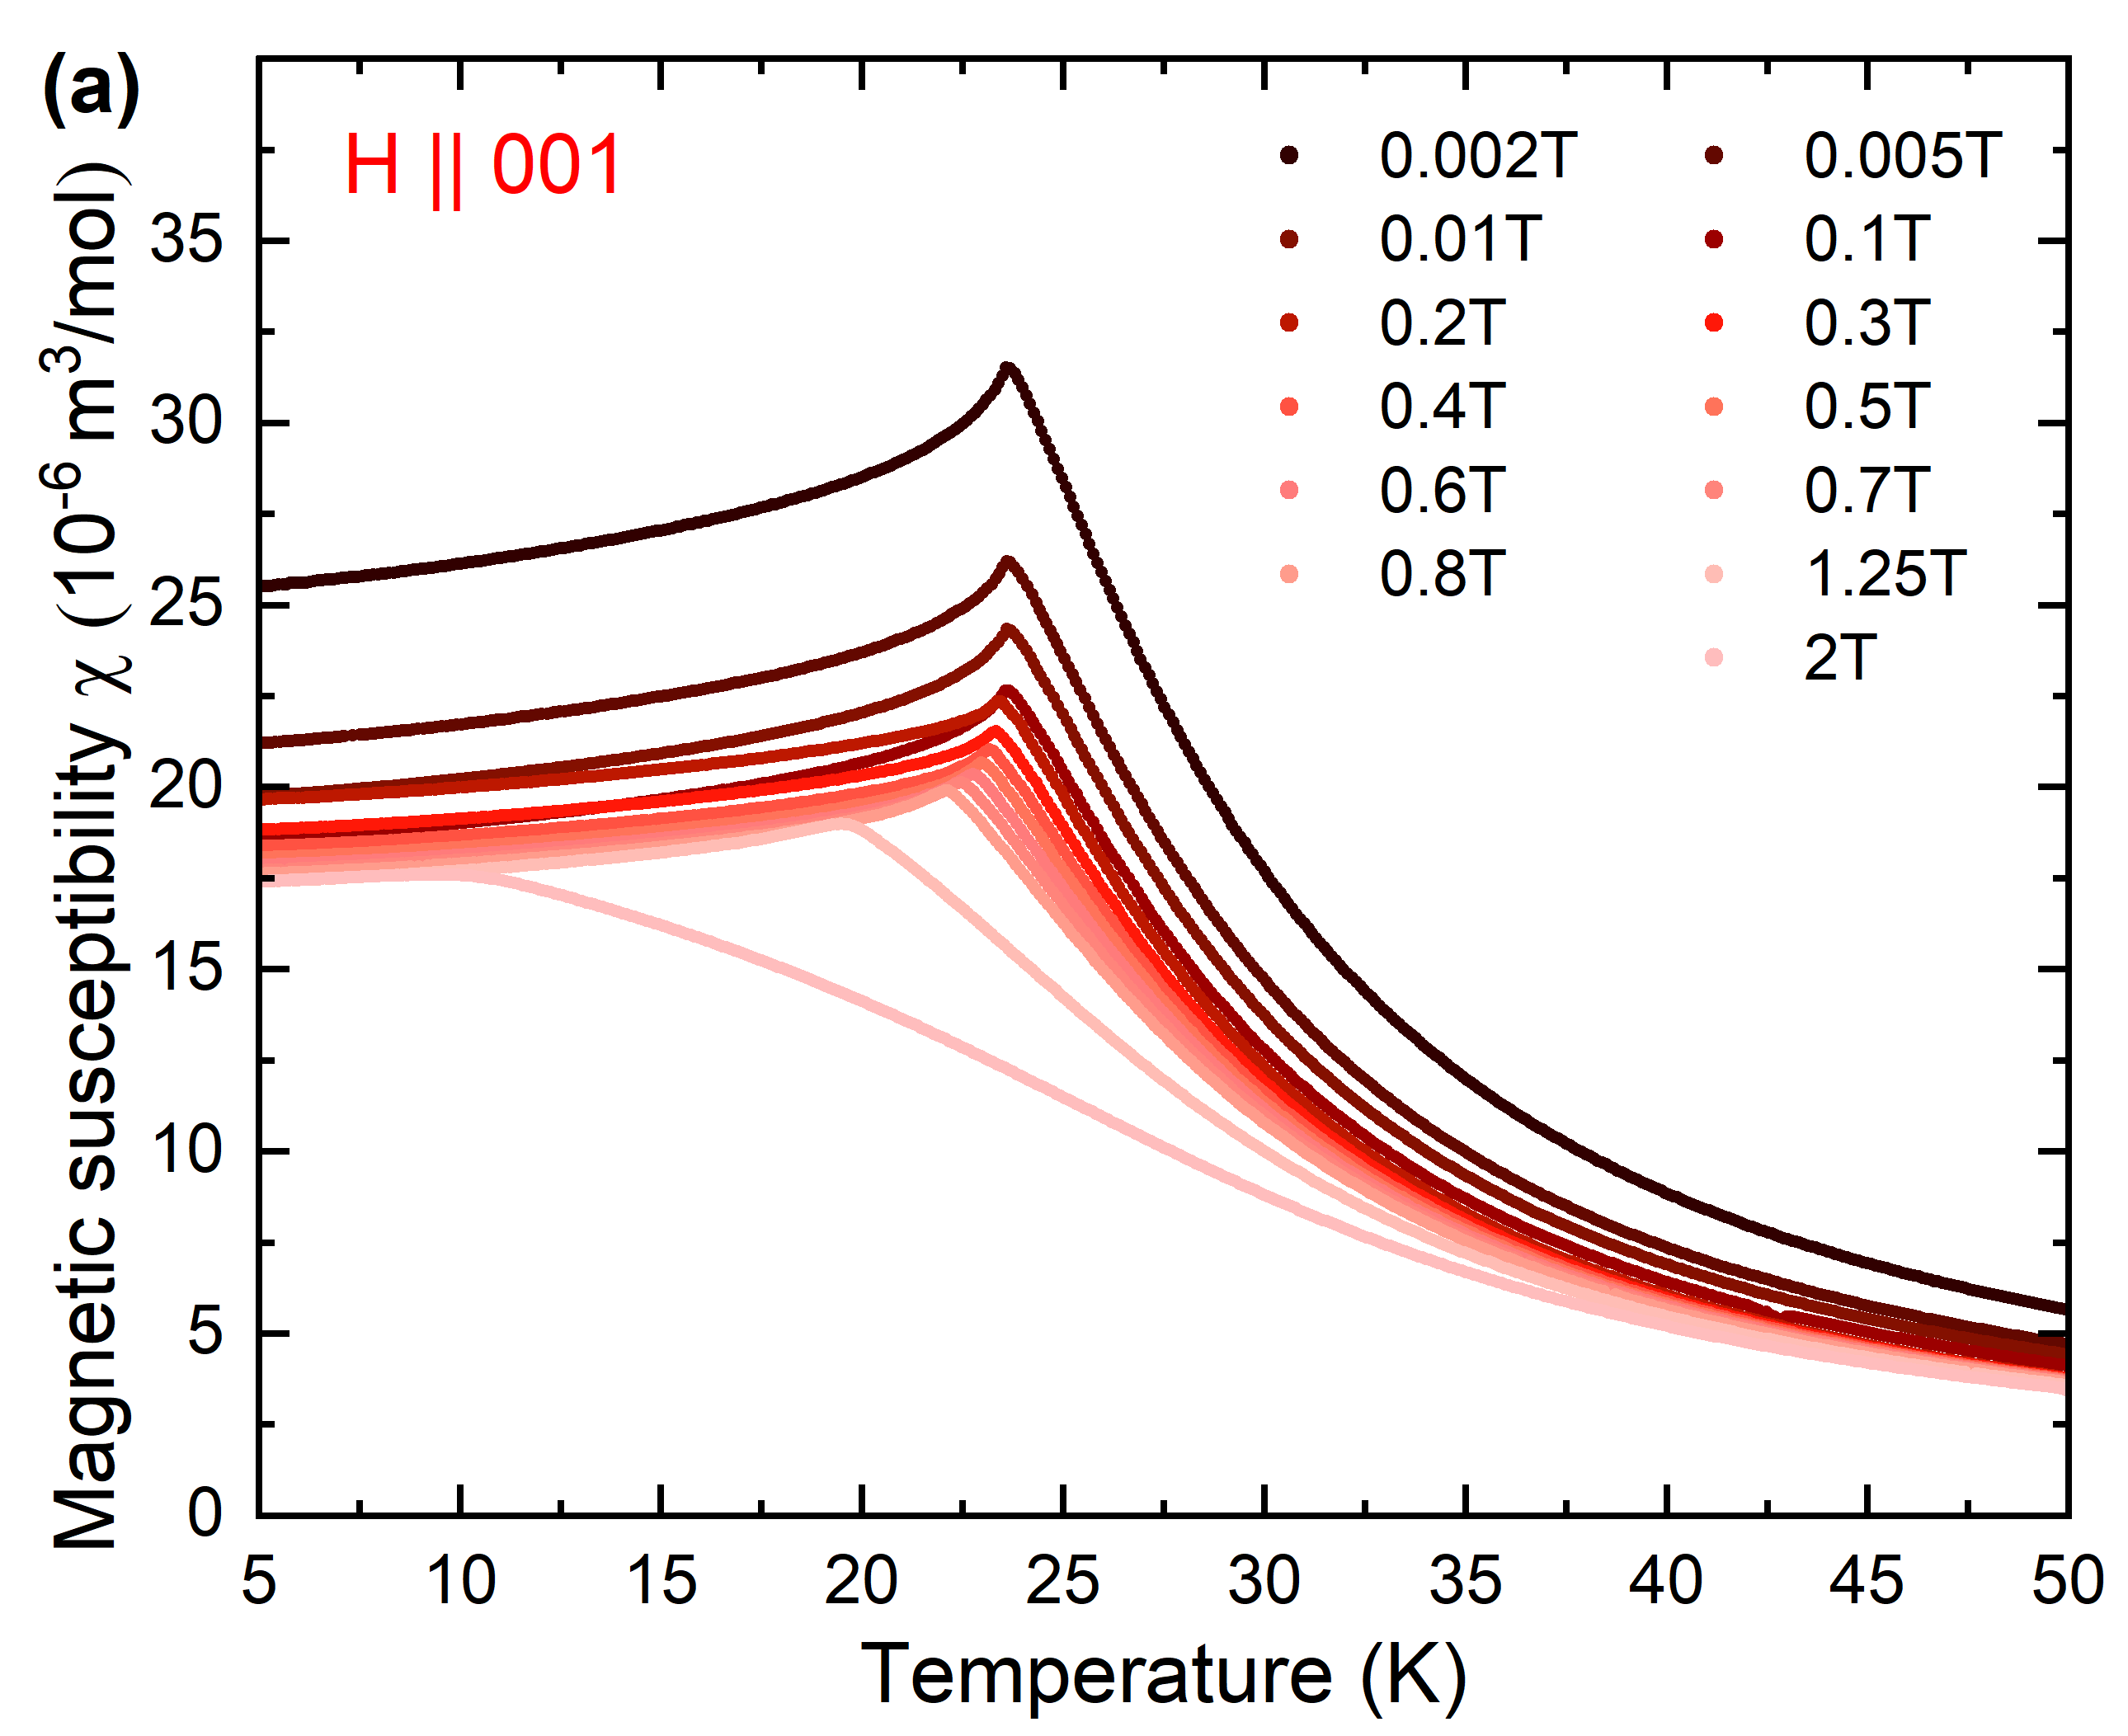
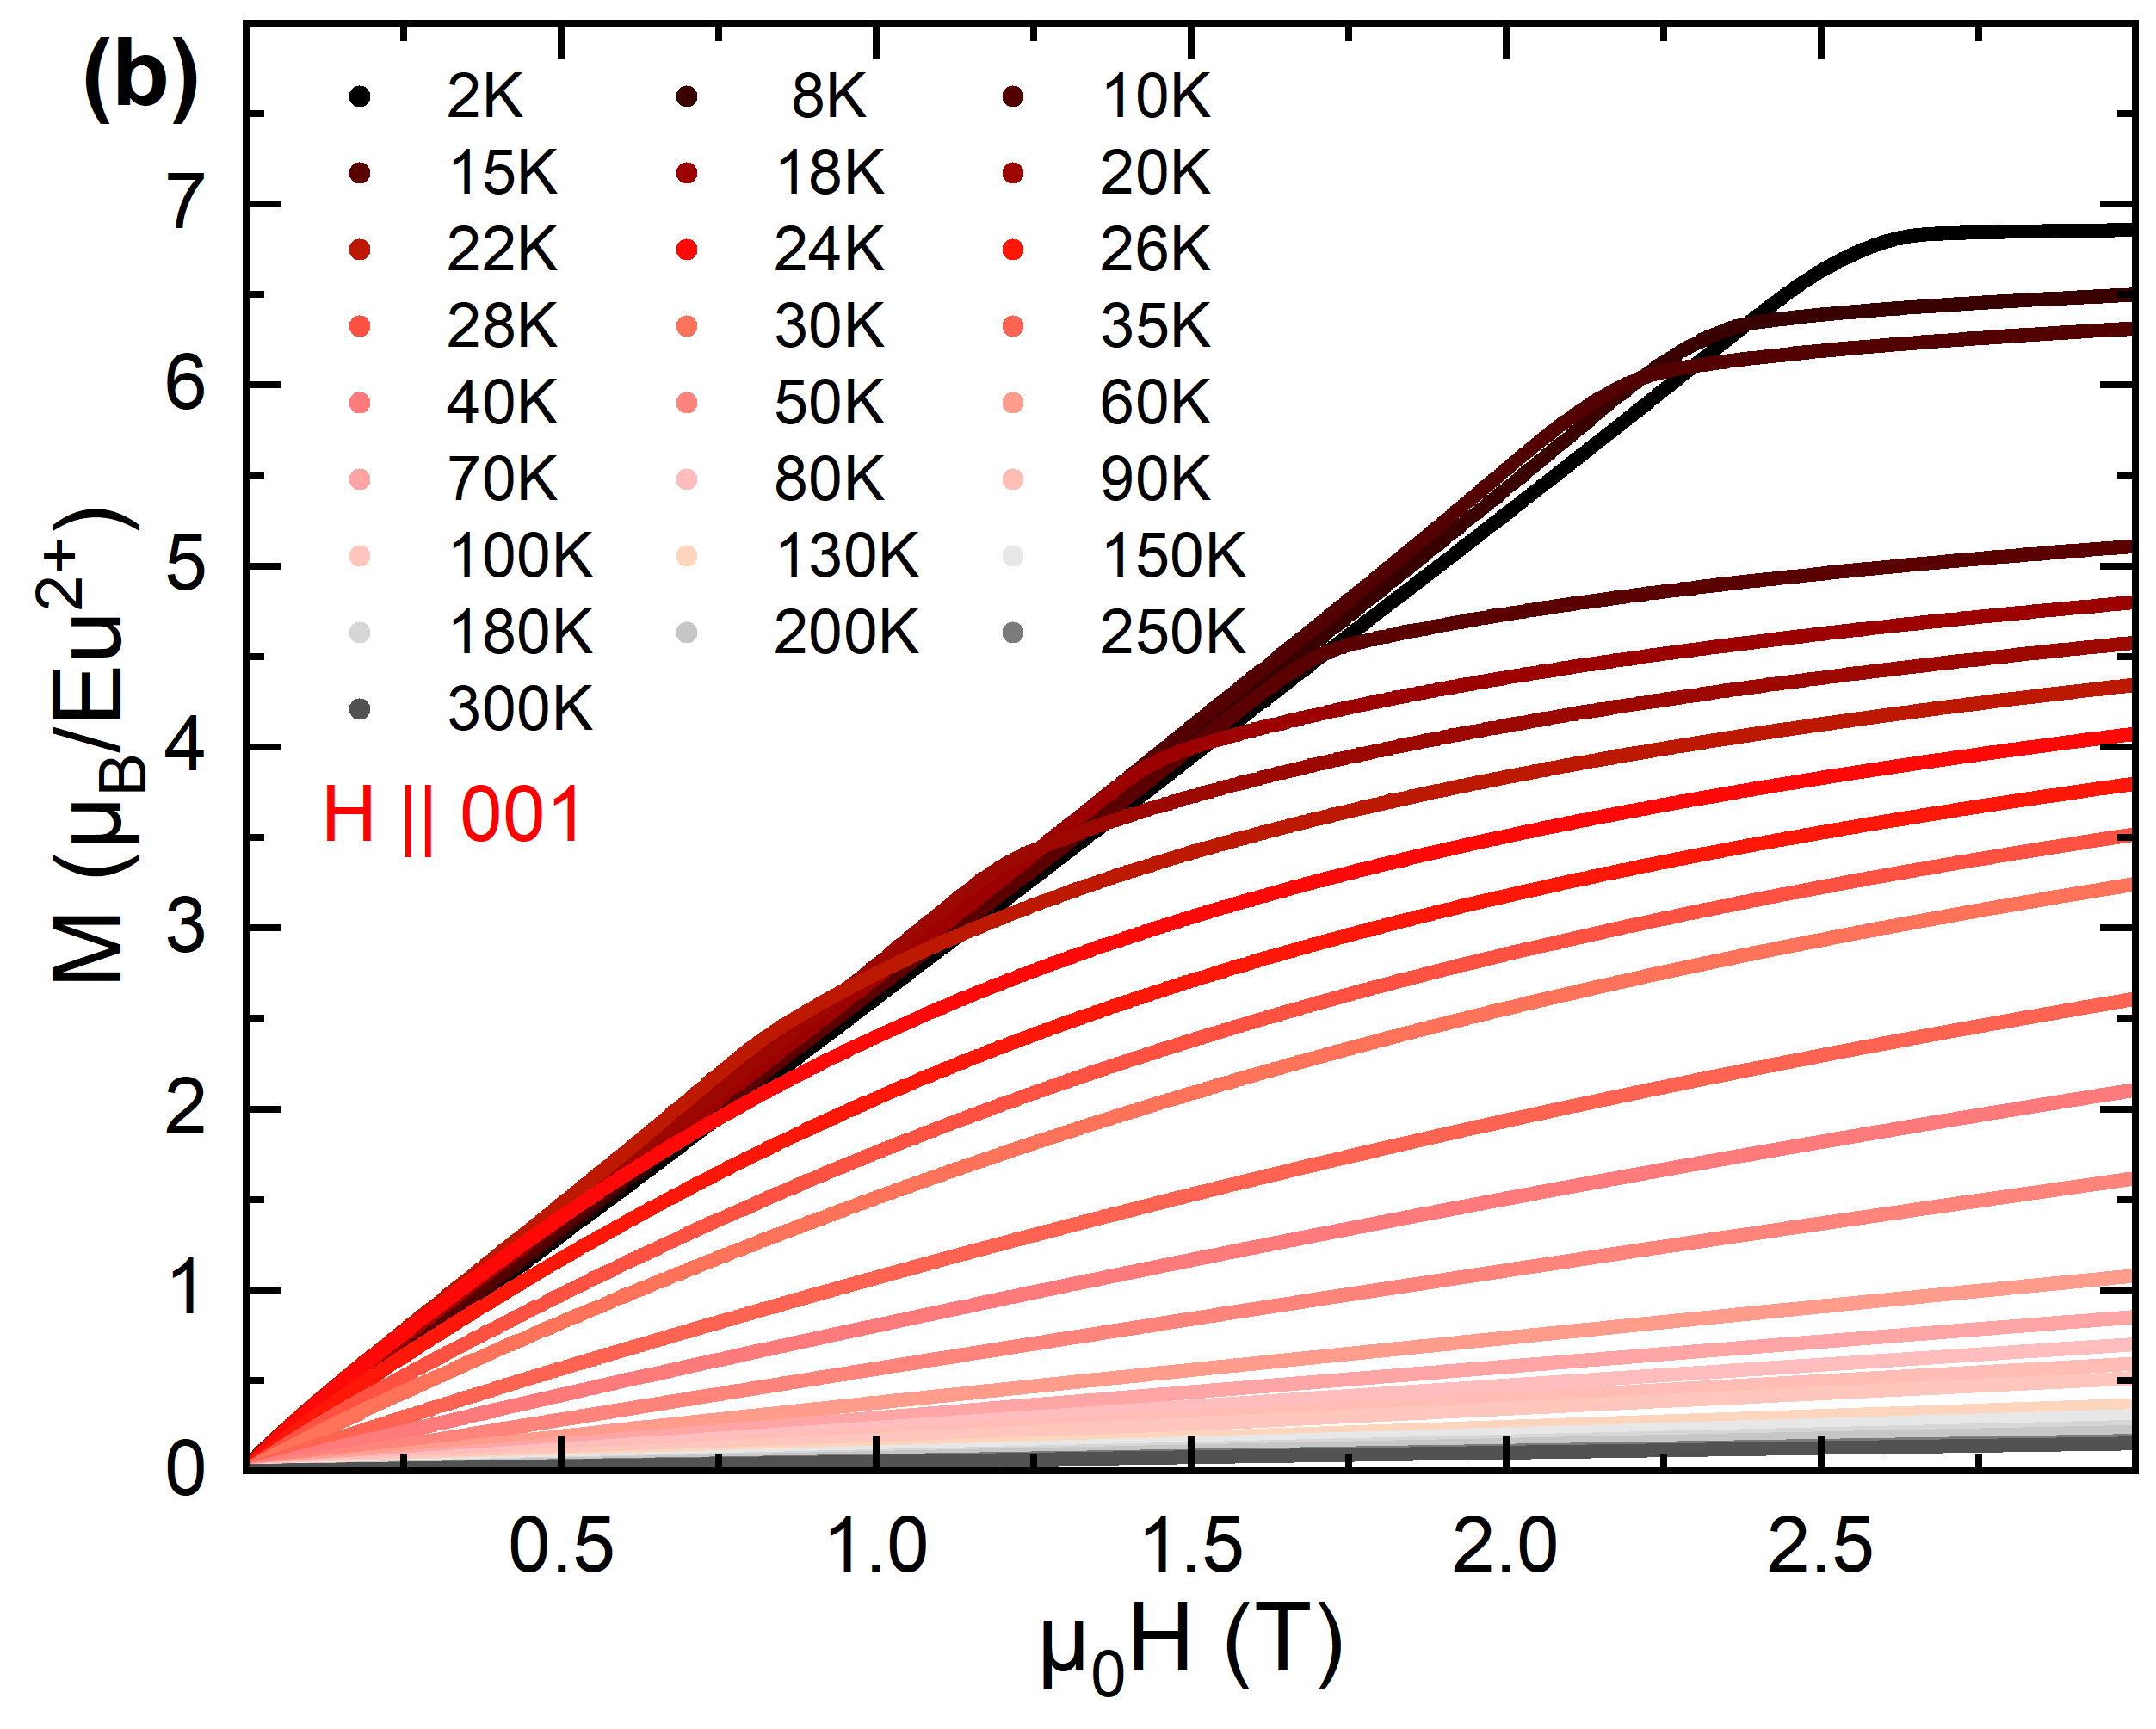
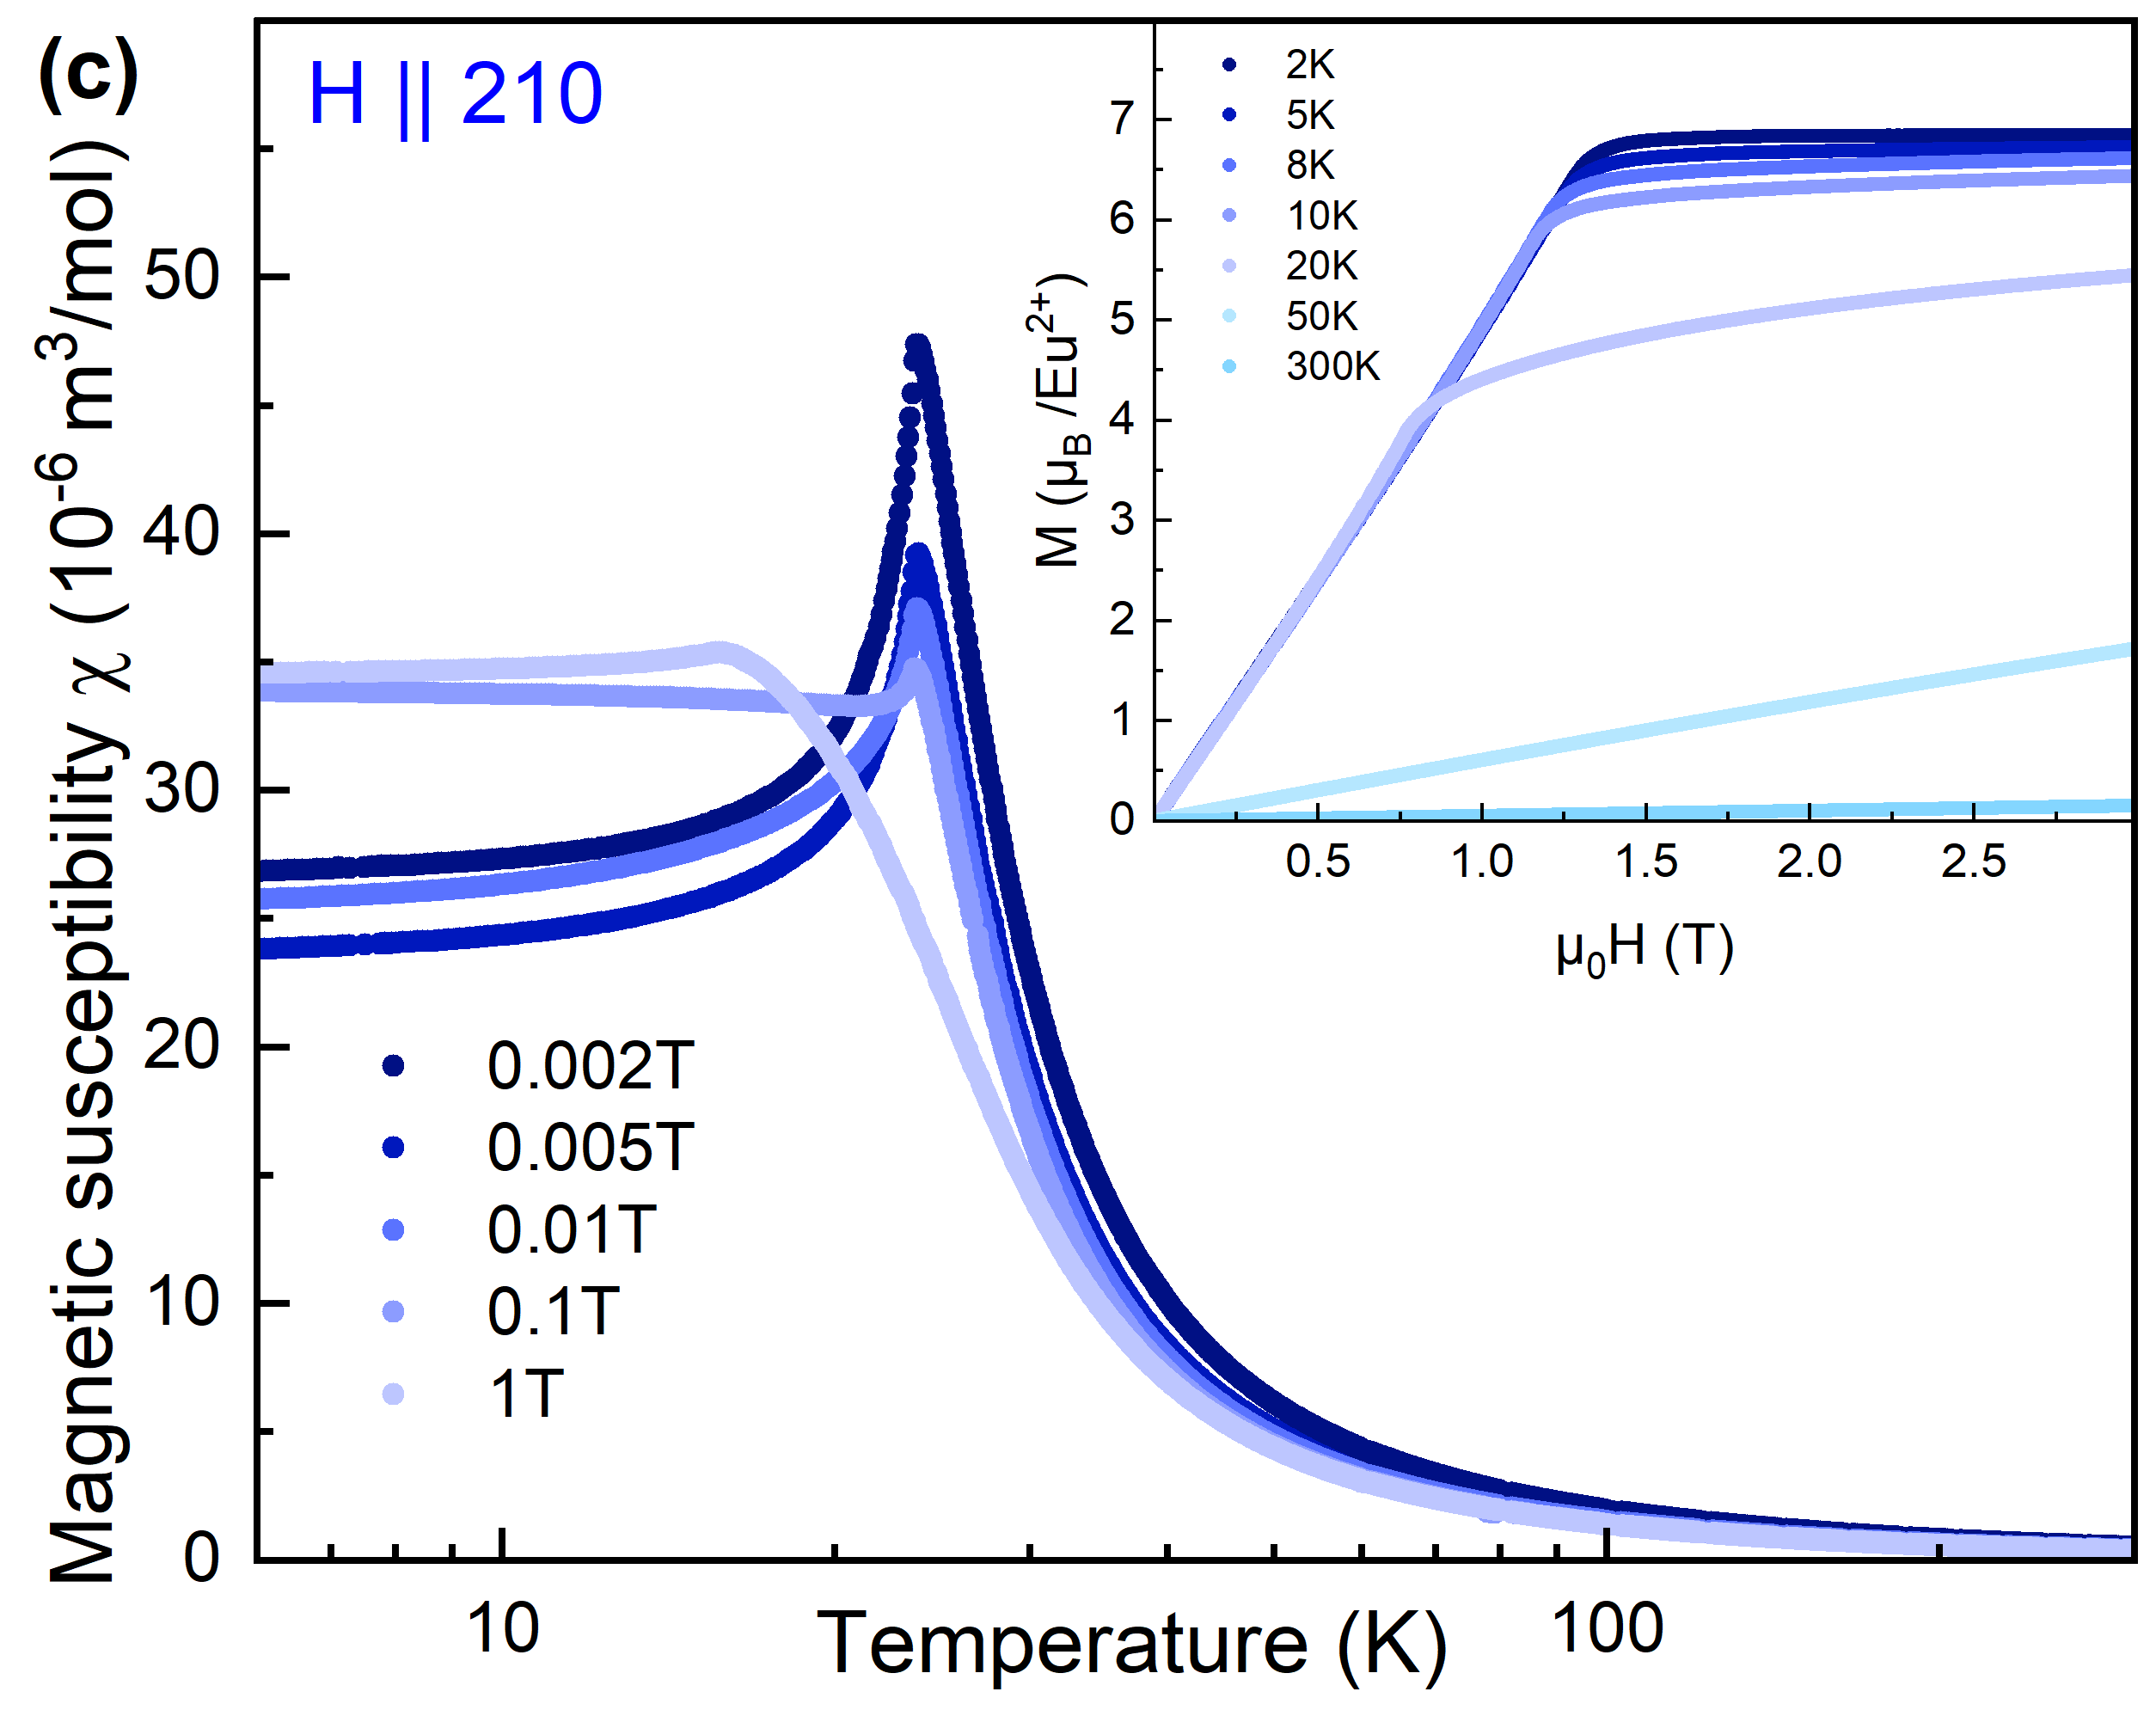
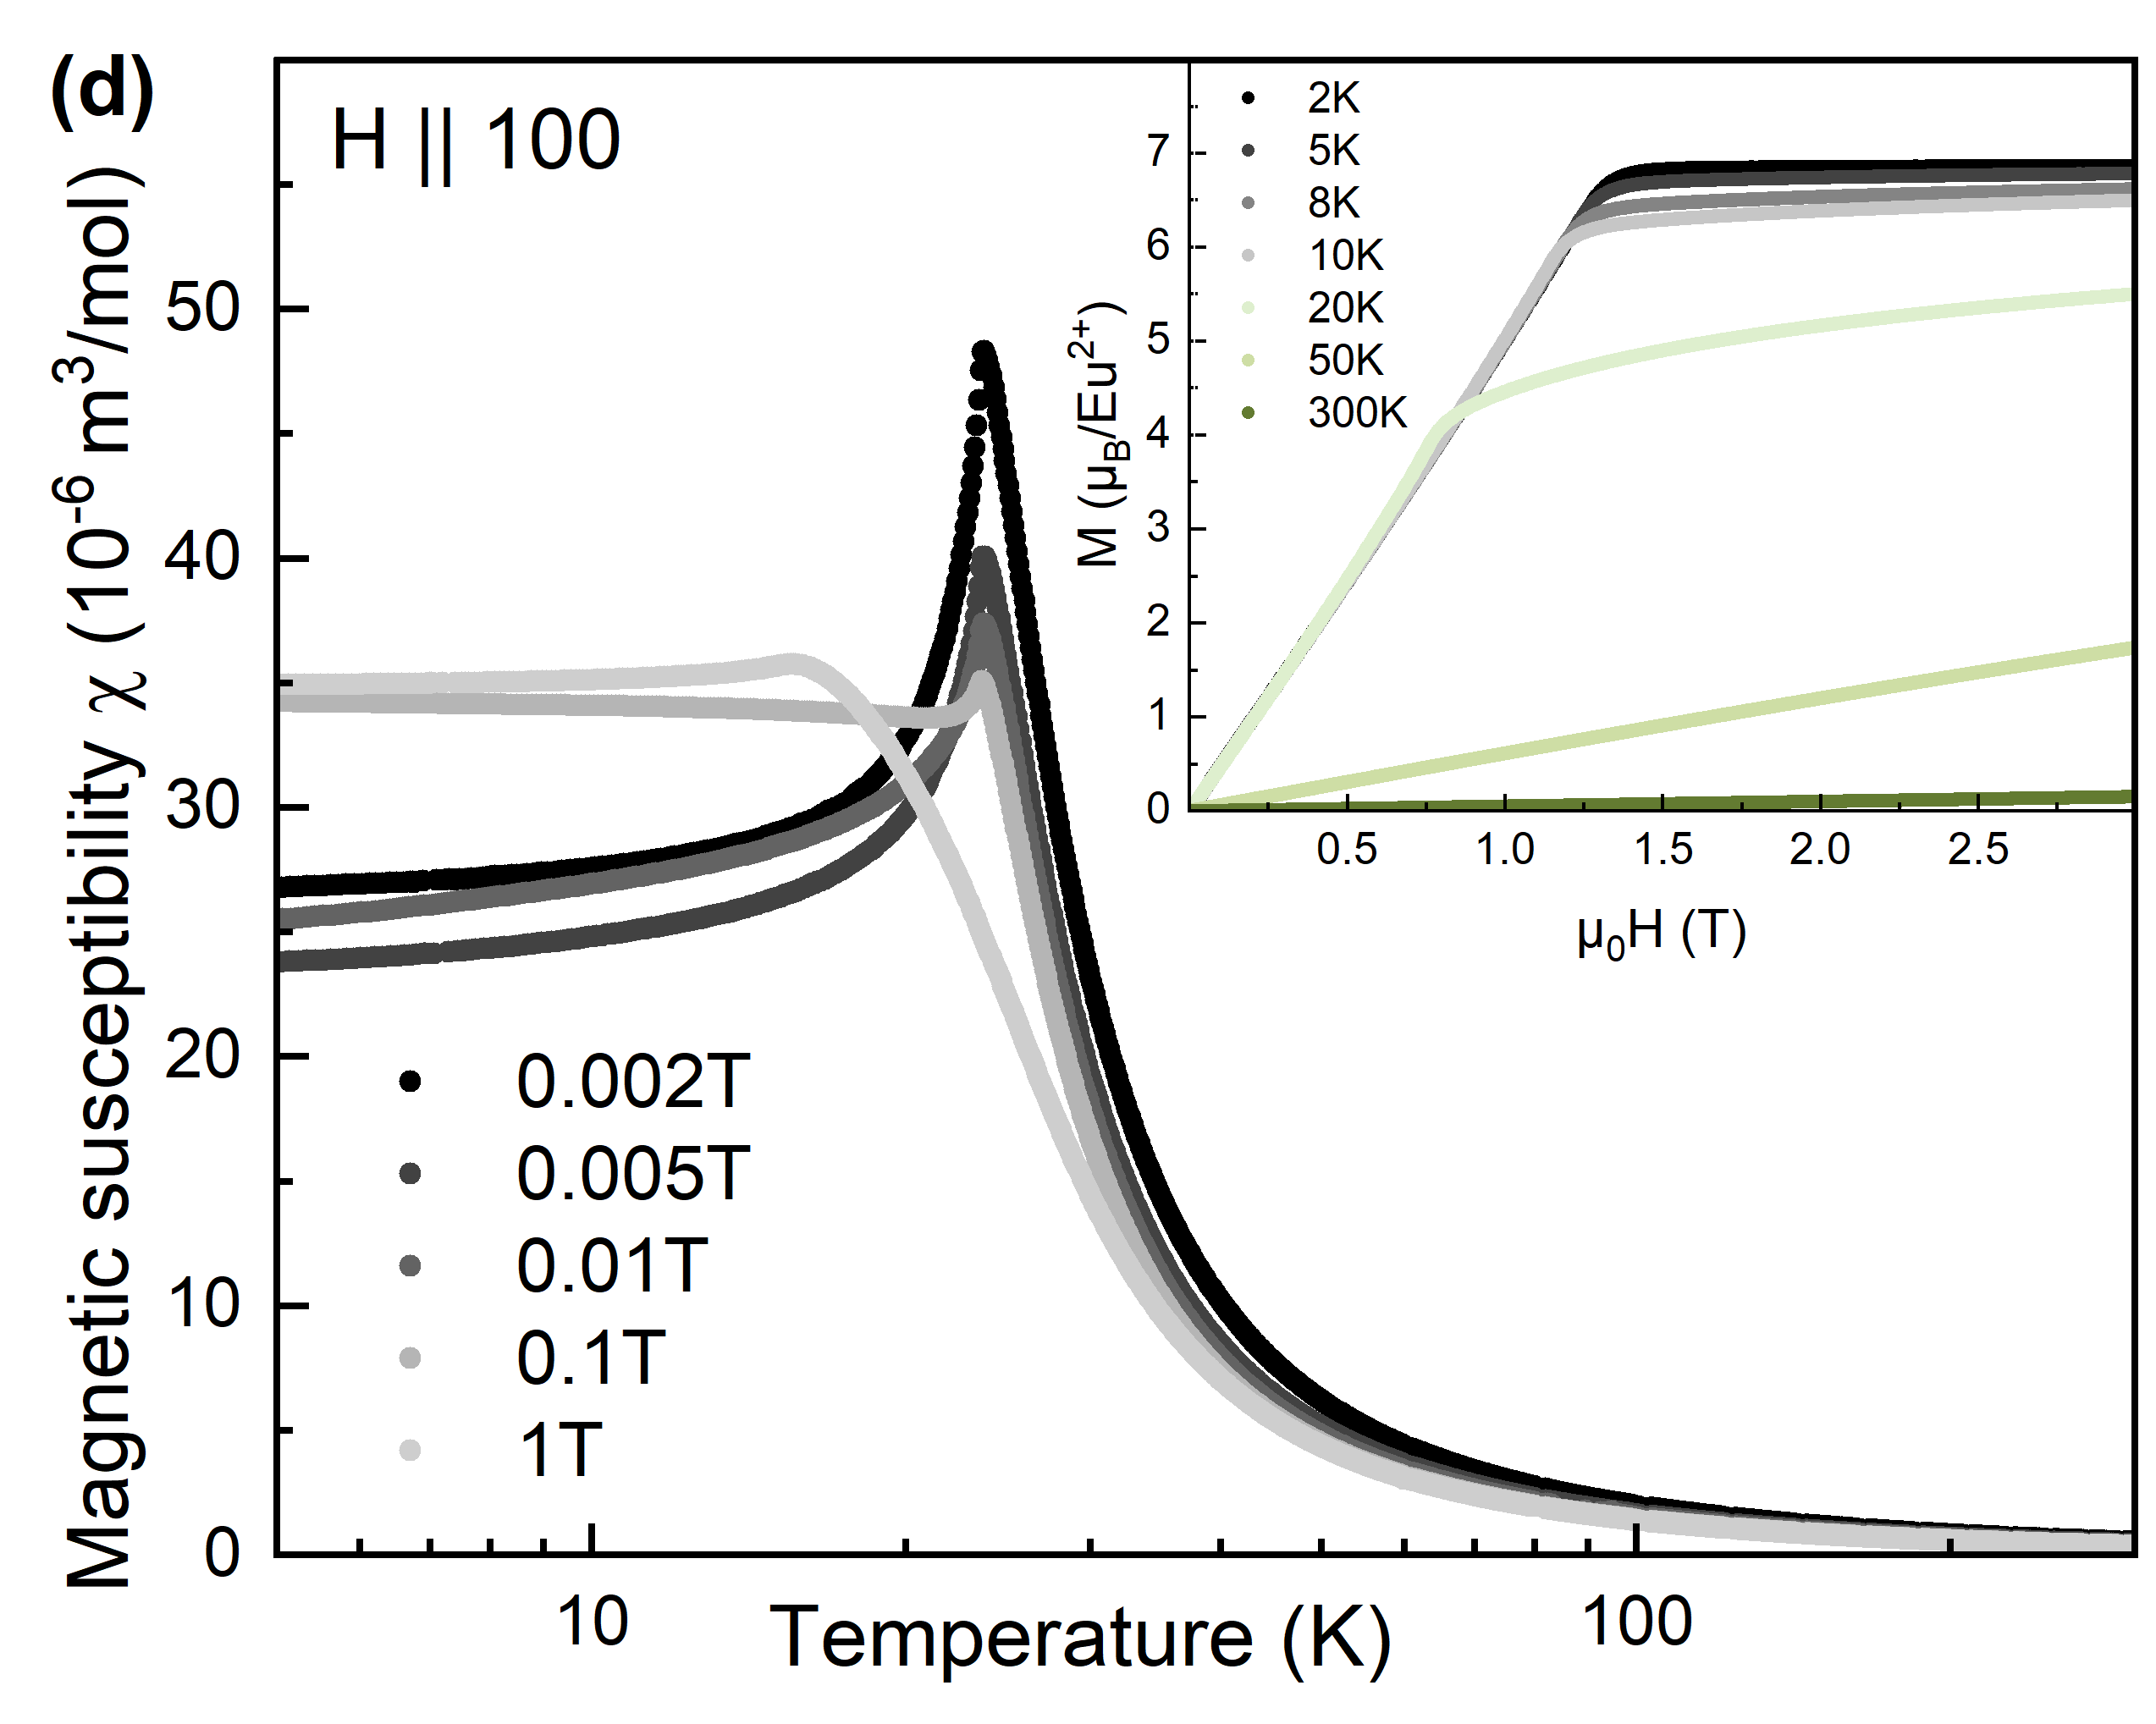
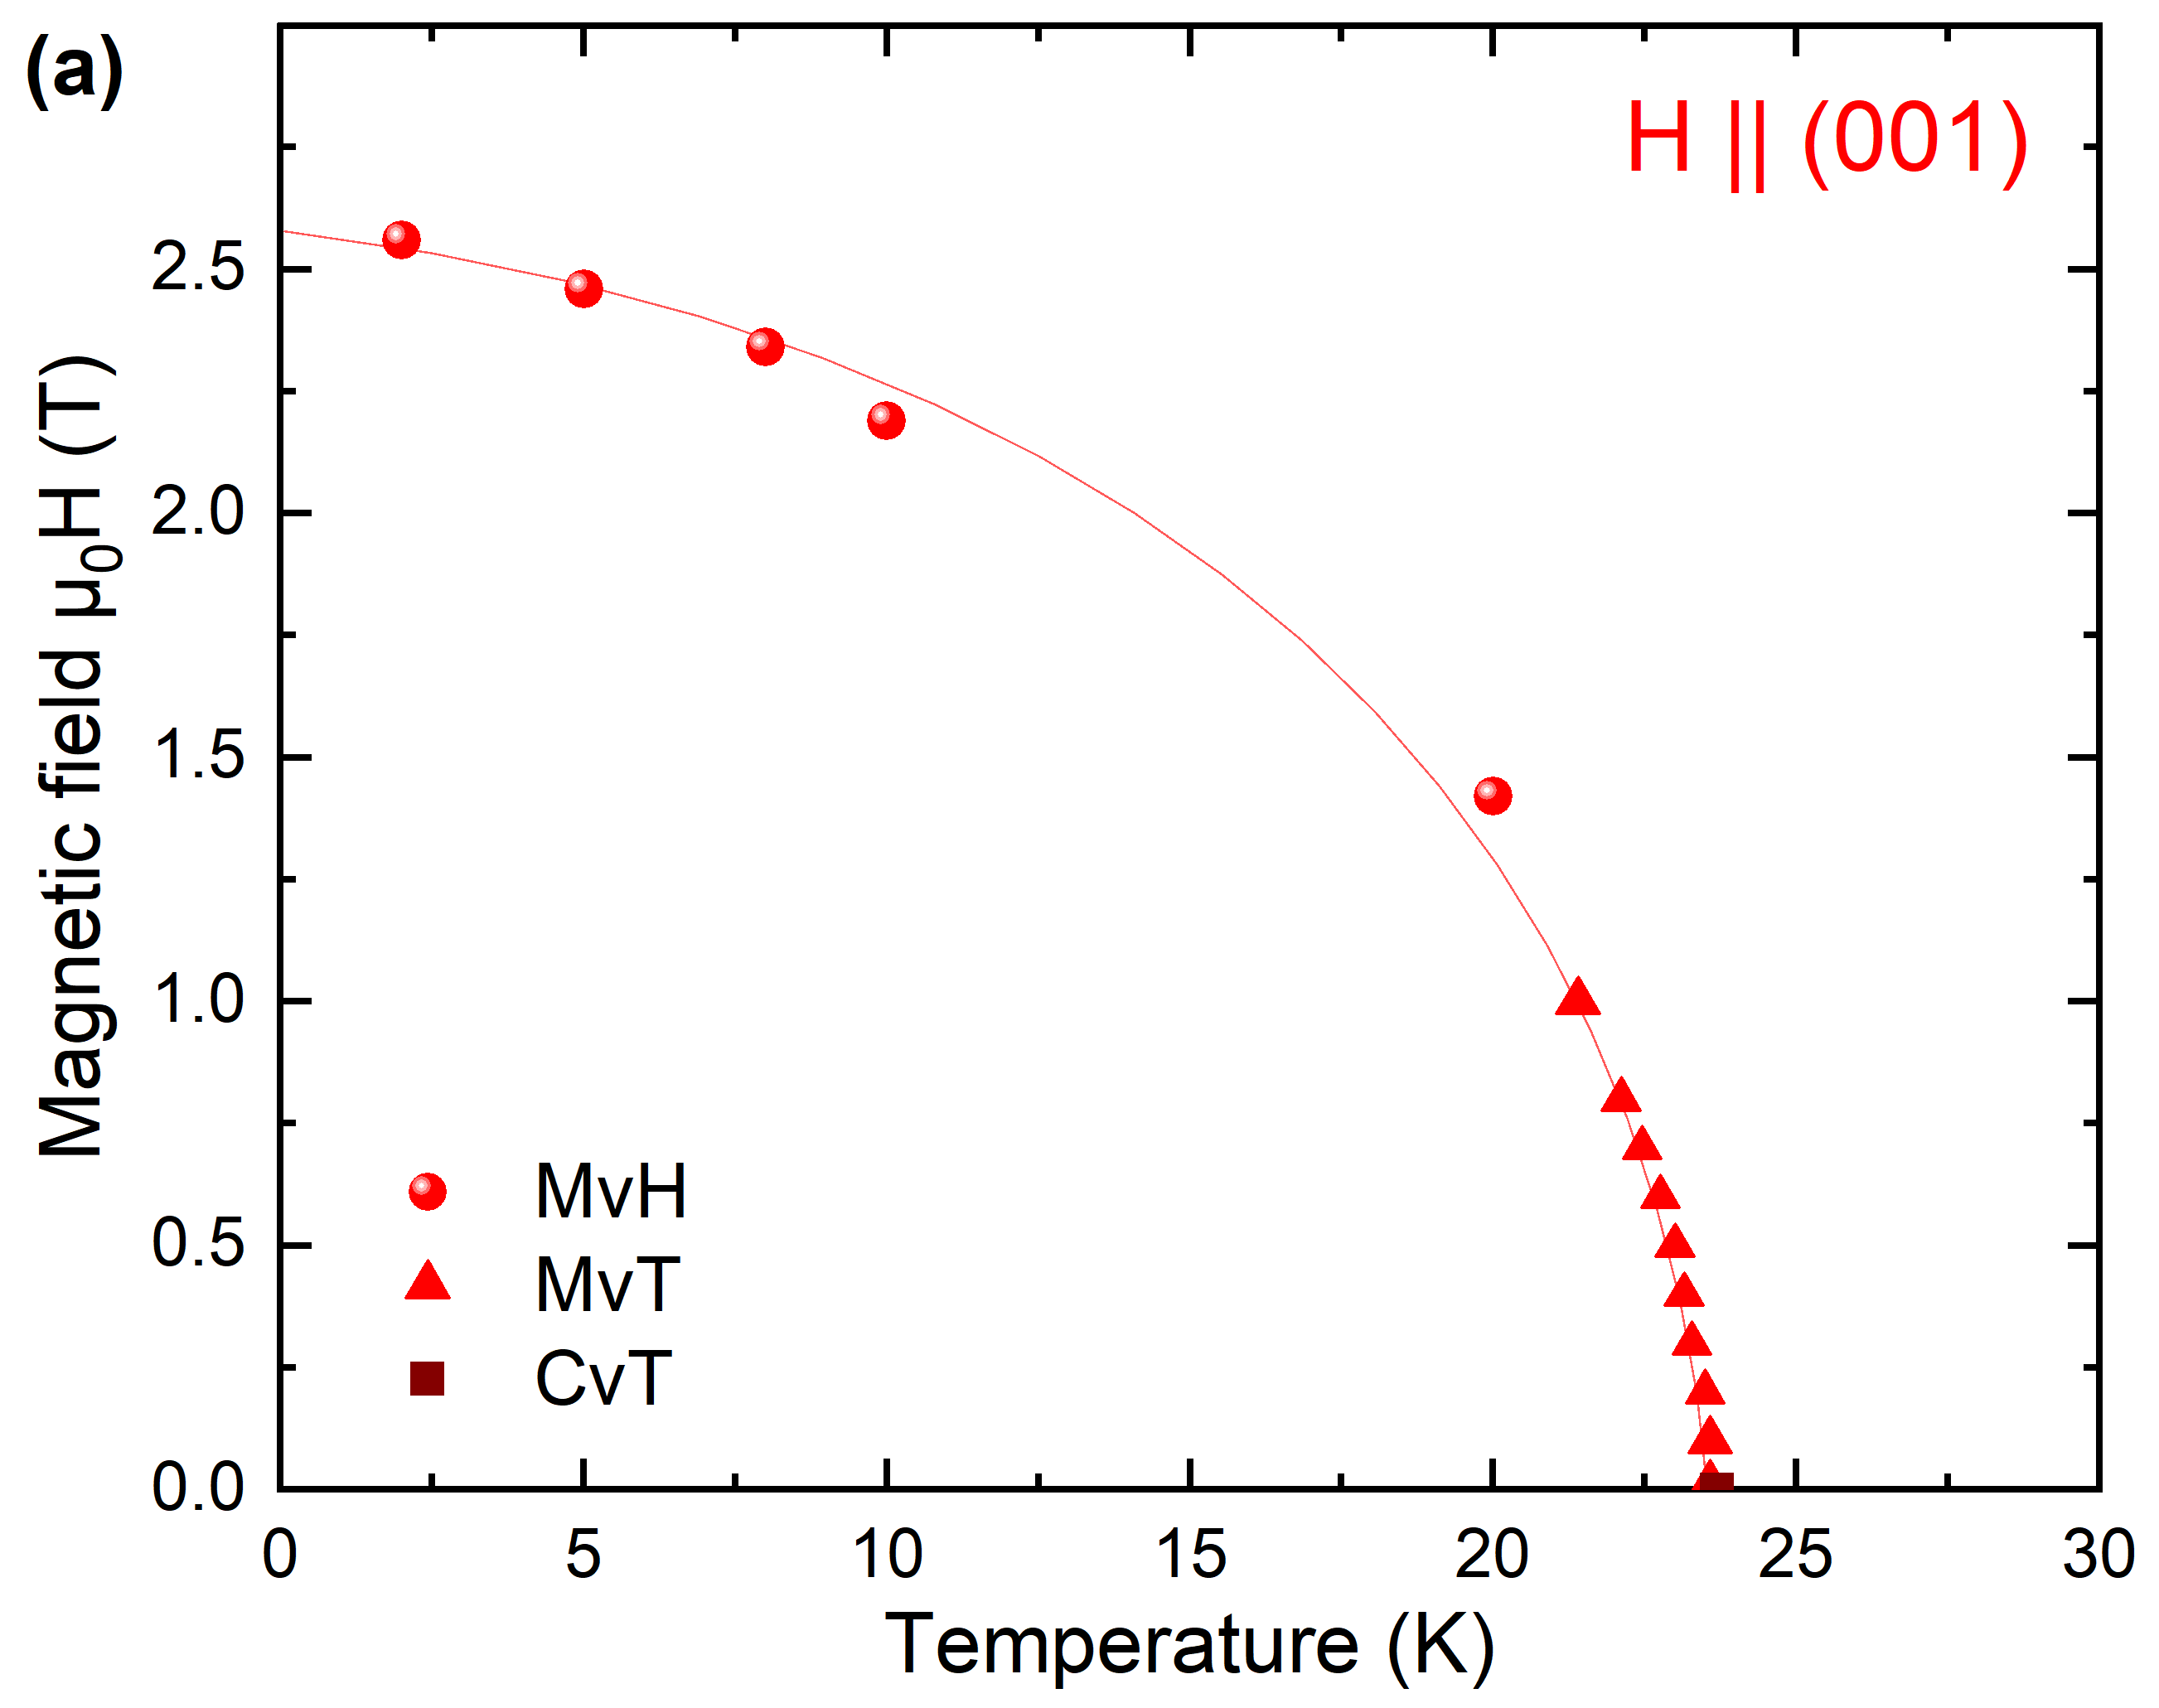
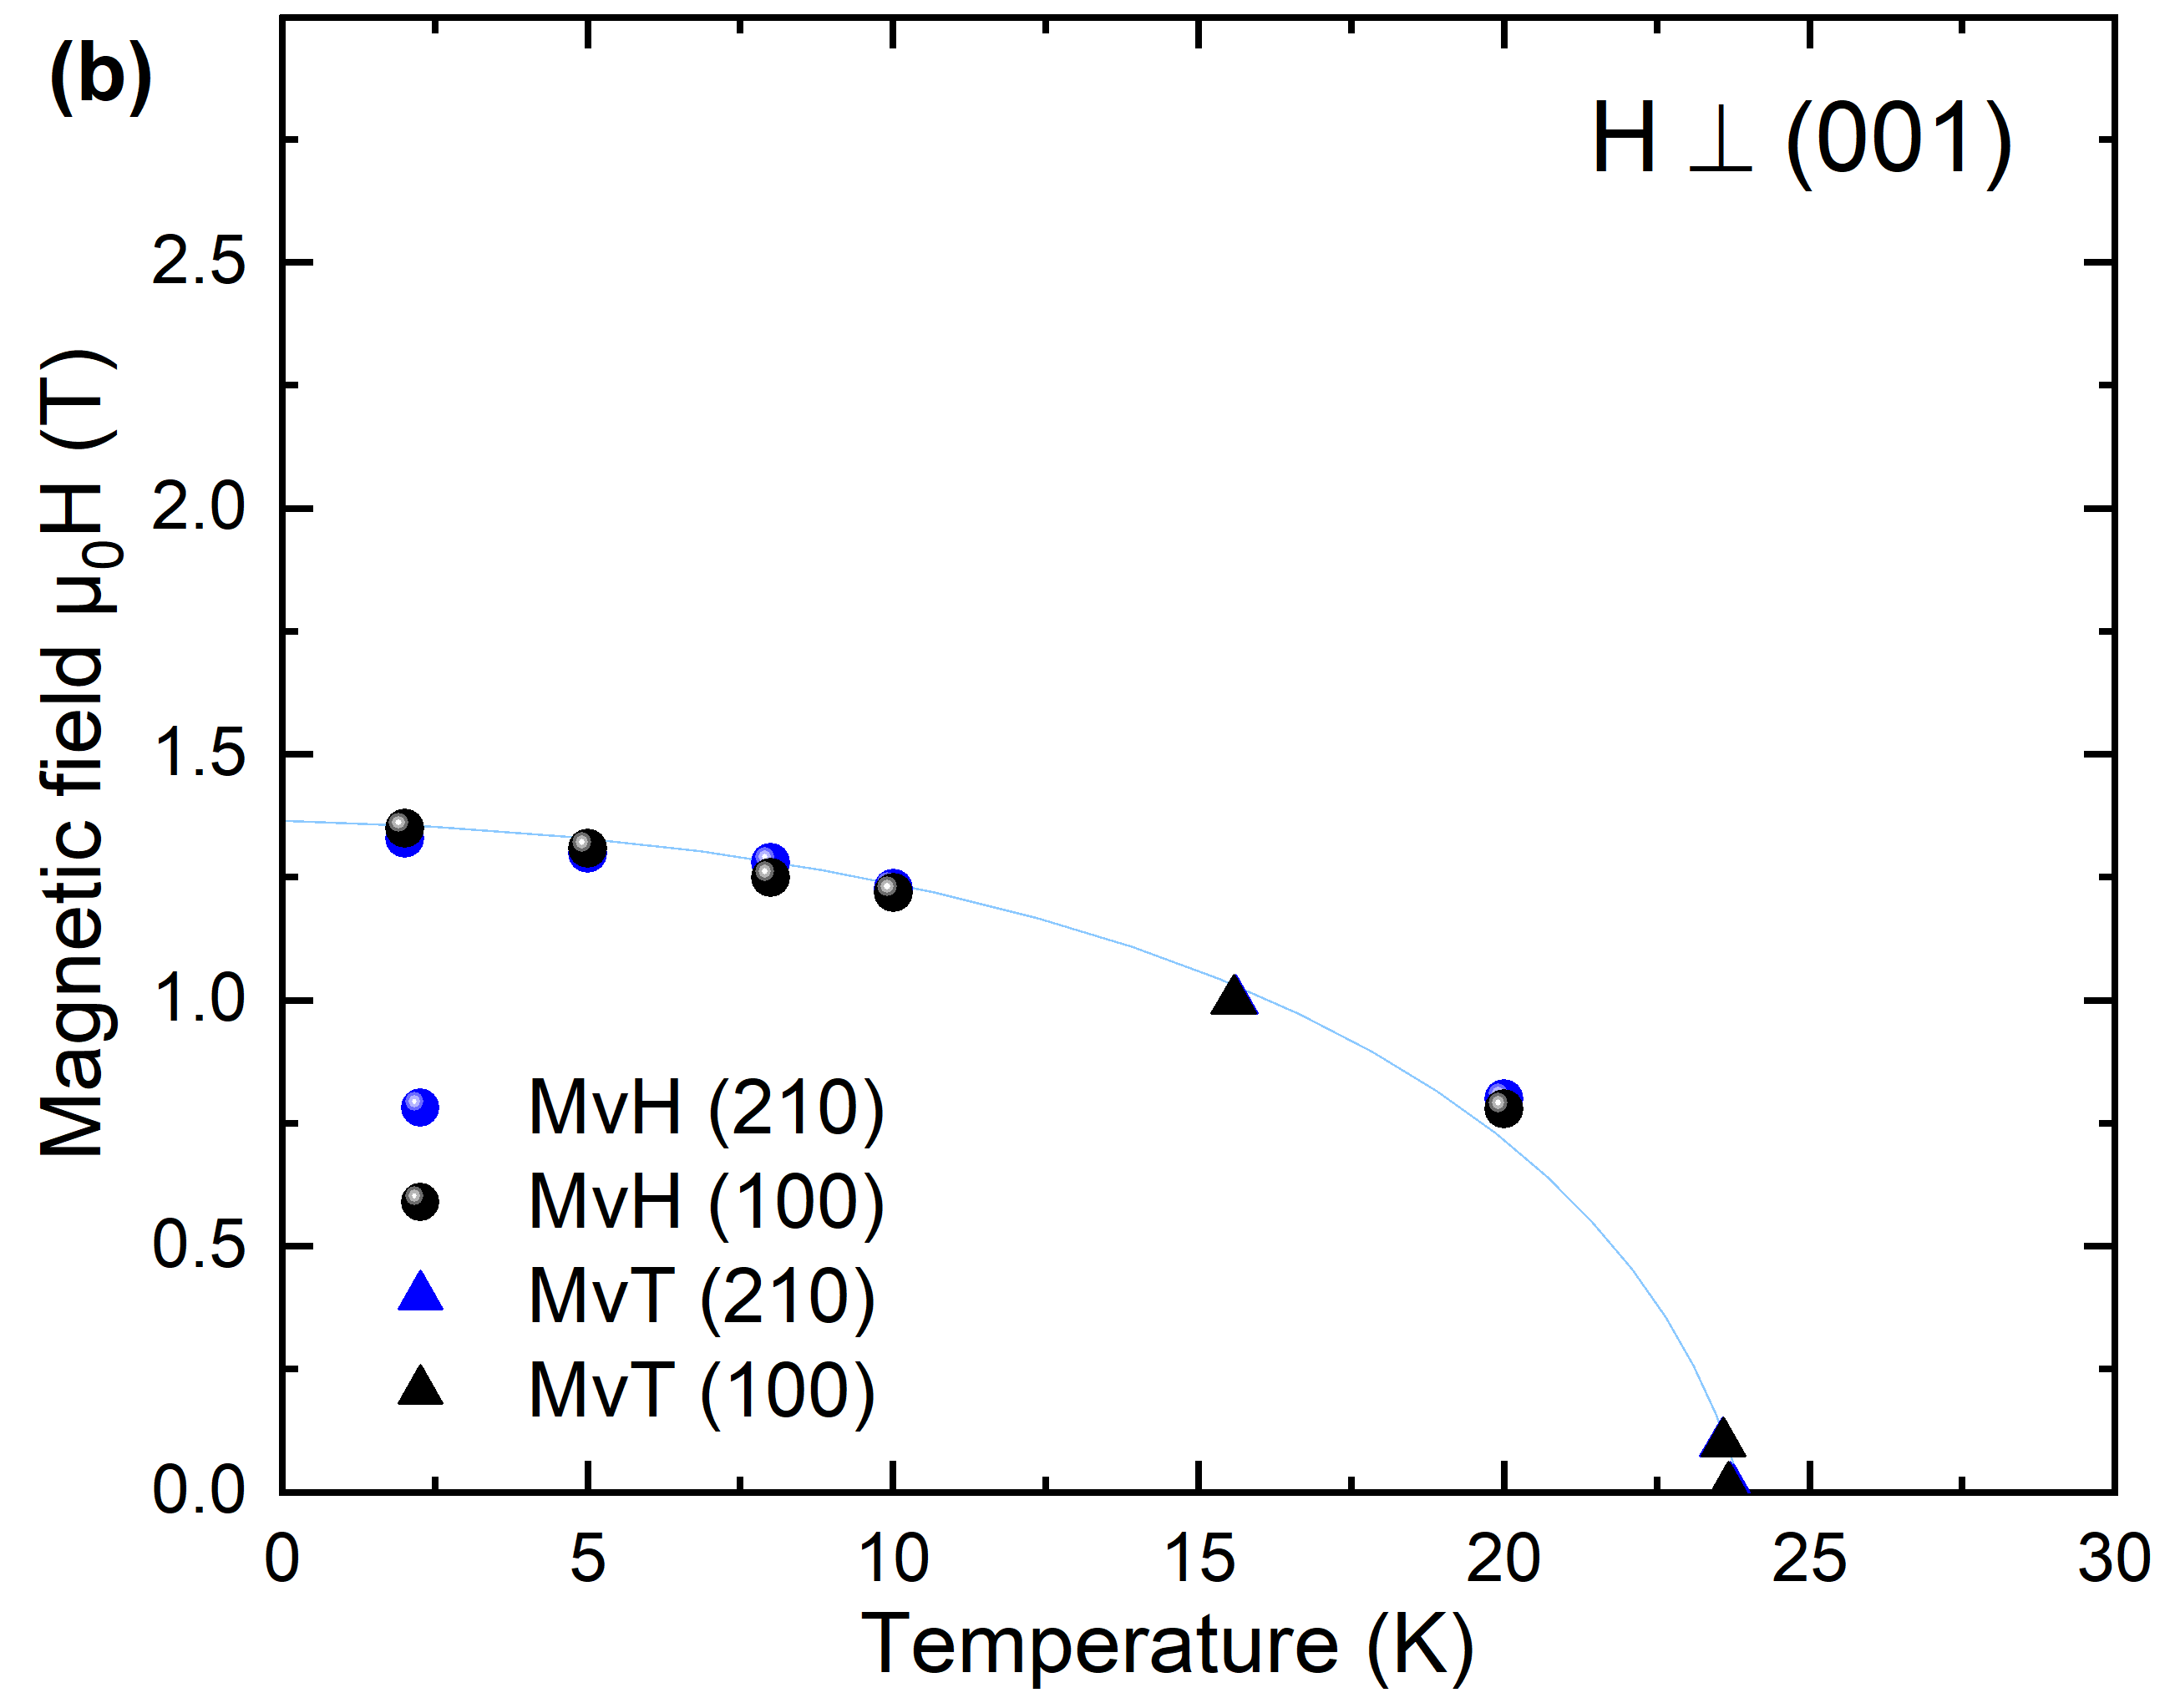
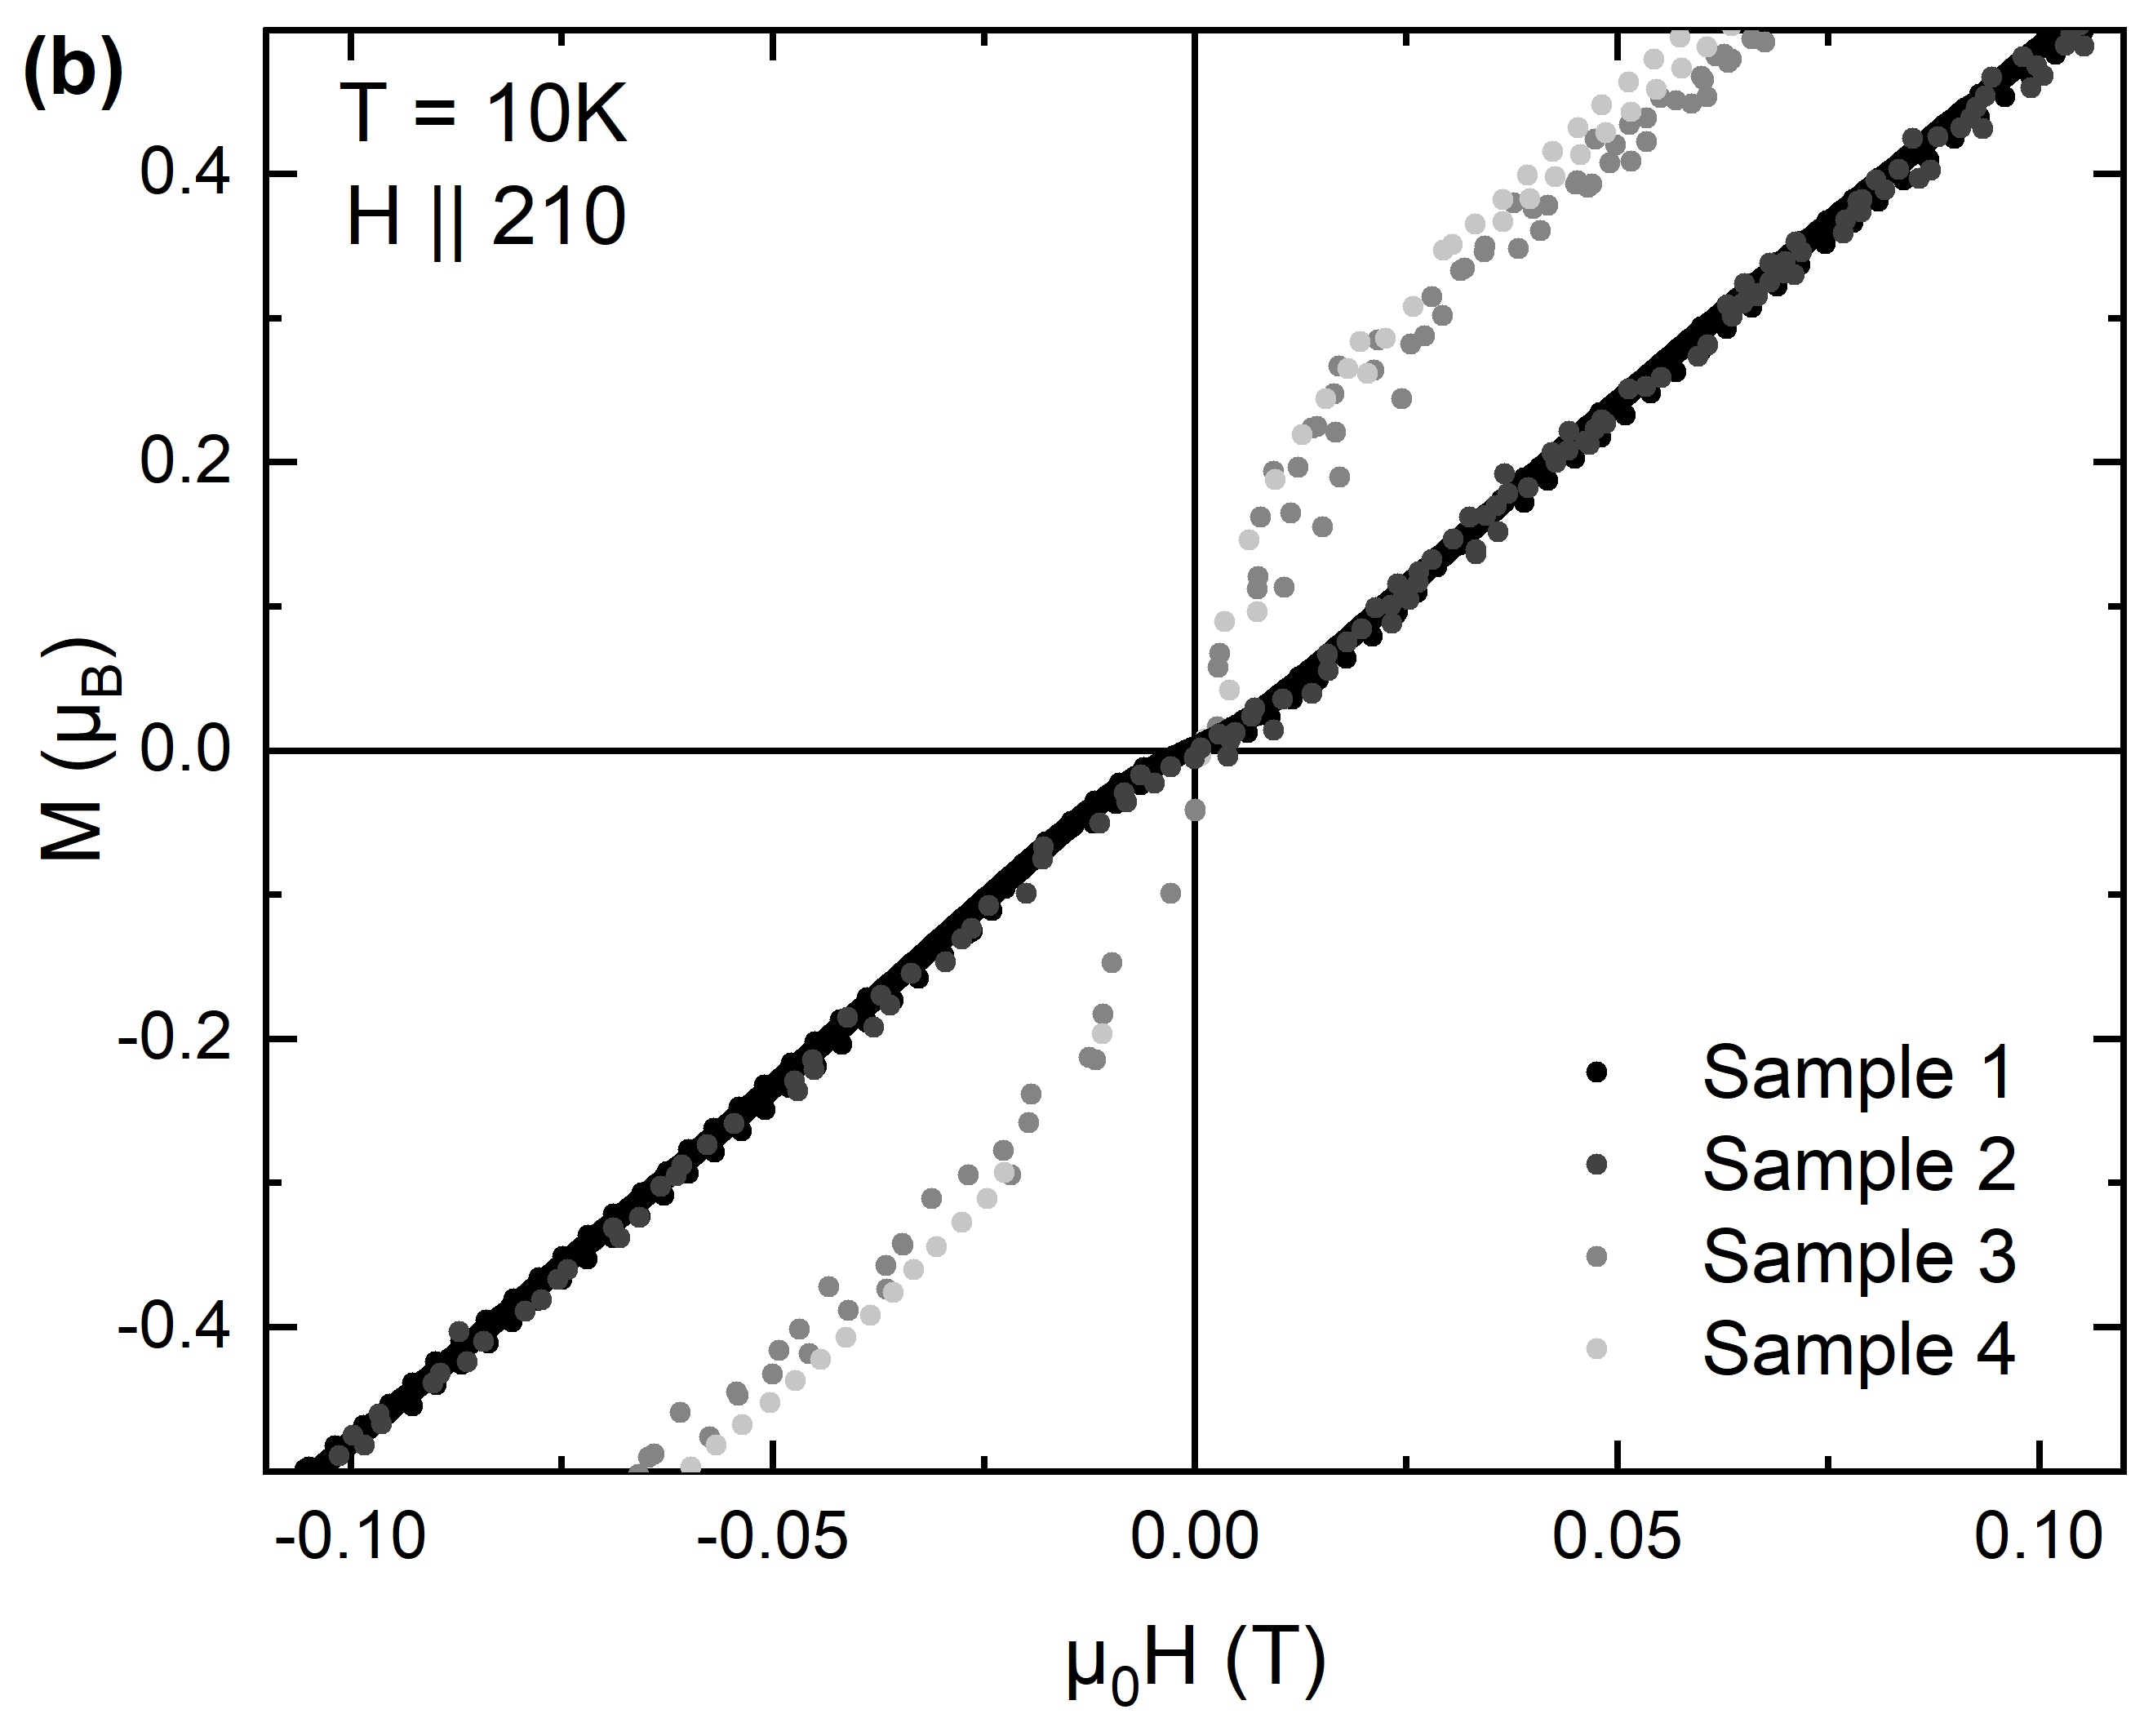
The field-dependent magnetization as well as the temperature-dependent magnetic susceptibility was measured with an applied magnetic field along the -, - and - directions, see Figs. 4(a-d). The obtained results, shown in the supplemental information in Figs. S3 and S4, are similar to those reported in Ref. [11] but according to the results of our careful Laue analysis, we find that the critical field to reach the field-polarized state is smaller for in-plane directions, compared to the magnetic field along c, Fig. 4(c). In Ref. [11] the opposite case was proposed. In order to fully represent the magnetic ground state, small magnetic fields, and low temperatures need to be considered. This is particularly important in Eu-based systems, where magnetic anisotropies due to spin-orbit coupling are rather weak and small magnetic fields can easily polarize the localized moments. Therefore, the temperature-dependent magnetic susceptibility was measured at shown in Fig. 4(a) and at , shown in Fig. 4(b). While the magnetic susceptibility is anisotropic for , we find that at very low magnetic fields and at low temperatures the magnetic anisotropy becomes nearly indistinguishable. At , the data for (red) and are almost isotropic. Especially for field in-plane, (black) and (blue) an anisotropy is absent. For higher magnetic fields, we observe a pronounced anisotropy between the in-plane and the out-of-plane directions as presented in Fig. 4(c) for with fields applied along the three crystallographic main symmetry directions. The magnetization saturates at approximately µB, which is the expected value for divalent Eu2+. While for (black) and (blue) the saturation is reached already at , a higher is observed for (red). From the low-field magnetization, information about the orientation of the magnetic moments in a material can be obtained, as recently demonstrated in detail for a tetragonal system [41]. In the case of trigonal EuZn2P2, with a lower in-plane symmetry and where the angular difference between the and the directions is smaller than in the tetragonal material (30 degrees instead of 45 degrees), we find two different types of magnetization curves for different samples as shown in the appendix in Fig. S5(b). Curves of type 1 show a close-to-linear behavior down to the lowest fields. Curves of type 2 show a large slope below which becomes smaller above this field value. As these changes occur at very low fields, we believe that this different magnetization behavior is due to the presence of AFM domains in the material. Fig. 4(d) emphasizes that the field-dependent magnetization is almost isotropic below magnetic fields of . This suggests a more complex magnetic structure compared to a simple -type AFM structure with the magnetic moments lying in the plane. From versus , shown in the inset in Fig. 4(d), we conclude that small fields applied along or are sufficient to induce a reorientation of AFM domains in this material. This low-field behavior together with the almost isotropic at low temperatures hints at a moment orientation in the crystal structure on the one hand in between the and directions and on the other hand canted out-of-the plane towards the direction. This differs from the suggested alignment of the magnetic moments in the plane as shown in Fig. 5c of Ref. [11]. Using magnetization measurements, we cannot determine the exact orientation of the magnetic moments in the unit cell as we always average over all possible magnetic domains. Instead, we used resonant magnetic scattering where only one magnetic domain can be probed at the same time to determine the magnetic structure of the material. The results are shown in Sec. III.3. Fig. 3 shows the inverse magnetic susceptibility of EuZn2P2 between 2 K and 300 K, where the data was fitted according to the Curie–Weiss law between 150 K and 300 K. The Weiss temperature as well as the effective magnetic moment were determined, which are isotropic for the three crystallographic main symmetry directions. The effective moment agrees well with the theoretical value . Interestingly, the inverse magnetic susceptibility shows a graduate deviation from the straight line of the fit starting already at high temperatures, however becoming significantly high below . Due to the absence of orbital angular momentum () in Eu2+, no crystalline electric field (CEF) effects and therefore no strong deviation from the Curie-Weiss fit is expected far above the magnetic ordering temperature. This deviation hints at the presence of magnetic fluctuations above .
III.3 Magnetic structure determined from resonant magnetic X-ray diffraction
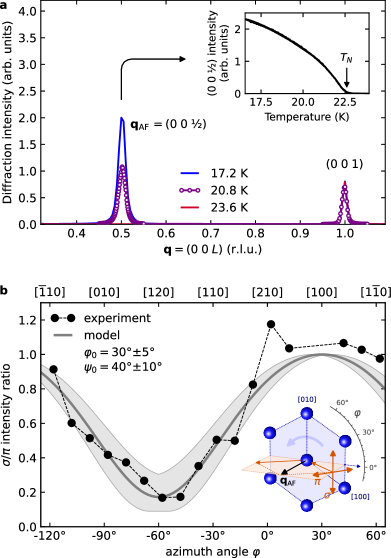
In order to determine the magnetic structure of EuZn2P2 we performed resonant magnetic diffraction [42] at the Eu edge. Tuning the incident energy to the Eu resonance during the diffraction experiment enhances the magnetic diffraction peaks originating from the AFM order of the Eu moments by several orders of magnitude such that they become comparable in intensity to lattice Bragg peaks. The intensity of magnetic Bragg peaks strongly depends on the relative orientation of the magnetic moments with respect to the incident light polarisation and the diffraction plane. Here, we took advantage of these characteristics to study the ordering of the magnetic Eu moments. Fig. 5(a) shows a series of scans along performed below and above . In addition to the usual structural Bragg peak, we observe the emergence of a magnetic Bragg peak at when the temperature is lowered below . The presence of a magnetic peak at is indicative of a magnetic unit cell twice the size along compared to the structural unit cell, as is the case for a simple ’+ - + -’ antiferromagnetic stacking of ferromagnetically ordered Eu planes (-type AFM order). Fig. 5(b) shows the intensity ratio of the magnetic Bragg peak for incident and polarisation as the sample is rotated about the [0 0 1] direction by an azimuth angle . The experimental geometry is shown as an inset. If the magnetic moments are aligned along the -axis a rotation about does not change anything in the relative orientation of the magnetic moments and the polarisation vectors of the incident light. In this case, the intensity ratio will not be dependent on and take a constant value of one everywhere. By contrast, for moments lying in the plane a strong modulation of the ratio will occur between a value of one when the magnetic moments are in the diffraction plane and zero when they are perpendicular to the diffraction plane. For moments canted away from the plane a rotation about the -axis cannot perfectly align the moments perpendicular to the diffraction plane anymore and the ratio will reach its minimum at some finite value that depends on the canting angle , away from the plane towards c. We performed a fit of a collinear -type AFM model to the experimental data. From that, we found that the best agreement is achieved for the magnetic moments aligned along the Eu-Eu direction within the plane and a canting by about out of the plane in agreement with an in-plane component as suggested in Ref. [11]. The observation that the magnetic Bragg peak remains unchanged upon cooling, Fig. 5(a), indicates the absence of lattice distortion in EuZn2P2, unlike the Jahn-Teller distortion, e.g., in LaMnO3, which is suggested to be related to the CMR effect in mixed-valence perovskite manganites [13, 34].
III.4 DFT+U and ARPES
For the electronic characterization, we performed calculations in the framework of density functional theory (DFT) employing the Hubbard correction for the Eu 4 states. Investigating both in-plane and out-of-plane AFM order of Eu 4 moments revealed no considerable changes in the electronic band structure with only tiny changes observed in the structure of the Eu 4 states. Because of this weak anisotropy, we will focus below on the results obtained for the out-of-plane orientation of the 4 moments. The corresponding calculated band structure and its orbital composition are shown in Fig. 6(a) for eV. Two prominent and characteristic features are visible, the first relating to the band gap, and the second to the flat Eu band. Starting with the band gap around the Fermi level , we can see that an indirect band gap of 0.2 eV is formed between the valence band maximum at the point and the conduction band minimum at the M point. The gap is slightly smaller than the direct band gap at of 0.34 eV, thus the calculation predicts EuZn2P2 to be an indirect semiconductor. Looking at the orbital composition, the excitation of the direct band gap is a transition from a cone-shaped state at the point, reminiscent of Dirac matter, dominated by P states to an electron-like band dominated by Zn and P states, while the indirect excitation is a transition to primarily unoccupied Eu 5 states. Hence, the energy of the Eu 5 states in comparison to the Eu 4 plays an important role for the size of the indirect band gap. Additionally, the Eu 4 states which can be clearly seen as flat bands located at below (orange), hybridize with the cone-shaped bands that form the valence band maximum at the point. The Eu 4 states intermix with the P -dominated states leading to an hybrid which, however, loses rapidly 4 character away from the Eu 4 states. Still, a small magnetic moment at the P sites (µB) is induced. Similarly, hybrids have been observed in the AFM semiconductor EuCd2As2 [7, 4, 43] or ferromagnetic semiconductor EuS [44], where the hybridization strength and degree of Eu 4 correlation were found to be crucial for the magnetic exchange interaction and size of the band gap. To examine the validity of our DFT+U calculation, we performed ARPES measurements of the [001] surface of EuZn2P2 shown in Fig. 6(c), which can be best compared to the projection of the calculated bulk bands along as depicted in Fig. 6(b). In accordance with the electronic transport measurements and DFT+U calculation, the photoemission measurements show clear semiconducting properties with a visible gap at and electrical charging of the sample at low temperatures. Using a photon energy of 137 eV, both the valence band as well as the Eu 4 states are clearly visible, which nicely agrees with the projected band structure. Especially, the agreement of the energy position of the Eu 4 states in relation to the cone-shaped valence band maximum gives a good indication that the empirically chosen Hubbard eV correction should allow for a good prediction of the unoccupied states, too. Further prominently visible in the ARPES data is the aforementioned hybridization of the Eu 4 level with the P -dominated cone-like feature around the point. The spectral structure of the cone-like feature is shown as an inset in Fig. 6(c) with the valence band maximum having a typical Dirac-like shape. Finally, the survey ARPES spectrum (not shown) taken from a freshly cleaved EuZn2P2 single crystal does not reveal any traces of the Eu3+ final state multiplet situated between 6 and . This is in clear agreement with the purely divalent magnetic configuration of Eu expected for EuZn2P2.
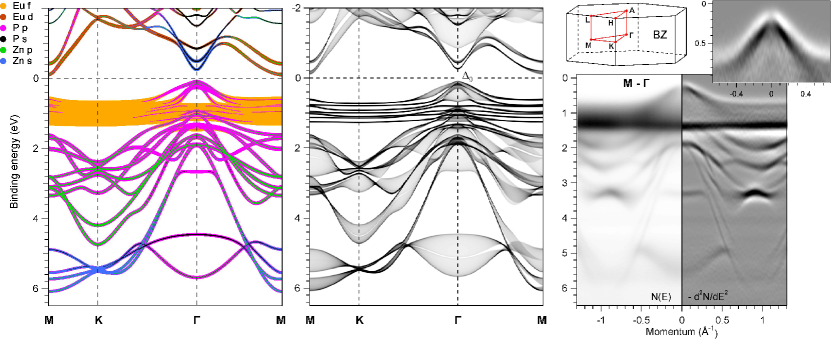
(c) Experimentally derived electronic structure obtained using the photons of 137 eV along the - - direction. The insets in (c) show the sketch of the Brillouin zone as well as the details of the spectral pattern of a cone-like feature at the point.
III.5 Infrared spectroscopy
In order to study the low-energy intra-/interband and lattice excitations, in particular, for comparison with the transport and band structure properties investigated above, we measured the ground-state reflectivity spectrum at K for light polarized in the plane over a broad spectral range from 10 meV to 1 eV. Fig. 7(a) shows the measured spectrum, where one observes two sharp (phonon) signatures at lower energy (energies given below) on top of a weakly metallic plateau, while in the range a broad structure with slowly increasing and an inflection near is present. Away from the main phonon peak, the reflectivity is well below unity, which is consistent with EuZn2P2 being a poor conductor with a small charge carrier concentration (see below). While certain general features are similar to those previously reported spectra for EuCd2P2 [45] and EuCd2As2 [3], there are also differences that we address below after modeling the spectrum. For the free-carrier Drude response, we employ a standard Drude model with a DC conductivity and scattering time . To model the phonon bands, as is evident from the oscillatory form of (especially for the lower band), we found one must go beyond basic Lorentzian lineshapes and employ the more general Fano lineshape [27], which accounts for electron-phonon coupling with the free carriers (Sec. II.7), as was also employed to model the higher-energy phonon in EuCd2As2 [3] (although not for EuCd2P2 [45]). For the interband transitions, we use a Tauc-Lorentz band model (), which differs from the commonly used Lorentzian model by including a low-energy cut-off to reflect the bandgap energies [28, 29]. This band model has been applied e.g. in amorphous materials [28] and indeed also conforms to the band-edge response for indirect transitions [26], although we tentatively employ it here for the direct interband transition as well, in order to avoid a long low-energy extension of the band, as would be the case for a standard broad Lorentzian band. The resultant fitted reflectivity spectrum is shown in Fig. 7(a) (dashed curve) and is seen to be in very good agreement with experiment. The corresponding fitted conductivity spectrum is shown in Fig. 7(b), including each separate contribution. Inspecting first the lower-energy range, the Drude contribution has a fitted DC conductivity of , comparable to but somewhat higher than from the room temperature DC transport measurements (where , Sec. III.1). Interestingly, a similar analysis of EuCd2P2 also had a discrepancy between these two values, although there is a larger factor and in the opposite direction [45], which may indicate the presence of additional contributions to the conductivity response at even lower energies than measured here. Note that we did not observe any clear indication for a non-Drude conductivity signature, as was found for EuCd2P2 below [45]. The Drude response is seen to be very broad due to a rapid scattering rate fs, corresponding to a damping rate of , which is comparable to that found in EuCd2P2 ( [45]), although for EuCd2As2 this rate was significantly lower ( [3]). One can propose that these differences result from variations in the band structures of these isoelectronic compounds, which affect the acoustic-/optical-phonon momentum scattering rates [30], although one cannot rule out the possible role of impurities. In any case, the Drude plasma frequencies are all closer, here compared to (EuCd2As2, [3]) and (EuCd2P2, [45]), i.e. the total spectral weight and carrier-density:mass ratios () are comparable [26].
Using the conductivity effective mass (deduced from the DFT band structure - see Sec. II.8) we can estimate a carrier concentration of , i.e. a value somewhat higher than might be expected from the relatively low magnitude of alone (compared to typical semiconductors), the latter due mainly to the short scattering time . We can compare this to the expected carrier density based on thermal excitation of intrinsic carriers across the indirect band gap (Sec. II.8), which yields , i.e. more than an order of magnitude smaller. This indeed suggests that additional donor states exist in the material with a smaller activation energy than the predicted band gap (see Sec. III.1).
Turning to the two phonons, the fitted bands in Fig. 7(b) are at frequencies and , close to those in EuCd2As2 ( [3]) and EuCd2P2 ( [45]), which have been assigned to modes for light polarized in the plane. Interestingly, while Fano effects due to electron-phonon coupling could be disregarded in EuCd2P2 [45], and were only significant in EuCd2As2 at lower [3], our fitted spectra indicate rather strong Fano effects, with and – such magnitudes for have been observed in other non-Eu systems, e.g. [27]. The resultant distorted lineshapes can be seen in Fig. 7(b), and as mentioned above, were necessary to achieve the detailed fit of in these spectral regions. This intriguing result of a stronger electron-phonon coupling in EuZn2P2 compared to EuCd2P2 and EuCd2As2 should be pursued in future work including temperature dependence and application of Kramers-Kronig using an extended frequency range, in order to study the experimental conductivity spectra directly.

Finally, we inspect the fitted interband transitions, which was a key motivation for the ground-state infrared study, in order to compare the results with the measured and calculated band structures (Sec. III.4). The indirect/direct interband conductivity bands (, respectively) are included in Fig. 7(b), along with the corresponding band-gap energies from the DFT+U calculations with (vertical dashed lines). One sees that the fitted band gap for the direct interband transition (, ) coincides very closely with the theoretical prediction of . While such close agreement is most likely coincidental, given the inherent issues of estimating optical excitation energies from DFT band structures [46], the agreement provides support for the accuracy of the DFT+U calculations presented above. Turning to the indirect band, while the relative discrepancy for is somewhat larger (optical: , DFT+U: ), this still amounts to a rather small absolute energy difference. Due to the spectral overlap in the region about and only weak features in the reflectivity , the -uncertainty in the fitted value was found to be (denoted by the horizontal bar in Fig. 7(b) about ), which may account for part of the discrepancy. In any case, the relative spectral weights of the fitted bands are consistent with the predicted band structure, i.e. with a much weaker indirect band gap due to the lower cross-section for phonon-assisted optical transitions [26].
IV Summary and Discussion
Single crystals of EuZn2P2 were grown from Sn flux and structurally, chemically and physically characterized. The trigonal crystal structure (space group No. 164) was confirmed with single crystal X-ray diffraction where the data is consistent with the previously reported in Ref. [11]. In Ref. [11], insulating behaviour was seen when measured down to . In contrast, we found that the electrical resistivity of EuZn2P2 shows a semiconducting behaviour at low temperatures with a flattening of the resistivity below . The resistivity can be strongly suppressed by applying magnetic fields up to of % at T and % at T (CMR-effect). The onset of a considerable negative MR at about coincides with a deviation of the inverse susceptibility from a Curie-Weiss behaviour. This indicates that the formation of magnetic polarons might be at the origin of the here reported CMR in EuZn2P2 and may also play an important role for the compound EuCd2P2.
Using resonant magnetic X-ray diffraction we studied a single antiferromagnetic domain of a EuZn2P2 crystal, determined a magnetic ordering vector and found that the moments are canted by out of the plane and tilted towards the [100]-direction in the plane. This agrees with the magnetization data, where isotropic behaviour was observed experimentally for and for EuZn2P2. For small applied fields, below , we observe a redistribution of magnetic domains which is similar to what was observed in EuCd2As2 [2]. At 0.1 T, EuZn2P2 shows a distinct magnetic anisotropy of the in-plane and out-of-plane directions, which is consistent with the data shown by Ref [11]. In agreement with the resistivity measurements, both DFT+U calculations and ARPES measurements show semiconducting properties in EuZn2P2. The good agreement between DFT+U band structure and ARPES pattern lets us theoretically predict an indirect gap of and a direct band gap of , which corresponds very well with the experimentally determined band gaps and obtained through our infrared study. Our combined ARPES and DFT+U study further reveals a hybridization around the point which is common for magnetic Eu-based semiconductors and believed to be crucial for the exchange magnetic interaction and size of the band gap. Lastly, the comparison of the calculation for in- and out-of-plane antiferromagnetic Eu 4 order reveals only tiny differences in the band structure without strong anisotropic behavior.
Finally, it is interesting to compare the physical properties of EuZn2P2 with other compounds of the same family where Zn is replaced by Cd and P is replaced by As or Sb. All compounds are isostructural and exhibit Eu antiferromagnetic order with similiar magnetic ordering temperatures ( = 19.2 K in EuZn2As2 [47], = 13.3 K in EuZn2Sb2 [48], = 11 K in EuCd2P2 [1], = 9.5 K in EuCd2As2 [2]). The materials differ slightly in their unit cell volumes and the size of the spin-orbit coupling depends on the transition metal. Similar to the compounds EuCd2P2 [8] and EuCd2As2 [5], EuZn2P2 displays a magnetic anisotropy of the in-plane and out-of-plane directions at magnetic fields above 0.01T. However, there is presently no evidence for a canting of the magnetic moments in EuCd2P2 away from the a-a plane [8]. Furthermore, both phosphorous compounds show a strong colossal magnetoresistance at low temperatures [8]. It would be interesting to investigate further whether the mechanism behind the CMR in EuZn2P2 and EuCd2P2 is in fact the same and whether the formation of magnetic polarons plays a role in the origin of the here reported CMR.
Eu-based materials often show unusual magnetism, which is critical for nontrivial topological properties as seen in the paramagnetic phase of the compound EuCd2As2 [4]. This compound is a candidate for a topological semimetal in which a Weyl phase is induced if Eu orders ferromagnetically with moments along the [001] direction [6]. In the here investigated AFM sister compound EuZn2P2, we do not see any evidence of a topologically ordered state neither in the calculations nor in the ARPES data while studying the material above and below . However, we cannot fully exclude the possibility of its existence. While EuCd2As2 orders AFM with moments in the a-a plane, the magnetic moments are tilted out of plane towards the c direction in EuZn2P2. For EuCd2As2 it was shown that in-plane ferromagnetism can be induced by application of pressure [5]. In analogy, it would be interesting to study the effect of pressure or strain on EuZn2P2 where the moments are canted out of plane already at ambient pressure.
Acknowledgements.
We thank T. Förster for technical support. We acknowledge funding by the Deutsche Forschungsgemeinschaft (DFG, German Research Foundation) via the TRR 288 (422213477, projects A03, A10, B02, B08). We acknowledge SOLARIS National Synchrotron Radiation Centre for the allocation of beamtime at the UARPES beamline. We acknowledge MAX IV Laboratory for time on the Bloch Beamline under Proposal 20211066. Research conducted at MAX IV, a Swedish national user facility, is supported by the Swedish Research council under contract 2018-07152, the Swedish Governmental Agency for Innovation Systems under contract 2018-04969, and Formas under contract 2019-02496.References
- Schellenberg et al. [2011] I. Schellenberg, U. Pfannenschmidt, M. Eul, C. Schwickert, and R. Pöttgen, A 121Sb and 151Eu Mössbauer Spectroscopic Investigation of EuCd2X2 (X = P, As, Sb) and YbCd2Sb2, Zeitschrift für anorganische und allgemeine Chemie 637, 1863 (2011).
- Rahn et al. [2018] M. C. Rahn, J.-R. Soh, S. Francoual, L. S. I. Veiga, J. Strempfer, J. Mardegan, D. Y. Yan, Y. F. Guo, Y. G. Shi, and A. T. Boothroyd, Coupling of Magnetic Order and Charge Transport in the Candidate Dirac Semimetal EuCd2As2, Phys. Rev. B 97, 214422 (2018).
- Wang et al. [2016] H. P. Wang, D. S. Wu, Y. G. Shi, and N. L. Wang, Anisotropic Transport and Optical Spectroscopy Study on Antiferromagnetic Triangular Lattice : An Interplay between Magnetism and Charge Transport Properties, Phys. Rev. B 94, 045112 (2016).
- Ma et al. [2019] J.-Z. Ma, S. M. Nie, C. J. Yi, J. Jandke, T. Shang, M. Y. Yao, M. Naamneh, L. Q. Yan, Y. Sun, A. Chikina, V. N. Strocov, M. Medarde, M. Song, Y.-M. Xiong, G. Xu, W. Wulfhekel, J. Mesot, M. Reticcioli, C. Franchini, C. Mudry, M. Müller, Y. G. Shi, T. Qian, H. Ding, and M. Shi, Spin Fluctuation induced Weyl Semimetal State in the Paramagnetic Phase of EuCd2A2, Science Advances 5, eaaw4718 (2019).
- Gati et al. [2021] E. Gati, S. L. Bud’ko, L.-L. Wang, A. Valadkhani, R. Gupta, B. Kuthanazhi, L. Xiang, J. M. Wilde, A. Sapkota, Z. Guguchia, R. Khasanov, R. Valenti, and P. C. Canfield, Pressure-induced Ferromagnetism in the Topological Semimetal EuCd2As2, Phys. Rev. B 104 (2021).
- Wang et al. [2019] L.-L. Wang, N. H. Jo, B. Kuthanazhi, Y. Wu, R. J. McQueeney, A. Kaminski, and P. C. Canfield, Single Pair of Weyl Fermions in the half-metallic Semimetal , Phys. Rev. B 99, 245147 (2019).
- Soh et al. [2019] J.-R. Soh, F. de Juan, M. G. Vergniory, N. B. M. Schröter, M. C. Rahn, D. Y. Yan, J. Jiang, M. Bristow, P. Reiss, J. N. Blandy, Y. F. Guo, Y. G. Shi, T. K. Kim, A. McCollam, S. H. Simon, Y. Chen, A. I. Coldea, and A. T. Boothroyd, Ideal Weyl Semimetal induced by Magnetic Exchange, Phys. Rev. B 100, 201102 (2019).
- Wang et al. [2021] Z.-C. Wang, J. D. Rogers, X. Yao, R. Nichols, K. Atay, B. Xu, J. Franklin, I. Sochnikov, P. J. Ryan, D. Haskel, and F. Tafti, Adv. Mater. 33, 2005755 (2021).
- Sunko et al. [2023] V. Sunko, Y. Sun, M. Vranas, C. C. Homes, C. Lee, E. Donoway, Z.-C. Wang, S. Balguri, M. B. Mahendru, A. Ruiz, B. Gunn, R. Basak, S. Blanco-Canosa, E. Schierle, E. Weschke, F. Tafti, A. Frano, and J. Orenstein, Spin-carrier coupling induced ferromagnetism and giant resistivity peak in , Phys. Rev. B 107, 144404 (2023).
- Heinrich et al. [2022] E. Heinrich, T. Posske, and B. Flebus, Topological magnetic phase transition in Eu-based A-type antiferromagnets, Phys. Rev. B 106 (2022).
- Berry et al. [2022] T. Berry, V. J. Stewart, B. W. Y. Redemann, C. Lygouras, N. Varnava, D. Vanderbilt, and T. M. McQueen, Phys. Rev. B 106, 054420 (2022).
- Hwang et al. [1995] H. Y. Hwang, S.-W. Cheong, P. G. Radaelli, M. Marezio, and B. Batlogg, Lattice Effects on the Magnetoresistance in Doped LaMn, Phys. Rev. Lett. 75, 914 (1995).
- Solovyev et al. [1996] I. Solovyev, N. Hamada, and K. Terakura, Crucial Role of the Lattice Distortion in the Magnetism of , Phys. Rev. Lett. 76, 4825 (1996).
- Salamon and Jaime [2001] M. B. Salamon and M. Jaime, The Physics of Manganites: Structure and Transport, Rev. Mod. Phys. 73, 583 (2001).
- Frik and Mewis [1999] L. Frik and A. Mewis, Stapelvarianten aus SrPtSb- und CaAl2Si2-analogen Baublöcken, Zeitschrift für anorganische und allgemeine Chemie 625, 126 (1999).
- Sheldrick [2015] G. M. Sheldrick, Crystal structure refinement with SHELXL, Acta Crystallogr Sect. C. 71, 3 (2015).
- CD [2] CIF file: CD2262937, https://www.ccdc.cam.ac.uk/, accessed: 2023-05-30.
- Brookes et al. [2018] N. Brookes, F. Yakhou-Harris, K. Kummer, A. Fondacaro, J. Cezar, D. Betto, E. Velez-Fort, A. Amorese, G. Ghiringhelli, L. Braicovich, R. Barrett, G. Berruyer, F. Cianciosi, L. Eybert, P. Marion, P. van der Linden, and L. Zhang, The beamline ID32 at the ESRF for soft X-ray high energy resolution resonant inelastic X-ray scattering and polarisation dependent X-ray absorption spectroscopy, Nuclear Instruments and Methods in Physics Research Section A: Accelerators, Spectrometers, Detectors and Associated Equipment 903, 175 (2018).
- Ozaki [2003] T. Ozaki, Variationally optimized atomic orbitals for large-scale electronic structures, Phys. Rev. B 67, 155108 (2003).
- Ozaki and Kino [2004] T. Ozaki and H. Kino, Numerical atomic basis orbitals from H to Kr, Phys. Rev. B 69, 195113 (2004).
- Ozaki and Kino [2005] T. Ozaki and H. Kino, Efficient projector expansion for the ab initio LCAO method, Phys. Rev. B 72, 045121 (2005).
- Troullier and Martins [1991] N. Troullier and J. L. Martins, Efficient pseudopotentials for plane-wave calculations, Phys. Rev. B 43, 1993 (1991).
- Perdew and Wang [1992] J. P. Perdew and Y. Wang, Accurate and simple analytic representation of the electron-gas correlation energy, Phys. Rev. B 45, 13244 (1992).
- Han et al. [2006] M. J. Han, T. Ozaki, and J. Yu, O(N) LDA + U electronic structure calculation method based on the nonorthogonal pseudoatomic orbital basis, Phys. Rev. B 73, 045110 (2006).
- Dudarev et al. [1998] S. L. Dudarev, G. A. Botton, S. Y. Savrasov, C. Humphreys, and A. P. Sutton, Electron-energy-loss spectra and the structural stability of nickel oxide: An LSDA + U study, Phys. Rev. B 57, 1505 (1998).
- Dressel and Grüner [2002] M. Dressel and G. Grüner, Electrodynamics of Solids: Optical Properties of Electrons in Matter (Cambridge University Press, Cambridge New York Melbourne, 2002).
- Sedlmeier et al. [2012] K. Sedlmeier, S. Elsässer, D. Neubauer, R. Beyer, D. Wu, T. Ivek, S. Tomić, J. A. Schlueter, and M. Dressel, Absence of Charge Order in the Dimerized -phase BEDT-TTF Salts, Phys. Rev. B 86, 245103 (2012).
- Jellison and Modine [1996a] G. E. Jellison and F. A. Modine, Parameterization of the Optical Functions of Amorphous Materials in the Interband Region, Appl. Phys. Lett. 69, 371 (1996a).
- Jellison and Modine [1996b] G. E. Jellison and F. A. Modine, Erratum: Parameterization of the optical functions of amorphous materials in the interband region Appl. Phys. Lett. 69 , 371 (1996), Appl. Phys. Lett. 69, 2137 (1996b).
- Lundstrom [2000] M. S. Lundstrom, Fundamentals of Carrier Transport, 2nd ed. (Cambridge University Press, Cambridge New York, 2000).
- Methfessel and Mattis [1968] S. Methfessel and D. Mattis, Handbuch der Physik (Springer, Berlin, 1968).
- P. et al. [1997] R. A. P., R. J. Cava, and J. Krajewski, Colossal magnetoresistance in Cr-based chalcogenide spinels, Nature 386, 156 (1997).
- Tokura and Tomioka [1999] Y. Tokura and Y. Tomioka, Colossal magnetoresistive Manganites, J. Magn. Magn. Mater. 200, 1 (1999).
- Dagotto et al. [2001] E. Dagotto, T. Hotta, and A. Moreo, Colossal magnetoresistant materials: the key role of phase separation, Physics Reports 344, 1 (2001).
- Tokura [2006] Y. Tokura, Critical features of colossal magnetoresistive manganites, Reports on Progress in Physics 69, 797 (2006).
- Lin et al. [2016] C. Lin, C. Yi, Y. Shi, L. Zhang, G. Zhang, J. Müller, and Y. Li, Spin correlations and colossal magnetoresistance in , Phys. Rev. B 94, 224404 (2016).
- Rosa et al. [2020] P. Rosa, Y. Xu, M. Rahn, J. Souza, S. Kushwaha, L. Veiga, A. Bombardi, S. Thomas, M. Janoschek, E. Bauer, M. Chan, Z. Wang, J. Thompson, N. Harrison, P. Pagliuso, A. Bernevig, and F. Ronning, Colossal magnetoresistance in a nonsymmorphic antiferromagnetic insulator, npj Quantum Materials 5, 52 (2020).
- Ale Crivillero et al. [2023] M. V. Ale Crivillero, S. Rößler, S. Granovsky, M. Doerr, M. S. Cook, P. F. S. Rosa, J. Müller, and S. Wirth, Magnetic and Electronic Properties unveil Polaron Formation in Eu5In2Sb6, Scientific Reports 13, 1597 (2023).
- Das et al. [2012] P. Das, A. Amyan, J. Brandenburg, J. Müller, P. Xiong, S. von Molnár, and Z. Fisk, Magnetically driven electronic phase separation in the semimetallic ferromagnet EuB6, Phys. Rev. B 86, 184425 (2012).
- Manna et al. [2014] R. S. Manna, P. Das, M. de Souza, F. Schnelle, M. Lang, J. Müller, S. von Molnár, and Z. Fisk, Lattice Strain Accompanying the Colossal Magnetoresistance Effect in , Phys. Rev. Lett. 113, 067202 (2014).
- Kliemt et al. [2017] K. Kliemt, M. Hofmann-Kliemt, K. Kummer, F. Yakhou-Harris, C. Krellner, and C. Geibel, GdRh2Si2: An exemplary tetragonal system for antiferromagnetic order with weak in-plane anisotropy, Phys. Rev. B 95, 134403 (2017).
- Hill and McMorrow [1996] J. P. Hill and D. F. McMorrow, Resonant Exchange Scattering: Polarization Dependence and Correlation Function, Acta Crystallographica Section A 52, 236 (1996).
- Ma et al. [2020] J. Ma, H. Wang, S. Nie, C. Yi, Y. Xu, H. Li, J. Jandke, W. Wulfhekel, Y. Huang, D. West, P. Richard, A. Chikina, V. N. Strocov, J. Mesot, H. Weng, S. Zhang, Y. Shi, T. Qian, M. Shi, and H. Ding, Emergence of Nontrivial Low-Energy Dirac Fermions in Antiferromagnetic EuCd2As2, Adv. Mater. 32, 1907565 (2020).
- Fedorov et al. [2021] A. V. Fedorov, G. Poelchen, S. V. Eremeev, S. Schulz, A. Generalov, C. Polley, C. Laubschat, K. Kliemt, N. Kaya, C. Krellner, E. V. Chulkov, K. Kummer, D. Y. Usachov, A. Ernst, and D. V. Vyalikh, Insight into the Temperature Evolution of Electronic Structure and Mechanism of Exchange Interaction in EuS, J. Phys. Chem. 12, 8328 (2021).
- Homes et al. [2023] C. C. Homes, Z.-C. Wang, K. Fruhling, and F. Tafti, Optical properties and carrier localization in the layered phosphide , Phys. Rev. B 107, 045106 (2023).
- Kirchner-Hall et al. [2021] N. E. Kirchner-Hall, W. Zhao, Y. Xiong, I. Timrov, and I. Dabo, Extensive Benchmarking of DFT + Calculations for Predicting Band Gaps, Appl. Sci. 11, 2395 (2021).
- Blawat et al. [2022] J. Blawat, M. Marshall, J. Singleton, E. Feng, H. Cao, W. Xie, and R. Jin, Unusual electrical and magnetic properties in layered EuZn2As2, Advanced Quantum Technologies 5, 2200012 (2022).
- Weber et al. [2006] F. Weber, A. Cosceev, S. Drobnik, A. Faißt, K. Grube, A. Nateprov, C. Pfleiderer, M. Uhlarz, and H. v. Löhneysen, Low-temperature properties and magnetic order of , Phys. Rev. B 73, 014427 (2006).
- Anderson [2019] W. W. Anderson, An analytic Expression approximating the Debye Heat Capacity Function, AIP Advances 9, 075108 (2019).
Appendix
Appendix S1 Heat capacity
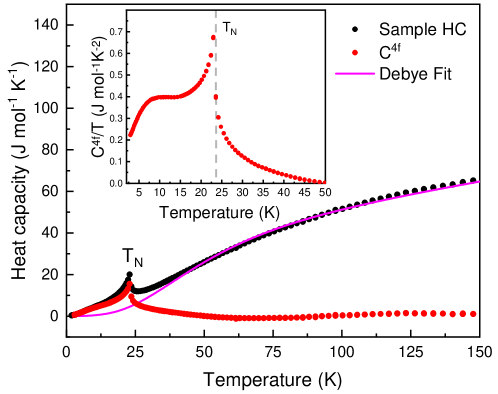
The heat capacity of EuZn2P2 was measured between , Fig. S1. It shows a sharp -type anomaly at the antiferromagnetic phase transition and is consistent with the data presented in [11]. In order to subtract the phonon contribution at high temperatures, we fitted the data with a two-temperature Debye model with and [49].
Appendix S2 Electrical transport
The inflection point of the MR vs. T curves marking the crossover to large suppression of the resistivity by magnetic fields is shown in Fig. S2. For fields T the MR upon approaching amount to more than %. For rather large fields T the crossover temperature tends to saturate at about two times .
Appendix S3 Temperature dependence of the susceptibility
The bulk magnetic susceptibility of EuZn2P2 measured at different magnetic fields is shown in Fig. S3. For all three main symmetry directions the antiferromagnetic phase transition occurs at for low magnetic fields. For high magnetic fields, the transition temperature shifts towards lower values.
Appendix S4 Field dependence of the magnetization
The field-dependent magnetization measured at different temperatures shows that the magnetization saturates at per Eu ion for all applied field directions, which is consistent with the divalent Eu2+ configuration. However, the critical fields for saturation differ depending on the crystallographic direction. At for the direction, a larger field of has to be applied to fully polarize the magnetic moments, see Fig. S3(b). For the in-plane directions a magnetic field of only is necessary, see Figs. S3(c,d). The respective magnetic phase diagrams for all directions are shown in Fig. S4.
Appendix S5 EuZn2P2: Domain effects
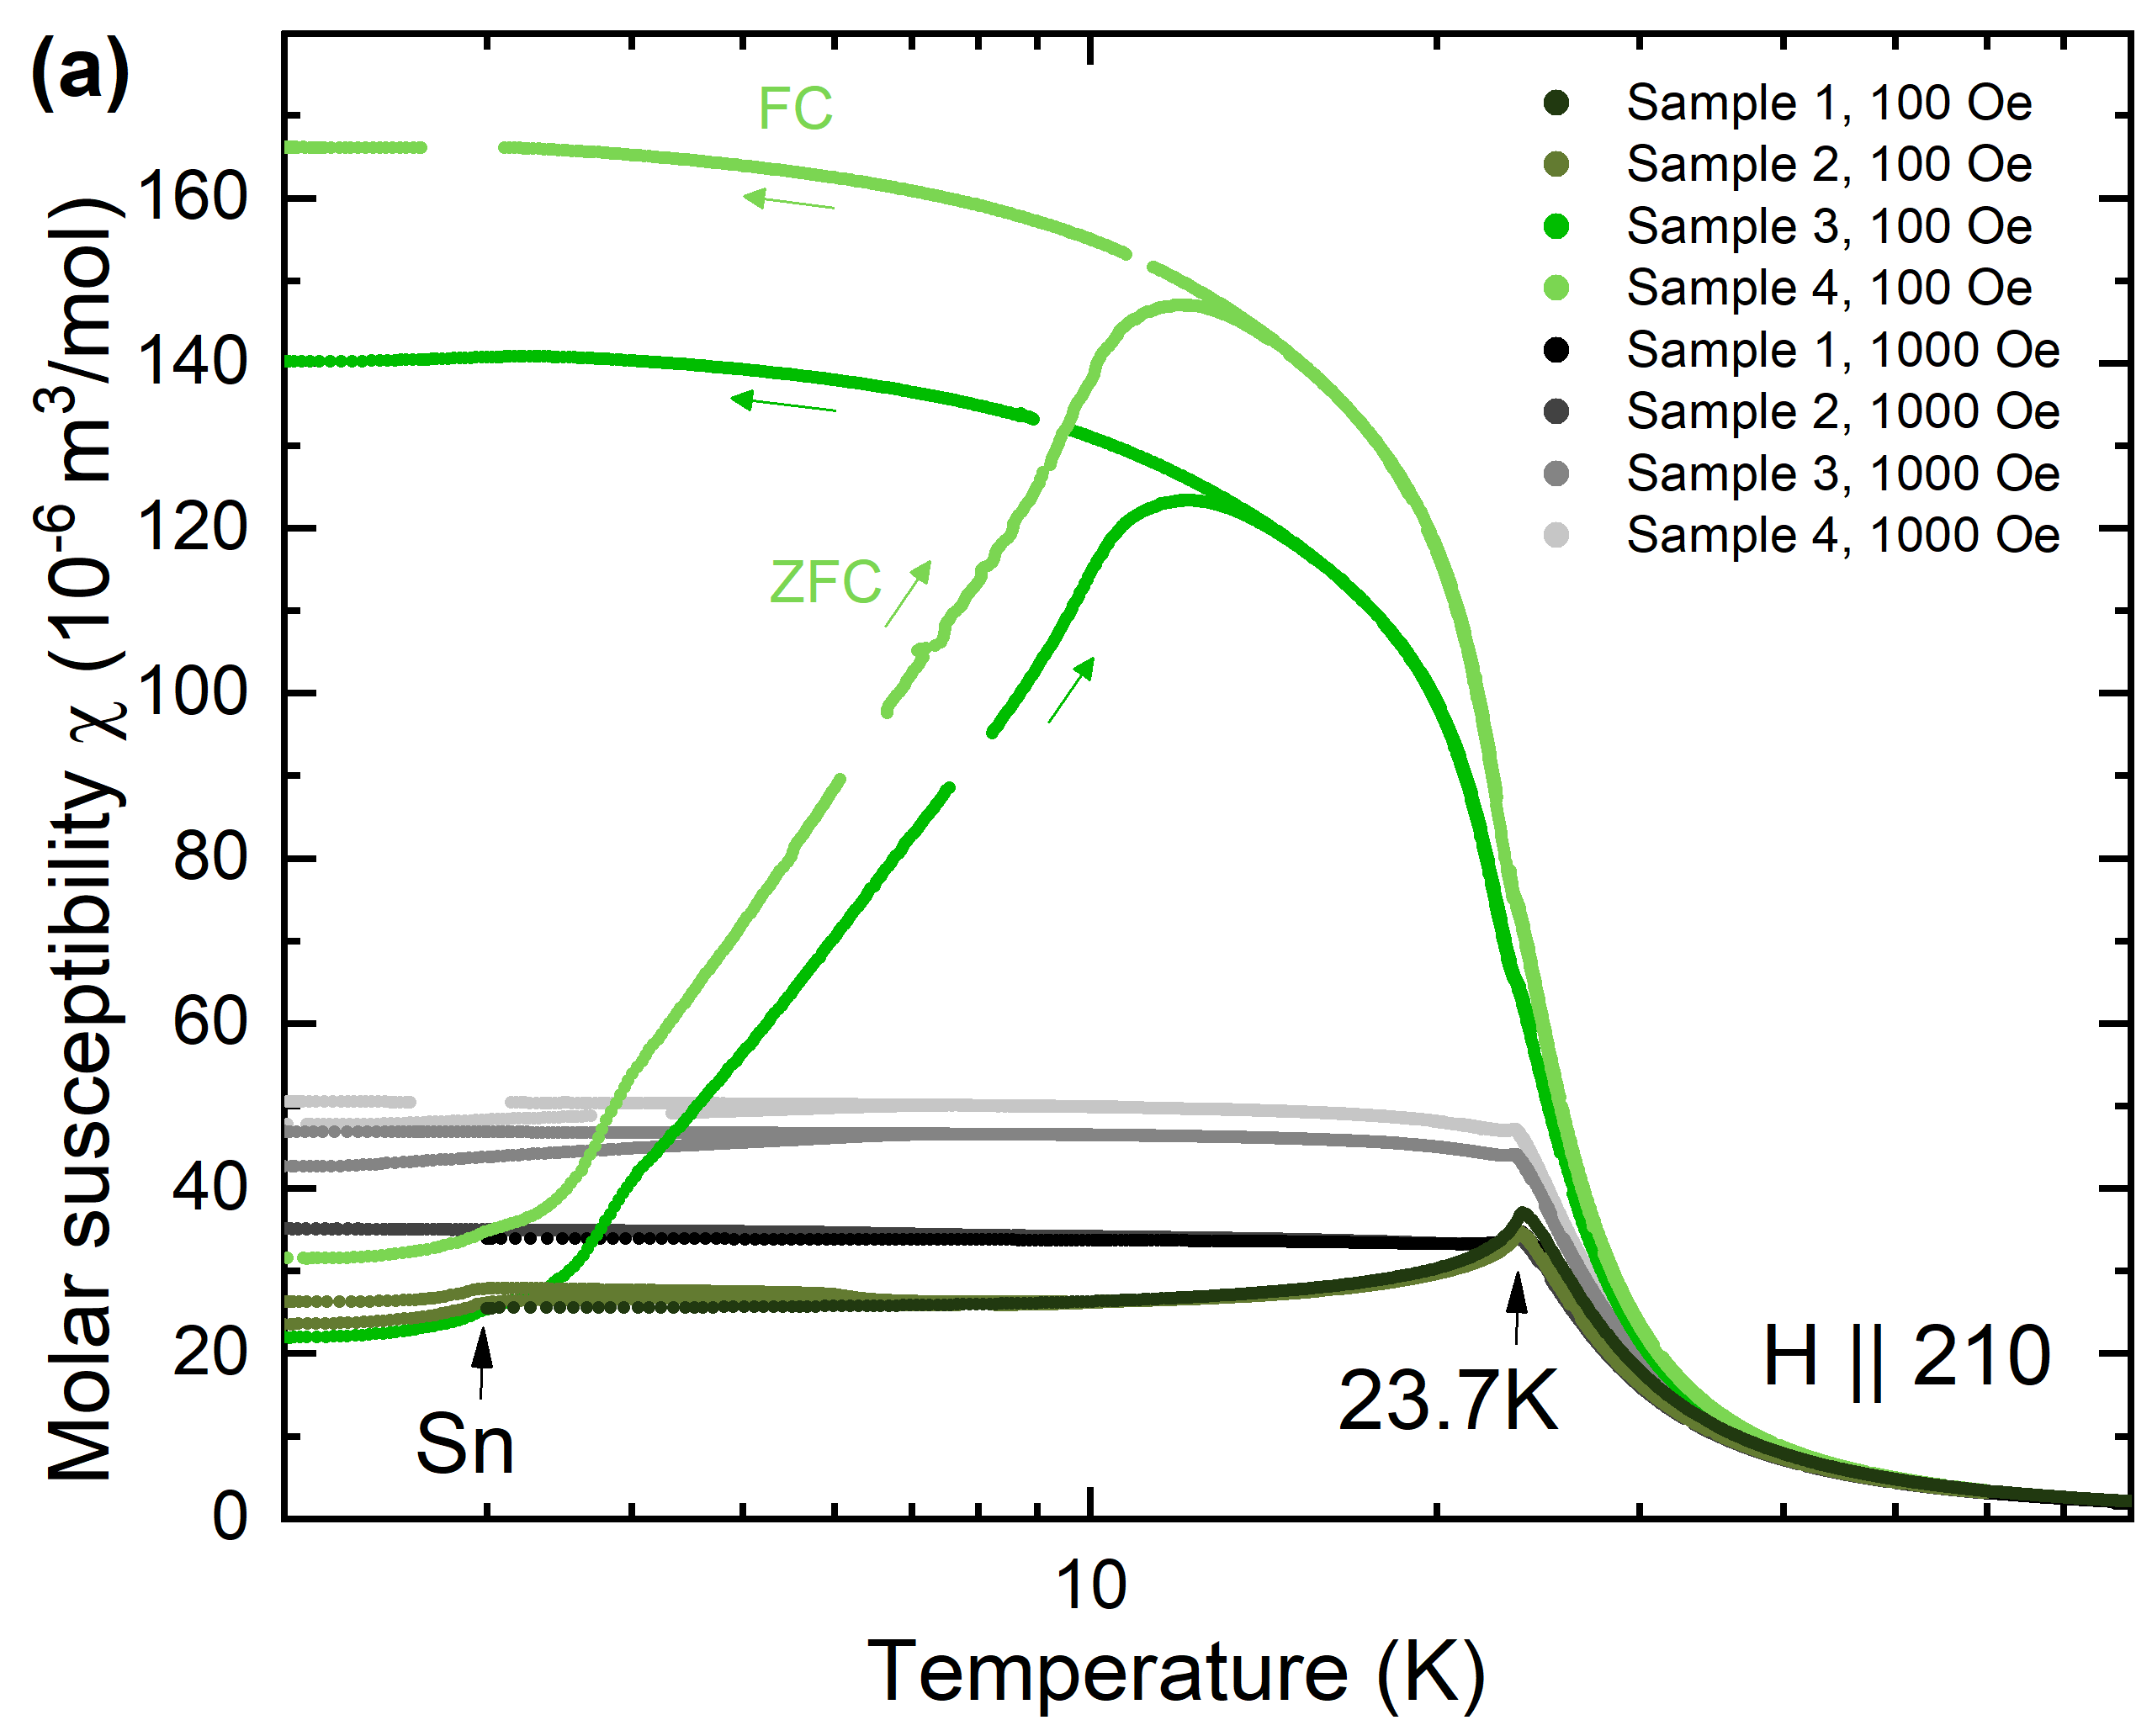
As shown in Fig. S5(a,b), the magnetic susceptibility measured at (green), (grey) and the field dependence of the magnetization show a sample dependency. The different behavior of the individual samples is probably caused by the presence of different antiferromagnetic domains.
Appendix S6 Structural characterization
The stoichiometric composition of EuZn2P2 was confirmed using energy dispersive X-ray spectroscopy (see Fig. S6). The crystal orientation was determined by Laue diffraction. Fig. 1b) shows the Laue pattern recorded with x-ray beam parallel to the crystallographic [001]-direction and Fig. S7 the pattern with beam parallel to the [210]-direction.