Also at ]University of Chinese Academy of Sciences
Update of hadronic decays of and though virtual photons
Abstract
The hadronic decay branching ratios of and through virtual photons are updated by using the latest published measurements of the value and the branching ratios of . The precision in and improve by factors of 4 and 3, respectively.
The and , states of charmonium have extremely small width. The reason is usually referred to by the phenomenological Okubo-Zweig-Iizuka rule, which states that processes in which the initial quark pairs cannot appear as part of the final state particles are suppressed. Therefore, the only decays through virtual photons (vacuum polarization), three gluons, two gluons plus a single photon, or into via M1 transition and three photons. The determination of the partial widths could play an important role in understanding the nature of decays. The hadronic final state through virtual photons and gluons is indistinguishable. Fortunately, the branching ratios can be calculated using the relation from Ref. [1]
| (1) |
where assumes that the ratios of the cross sections for virtual photons decaying to hadrons and leptons, denoted as and respectively, are the same for both electron-positron and annihilations. This relationship also holds for the decay of .
The best published determinations on are from 2004 and were determined by Seth [2]:
| (2) |
| (3) |
The value used in this result was .
Recently, more precise results for the value and became available. The KEDR experiment measured the value between 1.84 and 3.05 GeV [3] and between 1.84 and 3.72 GeV [4, 5]. The BESII measured the value at energy points of 3.650, 3.6648 and 3.773 GeV [6], between 3.650 and 3.872 GeV [7], and at 2.60, 3.07 and 3.65 GeV [8]. The newest measurements by BESIII range from 2.2324 to 3.6710 GeV [9].
In the studies of , the most recent and the most precise results were published by CLEO and BESIII, which reached relative precision of 0.6% and 2.1%, respectively. Reasons for these improvements are better detectors, larger data samples, and carefully studied systematic uncertainties. By combining all available results [10], the precisions on and improved by factors of 4 and 2.5, respectively, as shown in Table 1.
| PDG 2002 (%) | Average (%) | Relative uncertainty (%) | PDG 2022 (%) | Average (%) | Relative uncertainty (%) | |
|---|---|---|---|---|---|---|
| (5.930.10) | (5.900.09) | 1.6 | (5.9710.032) | (5.9670.023) | 0.4 | |
| (5.880.10) | (5.9610.033) | |||||
| (0.730.04) | (0.730.04) | 5.5 | (0.7930.017) | (0.7940.017) | 2.2 | |
| (0.700.09) | (0.800.06) |
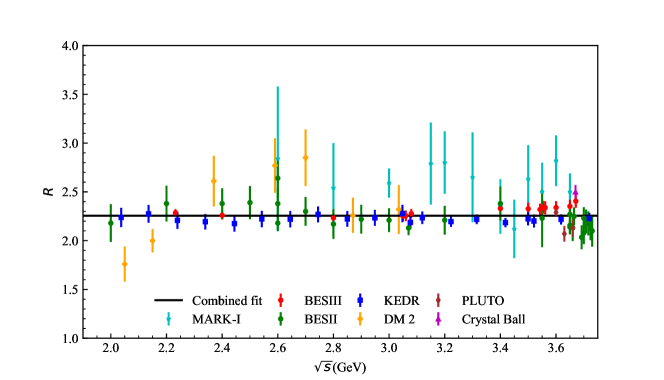
The values between 2.0 and 3.73 GeV are used to approximate the ones at and peaks, as shown in Fig. 1. The results of the scans used in this study are from the MARK-I, the DM 2, the BESII, the KEDR, the BESIII, etc. It can be seen that the precision of values has improved significantly in the last decades, benefiting from better detectors, increasing data samples, and precise knowledge of initial state radiation correction and systematic uncertainties.
Various combinations of the existing measurements of the value are tested to determine the . The results are summarized in Table. 2. It can be seen clearly that the BESII, the KEDR, and the BESIII can achieve comparable precision, and all three are better than the one used in Ref. [2]. It should be noted that the BESII published new measurements of the value in 2006 [6, 7] and 2009 [8] after the publication of Ref [2]. The precision reaches 0.4% if all the results are combined, which is going to be used in the following calculations.
| Relative uncertainty | ||
|---|---|---|
| MARK-I | 3.1% | |
| DM 2 | 3.3% | |
| BESII | 1.0% | |
| KEDR | 0.7% | |
| BESIII | 0.6% | |
| Combined fit | 0.4% | |
| Ref. [2] | 1.8% |
The branching ratios are calculated using equation (1) and the combined fit result on from Table 2. The results in
and
are compared to the previous results in Table 3. Benefiting from the improved precision of the values and , the relative uncertainties are reduced significantly. The and are improved by about 4 times and 3 times, respectively. But it should be noted that the correlations among R values within a single experiment are neglected, as well as the correlation between the branching ratios for and .
| Channel | Ref. [2] | This study | Relative uncertainty |
|---|---|---|---|
| (13.50.3)% | (13.460.07)% | 2.2%0.5% | |
| (1.660.10)% | (1.790.04)% | 6.1%2.1% |
The update on will help to constrain branching ratios and enhance our understanding of the two charmonia. Taking the as an example, two important aspects arise. Firstly, can be utilized to test the theoretical calculation presented in equation (8) of Ref. [1], including its higher-order corrections. Secondly, it enables the calculation of branching ratios such as and the relative fractions of , , , and , in conjunction with , . Notably, the precision of the ratio introduces the dominant uncertainty, emphasizing the need for future updates to improve its precision.
References
- L. Köpke and N. Wermes [1989] L. Köpke and N. Wermes, J/psi decays, Phys. Rep. 174, 67 (1989).
- Seth [2004] K. K. Seth, Hadronic decays of and through virtual photons, Phys. Rev. D 69, 097503 (2004).
- Anashin et al. [2017] V. V. Anashin et al., Measurement of between 1.84 and 3.05 GeV at the KEDR detector, Phys. Lett. B 770, 174 (2017).
- Anashin et al. [2016] V. V. Anashin et al., Measurement of and between 3.12 and 3.72 GeV at the KEDR detector, Phys. Lett. B 753, 533 (2016).
- Anashin et al. [2019] V. V. Anashin et al. (KEDR Collaboration), Precise measurement of and between 1.84 and 3.72 GeV at the KEDR detector, Phys. Lett. B 788, 42 (2019).
- Ablikim et al. [2006a] M. Ablikim et al. (BES Collaboration), Measurements of the cross-sections for hadrons at 3.650 GeV, 3.6648 GeV, 3.773 GeV and the branching fraction for , Phys. Lett. B 641, 145 (2006a).
- Ablikim et al. [2006b] M. Ablikim et al., Measurements of the Continuum and Values in Annihilation in the Energy Region Between 3.650 and 3.872 GeV, Phys. Rev. Lett. 97, 262001 (2006b).
- Ablikim et al. [2009] M. Ablikim et al. (BES Collaboration), R value measurements for annihilation at 2.60, 3.07 and 3.65 GeV, Phys. Lett. B 677, 239 (2009).
- Ablikim et al. [2022] M. Ablikim et al. (BESIII Collaboration), Measurement of the Cross Section for Hadrons at Energies from 2.2324 to 3.6710 GeV, Phys. Rev. Lett. 128, 062004 (2022).
- Workman et al. [2022] R. L. Workman et al. (Particle Data Group), Review of particle physics, Prog. Theor. Exp. Phys. 2022, 083C01 (2022).
- Hagiwara et al. [2002] K. Hagiwara et al. (Particle Data Group), Review of particle physics, Phys. Rev. D 66, 010001 (2002).
- Bai et al. [2000] J. Z. Bai et al. (BES Collaboration), Measurement of the Total Cross-Section for Hadronic Production by Annihilation at Energies Between 2.6-5 GeV, Phys. Rev. Lett. 84, 594 (2000).
- Bai et al. [2002] J. Z. Bai et al. (BES Collaboration), Measurements of the Cross-Section for Hadrons at Center-of-Mass Energies from 2 to 5 GeV, Phys. Rev. Lett. 88, 101802 (2002).
- Siegrist et al. [1982] J. Siegrist et al., Hadron production by annihilation at center-of-mass energies between 2.6 and 7.8 GeV. I. Total cross-section, multiplicities and inclusive momentum distributions, Phys. Rev. D 26, 969 (1982).
- Bacci et al. [1979] C. Bacci et al., Total cross-section for hadronic production by annihilation in the total cm energy range 1.42-3.09 GeV, Phys. Lett. B 86, 234 (1979).
- Crigee and Knies [1982] L. Crigee and G. Knies, physics with the PLUTO detector, Phys. Rep. 83, 151 (1982).
- [17] A. Osterheld et al., Measurements of total hadronic and inclusive cross-sections in annihilations between 3.87 GeV and 4.5 GeV, SLAC Report No. SLAC-PUB-4160, 1986 .