FRB 20210405I: a nearby Fast Radio Burst localised to sub-arcsecond precision with MeerKAT
Abstract
We present the first sub-arcsecond localised Fast Radio Burst (FRB) detected using MeerKAT. FRB 20210405I was detected in the incoherent beam using the MeerTRAP pipeline on 2021 April 05 with a signal to noise ratio of 140.8 and a dispersion measure of 565.17 pc cm-3. It was detected while MeerTRAP was observing commensally with the ThunderKAT large survey project, and was sufficiently bright that we could use the ThunderKAT 8s images to localise the FRB. Two different models of the dispersion measure in the Milky Way and halo suggest that the source is either right at the edge of the Galaxy, or outside. This highlights the uncertainty in the Milky Way dispersion measure models, particularly in the Galactic Plane, and the uncertainty of Milky Way halo models. Further investigation and modelling of these uncertainties will be facilitated by future detections and localisations of nearby FRBs. We use the combined localisation, dispersion measure, scattering, specific luminosity and chance coincidence probability information to find that the origin is most likely extra-galactic and identify the likely host galaxy of the FRB: 2MASS J17012494932475. Using SALT spectroscopy and archival observations of the field, we find that the host is a disk/spiral galaxy at a redshift of .
keywords:
transients: fast radio bursts – radio continuum: galaxies – radio continuum: transients1 Introduction
Fast radio bursts (FRBs) are short, bright, coherent radio transients with durations on the order of milliseconds (see e.g. Cordes & Chatterjee, 2019; Petroff et al., 2019, 2022; Caleb & Keane, 2021; Chatterjee, 2021, for recent reviews). Most FRBs are observed as one-off events, though some are observed to repeat. Due to their transient nature and short duration, localising one-off events to less than a few arcseconds remains a challenge.
The first FRB to be localised, FRB 20121102A, was a repeater. This repeating nature allowed it to ultimately be localised to 01 (Chatterjee et al., 2017; Marcote et al., 2017) and associated it with a faint, continuum radio source which exhibits flux variability of tens of percent on day timescales. Tendulkar et al. (2017) imaged the position of the FRB with the Gemini North telescope, revealing a dwarf galaxy at a redshift of z=0.19273(8). This galaxy has a low metallicity and shows no signs of AGN activity. Very long baseline interferometry (VLBI) follow-up observations with milli-arcsecond resolution revealed a project linear separation of pc between the source of the FRBs and the persistent continuum radio source with the latter having a projected size of pc (Marcote et al., 2017). All together, the observations suggest that the source of the FRBs could be associated with a low-luminosity active galactic nucleus or a young neutron star powering a supernova remnant (Chatterjee et al., 2017; Marcote et al., 2017). The case of FRB 20121102A demonstrates how important localisation is for identifying host galaxies and unveiling local environments, ultimately shedding light on the physical processes leading to the burst production.
With the advent of intereferometeric searches, FRBs are now almost routinely being localised upon discovery without having to rely on repeaters for precise localisation. There were 800 published FRBs in the Supernova Working Group Transient Name Server111https://www.wis-tns.org/ (TNS) at the time of writing, of which 57 are known repeaters. Presently, 27 FRBs have been conclusively localised to a host galaxy. Nineteen of these FRBs (Bhandari et al., 2022; Bannister et al., 2019; Prochaska et al., 2019; Macquart et al., 2020; Heintz et al., 2020; Bhandari et al., 2020; James et al., 2022b; Ryder et al., 2023; Bhandari et al., 2023; Gordon et al., 2023) were detected and localised using the Australian Square Kilometre Array Pathfinder (ASKAP; Hotan et al., 2021), four (Chatterjee et al., 2017; Law et al., 2020; Niu et al., 2022; Luo et al., 2020) have been localised using the Karl G. Jansky Very Large Array (VLA; Perley et al., 2011), two (Bhardwaj et al., 2021; Kirsten et al., 2022; Marcote et al., 2021; Nimmo et al., 2022b) have been localised using Very Long Basline Interferometry (VLBI) both using the European VLBI network (EVN; Marcote et al., 2020), one has been localised using the Deep Synoptic Array 10-dish (DSA-10) prototype (Ravi et al., 2019), and one (Ravi, 2023) has been localised with the DSA-110 prototype. Seven of the 27 localised FRBs are repeaters. Upon investigating the global properties of a sample of FRB host galaxies, Bhandari et al. (2022) and Gordon et al. (2023) found no significant difference between the host galaxies of repeating and non-repeating FRBs.
Localisation reveals important information about FRBs and their hosts, and gives us clues about their progenitors and immediate environments. Some progenitor models for FRB 20121102A include a young neutron star in a compact supernova remnant or a neutron star near the accretion torus of a black hole (Chatterjee et al., 2017; Michilli et al., 2018; Zhang, 2018). The localisation of the repeating FRB 20200120E (Kirsten et al., 2022) to a globular cluster in the M81 galactic system requires an unusual magnetar progenitor model for FRBs as globular clusters consist of older stars, not the young population expected for magnetars. If we can determine the position of an FRB progenitor, we can also determine if the FRB passed through the halo of an intervening galaxy. Prochaska et al. (2019) used one such event FRB to constrain the halo gas density, magnetisation and turbulence of the intervening galaxy. Macquart et al. (2020) demonstrated that a large sample of arcsecond-localised FRBs can be used to directly measure the baryons in the Universe.
MeerKAT (Camilo et al., 2018) is an interferometer in the Karoo region of South Africa. It consists of 6413.5 m dishes and has baselines up to 8 km, resulting in a field of view (FoV) of 1 square degree and resolution of better than at 1400 MHz. MeerKAT currently has two receivers installed, the L-band receiver (856-1712 MHz) and the UHF receiver (580-1015 MHz) and can observe in modes with 1024, 4096, or 32,000 channels.
The Meer(more) TRAnsients and Pulsars (MeerTRAP; Sanidas et al., 2018; Bezuidenhout et al., 2022; Jankowski et al., 2022; Rajwade et al., 2022) project at the MeerKAT telescope undertakes fully commensal, high time resolution radio transient searches simultaneously with all of the ongoing MeerKAT Large Survey Projects (LSPs).
ThunderKAT (Fender et al., 2016) is the MeerKAT LSP searching for, and investigating, radio transient and variable sources in the image-plane. ThunderKAT observes and monitors known variable radio sources such as X-ray binary systems (e.g. Russell et al., 2019; Bright et al., 2020; Williams et al., 2020; van den Eijnden et al., 2022), follows up sources that were initially detected at other wavelengths (Rhodes et al., 2020; Hewitt et al., 2020; Driessen et al., 2022b), and performs untargeted searches for transient and variable sources in the FoV of MeerKAT image-plane observations (Driessen et al., 2020, 2022a; Andersson et al., 2022; Rowlinson et al., 2022).
In this paper we present the detection and localisation of FRB 20210405I the first sub-arcsecond localisation of an FRB using MeerKAT. In Section 2 we describe the MeerTRAP and ThunderKAT radio observations. In Section 3 we present the detection and properties of FRB 20210405I. In Sections 5 and 6 we summarise and conclude.
2 Radio observations
2.1 MeerTRAP pipeline
For the observations presented in this paper, MeerKAT was observing at an L-band centre frequency of 1284 MHz with a usable bandwidth of MHz. Single pulses are searched for simultaneously in incoherent and coherent modes using the MeerTRAP backend. In the coherent mode, the voltages from the inner 40–44 dishes of the -km core of the array are coherently combined to 764 coherent beams (CBs) on sky with a total FoV of deg2. A CB typically has a FWHM of but can vary in size depending on the elevation of the telescope at the time of observation. In the incoherent mode the intensities of all the available 64 MeerKAT dishes are summed to create a less sensitive incoherent beam (IB) but with a much wider FoV of deg2. The CBs typically tile the IB with beams touching where the sensitivity is 25% of the peak CB sensitivity.
The output data stream of the F-engine are captured, delay corrected, phased and channelised before being sent over the network to the beamforming User Supplied Equipment (FBFUSE) that was designed and developed at the Max Planck Institute for Radio Astronomy in Bonn. Typically, for L-band observations FBFUSE combines the data into 764 total-intensity tied-array beams. The data are then captured at 306.24 s time resolution by the Transient User Supplied Equipment (TUSE), a real-time transient detection backend instrument developed by the MeerTRAP team at the University of Manchester. The GPU-based single pulse search pipeline AstroAccelerate222https://github.com/AstroAccelerateOrg/astro-accelerate (Armour et al., 2012; Adámek & Armour, 2020) is used to search for bursts in real-time after incoherently de-dispersing the data in the DM range 0–5118.4 pc cm-3 (see Caleb et al., 2020, for more details).
2.2 ThunderKAT imaging
The ThunderKAT observations presented here are targeted observations of the low-mass X-ray binary GX 3394. ThunderKAT has been observing this source on a weekly cadence since September 2018 and will continue to do so until August 2023 (Tremou et al., 2020). The high cadence and length of the monitoring campaign make this an excellent field for performing comemensal searches for variable and transient sources (Driessen et al., 2020, 2022a).
The ThunderKAT GX 3394 observations are taken using the MeerKAT L-band receivers in full-polarisation mode. The shortest integration time available for most imaging observations is 8 s. The L-band receivers have a bandwidth of 856 MHz with a central frequency of 1284 MHz. The bandpass and flux calibrator, PKS J1934638, is observed for 5 min at the start of the observing block and the phase calibrator, PMN J, is observed for 2 min before and after the target scan. The target is typically observed for 10 min.
The imaging data were processed using standard methods including flagging with AOFlagger333https://sourceforge.net/projects/aoflagger/ (Offringa, 2010; Offringa et al., 2012) and calibration, including phase correction, antenna delays and band-pass corrections, using the Common Astronomy Software Application444https://casa.nrao.edu/ (CASA; McMullin et al., 2007). Further details on the processing methods can be found in Driessen et al. (2020) and Tremou et al. (2020).
In order to image as well as possible over short time intervals, we produced an image mask using a deep, combined MeerKAT image of the GX 3394 field made by jointly imaging the visibilities with DDFacet (Tasse et al., 2018) from 8 epochs (a commissioning observation from April 2018 and the weekly epochs from September and October 2018) for a total integration time of 3.63 hours. The data were then imaged with WSClean (Offringa et al., 2014) utilising the image mask. Images of the single epoch, full integration time as well as the shortest integration time (8 s), were made. We included multi-scale cleaning, a Briggs robust weight of (Briggs, 1995) and three -projection plane layers. To maximise the signal-to-noise ratio (S/N) we performed a multi-frequency synthesis (MFS) clean using 8 frequency channels and a 4th order spectral polynomial fit. We also produced subband images by removing the spectral fit and MFS imaging parameters, resulting in 8 subband images with central frequencies: 909, 1016, 1123, 1230, 1337, 1444, 1551, 1658 MHz. We then primary beam corrected the sub-band images by dividing them by primary beam models.
Searching for variables and transients in ThunderKAT images was performed using the the LOFAR Transients Pipeline (TraP, Release 4.0; Swinbank et al., 2015). The TraP is software designed with LOFAR555The transients key project: https://transientskp.org/ specifically in mind. It extracts light curves for radio sources from a time series of fits images. We used the default TraP parameters666The default settings for the pipeline configuration and job configuration files can be found in the TraP documentation. with some small adjustments. We forced the TraP to search for sources consistent with the Gaussian synthesised beam shape and required that sources be separated by three beamwidths to be considered unique. In other work searching for variable sources in this field (see Driessen et al., 2022a) we manually identified resolved sources and artefacts. We removed these sources in our analysis777See https://github.com/AstroLaura/MeerKAT_LightCurve_Analysis for the code for extracting the source information from TraP..
We searched for interesting sources in the TraP light curves using three variability parameters: , , and . The parameter is based on the reduced statistic, where the model light curve assumes that the flux density is constant:
| (1) | |||||
where N is the number of measurements, is the flux density for epoch i, is the mean flux density and is the weight ( where are the uncertainties). We therefore expect a constant source to have a close to one. The parameter is the standard deviation of the light curve divided by the mean of the light curve and as such measures the spread of the flux density measurements. The parameter is based on the median and the median absolute deviation (MAD) of the light curve where the MAD is given by:
| (2) |
where is the median flux density. The value is then calculated using:
| (3) |
and the value is the resulting maximum value of the set . A high indicates a short, bright outburst and is useful for detecting transients.
2.2.1 Absolute astrometry
We corrected the absolute astrometry of the radio sources in the GX 3394 field using the method described in Driessen et al. (2022a). We used the Python Blob Detector and Source Finder888https://www.astron.nl/citt/pybdsf/ (pyBDSF) to determine the positions of sources in an image, which we used to determine and correct the accuracy of our absolute astrometry. We used Australian Telescope Compact Array (ATCA) Parkes-MIT-NRAO (PMN) sources (ATPMN; McConnell et al., 2012) within the MeerKAT FoV to correct the astrometry. The ATPMN survey has a median absolute astrometric uncertainty of 04 in both Right Ascension (RA) and Declination (Dec) when compared to the Long Baseline Array (LBA) Calibrator Survey (LCS1; Petrov et al., 2011) and the International Celestial Reference Frame (ICRF; Ma et al., 1998). Both LCS1 and ICRF use the International Celestial Reference System (ICRS).
To determine our astrometric accuracy, we solved for a transformation matrix, to shift and rotate the MeerKAT sources to match the positions of the ATPMN sources999The code for performing the astrometric corrections can be found on GitHub: https://github.com/AstroLaura/MeerKAT_Source_Matching. If represents the uncorrected coordinates and represents the corrected coordinates, then we are solving for :
| (4) | ||||
| (5) |
where is an affine transformation matrix that includes scale, shear and translation.
We then applied to the coordinates of all sources in the field. In the case of the 8 s integration images, we determined the astrometric correction for the full integration (usually 10 min) image and applied that correction to the 8 s slices.
3 FRB 20210405I
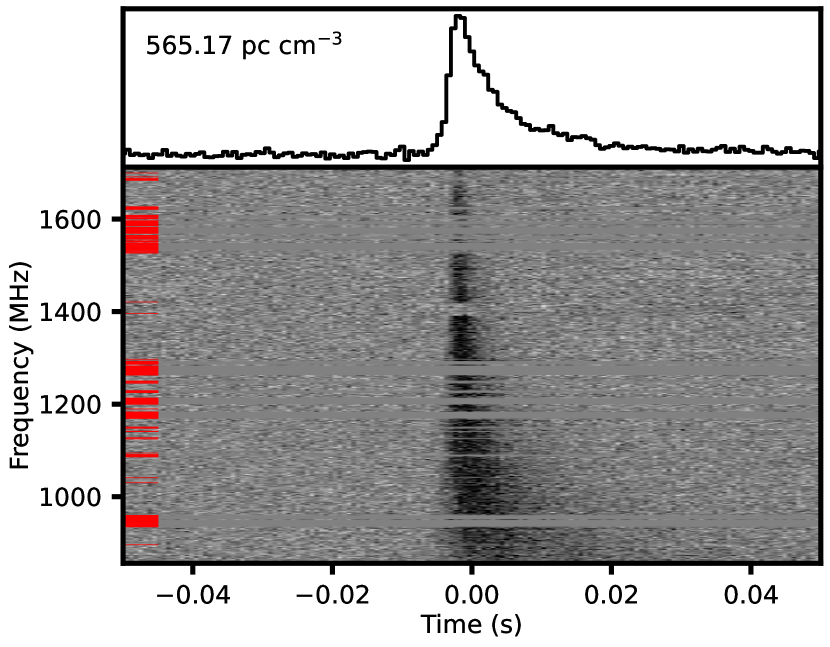
FRB 20210405I was detected while MeerTRAP was observing commensally with ThunderKAT during an observation of GX 3394 on 2021 April 05 at 04:14:40 UTC. The pulse, shown in Figure 1, was extremely bright, and was detected by the MeerTRAP real-time transient pipeline in the IB as well as several hundred CBs, implying a nearby origin. The pulse was brightest in the IB, and we obtain an optimized S/N of 140.8 corresponding to a S/N-maximising DM of 566.43 pc cm-3 using the mtcutils101010https://bitbucket.org/vmorello/mtcutils/ package or a scattering-corrected DM of 565.17 pc cm-3. The scattering-corrected DM is the DM which gives the minimum pulse width when scattering, intrinsic width and dispersion measure smearing has been accounted for. The expected Galactic DM contribution is pc cm-3 using the ymw16 Galactic free-electron model (Yao et al., 2017) or pc cm-3 using the ne2001 Galactic free-electron model (Cordes & Lazio, 2002). We assume a conservative halo DM contribution of pc cm-3 (with a 40 per cent uncertainty) as the source is close to the Galactic plane (Yamasaki & Totani, 2020). Here we will present the properties of FRB 20210405I, with a summary shown in Table 1.
| FRB | ||
|---|---|---|
| Parameter | Unit | |
| Measured | ||
| MJD | 59309.1768572970 | |
| UTC | 2021-04-05 04:14:40.470 | |
| Beam | IB | |
| RA | (hms) | 17h01215 04 |
| Dec | (dms) | 32′428 05 |
| l | (deg) | 338.1920 |
| b | (deg) | -4.5969 |
| S/N-maximising DM | () | 566.43 |
| Scattering-corrected DM | () | 565.17 |
| S/N | 140.8 | |
| W | (ms) | |
| W | (ms) | |
| (ms) | ||
| W | (ms) | |
| Project physical offset | (kpc) | 10.65 |
| Instrumental | ||
| (ms) | 6.3 | |
| 1024 | ||
| 60 | ||
| LSP | ThunderKAT | |
| Inferred | ||
| (Jy) | 15.9 | |
| (Jy ms) | 120.8 | |
| DM | () | 516.1 |
| DM | () | 348.7 |
| DM | () | 144 |
| DM | () | 50.3 |
| DM | () | 217.7 |
| 0.066 | ||
| Measured at 1016.5 MHz. | ||
| Intra-channel dispersive smearing in the lowest frequency channel. | ||
3.1 Localisation
The high detection S/N of FRB 20210405I meant that we could utilise the ThunderKAT imaging observations to localise it. The imaging observation had an observation time of 10 min, with a minimum integration time of 8 s. The pulse has a dispersion delay of s, which is fully contained within one 8 s image. As described in Section 2.2, we made a full time integration MFS image and s image slices using WSClean.
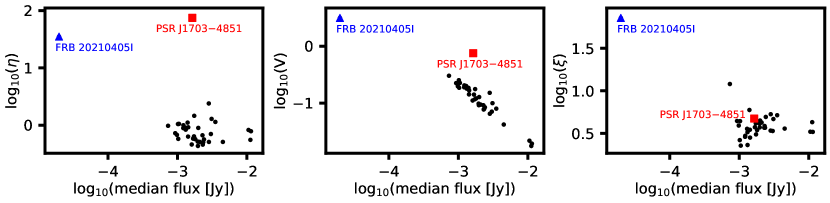
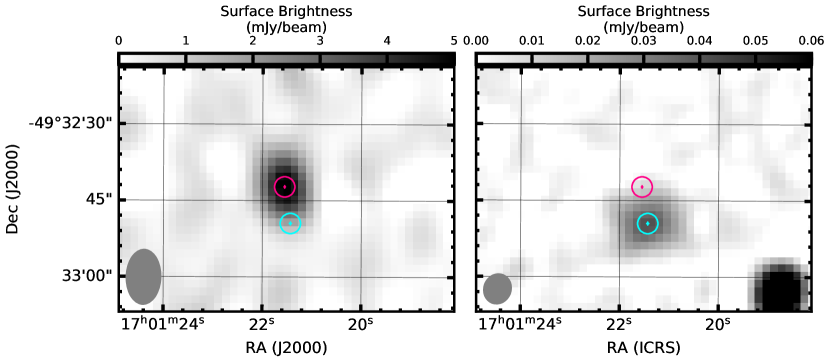
We applied the TraP to the 8 s images. The resulting variability parameters are shown in Figure 2. We can see that the known mode-changing pulsar, PSR J17034851 (Wang et al., 2007; Jankowski et al., 2019), is an outlier in all three parameters (see Driessen et al., 2022a, for the light curve of PSR J17034851). There is also another outlier in these plots that is more extreme in the and parameters compared to PSR J17034851, and has a lower median flux density. This outlier was detected in a single 8 s image, centred in time on 2021-04-05T04:14:42.2, which matches the time that MeerTRAP detected FRB 20210405I. An image of the burst is shown in Figure 3 (left panel). As it was the only outlier in the variability parameters apart from known source PSR J17034851, was detected in a single epoch, and was detected at the time of FRB 20210405I, we identified this source as FRB 20210405I.
We corrected the astrometry using the method described in Section 2.2.1. We determined the transformation matrix, , using the 10 minute image:
| (6) |
The separations between the MeerKAT sources and ATPMN sources before and after correcting the astrometry are shown in Table 2. We then applied the transformation matrix to the 8 s image containing FRB 20210405I. To confirm that the correction to the 10 minute image was applicable to the 8 s images we compared the positions of the bright sources in the field between the full integration time and 8 s images. We found that the median offset of the positions was 02, which is less than the 04 uncertainty on the ATPMN positions. As such the uncertainty on the astrometry is the 04 arcsecond absolute astrometric uncertainty from the ATPMN positions. After applying the correction, the position of FRB 20210405I was determined to be RA: 17h01215 (255.33970∘) and Dec: 32′425 (49.54515∘). The uncertainty on the RA and Dec found by pyBDSF was 01 and 02 respectively; however, the uncertainty on the astrometric correction was 04 in both RA and Dec. We added these uncertainties in quadrature to find that the uncertainty on the position of FRB 20210405I is 04 in RA and 05 in Dec. The burst is 47′30′′ from GX 3394 and 47′ 48′′ from the phase centre of the observation.
| ATPMN source name | separation before (′′) | separation after (′′) |
|---|---|---|
| J165418.2481303 | 0.6 | 0.4 |
| J165613.1492318 | 0.6 | 0.2 |
| J165614.9472915 | 0.2 | 0.2 |
| J165908.3481548 | 0.1 | 0.1 |
| J171154.9491250 | 0.4 | 0.07 |
3.2 Flux density and fluence
FRB 20210405I was detected 47′ 48′′ from the phase centre of the observation. This means that we need to take the attenuation of the IB into account. We use the modified single-pulse radiometer equation (Dewey et al., 1985) from Jankowski et al. (2023) to do this:
| (7) |
where is the peak flux density, is the signal-to-noise, is the digitisation factor, is the beam-forming efficiency, K and K are the system and sky temperatures respectively, is the gain of the IB, MHz is the effective frequency bandwidth, is the sum of the number of polarisations, s is the observed equivalent width of the boxcar pulse, and =1 and are the CB and IB attenuation factors respectively that take into account the angular dependence of the beam response. =1 as we only consider the IB detection in detail here. Using these values results in and a fluence of . These values are shown in Table 1.
3.3 Scattering
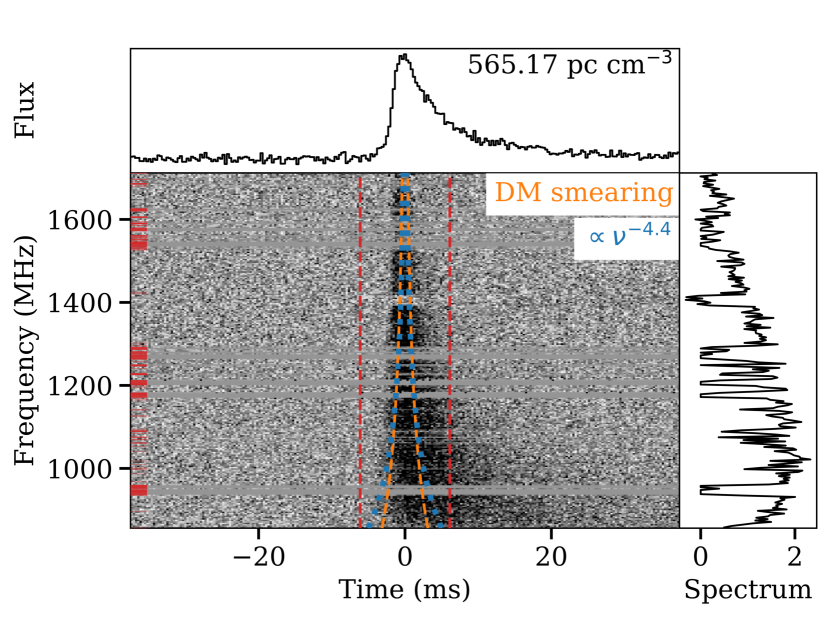
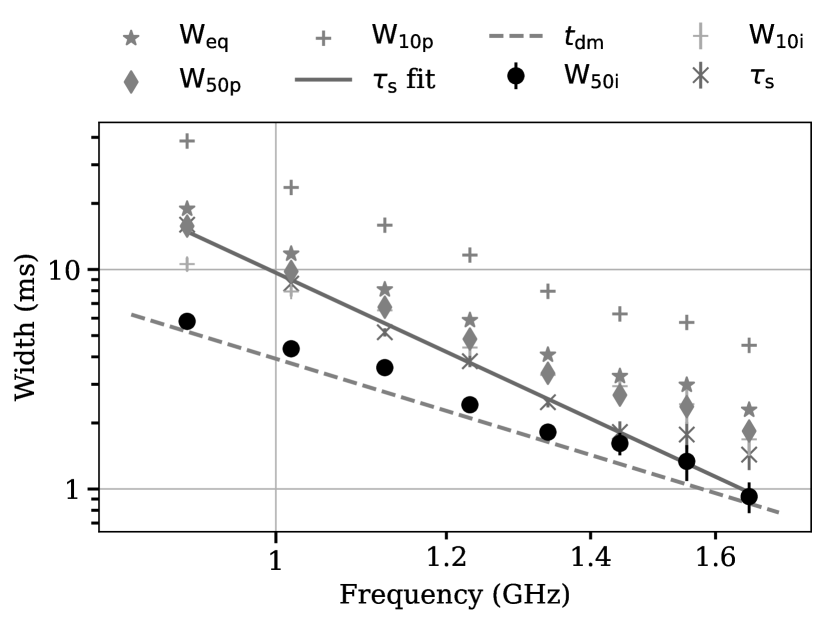
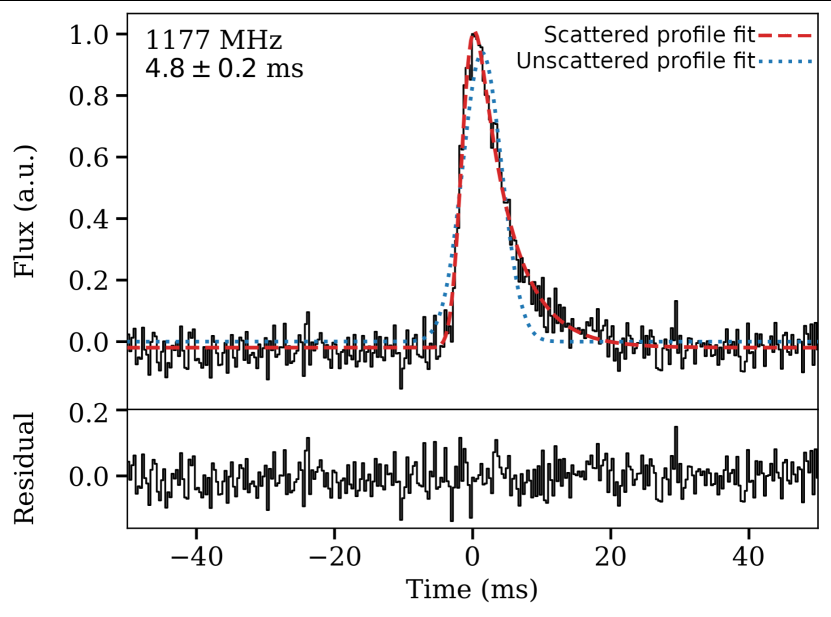
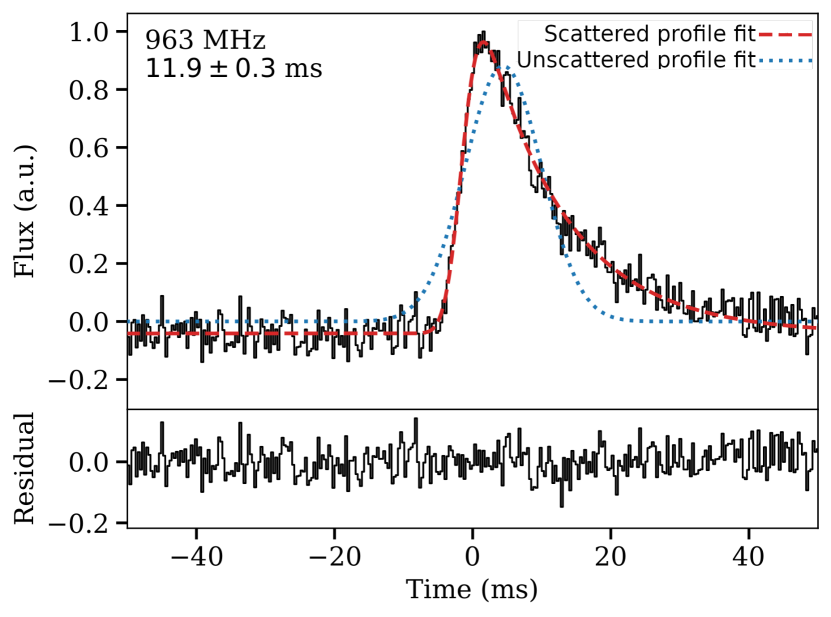
We analysed the highest-S/N total intensity pulse profile of FRB 20210405I recorded by the MeerTRAP backend by fitting a scattering model to the frequency sub-banded data. The model consisted of a normalised Gaussian profile convolved with a single-sided exponential pulse broadening function that is characteristic for scattering in the thin-screen regime of turbulent ionised media (e.g. Cordes & Lazio 2001). We performed the profile fits using a custom python-based software called scatfit111111Version 0.2.14, https://github.com/fjankowsk/scatfit/ (Jankowski, 2022). It utilises the Levenberg–Marquardt minimization algorithm as implemented in lmfit (Newville et al., 2016) for an initial fit, after which it explores the posterior using the emcee Markov chain Monte Carlo sampler (Foreman-Mackey et al., 2013). For more details about the fitting technique, see Jankowski et al. (2023). As the pulse broadening is significant, we first estimated the scattering-corrected DM from the data split into eight frequency sub-bands, which is . To determine the uncertainty we combined in quadrature the half width at which the S/N versus trial DM curve decreased by unity with the error in derived from the scattering fit. The best-fitting scattering index is , which we can see as the solid line in Figure 4.
3.4 Continuum radio emission
We searched the 3.63 hr joint image (see Section 2.2) for continuum radio emission near the position of FRB 20210405I. The joint image was astrometrically corrected using the method described in Section 2.2 using the same sources shown in Table 2. The transformation matrix for the joint image is:
| (8) |
A faint, slightly resolved continuum source, MKT J170121.4493250, is identified 74 from the position of FRB 20210405I, shown in Figure 3 (right panel). The uncorrected coordinates of the resolved source are RA: 17h01m214s (255.33932∘) and Dec: 49∘32′500 (49.54708∘). The astrometrically corrected coordinates of MKT J170121.4493250 are RA: 17h01m214s (255.33926∘) and Dec: 49∘32′502 (49.54727∘) with combined pyBDSF and astrometric uncertainty of 06 in RA and 05 in Dec. The offset between the uncorrected and corrected position is 07. MKT J170121.4493250 is too faint to be detected in sub-band images, unlike FRB 20210405I, where we can apply a primary beam correction. It is only detected in the joint MFS image. The uncorrected pyBDSF total flux density of this source is .
4 Optical observations
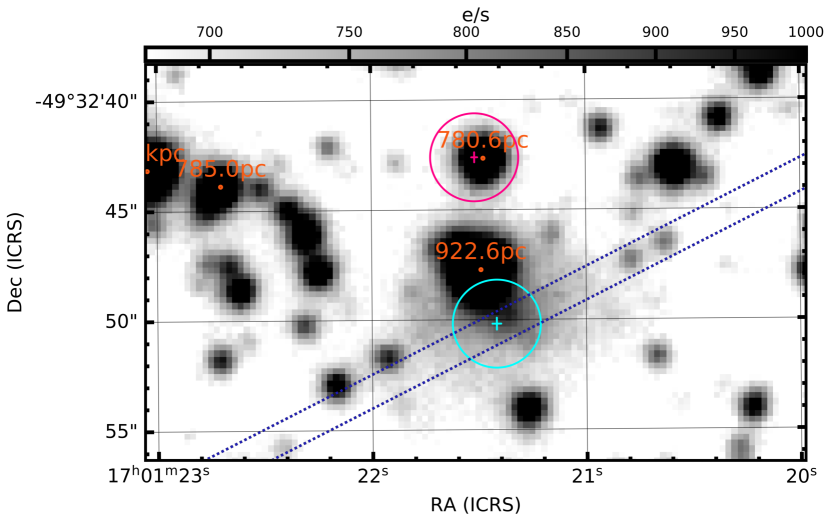
A Dark Energy Camera Plane Survey (DECaPS; Schlafly et al., 2018) VR stacked optical image is shown in Figure 5 with the same magenta (FRB 20210405I) and cyan (MKT J170121.4493250) cross hairs as shown in Figure 3. The VR filter is a broadband filter from 497nm to 756nm. Stacked images are combined images from multiple exposures. Optical sources from Gaia Data Release 3 (Gaia DR3; Gaia Collaboration et al., 2016, 2023) that have Gaia DR3 distances have also been labelled in Figure 5. Schlafly et al. (2018) found that the typical difference between DECaPs source positions and Gaia source positions is 01 and Gaia is tied to the ICRS. Despite FRB 20210405I being located in the Zone of Avoidance (ZoA), we can see a faint extended optical source coincident with the position of MKT J170121.4493250. This suggests that the extended, continuum radio emission is associated with this extended optical source. The ZoA is the part of the sky that is strongly affected by Galactic foreground extinction. In the ZoA the foreground extinction causes background galaxies to appear smaller as isophotal diameters are strongly affected (see e.g. Riad et al., 2010). We can also see in Figure 5 that FRB 20210405I is 03 from a bright optical source, Gaia DR3 5938235492995353728, that has a Gaia DR3 distance of pc (Gaia Collaboration et al., 2023).
Optical spectroscopy of the extended optical source and Gaia DR3 5938235492995353728 was undertaken with the Southern African Large Telescope (SALT; Buckley et al., 2006) using the Robert Stobie Spectrograph (RSS; Burgh et al., 2003). Data reductions were done using PySALT version 0.47, the PyRAF-based software package for SALT data reductions (Crawford et al., 2010)121212https://astronomers.salt.ac.za/software/pysalt-documentation/, which includes gain and amplifier cross-talk corrections, bias subtraction, amplifier mosaicing, and cosmetic corrections. Spectral reductions (object extraction, wavelength calibration and background subtraction) were all done using standard IRAF131313https://iraf.noao.edu/ routines, including relative flux calibration.
Two repeat 1150 s exposures were taken of Gaia DR3 5938235492995353728 on 2021 April 15 in clear conditions with seeing of 18. The low resolution PG300 grating was used, covering the region 3800–8400 Å, with a slit width of 125, resulting in a spectral resolution of 17Å. The combined spectrum appears to be a G or K type star, with an obvious Mg b line at 5172Å and no presence of molecular bands, ruling out a later spectral type.
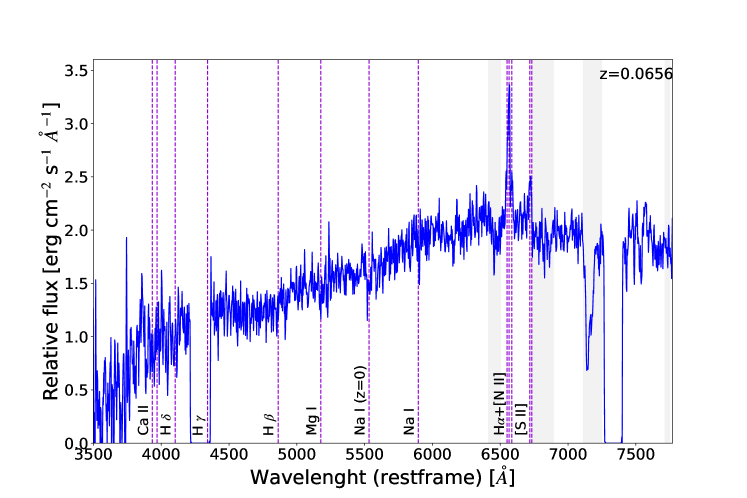
A SALT spectroscopic observation of the extended optical source coincident with MKT J170121.4493250 was obtained on 2021 September 02 in clear conditions with 13 seeing using the same PG300 grating, but with a 2′′ slit, giving a resolution of 24Å. The position of the slit, chosen to reduce contamination from Gaia DR3 5938235492995353728, is shown in Figure 5. Two repeat 1600 s exposures were taken. This object is a galaxy, with prominent H and [SII] emission lines at = 0.066 (see Figure 6). The H value suggests that it is consistent with a star-forming spiral galaxy. The disk of the galaxy is likely obscured by extinction ( at the position of FRB 20210405I; Schlafly & Finkbeiner, 2011).
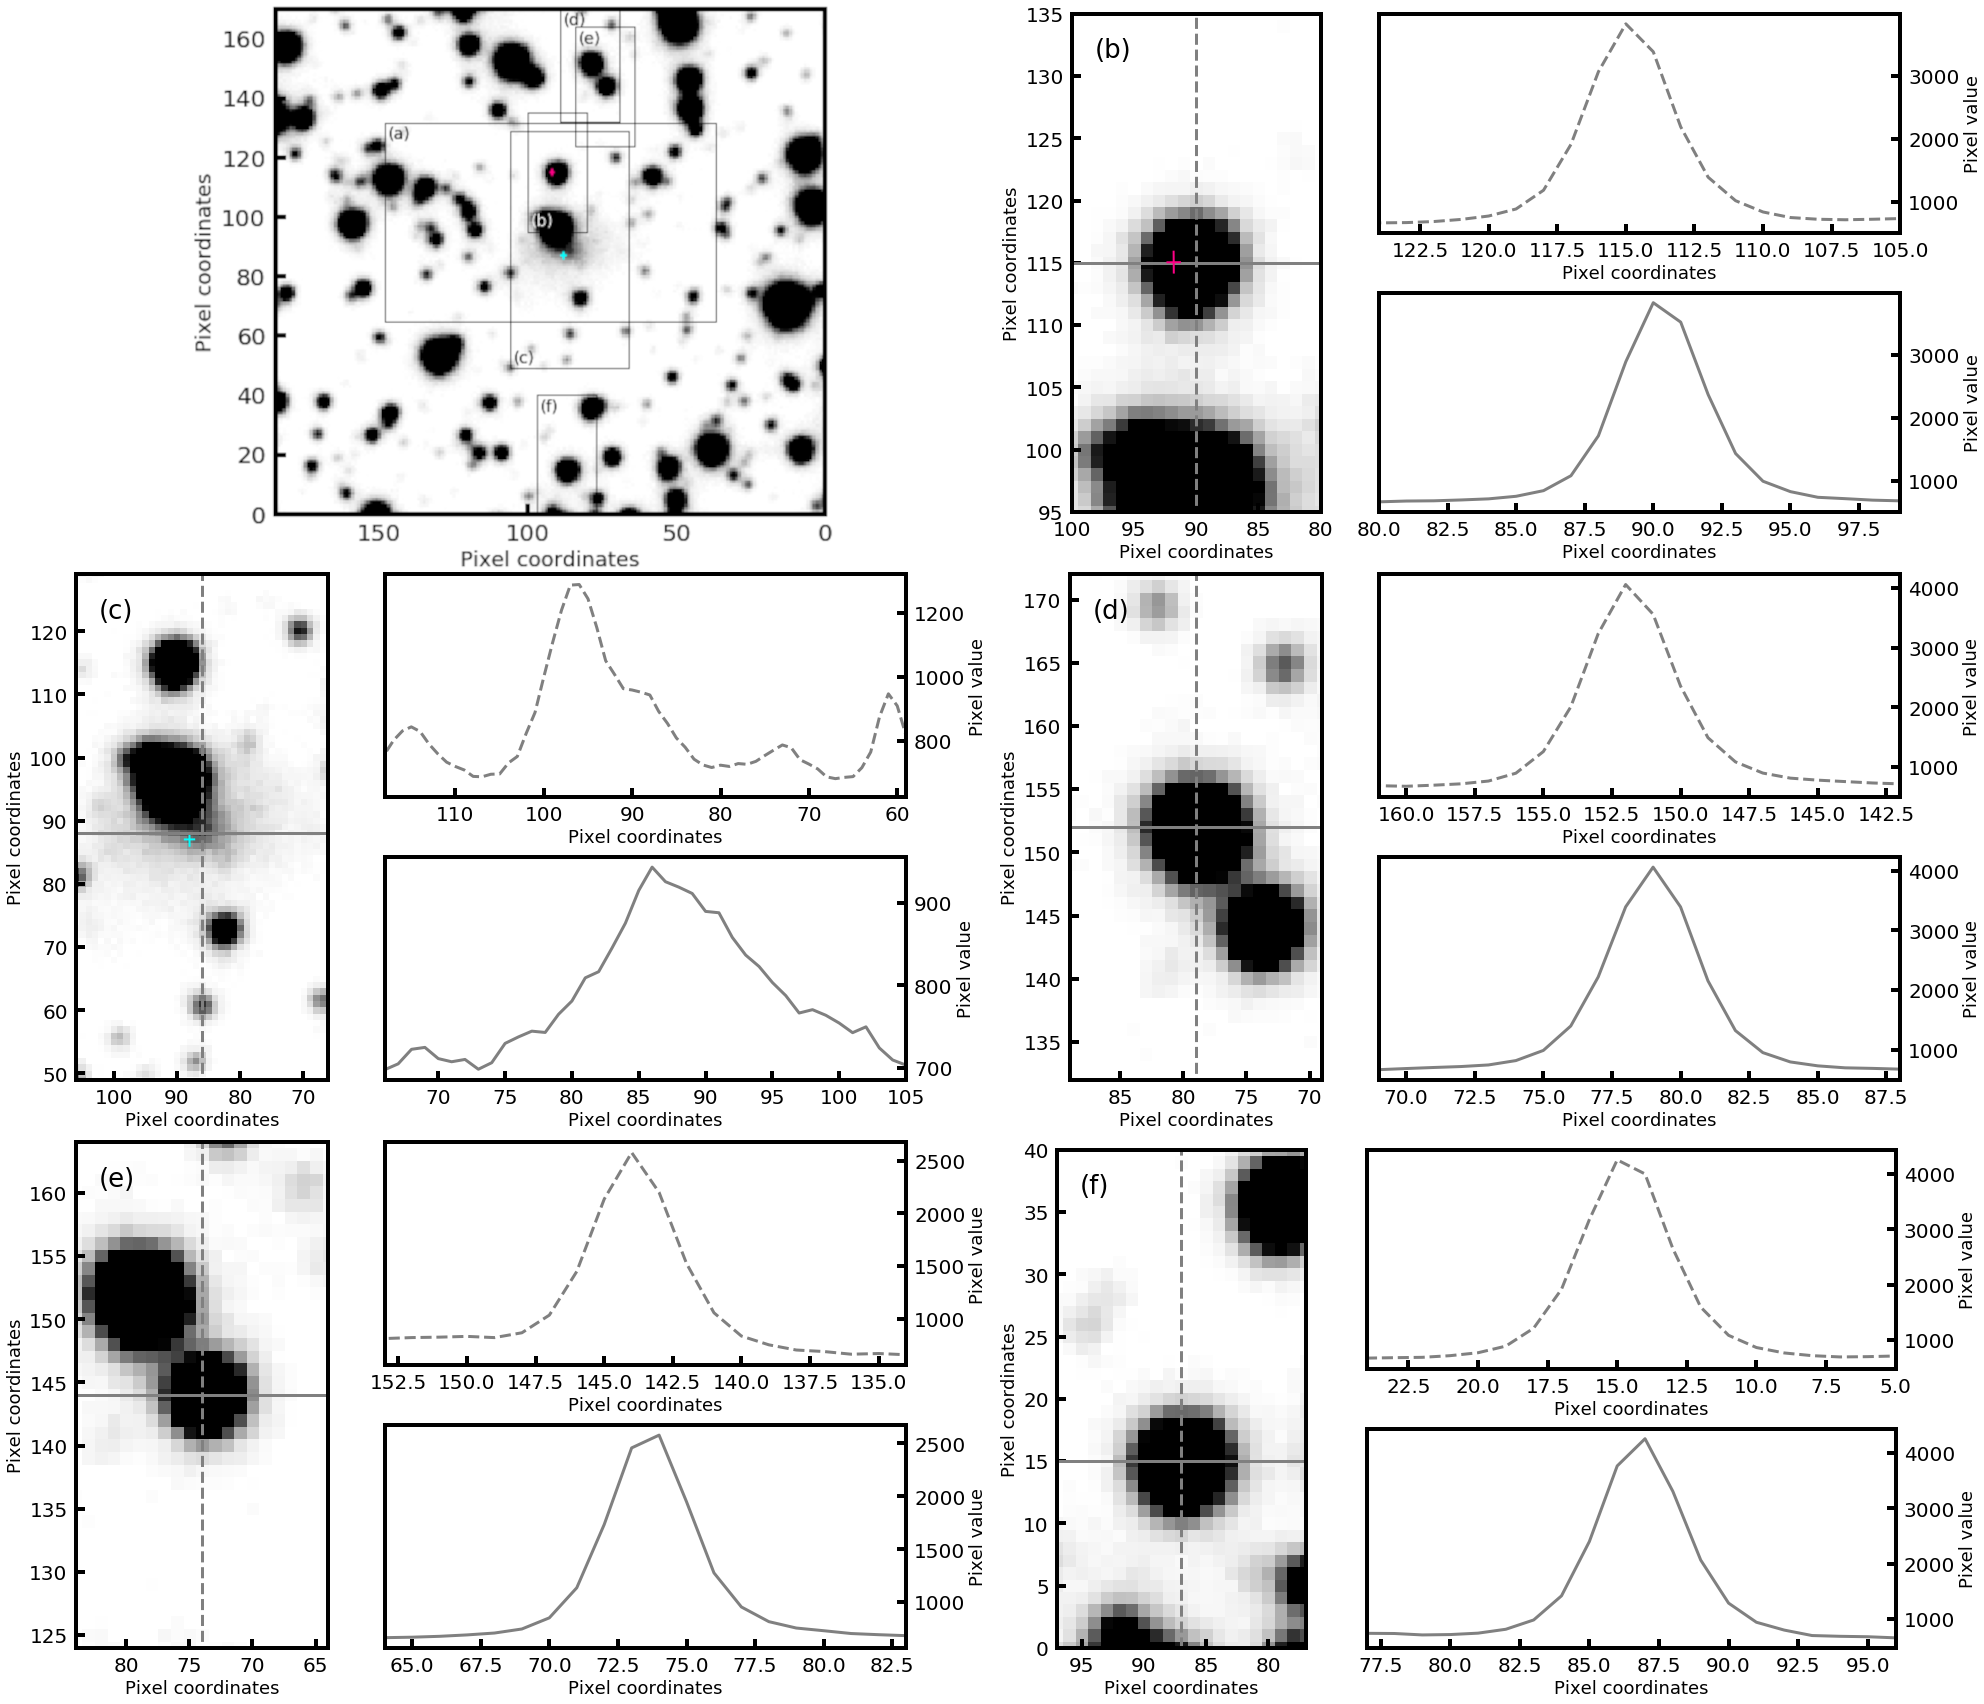
We also examined the point spread function (PSF) of Gaia DR3 5938235492995353728, shown in Figure 7(b), and compared it to the PSFs of other sources in the field, shown in panels (d) to (f) of Figure 7. The PSFs of all of these sources show no evidence of excess emission in the wings and can be described as Gaussians.
4.1 Properties of the extended optical source
The optical galaxy is faint in the optical, visible as an extended blob in the stacked VR image shown in Figure 5. It is coincident with the continuum extended radio source MKT J170121.4493250. It is also in the ZoA with high extinction and partially obscured by a bright foreground star. It is only because of the sensitivity of DECam that we could detect the galaxy at all in the optical. While the obscuring star and faintness make optical analysis challenging, we can investigate the source in other bands. An extended source is visible in the 2 Micron All Sky Survey (2MASS; Skrutskie et al., 2006), particularly in the K band. The J and H bands are likely dominated by contamination from the nearby star. It is identified as a galaxy, 2MASS J17012494932475, and has an extinction corrected () apparent magnitude of . Using the SALT distance, this corresponds to an absolute K-band magnitude of , which is also consistent with a spiral galaxy. The galaxy is visible as an extended source in the WISE W1 band, with WISE colours and . This places it between where normal disk galaxies and star-forming galaxies are located in the WISE color-color diagram (Figure 12 in Wright et al., 2010). This agrees with the SALT H detection.
Using the SALT spectrum, we determined the line flux by simultaneously fitting and the surrounding doublet with three Gaussian profiles to the continuum-subtracted spectrum, excluding regions of sky absorption. We obtained erg s-1 cm-2, which corresponds to a star-formation rate limit (SFR) yr-1 at (SFR yr-1 correcting for the Galactic extinction), considering a Salpeter (1955) Initial Mass Function (IMF). These values should also be corrected for the dust extinction of the FRB host galaxy. We estimated this by measuring the flux limit of the flux and comparing it to the over Balmer ratio. We found significant dust extinction with A. We corrected the flux for dust extinction in the host galaxy using a Milky Way extinction curve by Pei (1992) and obtained erg s-1 cm-2, corresponding to an SFR yr-1. Using the absolute K band magnitude and the mass-luminosity relation of galaxies, we estimated a stellar mass of . Using this value and the dust corrected SFR determined above, we obtained a specific star formation rate limit (sSFR, defined as SFR/) of yr-1. Finally, using the flux of the , we estimated the metallicity 12 + log(O/H) = , using the strong line ratio with and following Maiolino et al. (2008).
We used a two-hour MeerKAT observation of the GX 3394 field from 2021 April 07 to search for HI emission from MKT J170121.4493250. Using the redshift of the extended optical source, , we find that the expected HI frequency is 1.3324 GHz; however, we do not detect any HI emission. This is likely because the galaxy lies nearly a degree from the phase centre of the MeerKAT observations, which is outside the primary beam and is therefore challenging to detect. The root mean square (RMS) noise of the HI cube is 0.23 mJy beam-1 channel-1 prior to primary beam correction and 1.15 mJy beam-1 channel-1 after primary beam correction. The beam size in the HI cube is kpc. We derived the 3 upper limit on the HI flux of the likely host galaxy using:
| (9) |
where is in the units of , rms is in units of Jy beam-1 channel-1 for the HI cube after primary beam correction, is the velocity width of the HI emission for the likely host galaxy in units of , is 44.5 (the channel width of the HI data cube). By assuming is 400 and the HI disk is smaller than the beam size ( kpc), is 0.46 Jy . The HI mass upper limit for the likely host galaxy is , given by Meyer et al. (2017):
| (10) |
where is in M⊙, is the HI flux upper limit in , is the redshift (0.066) and is the luminosity distance of the galaxy in Mpc (296.8 Mpc is used for and assuming ).
5 Discussion
5.1 Is FRB 20210405I Galactic or extra-galactic?
We have detected and localised FRB 20210405I using the MeerTRAP pipeline and ThunderKAT images. However, there is a discrepancy between the Milky Way DM contributions from the ymw16 model (348.7 pc cm-3) and the ne2001 model (516.1 pc cm-3), that may place FRB 20210405I ( pc cm-3) either just outside the Galaxy, or inside the halo. Here we will present the properties of FRB 20210405I to determine if the source is Galactic or if it originates from the identified candidate galaxy: 2MASS J17012494932475.
5.1.1 Nearby star Gaia DR3 5938235492995353728
The Gaia DR3 distance of Gaia DR3 5938235492995353728 is pc. Using the ymw16 electron density model, a source in that direction within the Milky Way Galaxy at that distance would have a DM of pc cm-3 compared to the DM of FRB 20210405I: pc cm-3. The PSF of Gaia DR3 5938235492995353728 is a Gaussian that matches the PSF of point sources in the field. This indicates that the source is a point source as expected for a star and that there is no evidence of a galaxy directly behind and obscured by Gaia DR3 5938235492995353728. Due to the spectral confirmation of Gaia DR3 5938235492995353728 as a star, the distance to it, and the lack of evidence of an extended source directly behind the star in the PSF, we conclude that the position match between FRB 20210405I and Gaia DR3 5938235492995353728 is a chance coincidence.
Gaia DR3 5938235492995353728 is 03 from the position of FRB 20210405I. The star’s coordinates, after accounting for proper motion, are RA: 17h0121477 and Dec: 32′42688. The median offset between Gaia counterparts of the third realisation of the International Celestial Reference Frame (ICRF3 Charlot et al., 2020) sources is 0.5 mas (Gaia Collaboration et al., 2022). While the uncertainty on the star’s position is small, the uncertainty on FRB 20210405I’s position is 05 in RA and 04 in Dec (taking the astrometric uncertainty into account). Gaia DR3 5938235492995353728 is a G or K type star, so we can assume that it is a similar star to our Sun. Using the equations in Tiburzi et al. (2021), the radius at which the solar wind produces a DM of 60 pc cm-3, accounting for the difference between the FRB 20210405I DM and the ne2001 MW DM, is 0.1 AU. At a distance of pc this is a disk of radius . This is significantly smaller than the uncertainty on the star’s position. Even if we assume that Gaia DR3 5938235492995353728 could produce significant DM contributions at 1 AU the radius of the disk at pc would be . Given that the radius of the possible stellar wind is at least two orders of magnitude smaller than the uncertainty on the FRB position it is unlikely that FRB 20210405I passed close enough to the star for any possible stellar winds to have a significant impact on the DM of the FRB.
5.1.2 Dispersion measure
We can use the DM to explore whether the FRB progenitor is likely in the galaxy or in the Milky Way Halo. We use a halo DM of pc cm-3 from Yamasaki & Totani (2020) including a 40 per cent uncertainty. This is because FRB 20210405I is at a Galactic latitude of deg or . Constraining the DM of the halo, particularly near the Galactic plane, is challenging. Recently, Cook et al. (2023) presented a comparison of halo DM models and reviewed them using FRB DMs. While they only presented models with , they found that the Yamasaki & Totani (2020) halo model is consistent with their FRB observations.
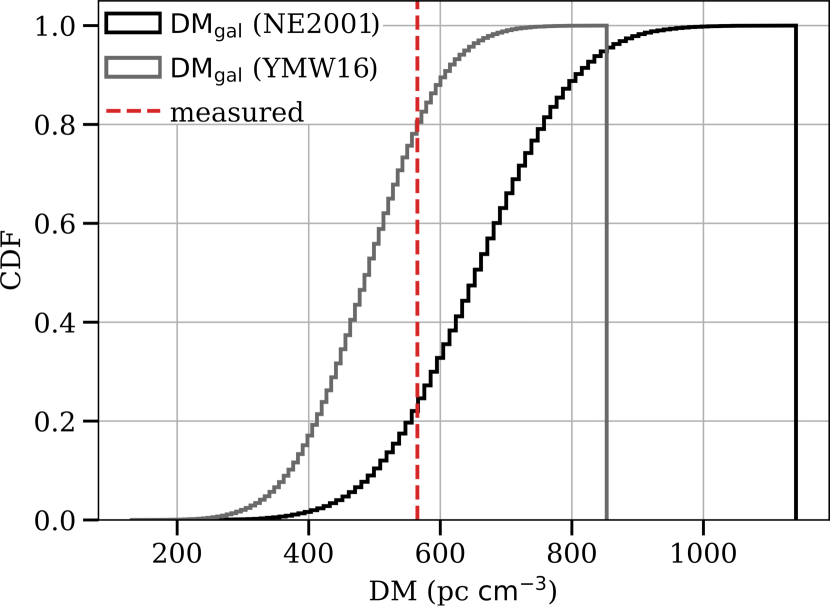
The ISM contributions computed using the ne2001 and ymw16 Galactic free electron models differ significantly. If we assume a 20 per cent uncertainty on the maximum integrated ISM DM contribution and a 40 per cent uncertainty on the MW halo DM contribution (the halo is more poorly understood) for the FRB 20210405I sightline, the probabilities of FRB 20210405I being extra-galactic are 24 and 80 per cent for the ne2001 and the ymw16 model, respectively. We visualise this in Figure 9.
We can use the DM inventory to consider whether the different DM contributions are feasible. The ymw16 DM excess is pc cm-3 and the ne2001 DM excess is pc cm-3. We assume that the uncertainty on these DMs is 20 per cent. The expected cosmic DM for is pc cm-3using the Macquart relation (James et al., 2022a). If we use the ymw16 DM and assume that FRB 20210405I is associated with the galaxy at then pc cm-3. Assuming the same values but using ne2001 for the gives pc cm-3. The uncertainties on these host DM values are large as the DMs along the line of sight are not well known. The upper limit on the ne2001 is -1 pc cm-3; however, the range of possible values using ymw16 for is plausible.
However, we would require an impossible, negative if we use the ne2001 model for .
We need to account for DM excesses of pc cm-3 and pc cm-3 for ymw16 and ne2001 respectively if we assume that FRB 20210405I is inside the Milky Way. An unidentified HII region could account for these DM excesses; therefore, it is not possible to conclusively rule out that FRB 20210405I originated from inside the Galaxy based on the DM alone.
5.1.3 Scattering
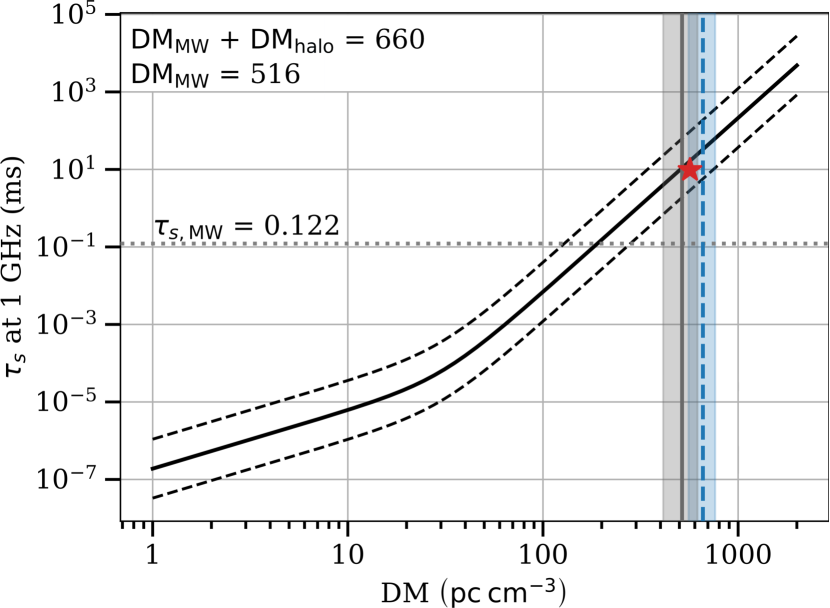
Figure 8 shows the scattering time, , measurement of FRB 20210405I interpolated to 1 GHz in a – DM diagram. We highlight the expected DM contribution from the Milky Way (MW), , with its 20 per cent uncertainty range for that sightline as computed using the ne2001 Galactic free-electron model. Additionally, we show the combined range of and the MW halo DM contribution of expected from the Yamasaki & Totani (2020) halo model. The curved black solid line shows the best-fitting – DM relation of Galactic pulsars (Cordes et al., 2022) with its 1- range highlighted with black dashed lines. We can see in Figure 9 that FRB 20210405I’s scattering time is larger than the scattering time expected from the Milky Way, which is also the lower DM limit for an extra-galactic source; however, it is consistent with the scattering-DM relation of Galactic pulsars. This implies that FRB 20210405I ’s scattering time measurement is consistent with either an extra-galactic source or a source within the MW halo.
FRB 20210405I is located at a low Galactic latitude of deg, which means that its radio signal passed through the thick disk of the Milky Way. The best-fitting scattering index is (see Section 3.3), which agrees well with the power law index expected from Kolmogorov turbulence in ionised media, . It is also consistent with the spread in scattering indices observed in Galactic radio pulsars (Oswald et al., 2021; Cordes et al., 2022). The scattering time interpolated to 1 GHz is . The pulse broadening expected from the Milky Way ISM in that direction is ms according to the ne2001 Galactic free-electron model (Cordes & Lazio, 2002). The isotropic thin-screen scattering model describes the data well with profile residuals that appear normally distributed for both the band-integrated and sub-banded data. The profile data offer little room for deviations from the isotropic scattering regime.
5.1.4 Luminosity
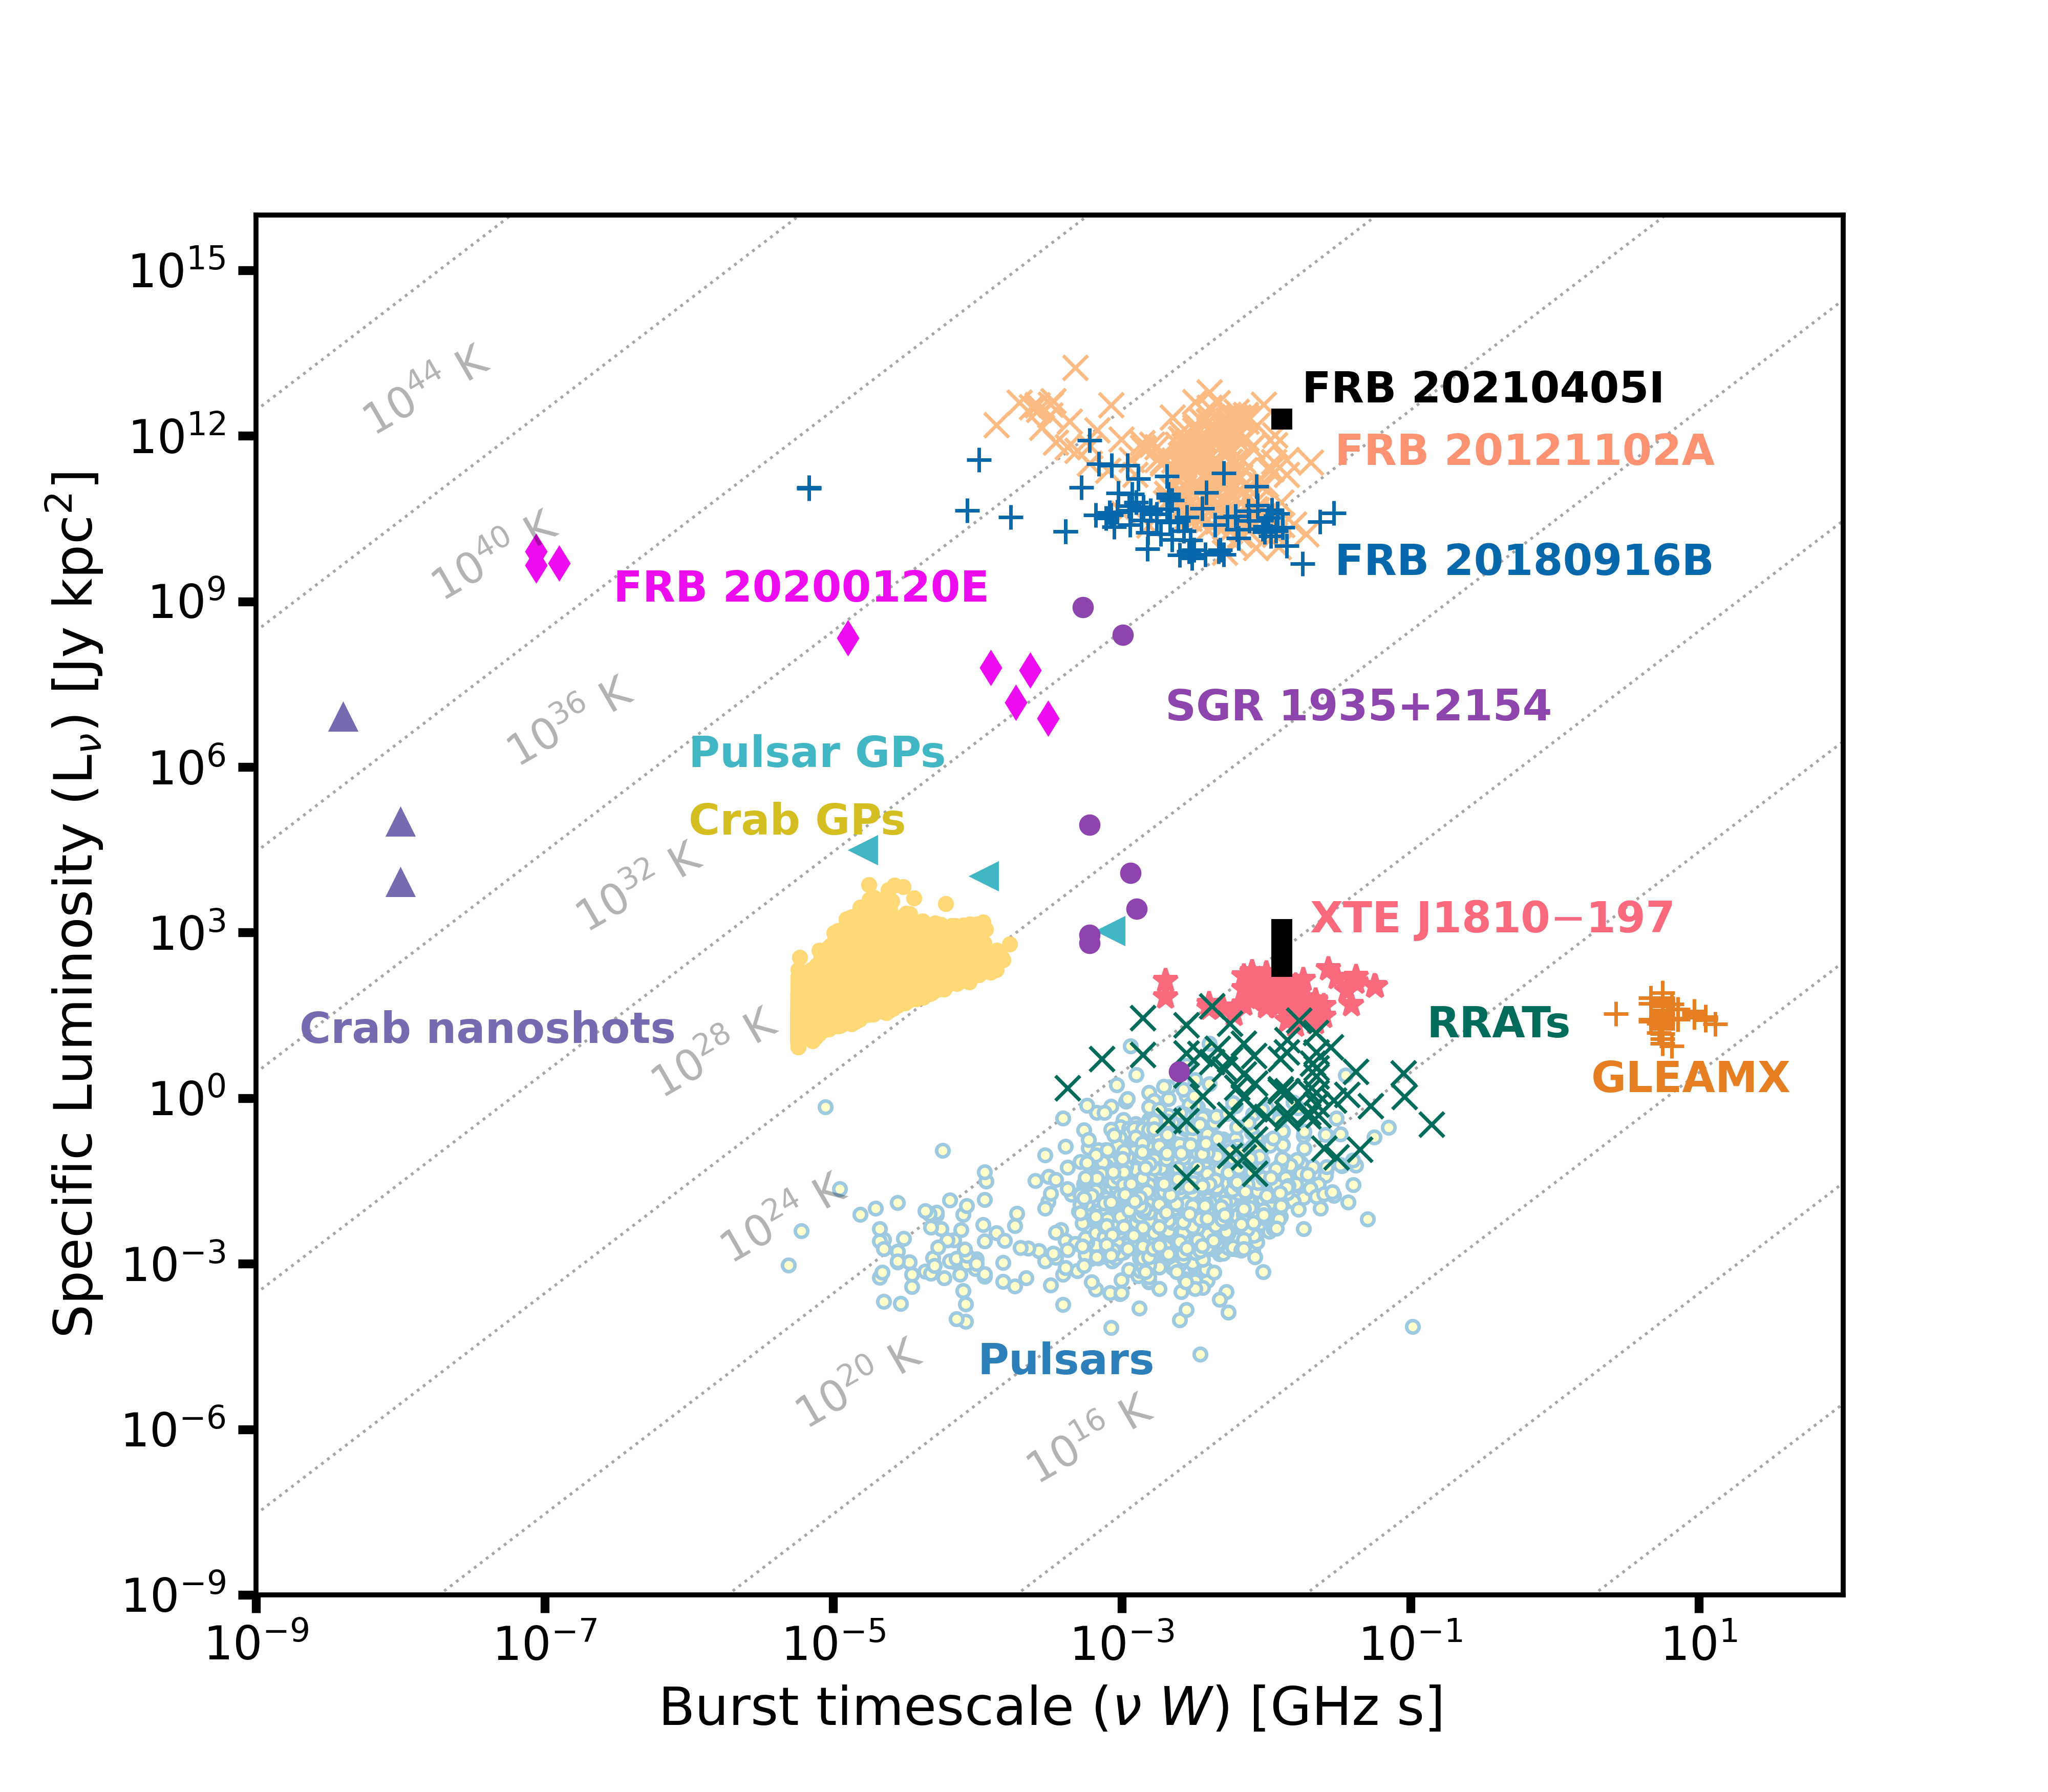
We investigated the expected specific radio luminosity of FRB 20210405I to verify whether the expected energetics are consistent with the general population of FRBs. To do so, we computed the specific luminosity by multiplying the peak flux density of the burst with the square of the distance to the source. We consider two cases: 1) FRB 20210405I lies within our Galaxy and 2) FRB 20210405I lies in the galaxy at a redshift of 0.066. In order to estimate the distance of FRB 20210405I in the Galaxy, we used a DM range of 416 to 616 pc cm-3 and use the ne2001 electron density model to map the DM to a distance in the Galaxy. Then we computed the specific luminosity for FRB 20210405I for this range of distances. The values for both cases were plotted on the specific luminosity versus burst width parameter space that shows different classes of coherently emitting transients (see Figure 10). One can clearly see from the figure that if FRB 20210405I is associated with the optical galaxy at a redshit of 0.066 then the luminosity is consistent with the population of FRBs. On the other hand, if FRB 20210405I lies in our Galaxy, the burst has a higher specific luminosity than bursts from the magnetar XTE J and stands out from the populations of RRATs, magnetars, pulsars based on luminosity and stands out from pulsar giant pulses based on timescale.
5.1.5 Association with 2MASS J17012494932475
In order to robustly claim association of FRB 20210405I with the 2MASS J17012494932475 , we computed the chance coincidence probability of spatial coincidence. For this we considered two cases separately: 1) FRB 20210405I is Galactic and lies on top of 2MASS J17012494932475 in the sky plane and 2) FRB 20210405I is extra-galactic but originates in a different unseen host galaxy. For case 1, the probability of chance coincidence,
| (11) |
where, is the probability for a galaxy to be at a Galactic longitude and latitude . To obtain out to the redshift of 2MASS J17012494932475, we used the same methodology as used by Campisi & Li (2008) and found a probability of 0.0025. Hence, for case 1, 2.510-3.
For case 2, we used the chance association probability methodology from Eftekhari & Berger (2017) and Aggarwal et al. (2021). For this case, we used the 99 confidence upper limit of an unseen host redshift of 0.35. Using this, we obtained 0.009. So for both cases, the value of is very low. Therefore, we conclude that FRB 20210405I is associated with 2MASS J17012494932475.
The angular offset between FRB 20210405I and the centre of the galaxy of 74 at a luminosity distance of 296.8 Mpc corresponds to a projected physical offset of kpc in the host galaxy reference frame. This places the FRB in the spiral arms or halo of the galaxy. This is at the high end of the offset distribution of well-localised FRBs and clearly above the median of 3.3 kpc (Heintz et al., 2020) but is consistent with two of the bursts, FRB 20190611B ( = 0.3778) and FRB 20191001A ( = 0.2340).
5.1.6 Summary
Neither the DM nor scattering properties of FRB 20210405I strongly support either a Galactic origin or an association with 2MASS J17012494932475 at . However, the specific luminosity favours the latter. We also show that the probability that the spatial coincidence between FRB 20210405I and 2MASS J17012494932475 is chance coincidence is low. Therefore, we find it much more likely that FRB 20210405I is an FRB associated with 2MASS J17012494932475 as the DM, scattering, specific luminosity and localisation are all consistent with this conclusion. It is still possible for the FRB to originate within the Milky Way; however, this would require an unusually bright magnetar/pulsar burst and an improbable spatial coincidence.
The uncertainty in the Galactic or extra-galactic origin of this FRB highlights the uncertainty in our understanding of the Milky Way DM and particularly the Milky Way halo DM. This was also highlighted by Ravi et al. (2023) for FRB 20220319D. It is important to continue to test and expand our measurements of these as demonstrated by Cook et al. (2023). We are currently limited in our understanding and models in the Galactic Plane for both the Galactic and halo DM contributions. More FRB detections at lower Galactic latitudes will help to test and improve the models.
5.2 Comparison to previously identified FRB host galaxies
These results indicate that 2MASS J17012494932475 is an evolved massive galaxy with high-metallicity as is typical at such high stellar masses, but with very low star-formation. This possibly points towards even higher dust extinction in the host galaxy or to an early type spiral galaxy. The stellar mass and SFR are respectively at the higher and lower end of the FRB host population (Bhandari et al., 2022), extending it to massive, early type galaxies. A comparison of these characteristics with the hosts of other classes of transients, shows that these properties are completely different from those of the hosts of explosive transients such as long gamma-ray bursts (Vergani et al., 2017; Palmerio et al., 2019) and superluminous supernovæ (Japelj et al., 2016; Lunnan et al., 2014). However, they can correspond to a subgroup of the host galaxy population of other kinds of core-collapse SN (such as Type II SN (Lunnan et al., 2014; Kelly et al., 2014)), if the real SFR is much higher than the reported lower limit. Some hosts of merger-driven transients such as short gamma-ray bursts (Berger, 2014) have similar characteristics (see also Bhandari et al. 2022).
5.3 Searching for FRB 20210405I in past images
While FRB 20210405I was detected by MeerTRAP and ThunderKAT on 2021 April 05, ThunderKAT has been observing GX 3394 weekly since September 2018 and will continue to do so until at least August 2023. MeerTRAP started observing commensally with ThunderKAT in September 2021. This means that there are years of weekly images prior to MeerTRAP observing with ThunderKAT where FRB 20210405I may be detected if it is repeating and bright enough to be detected in 8 s images. Producing thousands of 8 s images is time-consuming, and not all of the available weekly epochs have been imaged in 8 s slices. The list of epochs and the number of 8 s images available for each epoch is shown in Table 4 in Appendix A. We have searched 100 epochs with a total of s images observed prior to September 2021 for a repeat burst from FRB 20210405I, using a match radius of 3′′. We use a radius of 3′′ as the astrometric offset of each image can be different prior to correction. We present some possible detections with low S/N in Table 3.
| Date | Coordinates (J2000) | Sep (′′) | S/N | (mJy) |
|---|---|---|---|---|
| 2021.04.05 | 17 | 0 | 25 | |
| 2019.08.04 | 1.0 | 4 | ||
| 2020.04.18 | 1.9 | 4 |
At the time of writing there were weekly ten minute ThunderKAT observations since MeerTRAP started observing commensally with ThunderKAT in September 2021. This means that there has been approximately 17 hours of MeerTRAP monitoring of the field. We have not detected any further bursts from FRB 20210405I with MeerTRAP. We found two low S/N image-plane transient candidates in 8 s images of the field prior to September 2021. Due to the low S/N of these sources and the 8 s time resolution, we cannot confirm whether these are artefacts or repeat bursts from the FRB source. MeerTRAP will continue to observe commensally with ThunderKAT during their weekly observations of GX 3394.
5.4 Future FRB localisation prospects
FRB 20210405I is the first sub-arcsecond localised FRB using the MeerKAT telescope, and this localisation was made possible by the commensal nature of the MeerTRAP project. As MeerTRAP observes commensally with all MeerKAT LSPs, we can use the 8s images from the LSP observations to localise bright FRBs. This demonstrates the power of commensal searches for single pulses. However, only FRBs with high S/N can be localised in second-long images. We are currently working to implement a fast imaging pipeline as part of MeerTRAP. When MeerTRAP is triggered by a single pulse we can save the transient buffer data as phase delay corrected voltages. These data are typically s long, and we slice around the DM of the burst. We can then image these data offline to rapidly produce images and localise the burst. This pipeline will be an important tool for localising MeerTRAP FRBs and expanding the sample of FRBs associated with host galaxies.
6 Conclusions
We detected a new FRB, using MeerKAT and the MeerTRAP backend. At the time of FRB 20210405I’s detection, MeerTRAP was observing commensally with ThunderKAT, which enabled us to use the ThunderKAT 8s images to localise the FRB with sub-arcsecond precision. We used the specific luminosity and chance coincidence probability to determine that FRB 20210405I is most likely of extra-galactic origin and is associated with nearby galaxy 2MASS J17012494932475. We determined that the host galaxy is a disk/spiral galaxy at a redshift of . However, there is a discrepancy between the ymw16 and ne2001 predictions for the Milky Way DM which means that there could be some uncertainty about its true location based on the measure DM alone. However the combination of the association with the nearby host galaxy, the predicted luminosity based on it being located in the proposed host, and the scattering properties support it as being extra-galactic. This FRB highlights the uncertainty in the Milky Way DM and halo models that should be further explored with a larger sample of localised FRBs. FRB 20210405I is the first FRB localised to sub-arcsecond precision using MeerKAT.
Acknowledgements
We thank Chris Williams for all his assistance in getting the MeerTRAP pipeline up and running and Jim Cordes for helpful discussions. We would like to thank the operators, SARAO staff and ThunderKAT Large Survey Project team. LND, MC, FJ, KMR, BWS, MCB, MM, VM, SS, and MPS acknowledge support from the European Research Council (ERC) under the European Union’s Horizon 2020 research and innovation programme (grant agreement No 694745). MC acknowledges support of an Australian Research Council Discovery Early Career Research Award (project number DE220100819) funded by the Australian Government and the Australian Research Council Centre of Excellence for All Sky Astrophysics in 3 Dimensions (ASTRO 3D), through project number CE170100013. RKK and HC acknowledge the support the South African Department of Science and Innovation and the National Research Foundation received through the SARAO SARCHI Research Chair. HC is supported by Key Research Project of Zhejiang Lab (No. 2021PE0AC03). DAHB acknowledges support from the South African National Research Foundation. PAW acknowledges financial support from the NRF (grant no: 129359) and UCT. MG is supported by the EU Horizon 2020 research and innovation programme under grant agreement No 101004719. The MeerKAT telescope is operated by the South African Radio Astronomy Observatory (SARAO), which is a facility of the National Research Foundation, an agency of the Department of Science and Innovation. We acknowledge use of the Inter-University Institute for Data Intensive Astronomy (IDIA) data intensive research cloud for data processing. IDIA is a South African university partnership involving the University of Cape Town, the University of Pretoria and the University of the Western Cape. The authors also acknowledge the usage of TRAPUM infrastructure funded and installed by the Max-Planck-Institut für Radioastronomie and the Max-Planck-Gesellschaft. The SALT observations were obtained under the SALT Large Science Programme on transients (2018-2-LSP-001; PI: DAHB). Polish participation in SALT is funded by grant No. MEiN nr 2021/WK/01. This work has made use of data from the European Space Agency (ESA) mission Gaia.141414https://www.cosmos.esa.int/gaia, processed by the Gaia Data Processing and Analysis Consortium (DPAC, https://www.cosmos.esa.int/web/gaia/dpac/consortium) Funding for the DPAC has been provided by national institutions, in particular the institutions participating in the Gaia Multilateral Agreement. This research made use of Astropy,151515http://www.astropy.org a community-developed core Python package for Astronomy (Astropy Collaboration et al., 2013, 2018). This research made use of APLpy, an open-source plotting package for Python (Robitaille & Bressert, 2012). This research uses services or data provided by the Astro Data Lab at NSF’s National Optical-Infrared Astronomy Research Laboratory. NOIRLab is operated by the Association of Universities for Research in Astronomy (AURA), Inc. under a cooperative agreement with the National Science Foundation. This research has made use of the VizieR catalogue access tool, CDS, Strasbourg, France16161610.26093/cds/vizier. The original description of the VizieR service was published in Ochsenbein et al. (2000). This research has made use of the SIMBAD database, operated at CDS, Strasbourg, France (Wenger et al., 2000). This research has made use of NASA’s Astrophysics Data System Bibliographic Services171717https://ui.adsabs.harvard.edu/. LND would like to acknowledge the traditional owners of the land where most of her work was performed: the Wurundjeri People of the Woi worrung Nation, the Whadjuk people of the Noongar Nation and the Gadigal People of the Eora Nation. We would like to thank the referee for their constructive comments and help in improving this manuscript.
Data availability
AstroAccelerate is available here: https://github.com/AstroAccelerateOrg/astro-accelerate. The LOFAR Transients Pipeline is available here: https://tkp.readthedocs.io/en/latest/index.html. The code for performing the astrometry is available on Zenodo: https://doi.org/10.5281/zenodo.4921715.
References
- Adámek & Armour (2020) Adámek K., Armour W., 2020, ApJS, 247, 56
- Aggarwal et al. (2021) Aggarwal K., Budavári T., Deller A. T., Eftekhari T., James C. W., Prochaska J. X., Tendulkar S. P., 2021, ApJ, 911, 95
- Andersson et al. (2022) Andersson A., et al., 2022, MNRAS, 513, 3482
- Armour et al. (2012) Armour W., et al., 2012, in Ballester P., Egret D., Lorente N. P. F., eds, Astronomical Society of the Pacific Conference Series Vol. 461, Astronomical Data Analysis Software and Systems XXI. p. 33 (arXiv:1111.6399), doi:10.48550/arXiv.1111.6399
- Astropy Collaboration et al. (2013) Astropy Collaboration et al., 2013, A&A, 558, A33
- Astropy Collaboration et al. (2018) Astropy Collaboration et al., 2018, AJ, 156, 123
- Bannister et al. (2019) Bannister K. W., et al., 2019, Science, 365, 565
- Berger (2014) Berger E., 2014, ARA&A, 52, 43
- Bezuidenhout et al. (2022) Bezuidenhout M. C., et al., 2022, MNRAS, 512, 1483
- Bhandari et al. (2020) Bhandari S., et al., 2020, ApJ, 901, L20
- Bhandari et al. (2022) Bhandari S., et al., 2022, AJ, 163, 69
- Bhandari et al. (2023) Bhandari S., et al., 2023, ApJ, 948, 67
- Bhardwaj et al. (2021) Bhardwaj M., et al., 2021, ApJ, 910, L18
- Briggs (1995) Briggs D. S., 1995, in American Astronomical Society Meeting Abstracts. p. 112.02
- Bright et al. (2020) Bright J. S., et al., 2020, Nature Astronomy, 4, 697
- Buckley et al. (2006) Buckley D. A. H., Swart G. P., Meiring J. G., 2006, in Stepp L. m., ed., Proc. SPIEVol. 6267, Society of Photo-Optical Instrumentation Engineers (SPIE) Conference Series. p. 62670Z, doi:10.1117/12.673750
- Burgh et al. (2003) Burgh E. B., Nordsieck K. H., Kobulnicky H. A., Williams T. B., O’Donoghue D., Smith M. P., Percival J. W., 2003, in Iye M., Moorwood A. F. M., eds, Proc. SPIEVol. 4841, Instrument Design and Performance for Optical/Infrared Ground-based Telescopes. pp 1463–1471, doi:10.1117/12.460312
- Caleb & Keane (2021) Caleb M., Keane E., 2021, Universe, 7, 453
- Caleb et al. (2020) Caleb M., et al., 2020, MNRAS, 496, 4565
- Camilo et al. (2018) Camilo F., et al., 2018, ApJ, 856, 180
- Campisi & Li (2008) Campisi M. A., Li L.-X., 2008, MNRAS, 391, 935
- Charlot et al. (2020) Charlot P., et al., 2020, A&A, 644, A159
- Chatterjee (2021) Chatterjee S., 2021, Astronomy and Geophysics, 62, 1.29
- Chatterjee et al. (2017) Chatterjee S., et al., 2017, Nature, 541, 58
- Cook et al. (2023) Cook A. M., et al., 2023, ApJ, 946, 58
- Cordes & Chatterjee (2019) Cordes J. M., Chatterjee S., 2019, ARA&A, 57, 417
- Cordes & Lazio (2001) Cordes J. M., Lazio T. J. W., 2001, ApJ, 549, 997
- Cordes & Lazio (2002) Cordes J. M., Lazio T. J. W., 2002, arXiv e-prints, pp astro–ph/0207156
- Cordes & McLaughlin (2003) Cordes J. M., McLaughlin M. A., 2003, ApJ, 596, 1142
- Cordes et al. (2022) Cordes J. M., Ocker S. K., Chatterjee S., 2022, ApJ, 931, 88
- Crawford et al. (2010) Crawford S. M., et al., 2010, in Silva D. R., Peck A. B., Soifer T. B., eds, Proc. SPIEVol. 7737, Observatory Operations: Strategies, Processes, and Systems III. p. 773725, doi:10.1117/12.857000
- Dewey et al. (1985) Dewey R. J., Taylor J. H., Weisberg J. M., Stokes G. H., 1985, ApJ, 294, L25
- Driessen et al. (2020) Driessen L. N., et al., 2020, MNRAS, 491, 560
- Driessen et al. (2022a) Driessen L. N., et al., 2022a, MNRAS,
- Driessen et al. (2022b) Driessen L. N., Williams D. R. A., McDonald I., Stappers B. W., Buckley D. A. H., Fender R. P., Woudt P. A., 2022b, MNRAS, 510, 1083
- Eftekhari & Berger (2017) Eftekhari T., Berger E., 2017, ApJ, 849, 162
- Fender et al. (2016) Fender R., et al., 2016, in Taylor R., Camilo F., Leeuw L., Moodley K., eds, MeerKAT Science: On the Pathway to the SKA. p. 13 (arXiv:1711.04132)
- Foreman-Mackey et al. (2013) Foreman-Mackey D., Hogg D. W., Lang D., Goodman J., 2013, PASP, 125, 306
- Gaia Collaboration et al. (2016) Gaia Collaboration et al., 2016, A&A, 595, A1
- Gaia Collaboration et al. (2022) Gaia Collaboration et al., 2022, A&A, 667, A148
- Gaia Collaboration et al. (2023) Gaia Collaboration et al., 2023, A&A, 674, A1
- Gordon et al. (2023) Gordon A. C., et al., 2023, ApJ, 954, 80
- Heintz et al. (2020) Heintz K. E., et al., 2020, ApJ, 903, 152
- Hewitt et al. (2020) Hewitt D. M., et al., 2020, MNRAS, 496, 2542
- Hotan et al. (2021) Hotan A. W., et al., 2021, Publ. Astron. Soc. Australia, 38, e009
- James et al. (2022a) James C. W., Prochaska J. X., Macquart J. P., North-Hickey F. O., Bannister K. W., Dunning A., 2022a, MNRAS, 509, 4775
- James et al. (2022b) James C. W., et al., 2022b, MNRAS, 516, 4862
- Jankowski (2022) Jankowski F., 2022, Scatfit: Scattering fits of time domain radio signals (Fast Radio Bursts or pulsars), Astrophysics Source Code Library, record ascl:2208.003 (ascl:2208.003)
- Jankowski et al. (2019) Jankowski F., et al., 2019, MNRAS, 484, 3691
- Jankowski et al. (2022) Jankowski F., et al., 2022, in Ruiz J. E., Pierfedereci F., Teuben P., eds, Astronomical Society of the Pacific Conference Series Vol. 532, Astronomical Society of the Pacific Conference Series. p. 273 (arXiv:2012.05173)
- Jankowski et al. (2023) Jankowski F., et al., 2023, MNRAS, 524, 4275
- Japelj et al. (2016) Japelj J., Vergani S. D., Salvaterra R., Hunt L. K., Mannucci F., 2016, A&A, 593, A115
- Kelly et al. (2014) Kelly P. L., Filippenko A. V., Modjaz M., Kocevski D., 2014, ApJ, 789, 23
- Kirsten et al. (2022) Kirsten F., et al., 2022, Nature, 602, 585
- Law et al. (2020) Law C. J., et al., 2020, ApJ, 899, 161
- Lunnan et al. (2014) Lunnan R., et al., 2014, ApJ, 787, 138
- Luo et al. (2020) Luo R., et al., 2020, Nature, 586, 693
- Ma et al. (1998) Ma C., et al., 1998, AJ, 116, 516
- Macquart et al. (2020) Macquart J. P., et al., 2020, Nature, 581, 391
- Maiolino et al. (2008) Maiolino R., et al., 2008, A&A, 488, 463
- Marcote et al. (2017) Marcote B., et al., 2017, ApJ, 834, L8
- Marcote et al. (2020) Marcote B., et al., 2020, Nature, 577, 190
- Marcote et al. (2021) Marcote B., et al., 2021, The Astronomer’s Telegram, 14603, 1
- McConnell et al. (2012) McConnell D., Sadler E. M., Murphy T., Ekers R. D., 2012, MNRAS, 422, 1527
- McMullin et al. (2007) McMullin J. P., Waters B., Schiebel D., Young W., Golap K., 2007, in Shaw R. A., Hill F., Bell D. J., eds, Astronomical Society of the Pacific Conference Series Vol. 376, Astronomical Data Analysis Software and Systems XVI. p. 127
- Meyer et al. (2017) Meyer M., Robotham A., Obreschkow D., Westmeier T., Duffy A. R., Staveley-Smith L., 2017, Publ. Astron. Soc. Australia, 34, 52
- Michilli et al. (2018) Michilli D., et al., 2018, Nature, 553, 182
- Newville et al. (2016) Newville M., Stensitzki T., Allen D. B., Rawlik M., Ingargiola A., Nelson A., 2016, Lmfit: Non-Linear Least-Square Minimization and Curve-Fitting for Python (ascl:1606.014)
- Nimmo et al. (2022a) Nimmo K., et al., 2022a, Nature Astronomy, 6, 393
- Nimmo et al. (2022b) Nimmo K., et al., 2022b, ApJ, 927, L3
- Niu et al. (2022) Niu C. H., et al., 2022, Nature, 606, 873
- Ochsenbein et al. (2000) Ochsenbein F., Bauer P., Marcout J., 2000, A&AS, 143, 23
- Offringa (2010) Offringa A. R., 2010, AOFlagger: RFI Software (ascl:1010.017)
- Offringa et al. (2012) Offringa A. R., van de Gronde J. J., Roerdink J. B. T. M., 2012, A&A, 539
- Offringa et al. (2014) Offringa A. R., et al., 2014, MNRAS, 444, 606
- Oswald et al. (2021) Oswald L. S., et al., 2021, MNRAS, 504, 1115
- Palmerio et al. (2019) Palmerio J. T., et al., 2019, A&A, 623, A26
- Pei (1992) Pei Y. C., 1992, ApJ, 395, 130
- Perley et al. (2011) Perley R. A., Chandler C. J., Butler B. J., Wrobel J. M., 2011, ApJ, 739, L1
- Petroff et al. (2019) Petroff E., Hessels J. W. T., Lorimer D. R., 2019, A&ARv, 27, 4
- Petroff et al. (2022) Petroff E., Hessels J. W. T., Lorimer D. R., 2022, A&ARv, 30, 2
- Petrov et al. (2011) Petrov L., Phillips C., Bertarini A., Murphy T., Sadler E. M., 2011, MNRAS, 414, 2528
- Prochaska et al. (2019) Prochaska J. X., et al., 2019, Science, 366, 231
- Rajwade et al. (2022) Rajwade K. M., et al., 2022, MNRAS, 514, 1961
- Ravi (2023) Ravi V., 2023, The Astronomer’s Telegram, 16191, 1
- Ravi et al. (2019) Ravi V., et al., 2019, Nature, 572, 352
- Ravi et al. (2023) Ravi V., et al., 2023, arXiv e-prints, p. arXiv:2301.01000
- Rhodes et al. (2020) Rhodes L., et al., 2020, MNRAS, 496, 3326
- Riad et al. (2010) Riad I. F., Kraan-Korteweg R. C., Woudt P. A., 2010, MNRAS, 401, 924
- Robitaille & Bressert (2012) Robitaille T., Bressert E., 2012, APLpy: Astronomical Plotting Library in Python, Astrophysics Source Code Library (ascl:1208.017)
- Rowlinson et al. (2022) Rowlinson A., et al., 2022, MNRAS, 517, 2894
- Russell et al. (2019) Russell T. D., et al., 2019, ApJ, 883, 198
- Ryder et al. (2023) Ryder S. D., et al., 2023, Science, 382, 294
- Salpeter (1955) Salpeter E. E., 1955, ApJ, 121, 161
- Sanidas et al. (2018) Sanidas S., Caleb M., Driessen L., Morello V., Rajwade K., Stappers B. W., 2018, in Weltevrede P., Perera B. B. P., Preston L. L., Sanidas S., eds, Vol. 337, Pulsar Astrophysics the Next Fifty Years. pp 406–407, doi:10.1017/S1743921317009310
- Schlafly & Finkbeiner (2011) Schlafly E. F., Finkbeiner D. P., 2011, ApJ, 737, 103
- Schlafly et al. (2018) Schlafly E. F., et al., 2018, ApJS, 234, 39
- Skrutskie et al. (2006) Skrutskie M. F., et al., 2006, AJ, 131, 1163
- Swinbank et al. (2015) Swinbank J. D., et al., 2015, Astronomy and Computing, 11, 25
- Tasse et al. (2018) Tasse C., et al., 2018, A&A, 611
- Tendulkar et al. (2017) Tendulkar S. P., et al., 2017, ApJ, 834, L7
- Tiburzi et al. (2021) Tiburzi C., et al., 2021, A&A, 647, A84
- Tremou et al. (2020) Tremou E., et al., 2020, MNRAS, 493, L132
- Vergani et al. (2017) Vergani S. D., et al., 2017, A&A, 599, A120
- Wang et al. (2007) Wang N., Manchester R. N., Johnston S., 2007, MNRAS, 377, 1383
- Wenger et al. (2000) Wenger M., et al., 2000, Astronomy and Astrophysics Supplement Series, 143, 9
- Williams et al. (2020) Williams D. R. A., et al., 2020, MNRAS, 491, L29
- Wright et al. (2010) Wright E. L., et al., 2010, AJ, 140, 1868
- Yamasaki & Totani (2020) Yamasaki S., Totani T., 2020, ApJ, 888, 105
- Yao et al. (2017) Yao J. M., Manchester R. N., Wang N., 2017, ApJ, 835, 29
- Zhang (2018) Zhang B., 2018, ApJ, 854, L21
- van den Eijnden et al. (2022) van den Eijnden J., Fender R., Miller-Jones J. C. A., Russell T. D., Saikia P., Sivakoff G. R., Carotenuto F., 2022, MNRAS, 516, 2641
Appendix A Repeat observations of the GX 3394 field
| Date | # of images | Date | # of images | Date | # of images |
|---|---|---|---|---|---|
| 2018.09.28 | 27 | 2019.05.25 | 75 | 2020.01.03 | 75 |
| 2018.10.05 | 109 | 2019.05.31 | 74 | 2020.01.10 | 73 |
| 2018.10.11 | 112 | 2019.06.08 | 73 | 2020.01.20 | 75 |
| 2018.10.12 | 112 | 2019.06.16 | 74 | 2020.01.25 | 74 |
| 2018.10.19 | 109 | 2019.06.24 | 74 | 2020.02.02 | 73 |
| 2018.10.27 | 111 | 2019.06.30 | 75 | 2020.02.08 | 74 |
| 2018.11.03 | 112 | 2019.07.07 | 74 | 2020.02.15 | 75 |
| 2018.11.10 | 110 | 2019.07.14 | 73 | 2020.02.21 | 74 |
| 2018.11.17 | 112 | 2019.07.22 | 75 | 2020.03.02 | 73 |
| 2018.11.24 | 112 | 2019.07.27 | 74 | 2020.03.09 | 74 |
| 2018.12.08 | 111 | 2019.08.04 | 74 | 2020.03.14 | 75 |
| 2018.12.15 | 112 | 2019.08.10 | 75 | 2020.03.21 | 74 |
| 2018.12.22 | 112 | 2019.08.16 | 74 | 2020.03.29 | 74 |
| 2018.12.29 | 111 | 2019.08.23 | 56 | 2020.04.03 | 31 |
| 2019.01.05 | 112 | 2019.08.31 | 75 | 2020.04.10 | 75 |
| 2019.01.12 | 112 | 2019.09.07 | 74 | 2020.04.18 | 73 |
| 2019.01.19 | 112 | 2019.09.14 | 74 | 2020.04.25 | 74 |
| 2019.01.26 | 112 | 2019.09.21 | 74 | 2020.05.01 | 74 |
| 2019.02.01 | 111 | 2019.09.29 | 74 | 2020.05.09 | 74 |
| 2019.02.09 | 111 | 2019.10.06 | 74 | 2020.05.17 | 74 |
| 2019.02.16 | 111 | 2019.10.12 | 74 | 2020.06.08 | 75 |
| 2019.02.23 | 111 | 2019.10.19 | 74 | 2020.06.14 | 74 |
| 2019.03.01 | 11 | 2019.10.26 | 74 | 2020.06.17 | 73 |
| 2019.03.09 | 111 | 2019.11.01 | 73 | 2020.06.19 | 74 |
| 2019.03.18 | 72 | 2019.11.10 | 74 | 2020.06.26 | 74 |
| 2019.03.25 | 74 | 2019.11.17 | 74 | 2020.07.04 | 74 |
| 2019.04.01 | 59 | 2019.11.24 | 74 | 2020.07.12 | 75 |
| 2019.04.09 | 64 | 2019.11.30 | 74 | 2020.07.19 | 74 |
| 2019.04.15 | 75 | 2019.12.02 | 111 | 2020.07.26 | 75 |
| 2019.04.20 | 74 | 2019.12.07 | 74 | 2020.08.01 | 74 |
| 2019.04.29 | 73 | 2019.12.15 | 74 | 2020.08.08 | 74 |
| 2019.05.05 | 60 | 2019.12.20 | 74 | 2020.08.15 | 74 |
| 2019.05.11 | 72 | 2019.12.28 | 74 | 2020.08.22 | 75 |
| 2019.05.18 | 74 |