Evidence for Coherent Curvature Radiation in PSR J16450317 with Disordered Distribution of Polarization Position Angle
Abstract
The diverse polarization properties in pulsars are in conflict with applying a unique emission mechanism to the population. The polarization position angle (PPA) traverse in most pulsars shows a S-shaped curve that can be interpreted using the rotating vector model (RVM) as the radio emission being directed either parallel or perpendicular to the divergent magnetic field lines and argues for a coherent curvature radiation mechanism from charge bunches in a strongly magnetized pair plasma. However, in a subset of pulsars the radio emission is significantly depolarized and the PPA shows a complex pattern which cannot be explained using RVM. We propose that even in such cases the highly polarized time samples in the single pulses should follow the RVM with possibly two parallel tracks separated by 90°. We have investigated PSR J16450317, with complex PPA traverse, and demonstrated for the first time that considering only the highly polarized time samples in the single pulses, the PPA distribution clearly follows the RVM. We conclude that this strongly favour the coherent curvature radiation mechanism to be universally applicable in the pulsar population.
keywords:
pulsars: general1 Introduction
Radio pulsar polarization features provide insights into the properties of relativistic pair plasma in ultra-strong magnetic fields. However, pulsar polarization properties are still poorly understood. The linearly polarized radio emission from pulsars exhibits a polarization position angle (PPA) across the pulsar profile, which usually follows a characteristic S-shaped curve in normal pulsars (period s) and can be explained using the rotating vector model (Radhakrishnan & Cooke, 1969, hereafter RVM), where the PPA traces the change in the dipolar magnetic field line planes. The PPA behaviour shows significant variation in the pulsar population and can be broadly divided into three categories (Mitra et al., 2016a) The first category, which we term as , appears in more energetic pulsars, with spin-down energy loss () in excess of 1034 erg s-1. The average profile has linear polarization greater than 80 percent, and the PPA traverse resembles one single S-shaped curve following the RVM. The second group, , has intermediate energies erg s-1, and usually has much lower average linear polarization at around 20 percent. The PPA shows complex pattern both in the average profile as well as the single pulse distribution that do not conform to RVM. The final category, , is seen in low energetic pulsars with erg s-1, and has intermediate levels of linear polarization around 30-40 percent. The average PPA traverse can show both a S-shaped curve as well as a complex pattern, however, the single pulse PPA distribution clearly shows the presence of two orthogonal S-shaped tracks with 90° separation.
The RVM in radio pulsars suggests both synchrotron and curvature radiation as possible mechanisms. Synchrotron emission has been deemed unsuitable since the extremely ordered magnetic fields required, can only occur well inside the light cylinder where the synchrotron frequency is outside the radio frequency range (Radhakrishnan, 1969). The vacuum curvature radiation is another possible emission mechanism that requires the electric field vectors to lie in the plane of the charge trajectory. Detailed measurements have shown the orientation of the emerging electric vectors in pulsars to be perpendicular to the dipolar magnetic field line plane (see e.g. Lai et al., 2001), thereby ruling out the vacuum curvature radiation as the likely emission mechanism. Hence, an alternative model like coherent curvature radiation, excited in electron-positron plasma by charge bunches, is preferred. This was first suggested by Ruderman & Sutherland (1975), where sparking discharges at the vacuum gap gave rise to a non-stationary plasma flow and subsequently the development of two stream instability of Langmuir mode could result in the formation of charge bunches. There were initial concerns regarding the stability of the charge bunches (Melrose, 1995), however, subsequent studies have shown that when modulational instability of Langmuir mode is considered, solutions for stable charge solitons can be obtained that resemble charge bunches (Melikidze & Pataraia, 1980; Melikidze et al., 2000; Gil et al., 2004; Lakoba et al., 2018; Rahaman et al., 2022b). Other ways of obtaining charge bunches include two-stream instability of counter-streaming pairs (Yang et al., 2020; Manthei et al., 2021), electrostatic oscillations during sparking events (Kumar & Bošnjak, 2020; Cruz et al., 2021b) or recent studies of global magnetospheric simulations in the polar cap region (Bransgrove et al., 2022).
The eigen-modes of the dielectric response tensor in a strongly magnetized electron-positron plasma consist of two sub-luminal, linearly polarized modes (see e.g. Arons & Barnard, 1986) : the purely electromagnetic, transverse, -mode, and the longitudinal-transverse, -mode, (using terminology from Shapakidze et al., 2003). The electric field vector of the -mode, , is perpendicular to the plane of the wave-vector, , and local magnetic field, , hence . The electric field vector of the -mode, , is parallel to the plane containing and , and as a result has a component along . If then the two modes coincide. The coherent curvature emission can only excite these two eigen-modes of the surrounding plasma (Gil et al., 2004). Due to differences in their refractive indices the two modes split-up during propagation in the plasma. The -mode, which is seven times stronger, is ducted along the magnetic field lines and is unable to escape from a homogeneous plasma, contrary to the -mode which can freely propagate in it (Gil et al., 2004; Melikidze et al., 2014; Rahaman et al., 2022a). But the magnetospheric plasma, comprising of columns with variable density, is not expected to be homogeneous (Gil et al., 2003; Cruz et al., 2021a). Hence, a part of the -mode is expected to escape from the dense inhomogeneous plasma along with the -mode and propagate as electromagnetic waves, namely the ordinary, O-mode, and extraordinary, X-mode, polarized parallel and perpendicular to the magnetic field line planes, respectively (see Melikidze et al., 2014; Melrose et al., 2021a).
The radio emission from pulsars originates due to a large number of charged bunches emitting coherently, with the observed polarization feature obtained from incoherent addition of orthogonally polarized waves from these bunches. If one of the modes (most likely the -mode) is significantly damped, then S-shaped PPA traverse similar to the category of pulsars will be observed. When two orthogonal modes with random amplitudes are incoherently added, one expects the observed polarization behaviour to exhibit large scatter with complex PPA as seen in the category of pulsars. Under certain conditions both the orthogonal modes emerge from the plasma and two PPA tracks across the pulse window, separated by 90°, is observed, and corresponds to the category. The above model also clearly predicts that during instances when the observed signal is nearly 100% linearly polarized, i.e. no significant effect of depolarization takes place due to incoherent mixing of the orthogonal modes, the PPA should follow the RVM. Mitra et al. (2009) and Melikidze et al. (2014) showed that the highly linearly polarized single pulses from several pulsars, in the and category, have PPA which can be modelled by the RVM. This was considered as conclusive observational evidence for the coherent curvature radiation as the radio emission mechanism for highly linearly polarized signals in these pulsars. While it is possible that the emission mechanism for weakly polarized pulses are also due to coherent curvature radiation, nonetheless, as discussed in Eilek & Hankins (2016); Melrose & Rafat (2017); Melrose et al. (2021b), the conclusion about the emission mechanism might not be so straightforward and these pulses can have a different underlying emission mechanism. In this work we have analyzed the highly linearly polarized signals from the bright pulsar, PSR J16450317, which belongs to the category, to test the applicability of the coherent curvature radiation mechanism in it.
2 Observation & Analysis
 |
 |
| (a) | (b) |
 |
 |
| (c) | (d) |
 |
 |
| (e) | (f) |
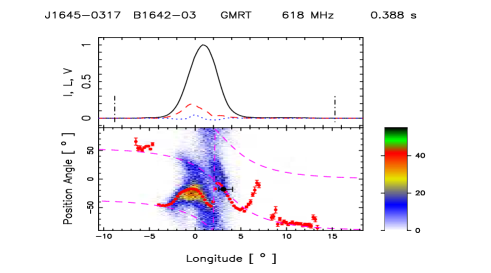
We have used archival observations of PSR J16450317 at 618 MHz observed in Meterwavelength Single-pulse Polarimetric Emission Survey (MSPES, Mitra et al., 2016a) conducted with the Giant Meterwave Radio Telescope to investigate the single pulse polarization behaviour. PSR J16450317 is classified as a normal pulsar with seconds, characteristic age 3.45 Myr and ergs s-1. The pulsar is relatively bright with average flux density at 618 MHz, = 291.28.1 mJy (Basu et al., 2021). PSR J1645-0317 was observed on 7 March, 2014, continuously for 14 minutes, resulting in 2154 single pulses. The minimum time resolution of polarization observation from GMRT was 0.246 milliseconds. This resulted in 1577 phase-bins across the pulsar period and 103 phase-bins across the pulse window. The baseline noise levels in the average profile was estimated to be 2.2 mJy, which ensured that the single pulses were detected with high sensitivity for polarization studies. The standard polarization calibrator, PSR B1929+10, was observed every two hours to account for variations, if any, in the polarization response of the telescope receiver system and obtain the four stokes parameters (). Using the definition in MSPES we obtain the average linear polarization, , circular polarization, , and PPA, , for different phase longitudes, , across the pulse profile.
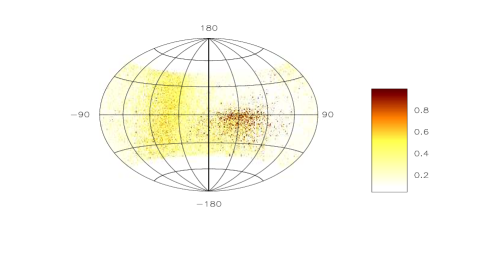
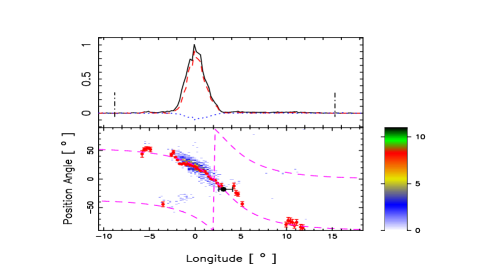
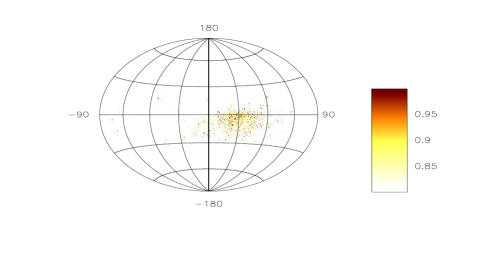
The polarization behaviour is summarized in Fig.1 where we have estimated three different realizations, the entire single pulse sequence in top panels (a) and (b), the highly polarized signals with linear polarization level above 80 percent in middle panels (c) and (d), and time sample with polarization less than 70 percent in bottom panels (e) and (f). The top window in left panels (a), (c) and (e) shows the average behaviour, including the total intensity profile (black line) the average linear polarization (red dashed line) and average circular polarization (blue dotted line). The bottom window in each case shows the PPA distribution of the time samples corresponding to the phase-bins across the pulse window. The PPA distribution considered polarized time samples in the single pulses with linear polarization above three times the baseline noise levels, while the average PPA (red error bars) used similarly significant signals from the average profile. The colour scheme for the PPA plots correspond to the number of time samples in the distribution. The right panels (b), (d) and (f) presents the stokes parameters as the Hammer-Aitoff projection of the Poincaré sphere for the different times samples, with the colour scheme showing the fractional polarization level, . Note that out selection criteria yielded 36678 PPA time samples in panels (a) and (b), 1057 samples in panels (c) and (d), and 34604 samples in panels (e) and (f).
3 Results
3.1 Profile Classification and RVM estimate
The average profile of PSR J16450317 shows one prominent component which resembles the core emission in the core-cone model of the pulsar emission beam (Rankin, 1993). The conal component is weaker at meterwavelengths but much more prominent at higher frequencies and the pulsar has been classified as a Triple profile. Basu et al. (2022) showed that the central component has a steeper spectra compared to the surrounding conal emission with relative spectral index , a characteristic feature of the core emission.
In RVM, the PPA, , at pulse phase, , is related to the angle between the rotation axis and magnetic axis, , and the angle between the magnetic axis and the line of sight (LOS), , as :
| (1) |
Here and are the phase offsets for the PPA and the pulse phase, respectively. The core emission lies at the center of the emission beam and entails the LOS traverse to be close to the magnetic axis. As a result the steepest gradient (SG) point of the PPA traverse in core pulsars.
Earlier it has not been possible to estimate the RVM fits in category pulsars, like PSR J16450317, due to their complex PPA traverses. However, we have now shown in Fig.1(c) that by considering only highly polarized signals the resulting PPA traverse closely resemble the RVM, with a narrow spread and a dominating polarization mode. The Hammer-Aitoff projection in Fig.1(d) also shows these time samples to be distributed around the equator, suggesting high levels of linear polarization. The density is highest at the center of the tracks, and has time samples with percent circularly polarized power. Fig.1(c) also shows the RVM fits of eq.(1), to the modified PPA and we have estimated . The high SG value of the PPA traverse provides further evidence for the central component to be core emission.
3.2 Orthogonal and Non-Orthogonal Polarization Modes
Fig.1(c) shows in addition to the dominant PPA distribution a second clustering around , which raises the possibility of detecting the orthogonal mode. However, on closer inspection we found this grouping to be separated by around 60° with respect to the dominant mode and not 90°as would be expected for an orthogonal mode. Additionally, these points are elliptically polarized with more that 20% circular polarization. We conclude these points do not correspond to the orthogonal mode in general but is reminiscent of the polarization mixing. It is likely that the occurrence of orthogonal polarization mode is rare in this pulsar and longer observations with higher sensitivity would be required to clearly identify them.
3.3 Radio Emission Height
Using effects of aberration and retardation (Blaskiewicz et al., 1991), the radio emission height can be estimated as km, where is speed of light in km s-1 and is in seconds. Here, , being the center of the profile and is the location of the SG point of the PPA, obtained from RVM fits (see eq.1). In well defined profiles, is obtained from the leading and trailing edges, which correspond to the last open dipolar field lines (Mitra & Li, 2004). However, in PSR J16450317 the outer conal components are weak at 618 MHz and leads to erroneous detections. On the other hand the identification of the central component as core, allowed us to use its peak location as an alternate estimate of . We found and the corresponding core emission height km. Since RVM is independent of emission height, the emission across the profile is expected to arise from similar heights km, consistent with the height obtained for normal pulsars (von Hoensbroech & Xilouris, 1997; Weltevrede & Johnston, 2008; Mitra et al., 2016b).
4 Discussion
It is difficult to reconcile the disordered PPA distributions in the category of pulsars as they do not seem to follow the RVM. Our analysis of the highly polarized time samples in PSR J16450317 shows the PPA to exhibit a S-shaped curve consistent with the RVM fits. In addition, we were able to estimate the radio emission height to be well below 10 percent of the light cylinder radius, which is typical for normal pulsars. These results clearly demonstrate that radio emission mechanism for highly polarized time samples is identical in the pulsar population including the category that exhibit disordered PPA distributions in the average profile. The single pulse polarization studies of Mitra et al. (2009) showed that the only viable emission mechanism that can explain the RVM behaviour of the PPA traverse of highly polarized pulses is coherent curvature radiation from charge bunches, and hence this mechanism may be universally applicable to the entire normal pulsar population.
The theory of coherent curvature radiation from charge bunches has been developed for the model of plasma being generated from sparking discharges, where charge bunches are formed in dense, spark-associated, pair plasma clouds (Melikidze et al., 2000; Gil et al., 2004). The coherent curvature radiation in PSR J16450317 gives estimate of the Lorentz factor, , of charge bunches as , where the characteristic frequency is the observing frequency, MHz, is the velocity of light, cm the radius of curvature at the radio emission height km. Further, the observed emission is generated by a large number of charge bunches, even at the smallest time resolution of observation.
The characteristic plasma frequency in the clouds can be estimated as GHz. In PSR J16450317, s, and using multiplicity and km, we obtain GHz which is significantly larger than 600 MHz. The charge bunches excite the linearly polarized -mode and -mode, which separates in the plasma cloud and eventually escapes as electromagnetic waves from the edge of the plasma cloud boundary, where large plasma density gradient exist, into the low density inter cloud region. Due to the presence of large number of charge bunches, the resultant linear polarization is likely to be an incoherent addition of the X-mode and O-mode, and provides a possible explanation for the significant depolarization and the disordered PPA distribution observed in PSR J16450317 (see Fig.1, lower panels). It is statistically likely that at certain instances one of the modes is suppressed and the corresponding emission will show high levels of polarization with PPA showing RVM nature (see Fig.1, middle panels).
Generally the plasma waves corresponding to the X-mode (-mode) and O-mode (-mode) are polarized perpendicular and parallel to the plane of the local magnetic field and the wave-vector, respectively. If we presume the existence of an isolated source emitting either the -mode or -mode excited by some unknown emission mechanism, then depending on the mutual orientation of the wave-vector and magnetic field one can indeed observe the linearly polarized emission and S-shaped nature of the PPA. On the other hand if there exist a large number of elementary emitters instead of a single one, then incoherent addition of the -mode (or -mode) will result in depolarization and disordered PPA distribution. However, the observations reported here clearly show that even in the smallest time resolution bin, the PPA corresponding to the highly linearly polarized emission traces the plane of the curved dipole magnetic field line plane in accordance with the RVM. This leaves us with the only possibility that all elementary emitters that radiate the -mode (or -mode), are polarized in a particular way, i.e. perpendicular (or parallel) to the local curved magnetic field line plane. The only known mechanism that makes this possible is curvature radiation.
The coherent curvature radiation mechanism can explain the overall observed linear polarization features in principle by an incoherent superposition of the -mode and -mode. However, only in the case of highly linearly polarized signals, the RVM fits to the PPA provide conclusive evidence for the presence of curvature radiation. In PSR J16450317 a majority of the time samples do not follow the RVM and have polarization fraction below 70%. In these cases we cannot exclude the possibility that they might be formed due to an alternative emission mechanism operating alongside the curvature radiation mechanism.
5 Summary
In this work we have demonstrated that the PPA corresponding to signals that show high levels of linear polarization, closely follow the RVM, even in pulsars that have complex PPA traverse. This clearly suggests that the highly linearly polarized radio emission from pulsars are akin to the properties of the eigen-modes corresponding to the -mode and the -mode of electron-positron plasma in strong magnetic field, excited by coherent curvature radiation from charge bunches. We propose that these modes can escape as perpendicularly polarized extraordinary waves and parallelly polarized ordinary waves, with respect to magnetic field line planes, in an inhomogeneous plasma with plasma density gradients. The detailed model of how the -mode and the -mode escape from the boundary between plasma clouds will be explored in a future work.
acknowledgments
We thank the anonymous referee for helpful comments that improved the quality of the manuscript. We thank the staff of the GMRT that made these observations possible. D.M. acknowledges the support of the Department of Atomic Energy, Government of India, under project No. 12-R&D-TFR-5.02-0700. D.M. acknowledges funding from the grant “Indo-French Centre for the Promotion of Advanced Research - CEFIPRA” grant IFC/F5904-B/2018. This work was supported by grant 2020/37/B/ST9/02215 from the National Science Center, Poland.
Data availability
The data underlying this article will be shared on reasonable request to the corresponding author.
References
- Arons & Barnard (1986) Arons J., Barnard J. J., 1986, ApJ, 302, 120
- Basu et al. (2021) Basu R., Mitra D., Melikidze G. I., 2021, ApJ, 917, 48
- Basu et al. (2022) Basu R., Mitra D., Melikidze G. I., 2022, ApJ, 927, 208
- Blaskiewicz et al. (1991) Blaskiewicz M., Cordes J. M., Wasserman I., 1991, ApJ, 370, 643
- Bransgrove et al. (2022) Bransgrove A., Beloborodov A. M., Levin Y., 2022, arXiv e-prints, arXiv:2209.11362
- Cruz et al. (2021a) Cruz F., Grismayer T., Chen A. Y., Spitkovsky A., Silva L. O., 2021a, ApJ, 919, L4
- Cruz et al. (2021b) Cruz F., Grismayer T., Silva L. O., 2021b, ApJ, 908, 149
- Eilek & Hankins (2016) Eilek J. A., Hankins T. H., 2016, Journal of Plasma Physics, 82, 635820302
- Gil et al. (2004) Gil J., Lyubarsky Y., Melikidze G. I., 2004, ApJ, 600, 872
- Gil et al. (2003) Gil J., Melikidze G. I., Geppert U., 2003, A&A, 407, 315
- Kumar & Bošnjak (2020) Kumar P., Bošnjak Ž., 2020, MNRAS, 494, 2385
- Lai et al. (2001) Lai D., Chernoff D. F., Cordes J. M., 2001, ApJ, 549, 1111
- Lakoba et al. (2018) Lakoba T., Mitra D., Melikidze G., 2018, MNRAS, 480, 4526
- Manthei et al. (2021) Manthei A. C., Benáček J., Muñoz P. A., Büchner J., 2021, A&A, 649, A145
- Melikidze et al. (2000) Melikidze G. I., Gil J. A., Pataraya A. D., 2000, ApJ, 544, 1081
- Melikidze et al. (2014) Melikidze G. I., Mitra D., Gil J., 2014, ApJ, 794, 105
- Melikidze & Pataraia (1980) Melikidze G. I., Pataraia A. D., 1980, Astrofizika, 16, 161
- Melrose (1995) Melrose D. B., 1995, Journal of Astrophysics and Astronomy, 16, 137
- Melrose & Rafat (2017) Melrose D. B., Rafat M. Z., 2017, in Journal of Physics Conference Series, Vol. 932, Journal of Physics Conference Series, p. 012011
- Melrose et al. (2021a) Melrose D. B., Rafat M. Z., Mastrano A., 2021a, MNRAS, 500, 4549
- Melrose et al. (2021b) Melrose D. B., Rafat M. Z., Mastrano A., 2021b, MNRAS, 500, 4530
- Mitra et al. (2016a) Mitra D., Basu R., Maciesiak K., Skrzypczak A., Melikidze G. I., Szary A., Krzeszowski K., 2016a, ApJ, 833, 28
- Mitra et al. (2009) Mitra D., Gil J., Melikidze G. I., 2009, ApJ, 696, L141
- Mitra & Li (2004) Mitra D., Li X. H., 2004, A&A, 421, 215
- Mitra et al. (2016b) Mitra D., Rankin J., Arjunwadkar M., 2016b, MNRAS, 460, 3063
- Radhakrishnan (1969) Radhakrishnan V., 1969, Publ. Astron. Soc. Australia, 1, 254
- Radhakrishnan & Cooke (1969) Radhakrishnan V., Cooke D. J., 1969, Astrophys. Lett., 3, 225
- Rahaman et al. (2022a) Rahaman S. M., Mitra D., Melikidze G. I., 2022a, MNRAS, 512, 3589
- Rahaman et al. (2022b) Rahaman S. M., Mitra D., Melikidze G. I., Lakoba T., 2022b, MNRAS, 516, 3715
- Rankin (1993) Rankin J. M., 1993, ApJ, 405, 285
- Ruderman & Sutherland (1975) Ruderman M. A., Sutherland P. G., 1975, ApJ, 196, 51
- Shapakidze et al. (2003) Shapakidze D., Machabeli G., Melikidze G., Khechinashvili D., 2003, Phys. Rev. E, 67, 026407
- von Hoensbroech & Xilouris (1997) von Hoensbroech A., Xilouris K. M., 1997, A&A, 324, 981
- Weltevrede & Johnston (2008) Weltevrede P., Johnston S., 2008, MNRAS, 391, 1210
- Yang et al. (2020) Yang Y.-P., Zhu J.-P., Zhang B., Wu X.-F., 2020, ApJ, 901, L13