Understanding Stationary and Moving Direct Skin Vibrotactile Stimulation on the Palm
Abstract.
Palm-based tactile displays have the potential to evolve from single motor interfaces (e.g., smartphones) to high-resolution tactile displays (e.g., back-of-device haptic interfaces) enabling richer multi-modal experiences with more information. However, we lack a systematic understanding of vibrotactile perception on the palm and the influence of various factors on the core design decisions of tactile displays (number of actuators, resolution, and intensity). In a first experiment (N=16), we investigated the effect of these factors on the users’ ability to localize stationary sensations. In a second experiment (N=20), we explored the influence of resolution on recognition rate for moving tactile sensations. Findings show that for stationary sensations a 9 actuator display offers a good trade-off and a resolution can be accurately localized. For moving sensations, a resolution led to the highest recognition accuracy, while enables higher resolution output with a reasonable accuracy.
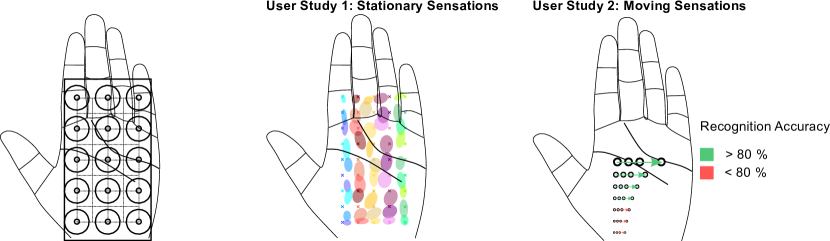
The figure shows three hands. The hand on the left has a grid with 15 vibrotactile actuators in a 3x5 grid on it. The hand in the middle shows the error ellipses from study 1 that resulted from localizing stationary sensations on the palm. The hand on the right shows seven moving sensations from study 2 that move towards the right. The sensations vary in length. The first 4 which are the longest resulted in recognition rates over 80%. The last three, also the shortest, resulted in recognition accuracies under 80%.
1. Introduction
From navigation (Yatani et al., 2012) and skin reading (Luzhnica and Veas, 2019) to movement guidance (Günther et al., 2018b; Marquardt et al., 2018) and haptic learning (Luzhnica et al., 2018; Gupta et al., 2016), research proposed palm-based vibrotactile displays as a promising output modality for a diverse set of use-cases. These interfaces are especially applicable in situations where multi-modal interaction is beneficial, where interaction with video and audio displays is infeasible or not recommended – e.g., while driving or riding a bike – or where subtle interaction is required – e.g., while holding a conversation. Research has started to explore how to encode information via vibrotactile patterns, that are either stationary at a fixed location or moving over time between various spatial locations.
One of the most promising locations for applying vibrotactile patterns is the palm due to high sensitivity and the frequency with which we use our hands to interact with the environment. Fundamental to the design of palm-based tactile displays is their resolution. Research has investigated the spatial acuity (2-point discrimination and point localization) (Mancini et al., 2014) of the human body to touch at various locations, including the palm. However, prior work has shown that vibrotactile sensations have a different spatial acuity than touch (Elsayed et al., 2020). This difference occurs because vibrations (1) activate the Pacinian corpuscle mechanoreceptors (Rowin and Meriggioli, 2007) with larger receptive fields and (2) propagate larger distances on the skin (Cholewiak and Collins, 2003), making them harder to localize. Thus, given that vibration is a commonly used modality in haptics research, we currently lack information on the perception of stationary and moving tactile sensations. This information is necessary for the design and usage of palm-based tactile displays.
In this paper, we contribute important insights on stationary and moving vibrotactile sensations on the palm. In a first experiment, we investigated the influence of the layout and number of actuators, intensity, and resolution on the localization error and perception of real and phantom stationary sensations. Based on the results, we determined that a resolution can be accurately localized on the palm. Nine vibration motors with a bigger (approximately 2:1 ratio) spacing along the length of the palm than the width should be used. We further observed that increasing the number of actuators to 15 resulted in a significant increase in correct perception of phantom sensations at a single location.
In a second experiment, we investigated moving sensations. In particular, we explored the influence of the resolution of the display and direction of movement on the recognition accuracy and reaction time of users. We observed that a resolution can be used for accurate interactions with moving sensations (recognition accuracy ¿ 95%). While a resolution can be used where more expressive tactile sensations are required (recognition accuracy ¿ 85%). Based on the findings of our two experiments, we contribute a set of design guidelines for vibrotactile output on the palm.
Taken together, the main contributions of this paper are:
-
(1)
Findings from a controlled user study investigating perception of stationary tactile sensations.
-
(2)
Findings from a controlled user study investigating perception of moving tactile sensations.
-
(3)
A set of design guidelines based on our findings to improve future vibrotactile displays on the palm.
2. Related Work
This work relates to prior research in measuring the spatial acuity of the palm, leveraging vibrotactile illusions, and work on stationary and moving tactile sensations on the palm.
2.1. Spatial Acuity of the Palm
Various aspects of vibrotactile perception have been investigated on the body, for example temporal aspects of perceiving vibrations as distinct (Petrosino and Fucci, 1989), the effect of the number of actuators on perceived intensity (Cholewiak, 1979a), and parameters effecting perception of patterns on the body (Cholewiak, 1979b). In the following, work related to vibrotactile spatial acuity of the palm is discussed. Research (Weinstein, 1968; Weber and Ross, 1978) has shown that the spatial acuity of the sense of touch varies across the body, with the palm being among the most sensitive body parts, superseded only by the fingertips (Mancini et al., 2014). Ever since the seminal work of Weber (Weber, 1834) on touch, spatial acuity has been measured by two-point discrimination thresholds. These refer to the minimum distance required between two simultaneous stimuli for them to be perceived as distinct. However, this wealth of knowledge cannot be used to inform the core design decisions of vibrotactile displays (e.g., spacing of actuators), as prior work has shown that spatial acuity of the body to vibrotactile stimulation is fundamentally different than touch (Elsayed et al., 2020). This is mainly due to vibrations activating mechanoreceptors with a larger receptive field (Pacinian corpuscle) (Rowin and Meriggioli, 2007) and the fact that vibrations propagate for larger distances on the skin (Cholewiak and Collins, 2003).
To overcome this, recent research has investigated vibrotactile perception on major body locations, e.g., forearm, upper arm, thigh, stomach, back, and leg (Elsayed et al., 2020). Findings show that the spatial acuity of the body to vibrotactile stimulation follows a similar trend to touch regarding the sensitivity of body locations, however, with considerably different absolute values. To the best of our knowledge, a systematic investigation of vibrotactile perception on the palm remains unexplored. The palm is a prime location for vibrotactile feedback due to high sensitivity and the frequency with which we use our hands to interact with the environment. Therefore, this work is concerned with measuring vibrotactile perception on the palm—localization error of stationary vibrations and recognition rate of moving sensations across resolutions—to inform the main decisions associated with the design and usage of palm-based tactile displays. Although several factors affect vibrotactile perception, e.g. body site, choice of actuator, and actuator mounting conditions, prior work has identified that the main factors that affect localization at a particular body site to be the number and spacing of actuators (Sofia and Jones, 2013).
2.2. Vibrotactile Illusions
Tactile illusions have proven to be useful in HCI applications due to their ability to generate sensations where no physical actuator is present, thus rendering high resolution spatial vibrotactile stimuli using a low resolution grid of actuators. The three most common tactile illusions are phantom sensations (Alles, 1970; Park and Choi, 2018), cutaneous rabbit (Geldard, 1977; Raisamo et al., 2009; Spelmezan et al., 2009; McDaniel et al., 2011), and apparent tactile motion (Sherrick and Rogers, 1966; Kirman, 1974; Burtt, 1917). Although all of these illusions can generate robust sensations, only phantom sensations have the ability to produce stationary and moving sensations. Therefore, in this work we use phantom sensations to increase the resolution of palm-based vibrotactile displays.
Also known as the funneling illusion, phantom sensations refer to the illusion where the perceived location of a vibration is controlled by varying intensity between two (1D phantom sensations) or more (2D phantom sensations) neighbouring vibrotactile actuators (Alles, 1970; Park and Choi, 2018). Tactile interfaces have leveraged phantom sensations to generate expressive patterns. Mango (Schneider et al., 2015), an authoring tool for creating vibrotactile patterns, uses direct manipulation of phantom sensations for designing and rendering 2D patterns. In Tactile Brush (Israr and Poupyrev, 2011), an algorithm is proposed and validated that uses phantom sensations and apparent tactile motion to generate high resolution 2D vibrotactile strokes.
2.3. Stationary Sensations on the Palm
There is a vast literature on work that has leveraged vibrotactile sensations on the body, e.g., on the hand (Gupta et al., 2016; Günther et al., 2018b; Lehtinen et al., 2012; Park and Choi, 2018; Günther et al., 2018a), wrist (Lee and Starner, 2010; Lee et al., 2015; Cauchard et al., 2016; Liao et al., 2016), forearm (Zhao et al., 2018; Luzhnica et al., 2017; Luzhnica and Veas, 2019; Reinschluessel et al., 2018; Pfeiffer et al., 2014; Schönauer et al., 2012), upperarm (Stratmann et al., 2018; Bark et al., 2015; Alvina et al., 2015), back (Israr and Poupyrev, 2011; Novich and Eagleman, 2015; Tan et al., 2003), stomach (Krüger et al., 2018), thigh (Spelmezan et al., 2009) and leg (Chen et al., 2018). This section outlines the most relevant related work that focuses on stationary sensations on the palm.
2.3.1. Layout & Number of Actuators
Palm-based tactile displays have taken many shapes, e.g.: spherical handles (Ryu et al., 2009), square/diamond arrangements (Rantala et al., 2011), and grids (Alvina et al., 2015; Park and Choi, 2018; Yatani et al., 2012; Yatani and Truong, 2009). The number of actuators ranged from one (Yannier et al., 2015) to 30 (Borst and Cavanaugh, 2004) with inter-actuator spacing varying depending on the display. In our work, we systematically investigate the influence of the layout and number of actuators on the perception of stationary sensations.
2.3.2. Resolution
Typically, prior work used a resolution that is defined by the number of real actuators on the palm (Alvina et al., 2015; Yatani and Truong, 2009; Rantala et al., 2011). However, approaches also exist that extend the resolution by leveraging phantom sensations (Park and Choi, 2018; Ryu et al., 2009). It is unclear, what the maximum resolution is, where accurate localization of stationary sensations is still possible. In our work, we systematically investigate the interdependency between localization accuracy and resolution and the extent to which phantom sensations can overcome the limits of physical resolution.
2.4. Moving Sensations on the Palm
In addition to stationary sensations, many approaches in the literature were introduced that focus on evaluating the utility of moving tactile sensations (Seo and Choi, 2015; Yang et al., 2010, 2011b, 2011a, 2012; Alvina et al., 2015; Park et al., 2016).
Prior work has used many different resolutions for generating moving sensations on the palm, ranging between grids of four (Seo and Choi, 2015) to 12 actuators (Yang et al., 2010, 2011b, 2011a, 2012). Recognition rates of moving sensations vary from 70-80% (Alvina et al., 2015; Yang et al., 2011a, 2012) up to above 90% (Alvina et al., 2015; Yang et al., 2010, 2011b), depending on the number of patterns, actuators, and inter-actuator spacing. While most work focuses on discriminating between a set of distinct patterns (Seo and Choi, 2015; Yang et al., 2010, 2011b, 2011a, 2012; Alvina et al., 2015), some approaches were aimed at providing a display for continuous sensations (Park et al., 2016).
In this paper, we aim to systematically investigate the influence of resolution on the vibrotactile perception (recognition rate) of users. This information is missing in the literature and is critical for the usage and design of palm-based vibrotactile displays.
3. User Study 1: Stationary Tactile Sensations
Spatial acuity of touch is different from that of vibrations (Elsayed et al., 2020). To get a better understanding of how we perceive vibrotactile stationary sensations on the palm, this user study aimed to answer the following research questions:
- RQ1:
-
How does the choice of configuration (number and layout of actuators) influence the localization accuracy and perception of vibrations? Prior work used many different configurations. It is unclear, how the choice of configuration effects the localization accuracy and perception of vibrations on the palm.
- RQ2:
-
How does the intensity of vibration affect the localization accuracy and perception of vibrations? We hypothesized that higher intensity vibrations increase localization error due to a wider area of propagation on the skin.
- RQ3:
-
The number of actuators and phantom sensations can increase the tactile resolution. How does the choice of resolution influence the localization accuracy? Prior work has utilized one resolution per configuration. It is unclear, how the choice of resolution influences the localization accuracy.
In this section, we describe our study design, the procedure, our participants, apparatus, dependent variables, and data analysis methods.
3.1. User Study Design
Throughout the user study we varied the following four independent variables:
- Configuration::
-
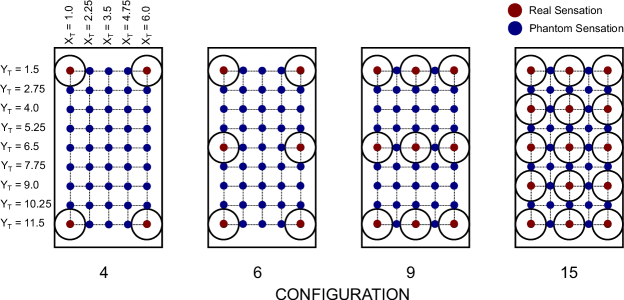
The number of vibration motors in the palm-based tactile display. Configuration has 4 levels: 4, 6, 9, and 15 vibration motors. Figure 2 illustrates the placement of the vibration motors in the grid. We chose grids as they are most frequently used (Alvina et al., 2015; Park and Choi, 2018; Yatani et al., 2012; Yatani and Truong, 2009) and because they enable the use of 2D phantom sensations (Park and Choi, 2018). The number of actuators was systematically varied by adding rows and columns.
- Intensity::
-
The intensity of the vibrations with 2 levels: 0.5 ( of the EAI C2 tactor) and 1.0 (vibrations with maximum amplitude of the EAI C2 tactor). All vibrations were performed at a fixed frequency ( (Park and Choi, 2018)) and lasted one second.
- Xt::
- Yt::
-
The stimulus position of the tactile sensation on the y-axis. Yt has 9 levels translating to 9 rows as shown in Figure 2. We chose 9 rows based on related work (Park and Choi, 2018) and to keep the same spacing as the x-axis. Depending on the configuartion, Xt, and Yt, the stimulus was either a real or phantom sensation. For generating phantom sensations, we used the same approach as Park and Choi (Park and Choi, 2018) as described in the next section.
The user study contained a total of 360 () conditions and followed a within subjects study design. We used an balanced latin square to counterbalance the variables configuration and intensity. For each combination of these independent variables, participants experienced 45 vibration locations (). The order of these locations was randomized and each location was repeated only once, resulting in a total of 360 trials per participant.
3.2. Generation of Phantom Sensations
To generate 1D and 2D phantom sensations we used an algorithm (Park and Choi, 2018) that controls the intensities of four actuators arranged in a grid to interpolate between them. The vibration intensity of an actuator i is calculated using the following equation.
where and are the horizontal and vertical distances from the target point to actuator i, respectively. is the target intensity of the phantom sensation. The algorithm is used to calculate the intensities of all four actuators involved in the generation of a 2D phantom sensation. In case of 1D phantom sensations, the actuators not involved in the generation of the sensation are inactive as or .
3.3. Apparatus
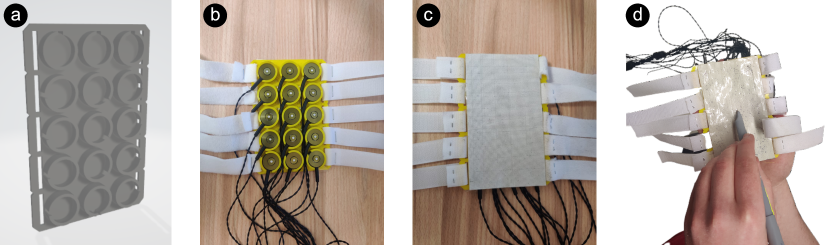
The prototype consisted of three parts: vibrotactile actuators, 3D printed case with smartpen paper attached to the backside, and a smartpen. We printed our prototype grids with a Prusa i3 MK3S+ using thermoplastic polyurethane (TPU) filament. The grids contained holders for attaching EAI C2 vibration motors (Hoggan and Brewster, 2007). Furthermore, the EAI C2 tactor featured a small contact spot (7.6 mm diameter) enclosed within a larger rigid cylindrical housing (30.5 mm diameter) that prevented the spread of vibration (Sofia and Jones, 2013). For input, we used a Neo Smartpen M1. A clear coating on top of the NeoLab paper prevented abrasion and visible marks of prior inputs. Five bands of Velcro tape on the sides of our prototypes allowed attachment on participants’ palms while ensuring that all vibration motors are in contact with the skin. Figure 3 shows a prototype used in our experiment.
The prototype was connected to an i7 dual core 3.6 GHz 16 GB RAM desktop PC, which ran the software used in our user study. The software consisted of a C# project that received data from the smartpen over Bluetooth and controlled the vibration motors over USB.
3.4. Procedure
After obtaining informed consent from the participants, we collected their demographic data. Then, we explained the task and provided a brief overview of the procedure. The task was to indicate the location of the vibration using the digital pen.
At the beginning, we asked participants to wear noise cancelling headphones playing white noise to prevent the sound of vibrations influencing their answers. Each trial started with the participant in a seated position with their hands resting on the armrest of the chair and their palm side up. All participants were right-handed and hence wore the grid on their left palm and held the pen in their right hand. After experiencing a vibration, the experimenter asked the participant if the vibration was at one location or more than one location. The experimenter explained to the participants that they should indicate after the number of perceived points after each trial before starting the experiment. Communication about the number of perceived points was accomplished using hand gestures so that participants were not required to remove the headphones after each trial. All stimuli were targeted at one location using real and phantom sensations. Participants were instructed to indicate a location in the middle if they perceived more than one vibration. Participants were further instructed to wait until the vibration was over before using the pen.
Participants took a break (approximately five minutes long) every 90 vibrations. This resulted in four breaks and a total duration of about 60 minutes for conducting the user study.
3.5. Dependent Variables
The following dependent variables were measured:
- Euclidean Distance::
-
The euclidean distance between the perceived and target location of the vibration.
- X Deviation::
-
The deviation on the x-axis between the target and perceived location.
- Y Deviation::
-
The deviation on the y-axis between target and perceived location.
- Accuracy::
-
The accuracy of localizing target location. A response is considered correct when the closest point is the target location.
- Number of perceived points::
-
The number of vibrations perceived by the user (binary: either one point or two or more points)
3.6. Participants
We recruited 16 right-handed participants (12 male and 4 female) aged between 20 and 32 years old (, ). None of the participants had prior experience with vibrotactile feedback beyond the everyday use of smartphones and game controllers and no sensory processing disorders were reported by our participants.
3.7. Data Analysis
After visually confirming that the data follows a normal distribution, we used four-way repeated measures (RM) ANOVAs with the factors configuration, intensity, Xt, and Yt to compute the F-score and p-value of main and interaction effects. Where Mauchly’s test indicated a violation of the assumption of sphericity, we used the Greenhouse Geisser method. We further report the generalized eta-squared as an estimate of the effect size and use Cohen’s suggestions to classify the effect size as small, medium or large (Cohen, 1988). If significant effects were found, we used pairwise t-tests with Tukey adjustment for post-hoc analysis. Furthermore, we report the estimated marginal mean (EMM) with 95% confidence intervals as proposed by Searle et al. (Searle et al., 1980).
4. User Study 1: Results
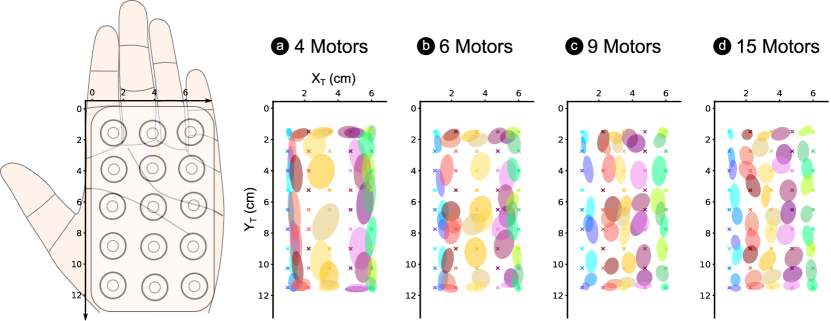
In the following, we report the results of our first user study as detailed in the prior section. We label key observations with [MF-#] for main effects and [IF-#] for interaction effects. The recorded location data is visualized in Figure 4.
4.1. Euclidean Distance
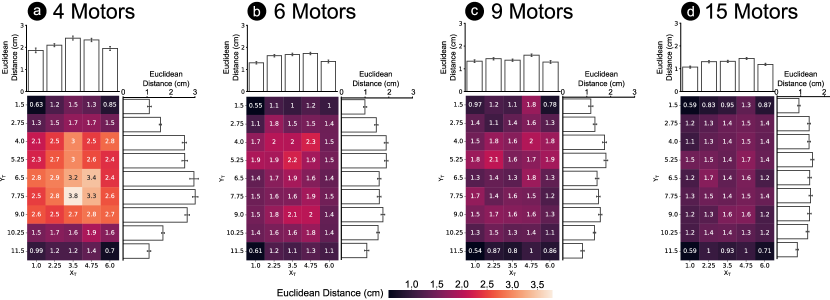
To get an understanding of the influence of the factors on the general localization accuracy of users, we measured the euclidean distance between target locations (Xt and Yt) and perceived locations. Figure 5 shows the results. Our analysis revealed no significant four-way and three-way interaction effects. We found two significant two-way interactions. In the following, we report the main effects and significant interaction effects.
4.1.1. configuration
[MF-1] The analysis showed a significant ( = 45.53, p ¡ .001) main effect of the factor configuration on the euclidean distance with a medium (=.10) effect size. We found that the 15 motors configuration (EMM = 1.28cm [1.16cm, 1.40cm]) resulted in the lowest errors, followed by the 9 motors configuration (EMM = 1.41cm [1.30cm, 1.52cm]), the 6 motors configuration (EMM = 1.54cm [1.45cm, 1.63cm]), and finally the 4 motors configuration (EMM = 2.12cm [1.93cm, 2.31cm]). Post-hoc tests confirmed significant differences between the 4 motors configuration and all other configurations (p ¡ .001) and between the 6 motors and 15 motors configurations (p ¡ .001).
4.1.2. intensity
We could not find a significant main effect for the factor intensity ( = 1.16, p ¿ 0.05) on the euclidean distance between 0.5 intensity (EMM = 1.60cm [1.50cm, 1.71cm]) and 1.0 intensity (EMM = 1.57cm [1.49cm, 1.65cm]).
4.1.3. Xt
[MF-2] Our analysis revealed a significant ( = 11.13, p ¡ .001) main effect of the factor Xt on the euclidean distance with a small (=.02) effect size. The euclidean distance was lowest for Xt at the edges of the vibration grid, Xt= 1.0 (EMM = 1.40cm [1.25cm, 1.54cm]), Xt= 6.0 (EMM = 1.45cm [1.29cm, 1.62cm]) and higher for locations in the middle: Xt= 2.25 (EMM = 1.62cm [1.53cm, 1.70cm]), Xt= 3.5 (EMM = 1.70cm [1.57cm, 1.82cm]), and Xt= 4.75 (EMM = 1.77cm [1.68cm, 1.87cm]).
4.1.4. Yt
[MF-3] The analysis revealed a significant ( = 41.98, p ¡ .001) main effect of the factor Yt on the euclidean distance with a medium (=.12) effect size. Similar to Xt, the lowest euclidean distances were at the top and bottom edges of the vibration grid: Yt= 1.5 (EMM = 1.06cm [0.88cm, 1.23cm]) and Yt= 11.5 (EMM = 0.97cm [0.83cm, 1.12cm]). Rows in the middle showed higher euclidean distances: Yt= 2.75 (EMM = 1.43cm [1.33cm, 1.54cm]), Yt= 4.0 (EMM = 1.88cm [1.75cm, 2.01cm]), Yt= 5.25 (EMM = 1.94cm [1.80cm, 2.08cm]), Yt= 6.5 (EMM = 1.84cm [1.66cm, 2.01cm]), Yt= 7.75 (EMM = 1.88cm [1.71cm, 2.04cm]), Yt= 9.0 (EMM = 1.83cm [1.70cm, 1.96cm]), and Yt= 10.25 (EMM = 1.46cm [1.35cm, 1.57cm]).
4.1.5. configuration : Xt
[IF-1] The analysis showed a significant ( = 2.30, p ¡ .05) interaction effect between the factors configuration and Xt with a small effect size (=.01). The euclidean error depended on the combination of configuration and Xt, with configurations using a lower number of actuators (4 and 6) showing significant differences (p ¡ .05) as Xt changes, and configurations using a higher number of actuators (9 and 15) showing comparable performance (p ¿ .05) across changing Xt.
4.1.6. configuration : Yt
[IF-2] The analysis revealed a significant ( = 9.12, p ¡ .001) interaction effect between the factors configuration and Yt with a medium effect size (=.06). The euclidean distance was significantly lower at the top and bottom edges of the grid for all configurations. However, for configurations using a lower number of actuators (4, 6, and 9), significant differences (p ¡ .05) were observed in the range 1.5 ¡ Yt¡ 11.5, whereas the configuration with the highest number of actuators (15) showed comparable performance (p ¿ .05).
4.2. X Deviation
To get a better understanding of the influence of the factors on users’ ability to localize sensations along the width of the palm, we analyzed the deviations in the x-axis between the target and perceived locations.
4.2.1. Configuration
[MF-4] The analysis revealed a significant ( = 21.06, p ¡ .001) main effect of the factor configuration on the recorded X deviation with a small (=.02) effect size. We found that the 9 motors configuration (EMM = 0.64cm [0.58cm, 0.71cm]) resulted in the lowest errors, followed by the 15 motors configuration (EMM = 0.66cm [0.58cm, 0.74cm]), the 6 motors configuration (EMM = 0.77cm [0.70cm, 0.83cm]), and finally the 4 motors configuration (EMM = 0.86cm [0.78cm, 0.94cm]). Post-hoc tests confirmed significantly decreasing X deviation going from a lower number of actuators (4,6) to a higher number of actuators (9,15) (p ¡ .001). X deviation was comparable for the configuration pairs (4,6) and (9,15).
4.2.2. Intensity
The analysis showed no significant ( = 0.26, p ¿ .05) main effect of the factor intensity on the X deviation. 0.5 intensity (EMM = 0.73cm [0.66cm, 0.79cm]) showed comparable X deviation to 1.0 intensity (EMM = 0.74cm [0.67cm, 0.80cm]).
4.2.3. Xt
[MF-6] The analysis revealed a significant ( = 23.51, p ¡ .001) main effect of the factor Xt on the X deviation with a medium (=.10) effect size. The X deviation was lowest for Xt at the left Xt= 1.0 (EMM = 0.48cm [0.36cm, 0.60cm]) and right Xt= 6.0 (EMM = 0.50cm [0.37cm, 0.64cm]) edges of the vibration grid. Locations in the middle showed higher X deviation: Xt= 2.25 (EMM = 0.83cm [0.78cm, 0.88cm]), Xt= 3.5 (EMM = 0.84cm [0.71cm, 0.98cm]), and Xt= 4.75 (EMM = 1.00cm [0.93cm, 1.07cm]). Post-hoc confirmed signficantly rising X deviation going from the edges (Xt= 1.0, Xt= 6.0) towards the middle (Xt= 2.25, Xt= 3.5, Xt= 4.75) (p ¡ .001).
4.2.4. Yt
We could not find a significant ( = 1.71, p ¿ .05) main effect of the factor Yt on the recorded X deviation. Comparable values for X deviation were observed across all levels: Yt= 1.5 (EMM = 0.68cm [0.62cm, 0.75cm]), Yt= 2.75 (EMM = 0.70cm [0.64cm, 0.75cm]), Yt= 4.0 (EMM = 0.75cm [0.68cm, 0.82cm]), Yt= 5.25 (EMM = 0.75cm [0.69cm, 0.82cm]), Yt= 6.5 (EMM = 0.79cm [0.69cm, 0.89cm]), Yt= 7.75 (EMM = 0.74cm [0.65cm, 0.83cm]), Yt= 9.0 (EMM = 0.73cm [0.65cm, 0.81cm]), Yt= 10.25 (EMM = 0.74cm [0.65cm, 0.83cm]), and Yt= 11.5 (EMM = 0.70cm [0.62cm, 0.79cm]).
4.3. Y Deviation
To get a better understanding of the influence of the factors on users’ ability to localize sensations along the length of the palm, we analyzed deviations in the y-axis between target and perceived locations.
4.3.1. Configuration
[MF-7] The analysis showed a significant ( = 37.23, p ¡ .001) main effect of the factor configuration on the Y deviation with a medium (=.09) effect size. The 4 motor configuration resulted in the highest Y deviation (EMM = 1.75cm [1.56cm, 1.93cm]), followed by the 6 motor configuration (EMM = 1.15cm [1.07cm, 1.24cm]), the 9 motor configuration (EMM = 1.11cm [1.01cm, 1.21cm]), and finally the 15 motor configuration (EMM = 0.94cm [0.84cm, 1.04cm]). Post-hoc tests confirmed significant differences between the 4 motor configuration and all other configurations (p ¡ .001), between 6 and 15 (p ¡ .001), and between 9 and 15 (p ¡ .05).
4.3.2. Intensity
We could not find a significant main effect for the factor intensity ( = 3.85, p ¿ 0.05) on the Y deviation between 0.5 intensity (EMM = 1.27cm [1.19cm, 1.34cm]) and 1.0 intensity (EMM = 1.21cm [1.15cm, 1.27cm]).
4.3.3. Xt
We could not find a significant main effect for the factor Xt ( = 1.22, p ¿ 0.05) on the Y deviation. We observed comparable Y deviation for Xt= 1.0 (EMM = 1.19cm [1.09cm, 1.29cm]), Xt= 2.25 (EMM = 1.21cm [1.13cm, 1.29cm]), Xt= 3.5 (EMM = 1.27cm [1.20cm, 1.34cm]), Xt= 4.75 (EMM = 1.27cm [1.20cm, 1.35cm]), and Xt= 6.0 (EMM = 1.24cm [1.13cm, 1.36cm]).
4.3.4. Yt
[MF-8] The analysis showed a significant ( = 44.96, p ¡ .001) main effect of the factor Yt on the Y deviation with a large (=.16) effect size. Y deviation was lowest at the top Yt= 1.5 (EMM = 0.62cm [0.43cm, 0.81cm]) and the bottom Yt= 11.5 (EMM = 0.48cm [0.33cm, 0.62cm]) rows of the grid. Rows in the middle showed higher Y deviation values: Yt= 2.75 (EMM = 1.11cm [0.98cm, 1.23cm]), Yt= 4.0 (EMM = 1.58cm [1.45cm, 1.72cm]), Yt= 5.25 (EMM = 1.63cm [1.49cm, 1.77cm]), Yt= 6.5 (EMM = 1.48cm [1.30cm, 1.66cm]), Yt= 7.75 (EMM = 1.57cm [1.42cm, 1.72cm]), Yt= 9.0 (EMM = 1.54cm [1.42cm, 1.67cm]), and Yt= 10.25 (EMM = 1.12cm [1.02cm, 1.23cm]). Post-hoc tests confirmed significantly rising Y deviation from the top and bottom (Yt= 1.5, Yt= 11.5), to the next two rows (Yt= 2.25, Yt= 10.25) (p ¡ .01), and between Yt= 2.25, Yt= 10.25 and all other rows in the middle (p ¡ .05).
4.4. Accuracy

We analyzed the accuracy of localizing the target positions. To get a better overview, we further filtered the data to measure the accuracy of reducing from 5 columns to 3 and 2 equally spaced columns. Similarly, reducing from 9 rows to 5, 3, and 2 equally spaced rows. For each resolution, we conducted a RM-ANOVA with the factors configuration and intensity. The factor intensity did not have a significant effect on the accuracy of any of the resolutions. Table 1 summarizes the results of the RM-ANOVAs for the factor configuration. Figure 6 visualizes the accuracy across varying resolution and the post-hoc tests.
| Resolution (X*Y) | F | df | p | configuration (EMM [lower CL, upper CL]) | ||||
|---|---|---|---|---|---|---|---|---|
| 4 | 6 | 9 | 15 | |||||
| 2x2 | 1.00 | 2.54, 38.12 | .393 | .041 | 97.7% [94.0%, 100%] | 96.1% [92.1%, 100%] | 98.4% [96.2%, 100%] | 99.2% [97.6%, 100%] |
| 2x3 | 9.08 | 1.58, 23.70 | .002 | .273 | 84.1% [76.6%, 91.6%] | 93.6% [88.6%, 98.7%] | 96.3% [93.1%, 99.6%] | 98.3% [96.4%, 100%] |
| 2x5 | 33.46 | 2.32, 34.80 | .001 | .455 | 48.6% [42.7%, 54.5%] | 71.8% [64.8%, 78.9%] | 69.6% [61.2%, 78.0%] | 80.0% [73.6%, 86.5%] |
| 2x9 | 11.09 | 2.64, 39.55 | .001 | .322 | 29.3% [25.3%, 33.3%] | 37.5% [34.1%, 40.9%] | 38.7% [33.9%, 43.5%] | 46.0% [39.8%, 52.1%] |
| 3x2 | 3.78 | 2.36, 35.41 | .026 | .137 | 81.6% [73.5%, 89.7%] | 82.7% [74.7%, 90.7%] | 93.2% [89.5%, 96.9%] | 88.6% [83.7%, 93.5%] |
| 3x3 | 11.47 | 2.23, 33.43 | .001 | .296 | 68.6% [59.1%, 78.1%] | 79.6% [71.2%, 88.1%] | 90.6% [86.6%, 94.6%] | 87.4% [82.1%, 92.7%] |
| 3x5 | 31.50 | 2.68, 40.16 | .001 | .441 | 40.8% [35.1%, 46.5%] | 61.2% [53.7%, 68.8%] | 64.1% [57.4%, 70.7%] | 70.0% [62.8%, 77.3%] |
| 3x9 | 14.63 | 2.37, 35.61 | .001 | .332 | 23.6% [19.6%, 27.6%] | 31.0% [27.3%, 34.7%] | 34.3% [29.8%, 38.8%] | 40.3% [34.1%, 46.5%] |
| 5x2 | 9.12 | 2.39, 35.78 | .001 | .237 | 48.1% [41.5%, 54.7%] | 52.1% [45.7%, 58.5%] | 62.0% [55.5%, 68.5%] | 63.0% [57.5%, 68.6%] |
| 5x3 | 17.74 | 2.09, 31.35 | .001 | .335 | 40.0% [33.2%, 46.9%] | 48.3% [42.0%, 54.6%] | 58.8% [52.5%, 65.2%] | 60.4% [54.2%, 66.5%] |
| 5x5 | 31.79 | 2.40, 36.05 | .001 | .463 | 23.9% [19.8%, 27.9%] | 36.3% [31.7%, 40.8%] | 43.8% [37.2%, 50.5%] | 47.9% [41.9%, 53.9%] |
| 5x9 | 32.82 | 2.02, 30.35 | .001 | .481 | 13.3% [10.7%, 16.0%] | 19.9% [17.9%, 22.0%] | 25.6% [22.1%, 29.1%] | 28.7% [24.0%, 33.3%] |
4.5. Number of Perceived Points
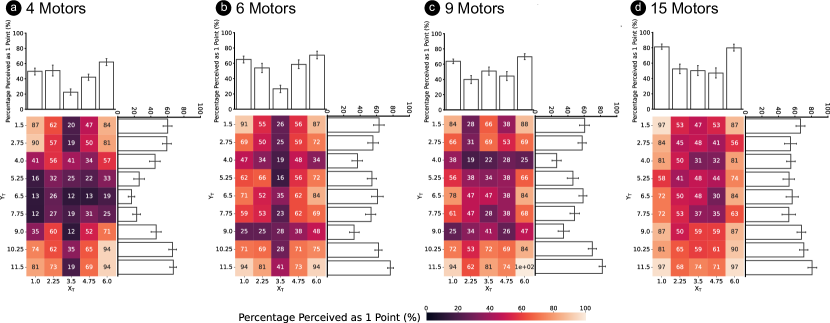
We analyzed the binary dependent variable number of perceived points. Therefore, we used a logistic mixed model, estimated with ML and BOBYQA optimizer, with the fixed effects configuration, intensity, Xt, and Ytwhile including the participant as a random effect. The explanatory power (Johnson and Schielzeth, 2017) of the model was substantial and the part related to the fixed effects alone -marginal - was 0.18. We computed the 95% confidence intervals and p-values using the Wald approximation. Figure 7 visualizes the results.
4.5.1. configuration
[MF-9] The analysis revealed a significant (, p ¡ .001) main effect of the factor configuration on the number of perceived points. The 15 motor configuration resulted in the highest probability (EMM = 65.7% [56.3%, 74.1%]) of perceiving vibration at a single location, followed by the 6 motor configuration (EMM = 56.8% [46.9%, 66.2%]), the 9 motor configuration (EMM = 55.2% [45.3%, 64.7%]), and finally the 4 motor configuration (EMM = 44.5% [35.1%, 54.5%]). Post-hoc pairwise contrasts confirmed all differences to be significant (p ¡ .001) except between the 6 and 9 motor configurations.
4.5.2. intensity
[MF-10] The analysis showed a significant (, p ¡ .001) main effect of the factor intensity on the number of perceived points between 0.5 intensity (EMM = 58.6% [48.9%, 67.6%]) and 1.0 intensity (EMM = 52.8% [43.1%, 62.3%]).
4.5.3. Xt
[MF-11] The analysis showed a significant (, p ¡ .001) main effect of the factor Xt on the number of perceived points. The right Xt= 6.0 (EMM = 74.6% [66.2%, 81.5%]) edge resulted in the highest probability of perceiving a single point, followed by the left Xt= 1.0 (EMM = 68.3% [59.0%, 76.3%]) edge, and columns in the middle: Xt= 2.25 (EMM = 49.5% [39.7%, 59.4%]), Xt= 4.75 (EMM = 48.3% [38.5%, 58.3%]), and Xt= 3.5 (EMM = 35.2% [26.6%, 44.8%]). Post-hoc tests confirmed all pairwise contrasts as significant (p ¡ .001) except the pair Xt= 2.25 and Xt= 4.75 (p ¿ .05).
4.5.4. Yt
[MF-12] The analysis showed a significant (, p ¡ .001) main effect of the factor Yt on the number of perceived points. The bottom part of the grid resulted in the highest probability of perceiving a single point Yt= 11.5 (EMM = 81.2% [73.8%, 86.9%]) and Yt= 10.25 (EMM = 71.2% [61.8%, 79.0%]). Followed by the rows at the top: Yt= 1.5 (EMM = 65.5% [55.6%, 74.3%]) and Yt= 2.75 (EMM = 58.3% [47.9%, 68.0%]). Finally, we observed comparable performance for the rows in the middle: Yt= 4.0 (EMM = 38.9% [29.6%, 49.2%]), Yt= 5.25 (EMM = 43.9% [34.0%, 54.3%]), Yt= 6.5 (EMM = 48.0% [37.8%, 58.4%]), Yt= 7.75 (EMM = 43.0% [33.2%, 53.4%]), and Yt= 9.0 (EMM = 44.4% [34.4%, 54.8%]). Post-hoc tests confirmed significantly rising probability of one point perceived between the middle rows and the top rows (p ¡ .001) and between the top rows and the bottom rows (p ¡ .001).
5. User Study 1: Discussion
In the following, we discuss the findings from the first user study.
5.1. configuration
In general, localization accuracy increased as the number of actuators increased ([MF-1], [MF-4], [MF-7]). Observing spatial error metrics measured in our experiment, the usage of 9 actuators with a spacing of along the width of the palm and along the length is enough for accurate stationary sensations. Although euclidean distance was lowest using 15 actuators, the results of using 9 actuators were comparable, with no significant difference. Reducing to 6 actuators, however, results in a significant increase in euclidean errors (20%) in comparison to 15 actuators ([MF-1]). Moreover, the additional column of actuators using 9 actuators decreases the X deviation significantly compared to configurations with a lower number of actuators, while being comparable to the configuration with 15 actuators ([MF-4]). Although the Y deviation is significantly lower with 15 actuators compared to 9 actuators ([MF-7]), this only results in a significant decrease in localization accuracy for the resolution (Figure 6). For all other resolutions, localization accuracy with 9 actuators was comparable to 15 actuators.
- INSIGHT-1:
-
9 actuators result in comparable localization performance of stationary sensations as 15 actuators.
Regarding the perception of phantom sensations at a single location, results indicate that a 15 motor configuration results in significantly higher probability of perceiving phantom sensations at a single location than all other configurations ([MF-9]). Although the probability of perceiving a single point is relatively low (65%), this can be due to the fact that by asking the participants if they perceived a single point or multiple points, it is implied that multiple points can occur and participants are more inclined to say multiple points if they are in doubt. We calculated the probability of perceiving a single point with real sensations (always caused by a single actuator), and observed a probability of 75% of users expressing that they felt a single point.
- INSIGHT-2:
-
15 actuators result in improved perception of phantom sensations at a single location.
5.2. Xt & Yt
We observed a systematic behaviour, where participants tend to localize vibrations closer to the edge of the device, leading to higher localization accuracies of locations at the edges and lower localization accuracies for locations in the middle ([MF-2], [MF-3], [MF-6], [MF-8]). A possible explanation for this behaviour is that with a lower number of actuators, phantom sensations are not perceived correctly at a single location and instead are perceived at the positions of the actuators generating them which are typically at the edges of the device (see subsection 5.1, [insight-2]). We observed interaction effects supporting this ([IF-1], [IF-2]), where lower number of actuators show significant differences between locations at the edges and locations in the middle, and higher number of actuators show comparable performance across all locations – indicating correct perception of phantom sensations at target location.
- INSIGHT-3:
-
9 and 15 actuators led to more accurate localization at target location. 4 and 6 actuators led to more frequent localization at the edges.
Furthermore, results show that the X deviation values are considerably lower than the Y deviation values. This indicates that users could localize stationary sensations along the width of the palm more accurately than along the length. This is in line with prior work on localization accuracy of vibrotactile sensations on other body parts (Elsayed et al., 2020), where a transverse orientation resulted in better localization than a longitudinal orientation.
- INSIGHT-4:
-
Localizing sensations along the width of the palm is more accurate than along the length.
Lastly, we analyzed users’ ability to correctly localize stationary sensations with varying resolution. Observing the relationship between resolution and accuracy, it is clear that there is a trade-off between high accuracy and the number of distinct locations that can be localized as defined by the resolution. Typically, an application would require high accuracy (¿ 90%) of localizing stationary sensations while still maintaining a reasonable resolution. A 3x3 resolution allows for identifying 9 different locations and maintains a high accuracy of localization (91% for the 9 motor configuration, see Figure 6).
- INSIGHT-5:
-
A resolution can be accurately recognised.
5.3. intensity
Intensity of the vibrations does not seem to have an influence on participants’ ability to localize stationary tactile sensations. However, we observed a significant increase in the probability of perceiving a single point when using a lower intensity ([MF-10]). This is due to the fact that by increasing the intensity of the vibration, the positions of the actuators become more pronounced which affects the perception of phantom sensations.
- INSIGHT-6:
-
Lower intensity vibrations result in improved perception of phantom sensations at a single location.
5.4. Comparison Between Touch and Vibrotactile Stimulation
A two-point discrimination threshold of approximately was observed for touch on the palm (Mancini et al., 2014). Our findings show that for successful two-point discrimination of vibrotactile stimulation, a spacing of approximately is required. This is calculated based on the upper CL of the euclidean distance with 15 actuators multiplied by two, to account for localization error of two locations. These values deviate considerably, highlighting the importance of basing design decisions for vibrotactile displays on vibrotactile perception.
- INSIGHT-7:
-
Vibrotactile sensitivity on the palm deviates considerably from touch.
6. User Study 2: Moving Tactile Sensations
Based on the results of the first user study, we conducted a second user study to investigate moving tactile sensations. In particular, we aimed to answer the following research questions:
- RQ1:
- RQ2:
-
How does the resolution influence reaction time of users? We hypothesized that higher resolutions are more difficult to perceive and and hence lead to higher reaction times.
In the following, we detail on the study design, the procedure, apparatus, participants, dependent variables, and data analysis methods.
6.1. User Study Design
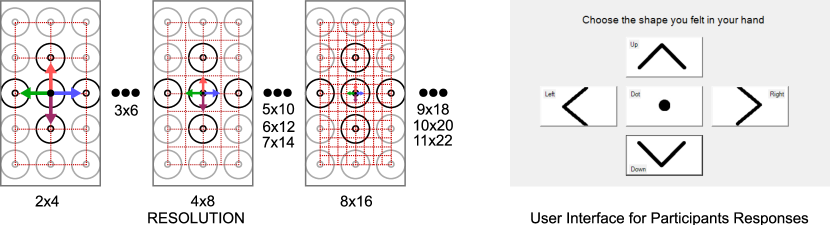
We varied the resolution of the vibrotactile grid and the direction of the sensation in a within-subject study design. Figure 8 illustrates these independent variables. Resolution had 10 levels: , , , , , , , , , and . We aimed to cover a wide spectrum in resolution for a better understanding of users’ performance. Direction had 4 levels: right, left, up, and down. All sensations started at the middle actuator as shown in Figure 8 and moved a distance equivalent to one cell in the respective resolution. The speed of the sensation was fixed at 0.5cm/s. We informally tested the influence of speed in pilot tests and found no difference in perception in the range 0.1-2cm/s. Inter-actuator spacing was fixed at , which resulted in robust 1D phantom sensations from extensive pilot tests and based on prior work (Park et al., 2016).
This resulted in a total of 40 () conditions. We used a balanced latin square to counterbalance the variable resolution. For each resolution, we randomized the order of appearance of the variable direction. Each condition was repeated three times, resulting in a total of 120 trials per participant
6.2. Procedure
Similar to the first user study, participants were welcomed to the lab, given a brief overview of the task, asked to sign an informed consent, and to fill out a short demographic questionnaire.
Participants wore noise cancelling headphones playing white noise throughout the experiment. The vibrotactile grid was attached to their dominant hand. At the beginning, a few (¡ 10) test trials were conducted to familiarize the participant with the task that were not recorded. Afterwards, participants began the experiment. The task was to feel a vibration and indicate if it was moving and in which direction. The participants experienced sensations that moved in the directions up, down, right, and left. However, an additional response was possible of feeling a point (Figure 8) to indicate if they could not determine the direction.
Participants took a break (approximately five minutes long) after completing five different resolutions. In total, the experiment lasted about 20 minutes.
6.3. Apparatus
We used the 15 motor configuration (for better perception of phantom sensations) throughout the experiment with the same hardware as the first user study. A pop-up window after each sensation was displayed to the users for inputting their response as shown in Figure 8.
6.4. Dependent Variables
We recorded the following dependent variables:
- Accuracy::
-
whether the correct direction was identified.
- X Accuracy::
-
whether the correct direction was identified for left and right.
- Y Accuracy::
-
whether the correct direction was identified for up and down.
- Task Completion Time (TCT)::
-
the time between the end of the vibration and the user’s response.
6.5. Participants
We recruited 20 participants (15 male, 4 female, and 1 identified as gender variant), aged between 21 and 32 years old (, ). 19 of our participants were right-handed and one participant was left-handed. Participants reported no prior haptic feedback experience beyond the use of everyday smartphones and game controllers. All our participants reported no sensory processing disorders.
6.6. Data Analysis
For the analysis of the binary dependent variable accuracy, we used a logistic mixed model, estimated with ML and BOBYQA optimizer, with the fixed effects resolution and direction, and including the participant as a random effect. For computing the confidence intervals and the p-values, we used the Wald approximation.
For the analysis of the continuous variable task completion time, we used a two-way RM-ANOVA with the factors resolution and direction, to compute the F-score and p-value of main and interaction effects. We used the same method for spherecity correction (Greenhouse–Geisser) and report the generalized eta-squared as in the first user study. For post-hoc tests, we used pairwise t-tests with Tukey adjustment.
Similar to the first user study, we report the EMMs with the 95% confidence intervals.
7. User Study 2: Results
This section reports the results of the second user study investigating moving tactile sensations. Key observations are labelled with [MF-#] for main effects and [IF-#] for interaction effects.
7.1. Accuracy
We analyzed the accuracy of users in identifying the direction of tactile sensation on the palm. Figure 9 illustrates the results. The explanatory power of the model was substantial and the part related to the fixed effects alone (marginal ) was 0.27.
7.1.1. Resolution
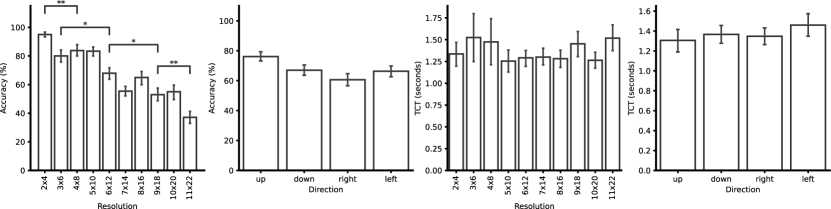
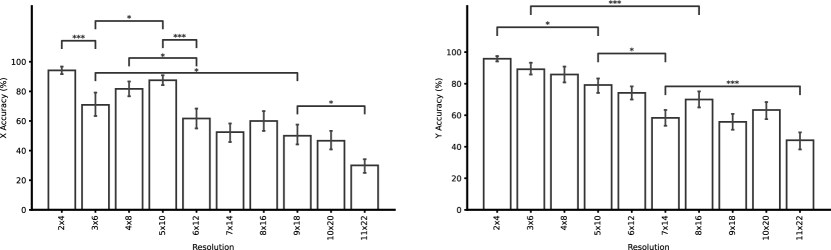
[MF-13] Our analysis revealed a significant (, p ¡ .001) main effect of the factor resolution on the probability of correctly perceiving the moving sensation. The highest accuracy was achieved by the resolution (EMM = 96.2% [92.4%, 98.1%]), followed by (EMM = 85.4% [79.0%, 90.1%]), (EMM = 85.3% [79.0%, 90.0%]), (EMM = 83.2% [76.1%, 88.5%]), (EMM = 69.7% [61.1%, 77.2%]), 8x16 (EMM = 66.4% [57.5%, 74.2%]), (EMM = 56.4% [47.0%, 65.3%]), (EMM = 56.0% [46.8%, 64.8%]), (EMM = 53.3% [44.1%, 62.2%]), and (EMM = 35.6% [27.4%, 44.7%]). Post-hoc tests are summarized in Figure 9.
7.1.2. Direction
We could not find a significant main effect of the factor direction on accuracy (, p ¿ .05). The accuracy was comparable between the directions up (EMM = 79.9% [73.9%, 84.7%]), down (EMM = 74.2% [66.6%, 80.7%]), left (EMM = 71.3% [64.0%, 77.7%]), and right (EMM = 64.8% [57.0%, 71.8%]).
7.2. X Accuracy
We analyzed the accuracy of users for the directions right and left. The explanatory power of the model was and the marginal was 0.26.
7.2.1. Resolution
[MF-14] Our analysis revealed a significant (, p ¡ .001) main effect of the factor resolution on the X accuracy. The resolution resulted in the highest X accuracy (EMM = 95.5% [90.0%, 98.1%]), followed by (EMM = 89.9% [82.0%, 94.6%]), (EMM = 84.3% [74.7%, 90.8%]), (EMM = 73.4% [61.4%, 82.6%]), (EMM = 63.5% [50.6%, 74.7%]), (EMM = 61.6% [48.6%, 73.1%]), (EMM = 53.1% [40.1%, 65.7%]), (EMM = 50.1% [37.4%, 62.9%]), (EMM = 46.3% [33.8%, 59.3%]), and (EMM = 27.6% [18.1%, 39.8%]). Figure 10 displays the result of post-hoc pairwise comparisons.
7.2.2. Direction
We could not find a significant effect of the factor direction on the X accuracy between left (EMM = 72.3% [63.2%, 79.8%]) and right (EMM = 65.5% [55.7%, 74.1%]) (, p ¿ .05).
7.3. Y Accuracy
We analyzed the accuracy of users for the directions up and down. The explanatory power of the model was and the marginal was 0.26.
7.3.1. Resolution
[MF-15] Our analysis revealed a significant (, p ¡ .001) main effect of the factor resolution on the Y accuracy. The resolution resulted in the highest Y accuracy (EMM = 97.1% [91.4%, 99.0%]), followed by (EMM = 90.3% [83.1%, 94.6%]), (EMM = 87.2% [79.1%, 92.4%]), (EMM = 80.9% [71.5%, 87.7%]), (EMM = 75.8% [65.7%, 83.7%]), (EMM = 71.3% [60.7%, 79.9%]), (EMM = 65.7% [54.3%, 75.6%]), (EMM = 59.0% [47.8%, 69.3%]), (EMM = 56.4% [45.2%, 67.0%]), and (EMM = 43.2% [32.4%, 54.7%]). Figure 10 shows the result of post-hoc pairwise comparisons.
7.3.2. Direction
We could not find a significant effect of the factor direction on the X accuracy between down (EMM = 74.2% [66.5%, 80.6%]) and up (EMM = 79.8% [73.9%, 84.6%]) (, p ¿ .05).
7.4. Task Completion Time (TCT)
We analyzed the time between the end of the stimulus and users’ response.
7.4.1. Resolution
We could not find a significant main effect of the factor resolution on the TCT ( = 0.52, p ¿ .05). TCT was comparable across resolutions. The highest TCT was observed for (EMM = 1.52s [1.21s, 1.83s]) and (EMM = 1.52s [0.92s, 2.13s]), followed by (EMM = 1.48s [0.91s, 2.05s]), (EMM = 1.45s [1.15s, 1.76s]), (EMM = 1.34s [1.05s, 1.62s]), (EMM = 1.30s [1.09s, 1.49s]), (EMM = 1.29s [1.10s, 1.49s]), (EMM = 1.28s [1.07s, 1.50s]), (EMM = 1.26s [1.06s, 1.46s]), and (EMM = 1.25s [0.99s, 1.52s]).
7.4.2. Direction
We could not find a significant main effect of the factor direction on TCT ( = 0.79, p ¿ .05). TCT was comparable for the directions up (EMM = 1.31s [1.06s, 1.55s]), down (EMM = 1.37s [1.18s, 1.56s]), left (EMM = 1.46s [1.22s, 1.70s]), and right (EMM = 1.35s [1.16s, 1.53s]).
8. User Study 2: Discussion
In the following, we discuss the findings of our second user study.
8.1. resolution
In general, findings from our second user study show that more fine-grained resolutions are possible for moving sensations in comparison to resolutions for vibrotactile point localization. This is consistent with related work on touch (Mancini et al., 2014), where the localization of successive stimuli on the skin was better than simultaneous stimuli.
Our findings (MF-13) show that a resolution results in 96.2% correct recognition rate of the four directions up, down, right, and left. This is equivalent to a motion of on the palm. On the other hand, although a resolution resulted in a significant decrease in recognition accuracy ([MF-13], [MF-15]) compared to a resolution, we still observed a 85.4% recognition rate of the four directions investigated in the user study. With this resolution, tactile motion equivalent to can be accurately recognized. These results apply to tactile motion generated with 1D phantom sensations. While 1D phantom sensations are frequently used in the literature, further work is required for determining appropriate resolutions for 2D phantom sensations and other tactile illusions.
- INSIGHT-8:
-
A resolution results in high recognition accuracy (96.2%).
- INSIGHT-9:
-
A resolution enables higher resolution output while still maintaining high accuracy (85.4%).
8.2. direction
Findings from the first user study unveiled a higher localization accuracy along the width of the palm in comparison to the length. This effect does not seem to apply to moving sensations. We found comparable recognition rates for vertical and horizontal directions across resolution.
8.3. Comparison Between Touch and Vibrotactile Stimulation
Typically, spatial acuity is measured by two-point discrimination thresholds. However, experiments were also conducted that measured the perception of successive spatially distributed stimuli (Mancini et al., 2014) – similar to motion on the skin. Results show that for touch on the palm, successive stimuli ( threshold) are discriminated more easily than simultaneous stimuli ( threshold). This trend is present in our results on vibrotactile stimulation, however, with considerably different absolute values ( for moving and for stationary). This is further confirmed by the high recognition accuracies we observed for moving sensations with a length well below the localization accuracy of stationary sensations.
- INSIGHT-10:
-
Higher vibrotactile sensitivity was observed for moving compared to stationary sensations.
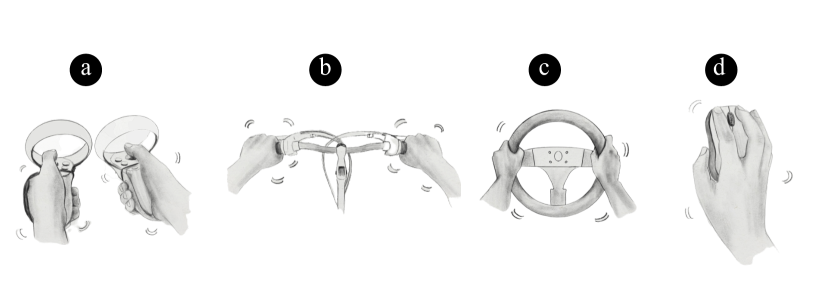
9. Applications of Palm-based Tactile Displays
Stationary and moving tactile sensations on the palm have many potential applications in the future (see Figure 11). These include high-resolution tactile feedback in video games and VR controllers to create more immersive experiences by simulating the exact contact points and shapes. The handlebar of a bicycle and the steering wheel of a car could embed haptic actuators to give precise feedback of the surrounding (e.g., by communicating the exact location of other cars through vibrations) or navigation (e.g., by drawing the exact path the user needs to take on the user’s palm through a moving sensation). Finally, traditional input devices such as mouse or pen input could be improved by haptic gestures that allow for a more expressive and higher resolution tactile output. These applications can benefit from the knowledge gained by our experiments by implementing the following design implications.
10. Design Guidelines for Palm-based Tactile Displays
In this section, we outline design guidelines derived based on the findings of our controlled user studies. These guidelines are aimed at two main interaction requirements: accurate and expressive sensations. An example application where accurate interactions are required is pedestrian navigation (Yatani et al., 2012) or generally for accurate communication of a discrete set of instructions (Alvina et al., 2015). For these situations, accurate sensations are required.
On the other hand, more expressive interaction is required for applications such as the communication of social touch (Huisman et al., 2013) or generally for the communication of a more diverse set of continuous sensations (Israr and Poupyrev, 2011) with more relaxed accuracy constraints. An example of this type of interaction in the context of stationary sensations would be augmenting videos on handheld displays with vibrotactile feedback. An object appears on the scene and the user can feel it at the correct location on the hand. In this case, discrete identification of a set of locations would not be the best approach. A tactile display with the ability to generate higher resolution sensations should be preferred.
For stationary vibrotactile sensations, we derive the following design guidlines (DG):
- DG-1:
-
A smaller (approximately 2:1 ratio) inter-actuator spacing should be used along the width of the palm than the length. [insight-4]
- DG-2:
-
A grid of points can be used for significantly accurate interactions on the palm. [insight-5]
- DG-3:
-
Favor the use of a tactile display consisting of nine actuators with a spacing of along the width and along the length for accurate interactions. [insight-1, insight-4]
- DG-4:
-
A high number (spacing ) of actuators should be used for expressive interactions. [insight-1, insight-2, insight-3]
- DG-5:
-
Lower intensity vibrations result in a higher probability of perceiving a phantom sensation at a single location. [insight-6]
For moving tactile sensations we derive the following guidelines:
- DG-6:
-
Accurate interactions with moving sensations can be achieved with a resolution. [insight-8]
- DG-7:
-
A resolution of maintains a reasonable recognition accuracy. This resolution can be used to generate more expressive sensations. [insight-9]
11. Limitations
The design and results of our experiments impose some limitations and directions for future work.
11.1. Choice of Actuator
Different vibrotactile actuators have been introduced and used by the literature, e.g. eccentric rotating mass (ERM) (Elsayed et al., 2020) and linear resonant actuators (LRA) (Hoggan and Brewster, 2007). These actuators differ in the mechanisms with which they produce vibrations on the skin. While LRAs vibrate perpendicular to the skin surface, ERMs rotate along the skin surface. We used an LRA actuator, known for its ability to produce localized sensations. Future work should investigate if and how much the choice of actuator affects perception.
11.2. Hand Pose
The human hands are capable of a wide variety of poses and grips. We evaluated a flat hand pose in our user studies. Furthermore, our participants had to reduce the spacing between their fingers to make sure that actuators were in contact with the skin. While our results provide a valuable baseline for future research, further work is required to investigate how the hand pose affects perception.
11.3. Interface Size
We chose our prototype size based on prior work on back-of-device (smartphone) tactile interfaces and on the average hand size. While this allowed us to conduct our user studies with all our participants, our prototype covered only parts of the hand. The palm was always fully covered and depending on the hand size, the base of the fingers. Future devices should be tailored to users’ hand sizes.
11.4. Real-World Applicability
In our work, we investigated the perception of stationary and moving tactile sensations in a lab setting. We chose this approach to focus on the mere influence of the factors and to exclude external influences. While we are convinced that our results make a strong contribution to the future palm-based tactile displays, we also acknowledge that other settings might yield other results. Therefore, further work is necessary to understand how these results are transferable to in-the-wild settings.
12. Conclusion
This work explored the perception of vibrations on the palm. In a first user study, we evaluated the localization accuracy and perception of real and phantom stationary sensations. Our findings show that a 9 actuator display with a grid of points can be localized accurately. For better perception of phantom sensations, a display consisting of at least 15 actuators should be used combined with lower intensity vibrations. In a second controlled user study, we investigated the recognition accuracy of moving tactile sensations. Findings show that a resolution leads to accurately perceived moving sensations, while a resolution enables higher resolution output while maintaining high recognition rates. Based on the results, we derive and describe a set of design and usage guidelines for future palm-based tactile displays.
References
- (1)
- Alles (1970) D. S. Alles. 1970. Information Transmission by Phantom Sensations. IEEE Transactions on Man-Machine Systems 11, 1 (March 1970), 85–91. https://doi.org/10.1109/TMMS.1970.299967
- Alvina et al. (2015) Jessalyn Alvina, Shengdong Zhao, Simon T. Perrault, Maryam Azh, Thijs Roumen, and Morten Fjeld. 2015. OmniVib: Towards Cross-body Spatiotemporal Vibrotactile Notifications for Mobile Phones. In Proceedings of the 33rd Annual ACM Conference on Human Factors in Computing Systems (Seoul, Republic of Korea) (CHI ’15). ACM, New York, NY, USA, 2487–2496. https://doi.org/10.1145/2702123.2702341
- Bark et al. (2015) K. Bark, E. Hyman, F. Tan, E. Cha, S. A. Jax, L. J. Buxbaum, and K. J. Kuchenbecker. 2015. Effects of Vibrotactile Feedback on Human Learning of Arm Motions. IEEE Transactions on Neural Systems and Rehabilitation Engineering 23, 1 (Jan 2015), 51–63. https://doi.org/10.1109/TNSRE.2014.2327229
- Borst and Cavanaugh (2004) Christoph Borst and Charles Cavanaugh. 2004. Touchpad-Driven Haptic Communication using a Palm-Sized Vibrotactile Array with an Open-Hardware Controller Design. (01 2004).
- Burtt (1917) Harold Ernest Burtt. 1917. Tactual illusions of movement. Journal of Experimental Psychology 2 (1917), 371–385.
- Cauchard et al. (2016) Jessica R. Cauchard, Janette L. Cheng, Thomas Pietrzak, and James A. Landay. 2016. ActiVibe: Design and Evaluation of Vibrations for Progress Monitoring. In Proceedings of the 2016 CHI Conference on Human Factors in Computing Systems (San Jose, California, USA) (CHI ’16). ACM, New York, NY, USA, 3261–3271. https://doi.org/10.1145/2858036.2858046
- Chen et al. (2018) Qin Chen, Simon T. Perrault, Quentin Roy, and Lonce Wyse. 2018. Effect of Temporality, Physical Activity and Cognitive Load on Spatiotemporal Vibrotactile Pattern Recognition. In Proceedings of the 2018 International Conference on Advanced Visual Interfaces (Castiglione della Pescaia, Grosseto, Italy) (AVI ’18). ACM, New York, NY, USA, Article 25, 9 pages. https://doi.org/10.1145/3206505.3206511
- Cholewiak (1979a) Roger Cholewiak. 1979a. Spatial factors in the perceived intensity of vibrotactile patterns. Sensory processes 3 (07 1979), 141–56.
- Cholewiak (1979b) RW Cholewiak. 1979b. Spatial factors in the perceived intensity of vibrotactile patterns. Sensory processes 3, 2 (June 1979), 141—156. http://europepmc.org/abstract/MED/232572
- Cholewiak and Collins (2003) Roger W. Cholewiak and Amy A. Collins. 2003. Vibrotactile localization on the arm: Effects of place, space, and age. Perception & Psychophysics 65, 7 (01 Oct 2003), 1058–1077. https://doi.org/10.3758/BF03194834
- Cohen (1988) Jacob Cohen. 1988. Statistical Power Analysis for the Behavioral Sciences. Routledge. https://doi.org/10.4324/9780203771587
- Elsayed et al. (2020) Hesham Elsayed, Martin Weigel, Florian Müller, Martin Schmitz, Karola Marky, Sebastian Günther, Jan Riemann, and Max Mühlhäuser. 2020. VibroMap: Understanding the Spacing of Vibrotactile Actuators across the Body. Proc. ACM Interact. Mob. Wearable Ubiquitous Technol. 4, 4, Article 125 (dec 2020), 16 pages. https://doi.org/10.1145/3432189
- Geldard (1977) Frank Arthur Geldard. 1977. Sensory saltation : metastability in the perceptual world. American Journal of Psychology 90 (1977), 328.
- Günther et al. (2018a) Sebastian Günther, Sven Kratz, Daniel Avrahami, and Max Mühlhäuser. 2018a. Exploring Audio, Visual, and Tactile Cues for Synchronous Remote Assistance. In Proceedings of the 11th PErvasive Technologies Related to Assistive Environments Conference (Corfu, Greece) (PETRA ’18). ACM, New York, NY, USA, 339–344. https://doi.org/10.1145/3197768.3201568
- Günther et al. (2018b) Sebastian Günther, Florian Müller, Markus Funk, Jan Kirchner, Niloofar Dezfuli, and Max Mühlhäuser. 2018b. TactileGlove: Assistive Spatial Guidance in 3D Space through Vibrotactile Navigation. In Proceedings of the 11th PErvasive Technologies Related to Assistive Environments Conference (Corfu, Greece) (PETRA ’18). Association for Computing Machinery, New York, NY, USA, 273–280. https://doi.org/10.1145/3197768.3197785
- Gupta et al. (2016) Aakar Gupta, Antony Irudayaraj, Vimal Chandran, Goutham Palaniappan, Khai N. Truong, and Ravin Balakrishnan. 2016. Haptic Learning of Semaphoric Finger Gestures. In Proceedings of the 29th Annual Symposium on User Interface Software and Technology (Tokyo, Japan) (UIST ’16). Association for Computing Machinery, New York, NY, USA, 219–226. https://doi.org/10.1145/2984511.2984558
- Hoggan and Brewster (2007) Eve Hoggan and Stephen Brewster. 2007. Designing audio and tactile crossmodal icons for mobile devices. 162–169. https://doi.org/10.1145/1322192.1322222
- Huisman et al. (2013) Gijs Huisman, Aduén Darriba Frederiks, Betsy Van Dijk, Dirk Hevlen, and Ben Kröse. 2013. The TaSSt: Tactile sleeve for social touch. In 2013 World Haptics Conference (WHC). 211–216. https://doi.org/10.1109/WHC.2013.6548410
- Israr and Poupyrev (2011) Ali Israr and Ivan Poupyrev. 2011. Tactile Brush: Drawing on Skin with a Tactile Grid Display. In Proceedings of the SIGCHI Conference on Human Factors in Computing Systems (Vancouver, BC, Canada) (CHI ’11). ACM, New York, NY, USA, 2019–2028. https://doi.org/10.1145/1978942.1979235
- Johnson and Schielzeth (2017) Paul Johnson and Holger Schielzeth. 2017. The coefficient of determination R2 and intra-class correlation coefficient from generalized linear mixed-effects models revisited and expanded. Journal of The Royal Society Interface 14 (09 2017), 20170213. https://doi.org/10.1098/rsif.2017.0213
- Kirman (1974) Jacob H. Kirman. 1974. Tactile apparent movement: The effects of interstimulus onset interval and stimulus duration. Perception & Psychophysics 15 (1974), 1–6.
- Krüger et al. (2018) Matti Krüger, Heiko Wersing, and Christiane B. Wiebel-Herboth. 2018. Approach for Enhancing the Perception and Prediction of Traffic Dynamics with a Tactile Interface. In Adjunct Proceedings of the 10th International Conference on Automotive User Interfaces and Interactive Vehicular Applications (Toronto, ON, Canada) (AutomotiveUI ’18). ACM, New York, NY, USA, 164–169. https://doi.org/10.1145/3239092.3265961
- Lee et al. (2015) Jaeyeon Lee, Jaehyun Han, and Geehyuk Lee. 2015. Investigating the Information Transfer Efficiency of a 3x3 Watch-back Tactile Display. In Proceedings of the 33rd Annual ACM Conference on Human Factors in Computing Systems (Seoul, Republic of Korea) (CHI ’15). ACM, New York, NY, USA, 1229–1232. https://doi.org/10.1145/2702123.2702530
- Lee and Starner (2010) Seungyon ”Claire” Lee and Thad Starner. 2010. BuzzWear: Alert Perception in Wearable Tactile Displays on the Wrist. In Proceedings of the SIGCHI Conference on Human Factors in Computing Systems (Atlanta, Georgia, USA) (CHI ’10). ACM, New York, NY, USA, 433–442. https://doi.org/10.1145/1753326.1753392
- Lehtinen et al. (2012) Ville Lehtinen, Antti Oulasvirta, Antti Salovaara, and Petteri Nurmi. 2012. Dynamic Tactile Guidance for Visual Search Tasks. In Proceedings of the 25th Annual ACM Symposium on User Interface Software and Technology (Cambridge, Massachusetts, USA) (UIST ’12). ACM, New York, NY, USA, 445–452. https://doi.org/10.1145/2380116.2380173
- Liao et al. (2016) Yi-Chi Liao, Yi-Ling Chen, Jo-Yu Lo, Rong-Hao Liang, Liwei Chan, and Bing-Yu Chen. 2016. EdgeVib: Effective Alphanumeric Character Output Using a Wrist-Worn Tactile Display. In Proceedings of the 29th Annual Symposium on User Interface Software and Technology (Tokyo, Japan) (UIST ’16). ACM, New York, NY, USA, 595–601. https://doi.org/10.1145/2984511.2984522
- Luzhnica et al. (2017) Granit Luzhnica, Sebastian Stein, Eduardo Veas, Viktoria Pammer, John Williamson, and Roderick Murray Smith. 2017. Personalising Vibrotactile Displays Through Perceptual Sensitivity Adjustment. In Proceedings of the 2017 ACM International Symposium on Wearable Computers (Maui, Hawaii) (ISWC ’17). ACM, New York, NY, USA, 66–73. https://doi.org/10.1145/3123021.3123029
- Luzhnica and Veas (2019) Granit Luzhnica and Eduardo Veas. 2019. Optimising Encoding for Vibrotactile Skin Reading. In Proceedings of the 2019 CHI Conference on Human Factors in Computing Systems (Glasgow, Scotland Uk) (CHI ’19). ACM, New York, NY, USA, Article 235, 14 pages. https://doi.org/10.1145/3290605.3300465
- Luzhnica et al. (2018) Granit Luzhnica, Eduardo Veas, and Caitlyn Seim. 2018. Passive Haptic Learning for Vibrotactile Skin Reading. In Proceedings of the 2018 ACM International Symposium on Wearable Computers (Singapore, Singapore) (ISWC ’18). Association for Computing Machinery, New York, NY, USA, 40–43. https://doi.org/10.1145/3267242.3267271
- Mancini et al. (2014) Flavia Mancini, Armando Bauleo, Jonathan Cole, Fausta Lui, Carlo Porro, Patrick Haggard, and Gian Iannetti. 2014. Whole-Body Mapping of Spatial Acuity for Pain and Touch. Annals of Neurology 75 (06 2014). https://doi.org/10.1002/ana.24179
- Marquardt et al. (2018) Alexander Marquardt, Jens Maiero, Ernst Kruijff, Christina Trepkowski, Andrea Schwandt, André Hinkenjann, Johannes Schöning, and Wolfgang Stuerzlinger. 2018. Tactile Hand Motion and Pose Guidance for 3D Interaction. In Proceedings of the 24th ACM Symposium on Virtual Reality Software and Technology (Tokyo, Japan) (VRST ’18). Association for Computing Machinery, New York, NY, USA, Article 3, 10 pages. https://doi.org/10.1145/3281505.3281526
- McDaniel et al. (2011) Troy McDaniel, Morris Goldberg, Daniel Villanueva, Lakshmie Narayan Viswanathan, and Sethuraman Panchanathan. 2011. Motor Learning Using a Kinematic-Vibrotactile Mapping Targeting Fundamental Movements (MM ’11). Association for Computing Machinery, New York, NY, USA, 543–552. https://doi.org/10.1145/2072298.2072369
- Novich and Eagleman (2015) Scott Novich and David Eagleman. 2015. Using space and time to encode vibrotactile information: toward an estimate of the skin’s achievable throughput. Experimental brain research 233 (06 2015). https://doi.org/10.1007/s00221-015-4346-1
- Park and Choi (2018) Gunhyuk Park and Seungmoon Choi. 2018. Tactile Information Transmission by 2D Stationary Phantom Sensations. In Proceedings of the 2018 CHI Conference on Human Factors in Computing Systems (Montreal QC, Canada) (CHI ’18). ACM, New York, NY, USA, Article 258, 12 pages. https://doi.org/10.1145/3173574.3173832
- Park et al. (2016) Jaeyoung Park, Jaeha Kim, Yonghwan Oh, and Hong Z. Tan. 2016. Rendering Moving Tactile Stroke on the Palm Using a Sparse 2D Array. In Proceedings, Part I, of the 10th International Conference on Haptics: Perception, Devices, Control, and Applications - Volume 9774 (London, UK) (EuroHaptics 2016). Springer-Verlag, Berlin, Heidelberg, 47–56. https://doi.org/10.1007/978-3-319-42321-0_5
- Petrosino and Fucci (1989) Linda Petrosino and Donald Fucci. 1989. Temporal Resolution of the Aging Tactile Sensory System. Perceptual and Motor Skills 68, 1 (1989), 288–290. https://doi.org/10.2466/pms.1989.68.1.288 arXiv:https://doi.org/10.2466/pms.1989.68.1.288 PMID: 2928060.
- Pfeiffer et al. (2014) Max Pfeiffer, Stefan Schneegass, Florian Alt, and Michael Rohs. 2014. Let Me Grab This: A Comparison of EMS and Vibration for Haptic Feedback in Free-hand Interaction. In Proceedings of the 5th Augmented Human International Conference (Kobe, Japan) (AH ’14). ACM, New York, NY, USA, Article 48, 8 pages. https://doi.org/10.1145/2582051.2582099
- Raisamo et al. (2009) Jukka Raisamo, Roope Raisamo, and Veikko Surakka. 2009. Evaluating the Effect of Temporal Parameters for Vibrotactile Saltatory Patterns. In Proceedings of the 2009 International Conference on Multimodal Interfaces (Cambridge, Massachusetts, USA) (ICMI-MLMI ’09). Association for Computing Machinery, New York, NY, USA, 319–326. https://doi.org/10.1145/1647314.1647381
- Rantala et al. (2011) Jussi Rantala, Kalle Myllymaa, Roope Raisamo, Jani Lylykangas, Veikko Surakka, Pete Shull, and Mark Cutkosky. 2011. Presenting spatial tactile messages with a hand-held device. In 2011 IEEE World Haptics Conference. 101–106. https://doi.org/10.1109/WHC.2011.5945469
- Reinschluessel et al. (2018) Anke Verena Reinschluessel, Sarah Christin Cebulla, Marc Herrlich, Tanja Döring, and Rainer Malaka. 2018. Vibro-Band: Supporting Needle Placement for Physicians with Vibrations. In Extended Abstracts of the 2018 CHI Conference on Human Factors in Computing Systems (Montreal QC, Canada) (CHI EA ’18). ACM, New York, NY, USA, Article LBW039, 6 pages. https://doi.org/10.1145/3170427.3188549
- Rowin and Meriggioli (2007) Julie Rowin and Matthew N. Meriggioli. 2007. Chapter 19 - Proprioception, Touch, and Vibratory Sensation*. In Textbook of Clinical Neurology (Third Edition) (third edition ed.), Christopher G. Goetz (Ed.). W.B. Saunders, Philadelphia, 343–361. https://doi.org/10.1016/B978-141603618-0.10019-0
- Ryu et al. (2009) Dongseok Ryu, Gi-Hun Yang, and Sungchul Kang. 2009. T-Hive: Vibrotactile Interface Presenting Spatial Information on Handle Surface. In Proceedings of the 2009 IEEE International Conference on Robotics and Automation (Kobe, Japan) (ICRA’09). IEEE Press, 3542–3547.
- Schneider et al. (2015) Oliver S. Schneider, Ali Israr, and Karon E. MacLean. 2015. Tactile Animation by Direct Manipulation of Grid Displays. In Proceedings of the 28th Annual ACM Symposium on User Interface Software & Technology (Charlotte, NC, USA) (UIST ’15). ACM, New York, NY, USA, 21–30. https://doi.org/10.1145/2807442.2807470
- Schönauer et al. (2012) Christian Schönauer, Kenichiro Fukushi, Alex Olwal, Hannes Kaufmann, and Ramesh Raskar. 2012. Multimodal Motion Guidance: Techniques for Adaptive and Dynamic Feedback. In Proceedings of the 14th ACM International Conference on Multimodal Interaction (Santa Monica, California, USA) (ICMI ’12). ACM, New York, NY, USA, 133–140. https://doi.org/10.1145/2388676.2388706
- Searle et al. (1980) Shayle R Searle, F Michael Speed, and George A Milliken. 1980. Population marginal means in the linear model: an alternative to least squares means. The American Statistician 34, 4 (1980), 216–221.
- Seo and Choi (2015) Jongman Seo and Seungmoon Choi. 2015. Edge flows: Improving information transmission in mobile devices using two-dimensional vibrotactile flows. In 2015 IEEE World Haptics Conference (WHC). 25–30. https://doi.org/10.1109/WHC.2015.7177686
- Sherrick and Rogers (1966) Carl E. Sherrick and Ronald Rogers. 1966. Apparent haptic movement. Perception & Psychophysics 1 (1966), 175–180.
- Sofia and Jones (2013) Katherine Sofia and Lynette Jones. 2013. Mechanical and Psychophysical Studies of Surface Wave Propagation during Vibrotactile Stimulation. Haptics, IEEE Transactions on 6 (07 2013), 320–329. https://doi.org/10.1109/TOH.2013.1
- Spelmezan et al. (2009) Daniel Spelmezan, Mareike Jacobs, Anke Hilgers, and Jan Borchers. 2009. Tactile Motion Instructions for Physical Activities. In Proceedings of the SIGCHI Conference on Human Factors in Computing Systems (Boston, MA, USA) (CHI ’09). ACM, New York, NY, USA, 2243–2252. https://doi.org/10.1145/1518701.1519044
- Stratmann et al. (2018) Tim Claudius Stratmann, Andreas Löcken, Uwe Gruenefeld, Wilko Heuten, and Susanne Boll. 2018. Exploring Vibrotactile and Peripheral Cues for Spatial Attention Guidance. In Proceedings of the 7th ACM International Symposium on Pervasive Displays (Munich, Germany) (PerDis ’18). ACM, New York, NY, USA, Article 9, 8 pages. https://doi.org/10.1145/3205873.3205874
- Tan et al. (2003) Hong Tan, Rob Gray, and J. Young. 2003. A Haptic Back Display for Attentional and Directional Cueing. Haptics-e 3 (07 2003).
- Weber (1834) EH Weber. 1834. De subtilitate tactus. Ross HE, Murray DJ, eds.
- Weber and Ross (1978) Ernst Heinrich Weber and Helen Elizabeth Ross. 1978. The sense of touch. Academic Press for [the] Experimental Psychology Society.
- Weinstein (1968) S. Weinstein. 1968. Intensive and extensive aspects of tactile sensitivity as a function of body part, sex, and laterality. The skin senses. Proceedings of the First International Symposium March, (1968), 195–222.
- Yang et al. (2011a) Gi-Hun Yang, Yeonsub Jin, Moon-sub Jin, and Sungchul Kang. 2011a. Vibrotactile cradle for smart cell-phone providing spatial and directional cues. In 2011 IEEE International Conference on Robotics and Biomimetics. 938–943. https://doi.org/10.1109/ROBIO.2011.6181408
- Yang et al. (2011b) Gi-Hun Yang, Yeonsub Jin, Moon-sub Jin, and Sungchul Kang. 2011b. Vibrotactile display for hand-held devices and its preferable pattern generation. In 2011 15th International Conference on Advanced Robotics (ICAR). 223–228. https://doi.org/10.1109/ICAR.2011.6088602
- Yang et al. (2012) Gi-Hun Yang, Yeonsub Jin, and Sungchul Kang. 2012. Development of vibrotactile cradle for smart cell-phone providing spatial and directional cues. In 2012 IEEE RO-MAN: The 21st IEEE International Symposium on Robot and Human Interactive Communication. 259–264. https://doi.org/10.1109/ROMAN.2012.6343763
- Yang et al. (2010) Gi-Hun Yang, Moon sub Jin, Yeonsub Jin, and Sungchul Kang. 2010. T-mobile: Vibrotactile display pad with spatial and directional information for hand-held device. In 2010 IEEE/RSJ International Conference on Intelligent Robots and Systems. 5245–5250. https://doi.org/10.1109/IROS.2010.5651759
- Yannier et al. (2015) Nesra Yannier, Ali Israr, Jill Fain Lehman, and Roberta L. Klatzky. 2015. FeelSleeve: Haptic Feedback to Enhance Early Reading (CHI ’15). Association for Computing Machinery, New York, NY, USA, 1015–1024. https://doi.org/10.1145/2702123.2702396
- Yatani et al. (2012) Koji Yatani, Nikola Banovic, and Khai Truong. 2012. SpaceSense: Representing Geographical Information to Visually Impaired People Using Spatial Tactile Feedback. In Proceedings of the SIGCHI Conference on Human Factors in Computing Systems (Austin, Texas, USA) (CHI ’12). Association for Computing Machinery, New York, NY, USA, 415–424. https://doi.org/10.1145/2207676.2207734
- Yatani and Truong (2009) Koji Yatani and Khai Nhut Truong. 2009. SemFeel: A User Interface with Semantic Tactile Feedback for Mobile Touch-Screen Devices. In Proceedings of the 22nd Annual ACM Symposium on User Interface Software and Technology (Victoria, BC, Canada) (UIST ’09). Association for Computing Machinery, New York, NY, USA, 111–120. https://doi.org/10.1145/1622176.1622198
- Zhao et al. (2018) Siyan Zhao, Ali Israr, Frances Lau, and Freddy Abnousi. 2018. Coding Tactile Symbols for Phonemic Communication. In Proceedings of the 2018 CHI Conference on Human Factors in Computing Systems (Montreal QC, Canada) (CHI ’18). ACM, New York, NY, USA, Article 392, 13 pages. https://doi.org/10.1145/3173574.3173966