New measurement of the diffusion of carbon dioxide on non-porous amorphous solid water
Abstract
The diffusion of molecules on interstellar grain surfaces is one of the most important driving forces for the molecular complexity in the interstellar medium. Due to the lack of laboratory measurements, astrochemical modeling of grain surface processes usually assumes a constant ratio between the diffusion energy barrier and the desorption energy. This over-simplification inevitably causes large uncertainty in model predictions. We present a new measurement of the diffusion of CO2 molecules on the surface of non-porous amorphous solid water (np-ASW), an analog of the ice mantle that covers cosmic dust grains. A small coverage of CO2 was deposited onto an np-ASW surface at 40 K, the subsequent warming of the ice activated the diffusion of CO2 molecules, and a transition from isolated CO2 to CO2 clusters was seen in the infrared spectra. To obtain the diffusion energy barrier and pre-exponential factor simultaneously, a set of isothermal experiments were carried out. The values for the diffusion energy barrier and pre-exponential factor were found to be K and s-1. A comparison with prior laboratory measurements on diffusion is discussed.
keywords:
ISM; diffusion; molecules; astrochemistry; solid state; carbon dioxide1 Introduction
Dust grains in molecular clouds are covered by an ice mantle consisting of H2O, CO2, CO, NH3, CH4, and CH3OH[1]. Other molecules, particularly complex organic molecules, which are defined in the astronomy context as carbon-containing molecules with at least six atoms, should also be present in the ice[2]. Various laboratory experiments and astrochemical modeling suggest that most of these molecules are formed by chemical reactions in the solid state rather than formed in the gas phase and then condensed on the grain surface[2]. After their formation, they may desorb, either thermally or non-thermally, and return to the gas phase and be identified by radio telescopes.
One of the most important mechanisms for chemical reactions on grain surfaces is diffusion. Reactants on the surface need to diffuse in order to encounter the reaction counterparts. There are two types of diffusion, quantum diffusion, which is only important for very light species such as hydrogen, and thermal diffusion, which is relevant for almost all reactants. In most gas-grain astrochemical models, thermal diffusion is the dominant pathway to chemical reactions on grains[3, 4], although in recent years the role of thermal diffusion has been challenged and non-diffusive mechanisms have been proposed as well to account for the formation of complex organic molecules in interstellar ices[5, 6, 7, 8, 9].
Thermal diffusion is normally described by an Arrhenius equation with two parameters, the pre-exponential factor , and the diffusion energy barrier . The goal of laboratory experiments on diffusion is to quantify and for various atoms, radicals, and molecules on representative dust grain surfaces, such as water ice, silicate, or carbonaceous surfaces. Diffusion of reactants on silicate and carbonaceous surfaces is only important before the dust grains are covered by an ice layer. Once water starts to form on the bare grain surface, subsequent condensation of particles happens on top of the ice surface dominated by H2O. Most of the existing laboratory experiments on diffusion focused on amorphous water ice, i.e., the so-called amorphous solid water (ASW), which is the dominant form of water ice on the grain surface. This current study also focuses on the diffusion on ASW surface.
Several laboratory experimental studies focused on the diffusion of molecules on the surface of ASW, either on the outer surface of non-porous ASW (np-ASW) or through the inner pores of porous ASW (p-ASW). Zubkov et al. [10] deposited N2 on ASW of different thicknesses and performed temperature-programmed desorption (TPD) experiments, from which they obtained K and – s-1, respectively. Mispelaer et al. [11] presented one of the first systematic experimental studies on the diffusion of astro-relevant molecules in p-ASW. They covered the target molecule with ASW layers, and then warmed up the ice to a temperature at which the target molecules start to penetrate through the p-ASW and desorb from the ice. By monitoring the remaining amount of target molecules in the ice, they were able to quantify the diffusion rate through the pores. Though it is an important step ahead, it still has some limitations: (1) The diffusion might have already started even during the growth of the ASW layers, and it is not accurate to treat the beginning of the isotherm as the beginning of the diffusion process; (2) The structure of the ASW might be changing during the diffusion/desorption, since no annealing was done to stabilize the structure; (3) The effect of diffusion and desorption are mixed and very difficult to separate, therefore introducing large uncertainty; (4) Based on the design of the experiment, only a narrow temperature range can be explored, and the accuracy in diffusion energy barrier determination is limited. More recently, Maté et al. [12] used a similar approach to measure the diffusion rate of CH4 in ASW, and therefore inherited the same advantages and drawbacks.
Lauck et al. [13] measured the diffusion of CO in p-ASW. In their experiments, CO and water were deposited at 12 K. Then the ice was flash heated to a temperature between 15 and 23 K for isothermal experiments. They used the fact that pure CO and CO mixed with water ice has different infrared absorption peak shapes to trace the diffusion of CO in porous water ice. Pure CO ice has a sharp peak centered at about 2139 cm-1, while the mixture of CO and ASW has two peaks at 2139 and 2152 cm-1, respectively. As diffusion goes on, there is a gradual transition from pure CO to a mixture of CO and water. Therefore, the diffusion rate can be calculated from the time evolution of this transition. Compared to Mispelaer et al., Lauck et al. solved the problem of a limited temperature span, and the problem with desorption. However, the method by Lauck et al. suffers from an unstable ice structure during the diffusion process, and this method only works for CO diffusion on ASW.
He et al. (2017) [14] (referred to as He17 later) measured the diffusion of CO2 on np-ASW. Discrete CO2 molecules and CO2 clusters have different infrared absorption peaks. With less than a monolayer of CO2 present on the surface, when the surface temperature increases, CO2 diffuses and forms clusters. Therefore, there is a transition from discrete CO2 to CO2 clusters which is observable in infrared measurement. By using a rate equation model to simulate the diffusion process and to fit the experimental data, the diffusion energy barrier was calculated to be 2100 K. It has to be noted that in this study, the prefactor was assumed to be s-1, as is customarily done in these studies. If a different prefactor is assumed, the diffusion energy value would be different. It is important to determine both the prefactor and the diffusion energy value simultaneously. An energy value without the correct prefactor could be in error.
Kouchi et al. (2020) [15] used a transmission electron microscope (TEM) to measure the diffusion energy barrier of CO and CO2 on p-ASW. This is the first attempt to use the TEM technique to measure the diffusion of astro-relevant molecules. In their experiment, they first deposited 10 nm of water ice at 10 K and then deposited, for example CO, while taking TEM scans during deposition. When the ice is covered by the required amount of CO, and if the temperature is high enough for the crystallization to proceed[8], crystals of CO are formed in the ice. They interpreted the forming of crystals as a result of the diffusion of CO and used the distance between crystals to represent the average diffusion distance of CO molecules. By analyzing the diffusion distance at different temperatures, they calculated the diffusion energy barrier. The study by Kouchi et al. suffers from a few drawbacks: (1) The interpretation of the experimental result is not intuitive, and alternative interpretations exist. The observed temperature dependence of crystal distance may be a result of the temperature dependence of the phase transition of CO ice. Such alternative interpretations have to be checked before extending this method to a wider range of systems; (2) The water ice was unstable during the diffusion and could have affected the experimental results; (3) They could not determine the prefactor from the experiments; as mentioned above, it is important to determine both values simultaneously. A similar approach has recently been applied to a wider range of molecules[16].
He et al. (2018)[17] (referred to as He18 later) designed an experiment to measure diffusion based on the fact that when a molecule is binding to the dangling OH (dOH) site of p-ASW, the weak dOH absorption band in the infrared is red-shifted. In the experiment, porous water ice was grown at 10 K, stabilized by annealing to 70 K, and then cooled down to 10 K to deposit the target molecule. Then the ice was warmed to a specific temperature, for example, 20 K, and infrared spectra were measured continuously to monitor the shifting of dOH bands. When diffusion happens, a gradient in concentration of the target molecule is expected in the ice. After a long time, the whole pore surface is evenly covered by the target molecule, and almost all the dOH is at the shifted position. This method was applied to molecules including N2, O2, CO, CH4, and Ar, all of which wet the ASW surface. From the experiments, both the prefactor and energy barrier for diffusion were obtained. The prefactor was found to be mostly in the – s-1 range, and the diffusion energy barrier was roughly 0.3 times the upper bound of the desorption energy distribution on ASW. Table 1 shows a summary of the above-mentioned experimental studies and some key aspects of the experiments. The same method cannot be applied directly to non-wetting molecules such as CO2 [18]. In fact, we attempted to measure the diffusion of CO2 through p-ASW using the same method, but found no clear evidence of CO2 penetration into the p-ASW to form monomers. This is somehow in agreement with prior experimental studies on the segregation of CO2 from CO2:H2O ice mixtures. Several groups found that by warming up the mixture of CO2:H2O ice, CO2 tends to segregate and form clusters or islands, rather than mixing. This indicates that the interaction force between CO2 molecules is stronger than the interaction force between CO2 and ASW[19, 20, 21]. A TPD study of CO2 on ASW also supports this argument[14].
| Mi13 | La15 | He17 | He18 | Ko20/Fu22 | Ma20 | |
|---|---|---|---|---|---|---|
| Des. not interfere with dif. | ||||||
| H2O ice stable during dif. | ||||||
| Applicable to IR-inactive mol. | ||||||
| Both and obtained |
The mixed ice of CO2:H2O had been the focus of a number of experimental studies because of the presence of such mixture in interstellar ices[22, 23, 24, 19, 20, 25]. However, diffusion of CO2 on ASW surface was not addressed in those studies. Combining the strengths of both He17 and He18, we perform a new set of experiments to measure the diffusion rate of CO2 on np-ASW. Isothermal experiments are carried out at different temperatures and CO2 are allowed to diffuse and form clusters. We obtain the diffusion energy barrier and prefactor values simultaneously from the experiments.
2 Experimental
2.1 Experimental setup
Experiments were performed using an ultra-high vacuum (UHV) setup, which has been described previously [14, 17, 21]. The setup consists of a main UHV chamber and two molecular beamlines. In the present study, only the main UHV chamber was used. The chamber is pumped by a combination of scroll pumps, turbomolecular pumps, and a cryopump, and a base pressure of mbar is achieved after bake-out. Located at the center of the chamber is a gold-plated copper disk, which is used as the substrate onto which ice samples are grown. The substrate can be cooled down to 6 K using a closed-cycle helium cryostat, and heated up using a resistive heater. The temperature was measured using a silicon diode temperature sensor. A Lakeshore 336 temperature controller recorded and controlled the temperature to an accuracy of 0.05 K. Ice was grown on the substrate by gas/vapor deposition from the chamber background, following a procedure described in detail in He et al. (2018) [21]. Two separate computer-controlled leak valves (VAT variable leak valve 590) were used to deposit H2O and CO2, respectively. The thickness of the ice in monolayer (ML, defined as 1015 molecules per cm2) was calculated by integrating the chamber pressure during deposition, assuming the sticking as unity [26]. The ionization pressure gauge calibration factors for H2O and CO2 were taken into account in the calculation. Throughout the experiments, a Thermo Fisher Nicolet 6700 Fourier Transform Infrared Spectrometer (FTIR) in the Reflection Absorption Infrared Spectroscopy (RAIRS) configuration was used to monitor the ice composition over time. A spectrum was created by taking an average of nine scans every 12 seconds.
2.2 Experimental procedure
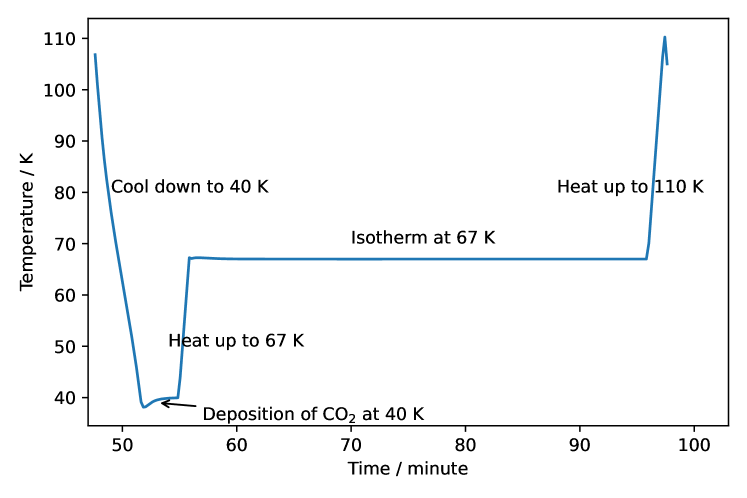
The gold surface was first covered with 30 ML of non-porous amorphous solid water (np-ASW) by vapor deposition at a rate of 6 ML/minute over 5 minutes while the substrate was at 130 K. It remained at 130 K for 20 minutes to stabilize the ice and pump out the residual gas. Subsequently, the substrate was cooled down to 40 K for CO2 deposition. 0.075 ML of CO2 was deposited on top of the np-ASW at a deposition rate of 0.1 ML/minute. At 40 K, CO2 does not diffuse[14], and the coverage is low enough so that almost all the CO2 molecules are monomers. After CO2 deposition, flash heating was applied to heat the substrate to the desired target temperature () at a ramp rate of 30 K/minute for the isothermal experiment. During the isothermal evolution, CO2 molecules diffuse and form clusters. For K, the temperature was held for 30 minutes to allow CO2 to diffuse and form clusters. For K, at which the diffusion is slower, 60 minutes were selected to provide sufficient time for diffusion. After the isothermal measurement, the sample was heated to 110 K to remove the CO2 ice and leave the np-ASW intact. By 110 K, there is no CO2 left on the surface, as evidenced by no signature of CO2 in the RAIRS spectra. The substrate was then cooled down to 40 K again for the next CO2 deposition. Figure 1 shows the temperature during one segment of the experiment. Different stages of the experiment are marked. To minimize human error, we used a LabVIEW program to regulate the temperature and gas deposition throughout the entire experiment. We explored the range between 56 and 68 K in 1 K steps.
3 Results and analysis
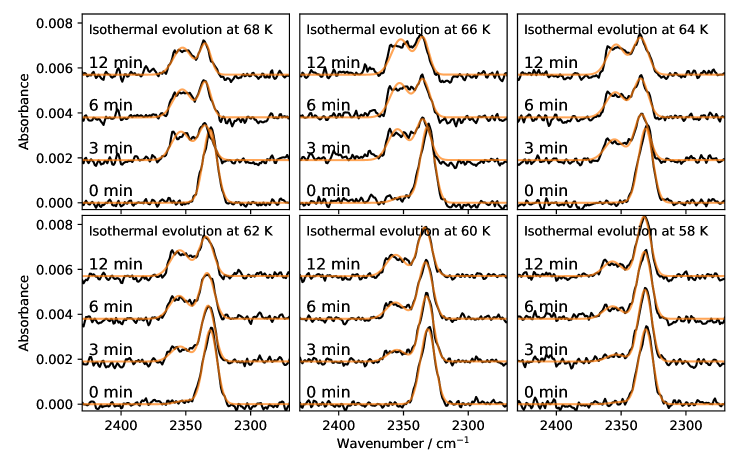
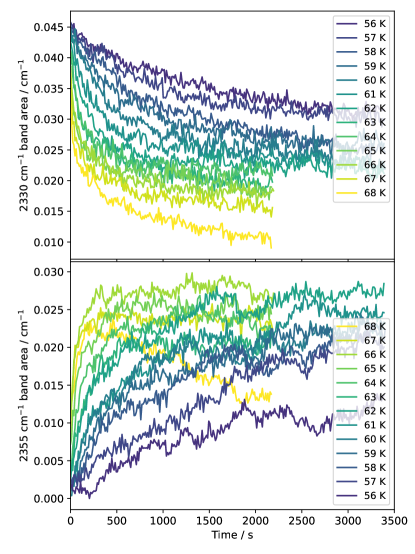
During the isothermal evolution at each temperature, RAIRS spectra are collected every 12 seconds, and a selection of them is displayed in Figure 2. At the very beginning of the isothermal evolution, the CO2 absorption profile shows a single peak at 2330 cm-1, which indicates isolated CO2 molecules, i.e., monomers, on the surface. This is to be expected given that the coverage is only 0.075 ML and the likelihood of cluster formation is very low before the diffusion process kicks in. After a certain period of time, the 2330 cm-1 peak drops and a new peak at 2355 cm-1, indicative of CO2 clusters [14], grows over time. This suggests that CO2 is diffusing to form clusters. Considering the very low coverage of CO2, we assume that the shifting of the adsorption peak position and the formation of clusters are only governed by the diffusion of CO2 molecules. The rate of diffusion should be temperature-dependent. Indeed, the shifting from 2330 to 2355 cm-1 peak is faster at 68 K than at 58 K. To quantify the rate of diffusion, we use two Gaussian functions to fit the two peaks and analyze the time and temperature dependence of them. Figure 2 shows the fitting of selected spectra using the sum of two Gaussian functions. This fitting is only an approximation, particularly, since the profile of the 2355 cm-1 peak is not exactly a Gaussian line shape [21]. Furthermore, even if all the CO2 are in the form of clusters or in the form of bulk CO2, the 2330 cm-1 component is not absent. This is seen in a prior paper [14], which shows that even if CO2 is allowed to have sufficient diffusion, both peaks are still present. Nonetheless, the shifting from one peak to the other still allows us to derive information about the kinetics. Figure 3 shows the resulting area of the two peaks during the isothermal evolution at each . When the 2330 cm-1 peak area decreases, the 2355 cm-1 peak area increases, except when the temperature is higher than 67 K, at which the 2355 cm-1 peak also drops. This is because the desorption of CO2 starts when the temperature is close to 67 K [14], and the total area of the two peaks decreases over time. In the other extreme, when the temperature is at 56 K and the diffusion is too slow, the area of the 2355 cm-1 peak is much noisier than the rest and is considered less reliable. As a result, for the diffusion analysis, we only consider the temperature range of 57 to 65 K.
Next, we use a model to describe the diffusion. Surface diffusion has been reviewed in previous publications [27, 28]. We refer intereted readers to those publications. When the concentration of molecules on the substrate surface is low enough so that the interaction force between them is negligible, the diffusion of molecules can be analyzed by assuming that they follow random walk. This type of diffusion is called tracer diffusion or intrinsic diffusion. On a 2D surface such as the np-ASW in the present study, CO2 molecules jumps from one adsorption site to the nearest neighbour. Although the np-ASW surface is by no means a regular periodic surface, for the sake of simplicity, we still use a 2D lattice to represent it. We have assumed that 1 ML of CO2 is equivalent to molecules per cm2; correspondingly, the lattice size is Å. In the random walk analysis, diffusion rate can be described by an Arrhenius equation:
| (1) |
is the diffusion energy barrier, and is the prefactor for diffusion. In the literature, the prefactor is sometimes referred to as the attempt frequency. In astronomy, it is a convention to omit the Boltzmann constant , and then the diffusion energy barrier has the unit Kelvin. We denote the time-dependent coverage of CO2 monomers and dimers as and , respectively. They are unitless variables defined to be the fraction of absorption sites holding monomers and dimers. In theory, larger clusters such as trimers should also be considered. However, due to the low coverage of CO2, the coverage of trimers should be much smaller than dimers and can be ignored. Once dimers are formed, we assume that they do not break apart before desorption. This is reasonable assumption, since the binding force between CO2 molecules is stronger than the binding force between CO2 and water [14], and CO2 molecules are prone to form clusters on ASW. Following He et al. (2017)[14], we describe the coverage of monomers and dimers using the following rate equations:
| (2) | ||||
| (3) |
Note that both the left and the right sides of the equations have the unit of s-1, since and are unitless. The initial condition of the rate equation is and . Solving the rate equation analytically, we have:
| (4) |
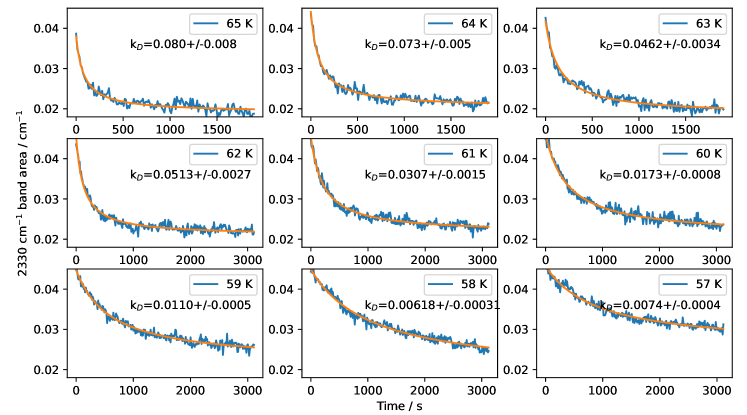
can be expressed as . The next step is to relate and to the area of the 2330 and 2355 cm-1 peaks. As discussed above, the 2330 cm-1 peak area is not exactly proportional to because also contributes to it. However, it is reasonable to assume they have a linear relation, that is:
| (5) |
where and are two free parameters. This is then used to fit the curves in the top panel of Figure 3, and the fitting as well as the corresponding value are shown in Figure 4.
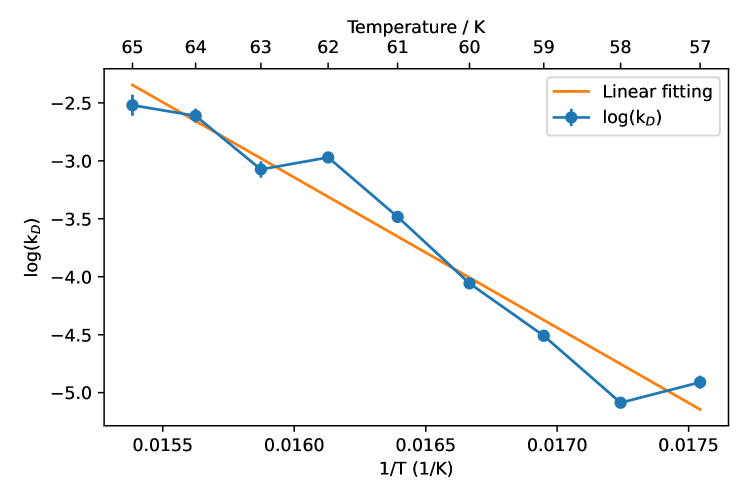
The diffusion rate expression in Equation 1 can be rewritten as:
| (6) |
This shows that is a linear function of with a slope of . In Figure 5 we make an Arrhenius-type plot. A linear fitting of it yields the slope and intercept, from which we obtain the diffusion energy barrier K, and prefactor s-1. In many other studies on diffusion, it is custom to report the Arrhenius expression of the diffusion constant (units of cm2 s-1) [27]:
| (7) |
is often called the diffusivity:
| (8) |
where is the change in entropy between the saddle point and the adsorption site, and is the small-amplitude frequency ( sec-1) of oscillation of the particle in the adsorption well. In this case, D0= cm2 s-1.
4 Discussions
Molecule diffusion is crucial for the chemistry on/in interstellar ice. However, laboratory measurements of diffusion are lacking, limiting the accuracy of astrochemical modeling of grain surface processes. The current study builds on prior studies [14, 17] to measure the diffusion energy barrier and prefactor for CO2 on np-ASW surface simultaneously. A whole set of isothermal experiments were carried out to quantify the diffusion rate at different temperatures, from which the energy barrier and the prefactor for diffusion were then obtained.
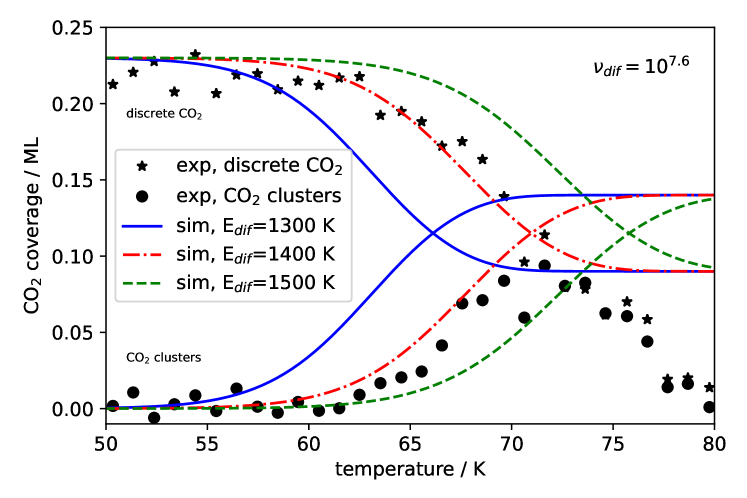
It is worthwhile to compare this study to prior experimental studies. He17 deposited a small coverage of CO2 on np-ASW and warmed up the ice slowly to monitor the shifting of infrared absorption peaks with increasing temperature. Because it was only a single measurement, it was not possible to derive the diffusion energy barrier and the prefactor simultaneously. It was assumed that the diffusion and desorption prefactor were the same, s-1, and based on a rate equation model, the value was calculated to be K, which is about 0.96 times the desorption energy of CO2 from np-ASW surface. The main drawback of He17 is the assumption that the diffusion and desorption prefactors are equivalent, which is typically not the case, as demonstrated by He18. Here we recalculate the value for the experiment that is shown in Fig. 10 of He17, but replacing the value s-1 by s-1 obtained from the present study. Figure 6 shows the equivalent of Fig. 10 in He17. By lowering the diffusion prefactor, the diffusion energy barrier is reduced to K, which is in agreement with the value obtained by the present study K within error allowance.
In the present study, we carried out isothermal experiments, similar to what He18 did, and indeed obtained a diffusion prefactor much lower than desorption, in agreement with He18. Based on prior studies on diffusion (see a review in [29]), it is not uncommon to see different diffusion prefactors, either higher or lower than the one for desorption. This present study, along with He18, makes a strong case that in astrochemical modeling one should make a distinction between diffusion prefactor and desorption prefactor . Based on these two studies, we suggest using a value about 3–5 orders of magnitude lower than in modeling. However, we acknowledge that this is only based on the measurement of a few volatile molecules on the ASW surface and that exceptions may be possible for other molecules. More diffusion measurements are required to confirm it.
Compared to He18, the Arrhenius fitting in Figure 5 has a much larger error, and correspondingly, the uncertainty of diffusion energy barrier and prefactor values are larger. At least the following factors contribute to the larger uncertainty:
-
1.
The peak profile of CO2 is more complicated than the dOH profile, as in He18. One cannot simply attribute the 2330 cm-1 peak exclusively to CO2 monomers. In our model, we had to simplify the problem by assuming a linear dependence between the coverage of monomers and the 2330 cm-1 peak area. This could be one important source of uncertainty.
-
2.
We assumed that there is only a single diffusion energy barrier that governs the formation of clusters. In practice, we cannot exclude the possibility that more than one activation energy is contributing.
-
3.
A Gaussian function does not describe the 2355 cm-1 component exactly. It is clear in Figure 2 that the fitting of the 2355 cm-1 peak is not ideal.
-
4.
Ignoring clusters larger than dimers may also induce some uncertainty.
A prior experimental determination of CO2 on ASW surface was also done by Kouchi et al. (2020)[15], who reported an energy value of 1500 K, which is slightly higher than what we found in the present study. This difference could be due to the uncertainty in the prefactor that is assumed in Kouchi et al. They were unable to determine the prefactor value simultaneously with the energy value. It would be interesting to repeat the experiments in Kouchi et al. at different temperatures and derive the values of both the prefactor and the energy simultaneously. Karssemeijer & Cuppen (2014)[30] did molecular dynamics modeling calculation of CO2 diffusion on water ice, and found the diffusion energy value to be K on a disordered water surface, which is close to our measured value.
In the present study, we only presented the experiments on np-ASW. Although the porosity of the ice mantle on interstellar grains is still under debate, it is probably the case that it is neither highly porous nor completely compact. It is still relevant to consider the diffusion on the surface of both p-ASW and np-ASW. We attempted to run experiments similar to He18, i.e., tracing the diffusion of CO2 into p-ASW by monitoring the infrared spectra. Unfortunately, the diffusion of CO2 on p-ASW surface is not efficient enough to allow entry into the pores. CO2 primarily remains in the top layers as “pure” CO2. The results are not shown here. Nonetheless, the results on np-ASW may apply to p-ASW as well. Previous experimental studies [31, 10] have suggested a similarity between the surface of a np-ASW and the pore surface of a p-ASW that is annealed to 60 K or above in terms of binding energy distribution and the fraction of dangling OH groups. The diffusion energy barrier and prefactor measured from np-ASW are likely to apply to the pore surface of p-ASW. We suggest that, in general, more experimental work is needed to measure diffusion on interstellar dust grain analogs.
Acknowledgement
We dedicate this paper to the memory of Dieter Gerlich, who was a good friend and colleague of some of us. We acknowledge the support from the European Research Council under the Horizon 2020 Framework Program via the ERC Advanced Grant Origins 83 24 28, and from NSF Astronomy & Astrophysics Research Grant #1615897.
References
- [1] A.C.A. Boogert, P.A. Gerakines and D.C.B. Whittet, Annu. Rev. Astron. Astrophys. 53, 541–581 (2015).
- [2] E. Herbst and E.F. van Dishoeck, Annu. Rev. Astron. Astrophys. 47 (1), 427–480 (2009).
- [3] R.T. Garrod and E. Herbst, Astron. Astrophys. 457 (3), 927–936 (2006).
- [4] K. Acharyya, Publ. Astron. Soc. Aust 39, e009 (2022).
- [5] M. Jin and R.T. Garrod, Astrophys. J., Suppl. Ser. 249 (2), 26 (2020).
- [6] R.T. Garrod, M. Jin, K.A. Matis, D. Jones, E.R. Willis and E. Herbst, Astrophys. J., Suppl. Ser. 259 (1), 1 (2022).
- [7] E. Herbst and R.T. Garrod, Frontiers in Astronomy and Space Sciences 8, 209 (2022).
- [8] J. He, F.E. Toriello, S.M. Emtiaz, T. Henning and G. Vidali, Astrophys. J. Lett. 915 (1), L23 (2021).
- [9] J. He, S. Góbi, G. Ragupathy, G. Tarczay and T. Henning, Astrophys. J. Lett. 931 (1), L1 (2022).
- [10] T. Zubkov, R.S. Smith, T.R. Engstrom and B.D. Kay, J. Chem. Phys. 127 (18), 184708 (2007).
- [11] F. Mispelaer, P. Theulé, H. Aouididi, J. Noble, F. Duvernay, G. Danger, P. Roubin, O. Morata, T. Hasegawa and T. Chiavassa, Astron. Astrophys. 555, A13 (2013).
- [12] B. Maté, S. Cazaux, M.Á. Satorre, G. Molpeceres, J. Ortigoso, C. Millán and C. Santonja, Astron. Astrophys. 643, A163 (2020).
- [13] T. Lauck, L. Karssemeijer, K. Shulenberger, M. Rajappan, K.I. Öberg and H.M. Cuppen, Astrophys. J. 801, 118 (2015).
- [14] J. He, S.M. Emtiaz and G. Vidali, Astrophys. J. 837 (1), 65 (2017).
- [15] A. Kouchi, K. Furuya, T. Hama, T. Chigai, T. Kozasa and N. Watanabe, Astrophys. J. Lett. 891 (1), L22 (2020).
- [16] K. Furuya, T. Hama, Y. Oba, A. Kouchi, N. Watanabe and Y. Aikawa, Astrophys. J. Lett. 933 (1), L16 (2022).
- [17] J. He, S. Emtiaz and G. Vidali, Astrophys. J. 863 (2), 156 (2018).
- [18] J.A. Noble, E. Congiu, F. Dulieu and H.J. Fraser, Mon. Not. R. Astron. Soc. 421 (1), 768–779 (2012).
- [19] R. Hodyss, P.V. Johnson, G.E. Orzechowska, J.D. Goguen and I. Kanik, Icarus 194, 836–842 (2008).
- [20] K.I. Öberg, E.C. Fayolle, H.M. Cuppen, E.F. van Dishoeck and H. Linnartz, Astron. Astrophys. 505, 183–194 (2009).
- [21] J. He, S. Emtiaz, A. Boogert and G. Vidali, Astrophys. J. 869 (1), 41 (2018).
- [22] P.A. Gerakines, W.A. Schutte, J.M. Greenberg and E.F. van Dishoeck, Astron. Astrophys. 296, 810 (1995).
- [23] O. Gálvez, I.K. Ortega, B. Maté, M.A. Moreno, B. Martín-Llorente, V.J. Herrero, R. Escribano and P.J. Gutiérrez, Astron. Astrophys. 472 (2), 691–698 (2007).
- [24] Ó. Gálvez, B. Maté, V.J. Herrero and R. Escribano, Icarus 197 (2), 599–605 (2008).
- [25] E.C. Fayolle, K.I. Öberg, H.M. Cuppen, R. Visser and H. Linnartz, Astron. Astrophys. 529, A74 (2011).
- [26] J. He, K. Acharyya and G. Vidali, Astrophys. J. 823, 56 (2016).
- [27] T.T. Tsong, Physica A Statistical Mechanics and its Applications 357, 250–281 (2005).
- [28] G. Antczak and G. Ehrlich, Surface Diffusion: Metals, Metal Atoms, and Clusters (, , 2010).
- [29] X. Wang, X. Xiao and Z. Zhang, Surf. Sci. 512 (1), L361–L366 (2002).
- [30] L.J. Karssemeijer and H.M. Cuppen, Astron. Astrophys. 569, A107 (2014).
- [31] J. He, A.R. Clements, S. Emtiaz, F. Toriello, R.T. Garrod and G. Vidali, Astrophys. J. 878 (2), 94 (2019).