Unsupervised Evaluation of Out-of-distribution Detection:
A Data-centric Perspective
Abstract
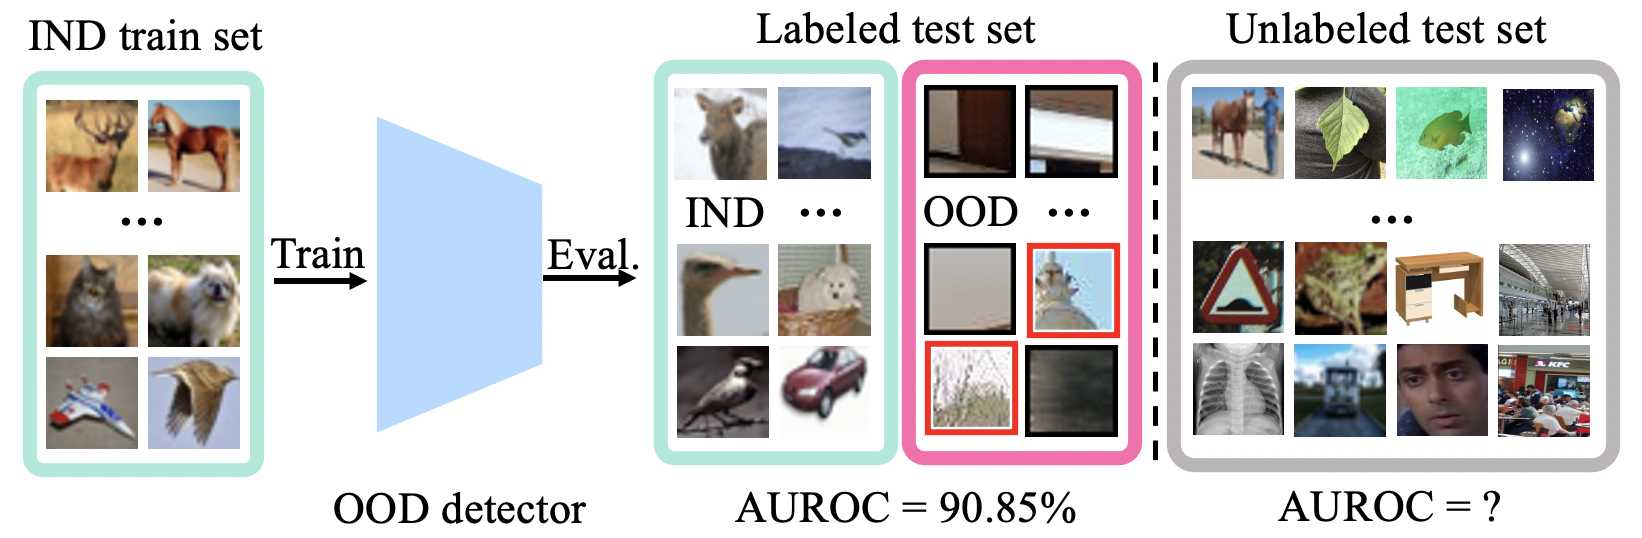
Out-of-distribution (OOD) detection methods assume that they have test ground truths, i.e., whether individual test samples are in-distribution (IND) or OOD. However, in the real world, we do not always have such ground truths, and thus do not know which sample is correctly detected and cannot compute the metric like AUROC to evaluate the performance of different OOD detection methods. In this paper, we are the first to introduce the unsupervised evaluation problem in OOD detection, which aims to evaluate OOD detection methods in real-world changing environments without OOD labels. We propose three methods to compute Gscore as an unsupervised indicator of OOD detection performance. We further introduce a new benchmark Gbench, which has 200 real-world OOD datasets of various label spaces to train and evaluate our method. Through experiments, we find a strong quantitative correlation between Gscore and the OOD detection performance. Extensive experiments demonstrate that our Gscore achieves state-of-the-art performance. Gscore also generalizes well with different IND/OOD datasets, OOD detection methods, backbones and dataset sizes. We further provide interesting analyses of the effects of backbones and IND/OOD datasets on OOD detection performance. The data and code will be available.
1 Introduction
Out-of-distribution (OOD) detection aims to detect image objects belonging to a different label space from the training categories, which is vital for the safe deployment of computer vision systems. For this problem, extensive efforts are made to find discriminative OOD scores [16, 33, 34], tune with OOD validation sets [18, 52, 49] or regularize training of OOD detectors [7, 20, 45, 23, 8], etc.
Existing works in this community typically perform evaluation on a test set with ground truths, which means they already know a sample belongs to in-distribution (IND) or OOD. Specifically, an OOD confidence score is usually computed for each test sample, and thresholds are used to make IND or OOD predictions. By comparing the predictions with ground truths, OOD detection performance (e.g., FPR@TPR95 [16], AUROC [33]) can be computed.
However, in deployment, the above evaluation routine faces challenges. A major one is that we would not have test ground truths, and even if we manage to have them for one environment it is prohibitively costly to annotate a test set every time we meet a new test environment. Therefore, we can no longer evaluate our system as we normally do. Besides, technically speaking, the system would encounter test samples from a wide range of OOD categories, instead of those commonly used label spaces like CIFAR-100 [29], SVHN [36]. This emphasizes the model evaluation in real-world environments: some categories are easier to be detected as outliers, while others more difficult; so detection performance on certain test sets like CIFAR-100 or SVHN does not reflect the detection performance on others.
Addressing these problems brings important benefits. From the perspective of real-world deployment, it allows us to predict system failure in different environments, without having to label test samples. From a scientific perspective, we will be able to better understand the properties of data from various label spaces and answer questions like what OOD datasets are more difficult to detect for a given detector and IND dataset.
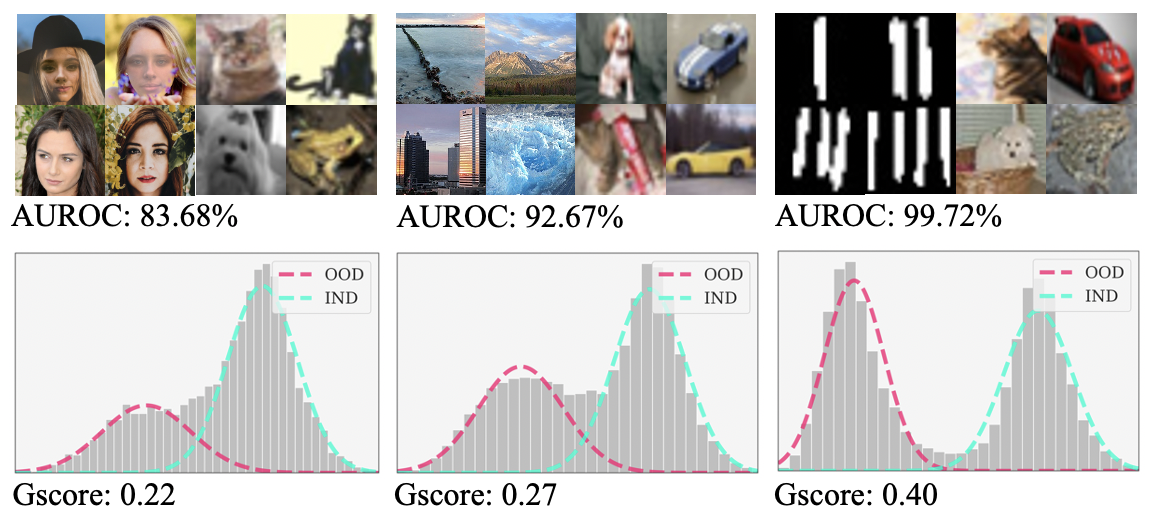
In light of the above discussions, we are the first to evaluate OOD detection methods on unlabelled test sets of various label spaces, which is illustrated in Fig. 1. In designing such an unsupervised evaluation method, we are mainly motivated by the observation that the OOD confidence score distribution on the test set is usually bimodal Fig. 2. Intuitively, a high separability between the two components (modalities) indicates that IND and OOD data are well separated, meaning high OOD detection performance. To reflect such separability, we propose Gscore (‘G’ for ‘generalization’) to represent the distribution difference between IND and OOD test data. We further propose three methods Kmeans, GMM and Unilateral Density Estimation (UDE) to compute the Gscore.
Though the motivation seems intuitive, we claim that previous works only provide a general feeling that large distribution difference leads to better performance. Our contribution lies in that we are the first to quantitatively connect an unsupervised proxy with OOD detection performance, which enables performance prediction without OOD labels. We utilize a regression model to fit the correlation between Gscore and OOD performance. When facing unlabelled test set, we only need to compute Gscore, then the trained regression model will predict the OOD performance. The other main contribution is that we propose a new benchmark named Gbench, which contains 200 real-world OOD datasets of various label spaces. We train and evaluate our proposed method in the Gbench and achieves state-of-the-art performance compared with other methods.
Our main observation is that we find a strong correlation between Gscore and OOD detection performance, which enables the regression model to fit the relationship between them. We further validate that this correlation still exists when we use different OOD detection methods, IND/OOD datasets, and test set sizes, which strongly supports unsupervised performance evaluation of different methods on various IND/OOD data without labels. Moreover, Gbench reveals some interesting observations about the effect of different backbones, IND/OOD datasets. For example, the classification performance shows a positive correlation with the OOD detection performance. In another example, if IND data changes, OOD detection performance on different OOD data changes drastically. Our contributions are summarized below.
-
•
We are the first to propose the problem of unsupervised evaluation of OOD detection. We propose three methods to compute Gscore to solve this problem and we find a strong quantitative correlation between the proposed Gscore and OOD detection performance, which enables OOD detection performance prediction even without OOD labels.
-
•
We introduce Gbench, a suite of 200 OOD datasets of various label spaces. It allows us to validate the quantitative relationship between Gscore and OOD detection performance and evaluate the performance of different unsupervised evaluation methods. Gbench can also be utilized as a benchmark to test the generalization ability of existing OOD detection methods.
-
•
Extensive experiments validate that our proposed Gscore achieves state-of-the-art performance under different OOD detetion methods, IND/OOD datasets and test set sizes. We further provide interesting findings utilizing Gbench, like the effect of different IND/OOD datasets or backbones on the OOD detection performance.
2 Related Work
Out-of-distribution (OOD) detection has been extensively studied [16, 33, 34, 30, 39, 22, 43, 14, 47, 44, 18, 7, 20, 45, 23, 8, 18, 52, 49, 50, 39]. MSP [16] is a widely used baseline, which directly uses the maximum softmax probability to detect OOD samples. ODIN [33] utilizes temperature scaling and adversarial perturbations to widen the gap between IND samples and OOD samples, which makes OOD detection easier. ENERGY [34] uses energy scores that are theoretically aligned with the probability density of the inputs, which are less susceptible to the overconfidence problem of softmax scores. Some other methods employ OOD sets for training [18, 52, 49] or train-time regularization [7, 20, 45, 23, 8]. However, these methods all evaluate their systems on test sets with ground truths. In this paper, we study the unsupervised evaluation problem, providing an orthogonal perspective to the OOD detection field.
Unsupervised model evaluation aims to predict model accuracy when we cannot acquire labels [6, 2, 5, 9, 41, 25, 38, 32, 42]. Deng and Zheng [6] utilize the Frechet distance between training and test sets, which can be used as a proxy for classification accuracy. Guillory et al. [12] propose difference of confidences, an uncertainty-based indicator to classification accuracy. Saurabh et al. [10] propose to learn a confidence threshold and use the proportion of unlabelled examples exceeding the threshold as a proxy for model accuracy. Ji et al. [24] first calibrate the model which gives better uncertainty scores for accuracy estimation. The above methods are all in the generic image classification field, while in this paper, we are the first to propose an indicator that is specifically designed for OOD detection.
3 Preliminary and Problem Definition
3.1 OOD detection revisit
Out-of-distribution (OOD) detection methods predict whether a test sample is from a different distribution from the training set. An OOD detection model is trained on a labeled in-distribution (IND) dataset , where is an image, is its class label, and is the number of images. In the testing phase, IND test set and OOD test set are mixed to form , where is an image, is the OOD label indicating whether image is from or . Usually, an OOD score which represents the probability of a sample belonging to the IND is acquired, denoted as . After selecting a score threshold , can be divided into two parts and . is the predicted IND dataset with and vice versa. They are compared to and to evaluate the performance of OOD detection methods. The most widely used metrics are FPR@TPR95 and AUROC. 1) FPR@TPR95 measures the false positive rate (FPR) when the true positive rate (TPR) is 95%. Lower scores indicate better performance. 2) AUROC is the area under the Receiver Operating Characteristic (ROC) curve, which represents the probability that an IND sample has a higher OOD score than an OOD sample. Higher is better.
3.2 Problem definition - unsupervised evaluation
We focus on the evaluation procedure, so the training phase has the same notations and process described in Section 3.1. In evaluation, instead of having a test set with ground truth labels , we assume an unlabelled test set is given. We aim to predict OOD detection performance , such as AUROC, of any given OOD detection method on different . Traditional OOD detection methods fail to predict as we do not have OOD labels and thus do not know which test sample is correctly detected and which one is not. In this paper, we find an unsupervised performance indicator (Gscore) to solve this problem. We first calculate Gscore without OOD labels as , where is the function to generate Gscore. After that, we utilize a trained regression model to predict the OOD detection performance only given Gscore , following . The regression model is trained on our constructed meta-train sets to regress the relationship between Gscore and detection performance . Note that meta-train sets have no overlap with the unlabelled test sets, details are illustrated in section 6.1.
4 Gbench: A Benchmark of 200 Datasets
As we need to quantitatively connect Gscore with detection performance , we construct many different meta-train sets . We collect 200 datasets as a dataset suite named Gbench. We utilize 150 of them as meta-train sets and the other as test sets. Note that the meta-train sets have no overlap with the test sets. All of these datasets are publicly available, either commonly used in computer vision research or released in Kaggle competitions. Some of the datasets, such as LSUN and Tiny-ImageNet are very commonly used in the OOD detection community. Other datasets are much less studied but have interesting content, such as medical images, crack detection, butterflies, faces, and satellite images. A complete list of the datasets is provided in the supplementary material.
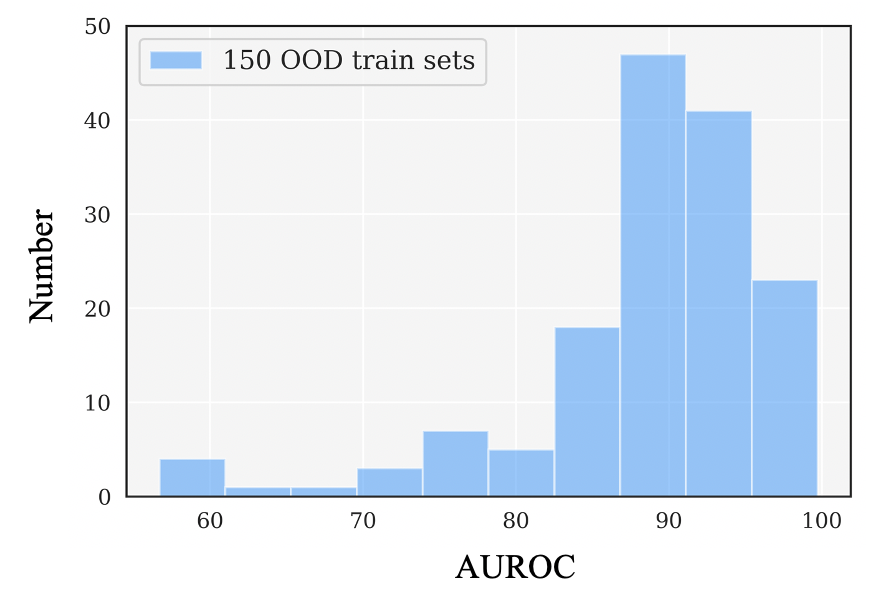
Moreover, Gbench has high diversity, in the sense that OOD detection performance on its 200 datasets varies significantly. Gbench contributes to the OOD detection community as it can also be utilized to evaluate the generalization ability of existing OOD detection methods. In the supplementary material, we present the AUROC distribution on 150 datasets111 A split of Gbench used for regression training. The ODIN method is used for detection. We observe that the AUROC ranges from around 57% to 100% 222 Random guess yields an AUROC of 50%., indicating that datasets in Gbench have a wide span in their OOD difficulty.
5 Proposed Approach
5.1 Gscore: a measurement of the separability of IND and OOD test data
Motivation of the design of Gscore. We are mainly inspired by Fig. 2, which shows that well separated IND and OOD data indicate higher OOD detection performance. To quantitatively reflect such separability, we design a proxy named Gscore. Specifically, we observe that the OOD scores on the test data usually form a bimodal distribution, and a few examples are shown in Fig. 2. If we could model the distributions of IND and OOD data, separately, we will be able to compute Gscore by measuring the distribution difference under certain metrics. Finally, we connect Gscore with OOD detection performance through a regression model. Thus, when facing unlabelled data, we can compute Gscore to estimate the corresponding detection performance. We describe distribution modeling and distribution difference measurement below.
Distribution modeling of IND and OOD test data. We can use unsupervised methods like Kmeans [28] and Gaussian mixture model (GMM) [37] to model the distribution of OOD scores on test sets. This modeling process can be further simplified because there are only two types of test data, i.e., IND and OOD. Therefore, we set the number of components in Kmeans and GMM to 2.
-
•
Kmeans starts with two random centroids and iteratively updates the centroids and .
-
•
GMM gives us means and and variances and of IND and OOD data, respectively.
Apart from Kmeans and GMM, we propose a Unilateral Density Estimation (UDE) method. Specifically, as all OOD detection methods [16, 33, 34, 30, 22, 43, 14, 47, 44, 18, 7, 45, 23, 8] train their models on in-distribution (IND) dataset, we set up a little part of the train set as validation set to estimate the confidence score distribution of IND data as a single Gaussian , denoted as . Experiments in the supplementary material show that the size of validation set has little effect on the performance of our method. Given an unlabelled test set, we measure the probability of each sample generated by following , , and use a threshold to divide all the test samples into IND and OOD subsets according to the score . The threshold choice is illustrated in Section 5.2. Finally, we use two single Gaussian distributions to separately model the OOD scores of IND and OOD subsets and obtain the corresponding distribution parameters , and , .
Measuring distribution difference between IND and OOD test data. After obtaining the distribution parameters, we compute the distribution difference between IND and OOD test data, using existing metrics. The resulting distance is named Gscore. Specifically, we could use distance, KL divergence or Wasserstein distance. For Kmeans, it outputs the 2 centroids, denote as and . L2 distance is computed as , where , are , . GMM and UDE return the mean and standard variance of the two distributions, denoted as , , , . KL divergence distance is computed using:
| (1) |
Wasserstein distance is computed by:
| (2) |
where , can take the value of , , respectively and , can be , , respectively. Because KL divergence is asymmetric, , can also be , .
5.2 Regression to quantitatively connect Gscore and OOD detection performance
Training. We aim to train a regression model that uses Gscore as input and the latent truth OOD detection performance as target. When facing with unlabelled test sets, the pretrained regression model will predict the OOD detection performance only given the unsupervised indicator Gscore.
Formally, assume we have meta-train sets. Each meta-train set can be denoted as , where can be the CIFAR-10 training set, and is the th OOD dataset. We first extract Gscore from the meta-train set, and then get the corresponding latent truth OOD detection performance for the training of the regression model. The linear regression model is written as,
| (3) |
where and are regression parameters. We use a standard least square loss to optimize this regression model.
Validation. Our system has only one hyperparameter, which is the threshold when we use UDE for distribution modeling. We select its value on the meta-train sets , by enumerating its possible values from 0 to 1 with an interval of 0.1. After acquiring the initial , we can repeat the process from to to choose a finer with an interval of 0.01. More specifically, every time we train a regression model with a certain value of , we record the final loss value. We decide the optimal value such that the regression model has the minimal train loss value. We evaluate our model using . Note that GMM is also with a validation process while Kmeans is not. More details are in the supplementary material.
Testing. Given an unlabelled test set , we first compute its Gscore . We then predict the detector performance on by . Note that our meta-train sets are composed by part of CIFAR-10 train set and OOD datasets, while the unlabelled test set is composed by CIFAR-10 test set and different OOD datasets from meta-train sets, none of them are seen during the training phase.
| Unsup. Eval. Methods | FPR@TPR95 | AUROC | |||||||
| MSP | ODIN | ENERGY | MLS | MSP | ODIN | ENERGY | MLS | ||
| Confidence score (Baseline) | 71.86±0.56 | 40.33±2.13 | 46.33±1.87 | 47.30±1.53 | 17.95±0.54 | 12.75±1.20 | 13.67±0.86 | 13.65±0.84 | |
| Auto evaluation | 12.69±0.61 | 12.69±0.61 | 12.69±0.61 | 12.69±0.61 | 5.92±0.33 | 5.92±0.33 | 5.92±0.33 | 5.92±0.33 | |
| Gscore (Kmeans + l2) | 8.73±1.22 | 10.97±0.86 | 6.79±0.73 | 6.93±0.77 | 5.32±0.75 | 5.25±0.38 | 5.01±0.75 | 5.17±0.79 | |
| Gscore (GMM + Wasserstein) | 4.41±0.66 | 6.89±0.46 | 7.28±0.79 | 6.30±0.68 | 4.81±0.55 | 4.53±0.41 | 5.44±0.84 | 4.85±0.54 | |
| Gscore (UDE + Wasserstein) | 3.46±0.63 | 4.50±0.23 | 4.39±0.55 | 4.52±0.57 | 3.64±0.27 | 3.86±0.32 | 4.02±0.51 | 4.08±0.52 | |
5.3 Discussion
Difference between existing methods Traditional OOD detection methods cannot evaluate their performance without OOD labels, while our proposed method solves this problem. The most related work to our method is the unsupervised evaluation of image classification task [6], while it is not suitable for OOD detection task. It computes the feature distance between unlabelled test dataset and the original dataset to represent the hardness of the test dataset. However, we claim that feature distance do not reflect the performance of different OOD detection methods. Furthermore, [6] can only deal with datasets with the same label space while our proposed method is agnostic to the label spaces of different OOD datasets. We quantitatively compare with [6] in section 6.2.
Kmeans / GMM vs. UDE. Kmeans and GMM are easy to use, and the number of components is predefined as 2 for both methods. However, their performance degrades when IND and OOD test data overlap much or the IND:OOD sample numbers are imbalanced (shown in the supplementary material). In comparison, UDE achieves better performance under both conditions.
Model-centric, unsupervised evaluation. This paper mainly studies the scenarios where the test set undergoes changes, which is a data-centric problem. It would be interesting to predict the performance of numerous OOD detectors on a fixed test set, rendering a model-centric perspective. We emphasize that these two problems rely on the characteristics of data and model, respectively, and are thus different in nature. We would like to study the model-centric problem in future work.
Unsupervised evaluation in batches instead of in test sets. In deployment, it would be easier to obtain a batch of test samples than an entire test set. As to be shown in section 6.3, our method is still effective on small test sets of 50 samples, which is equivalent to mini-batches.
6 Experiments and Analysis
6.1 Implementation details
By default, CIFAR-10 [29] is treated as IND data. We split CIFAR-10 train set into 5 partitions, 4 for training the OOD detector backbone, and the rest as the meta-train IND set. We use the training splits to train a strong backbone model DLA [51] and 4 different OOD detectors, including MSP [16], ODIN [33], ENERGY [34] and MLS [14]. The classification accuracy of the DLA [51] model on the CIFAR-10 test set is 93%.
We train a regression model on meta-train sets to solve the problem of unsupervised evaluation of OOD detection. We randomly choose 150 OOD datasets from Gbench and mix them with the meta-train IND set to construct 150 meta-train sets. For evaluation of the trained regression model, we use the rest 50 OOD datasets of Gbench and mix with the CIFAR-10 test set to form 50 test sets. Notice that the test sets have no overlap with the meta-train sets. We compare the predicted OOD detection performance with the ground truth performance on the 50 test sets and compute the root mean squared error (RMSE) as the evaluation metric. All experiments are conducted on a server with AMD 2950X CPU and 4 NVIDIA RTX 2080Ti GPUs.
If other IND datasets such as Clothing1M [48] are used, we make sure that the datasets that have class overlap with the IND dataset are manually removed from the datasets of Gbench, details are in the supplementary material.

6.2 Main results
Our algorithm achieves state-of-the-art performance under various test sets. We evaluate our method on 50 randomly selected OOD test sets and 4 different OOD detectors. Each experiment is repeated for 5 times with different train/test splits. We report the mean and standard deviation of RMSE on the 50 OOD test sets in Table 6. Our baseline utilizes confidence score to estimate the OOD labels, if confidence score is over 0.9, we label the sample as IND. We also compare with the state-of-the-art auto evaluation method in image classification [6]. We have three major observations.
First, all our three methods outperform the baseline and auto evaluation [6], our UDE outperforms them by large margins. Though confidence score (baseline) performs well in image classification field, it fails in unsupervised evaluation of OOD detection, as confidence score cannot reflect the performance of OOD detectors. Auto evaluation [6] utilizes Frechet distance to measure the distance of features to indicate the hardness of classification task. While in Table 6 we have shown that measuring feature distance is not suitable for OOD detection tasks, as the feature distance is not strongly related to the OOD detection performance like OOD scores. Furthermore, auto evaluation considers one dataset as a distribution while it is not suitable for OOD detection as one OOD test set contains two distributions.
Second, Gscore obtained by UDE and Wasserstein distance achieves the best result under all conditions. For example, the RMSE scores in predicting FPR@TPR95 and AUROC are 3.46±0.63% and 3.64±0.27%, respectively, under the MSP detector, which means in real-world OOD test sets, our method can predict the OOD detection performance with around 3.5% error even without OOD labels.
Third, for different OOD detectors, our performance prediction results are consistently good. For example, when predicting AUROC, the RMSE scores for the four different detectors are 3.64±0.27%, 3.86±0.32%, 4.02±0.51%, and 4.08±0.52%, respectively, which are rather stable.
We also compare with a few variants, characterized by Kmeans / GMM with other distance metrics, each with its best distance metric. Results using other distance metrics in Section 5.1 are shown in the supplementary material. We observe that UDE+Wasserstein is the best. The reason lies in that UDE leverages a part of meta-train IND set as validation set, and thus can better estimate the two distributions.
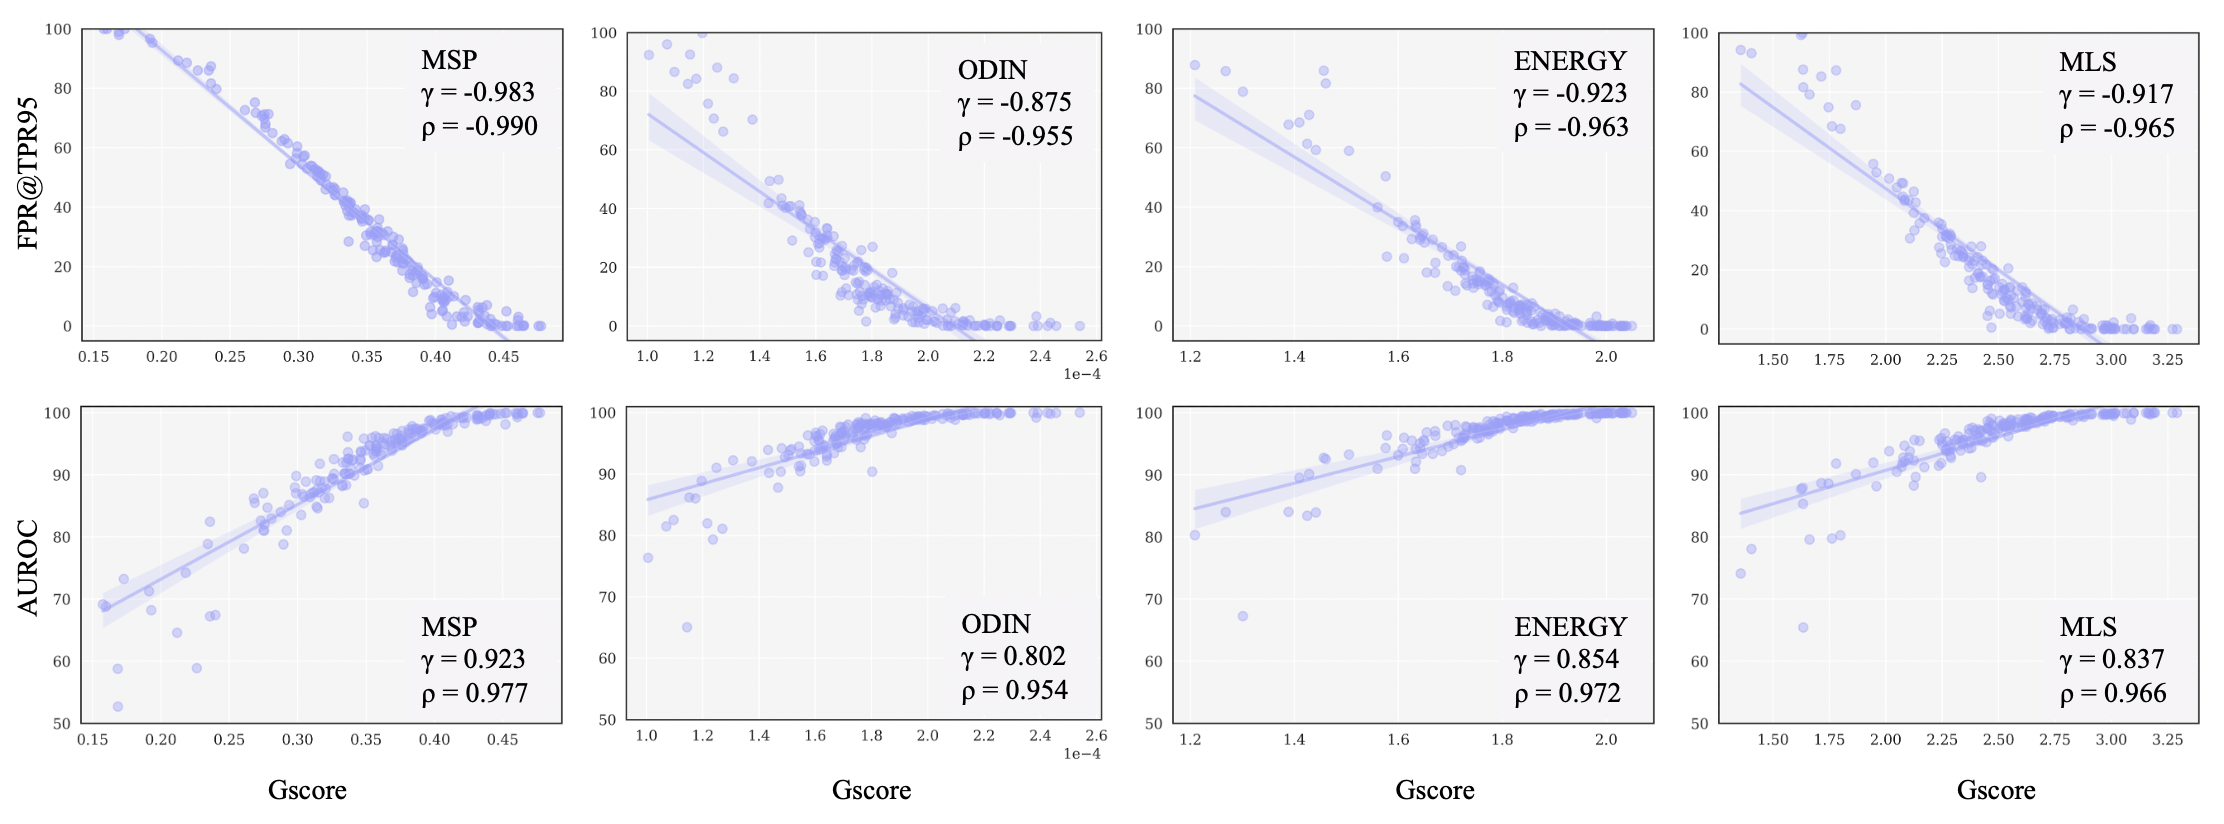
The strong correlation between Gscore and OOD detection performance. We now verify that the good estimates are due to the effectiveness of Gscore. We use a random Gbench split and plot the OOD detection performance (FPR@TPR95 and AURUC) on the 150 meta-train sets against their Gscores. Four detection methods are shown, and IND dataset is CIFAR-10. Results are presented in Fig. 3. Pearson Correlation Coefficient [1] and Spearman Correlation Coefficient [26] are used to measure correlation linearity and monotonicity. Both range from [, ] and a value closer to or indicates a strong negative or positive correlation, respectively.
We clearly observe that Gscore has a strong correlation with FPR@TPR95 and AUROC. Across all the eight figures, the mean absolute values of and are 0.911 and 0.936, respectively. Such strong correlation under different OOD detection methods is very close to the linear relationship, which supports evaluation on unlabelled test sets.
We also find Gscore generally has a stronger correlation with FPR@TPR95 than AUROC, with the mean absolute value of as versus ( has a similar trend). The reason might be that FPR@TPR95 measures FPR at a certain OOD score threshold, while AUROC considers all the possible thresholds. Thus, AUROC represents the entire shape of the two distributions, while FPR@TPR95 mainly represents the degree of overlap at the chosen threshold, which is more closely related to the Gscore.
6.3 Variant studies and analysis
| Backbone | VGG | ResNet-18 | DenseNet-121 | ResNet-101 |
| Acc | 91.06 | 93.59 | 95.50 | 95.68 |
| LT | 73.15 | 61.44 | 53.29 | 51.08 |
| Pred | 75.11 | 60.31 | 52.98 | 49.94 |
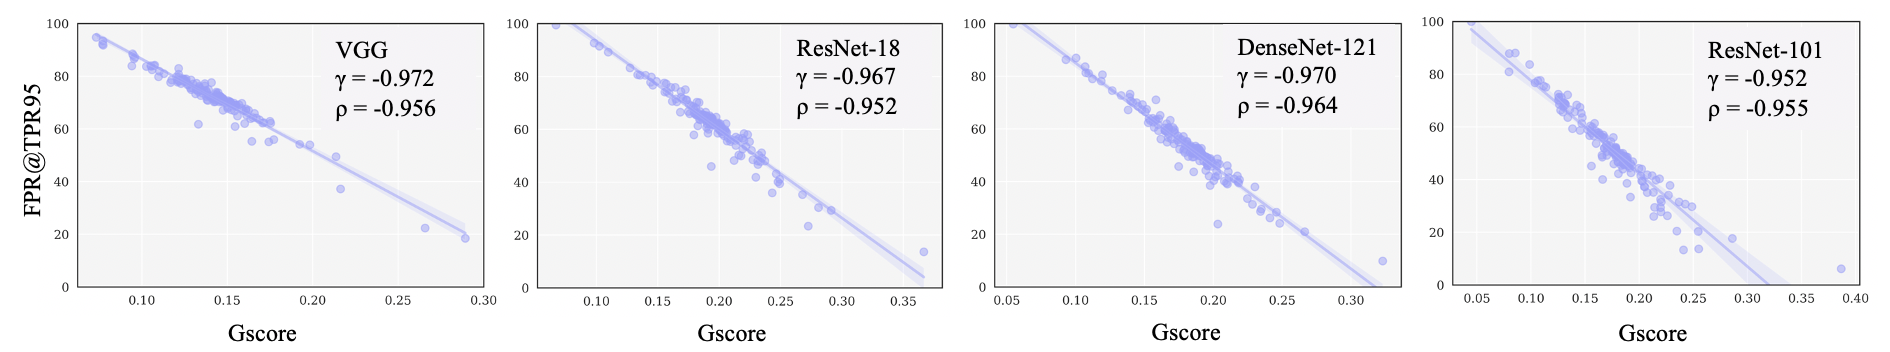
Different backbones and IND sets. We conduct experiments with different backbones, VGG [40], ResNet [13] and DenseNet [21]. The results on 150 meta-train sets are shown in Fig. 4, which indicates the strong correlation between Gscore and OOD detection performance holds across different backbones, with the absolute value of consistently higher than 0.952. We further evaluate our method on 50 test sets, and the result is shown in Table 2. It indicates that our method accurately predicts the OOD detection performance on unlabelled test sets, which means our method generalizes well on different backbones. We also observe that the classification accuracy of the backbone shows a positive correlation with the OOD detection performance, which is consistent with previous findings [46, 17].
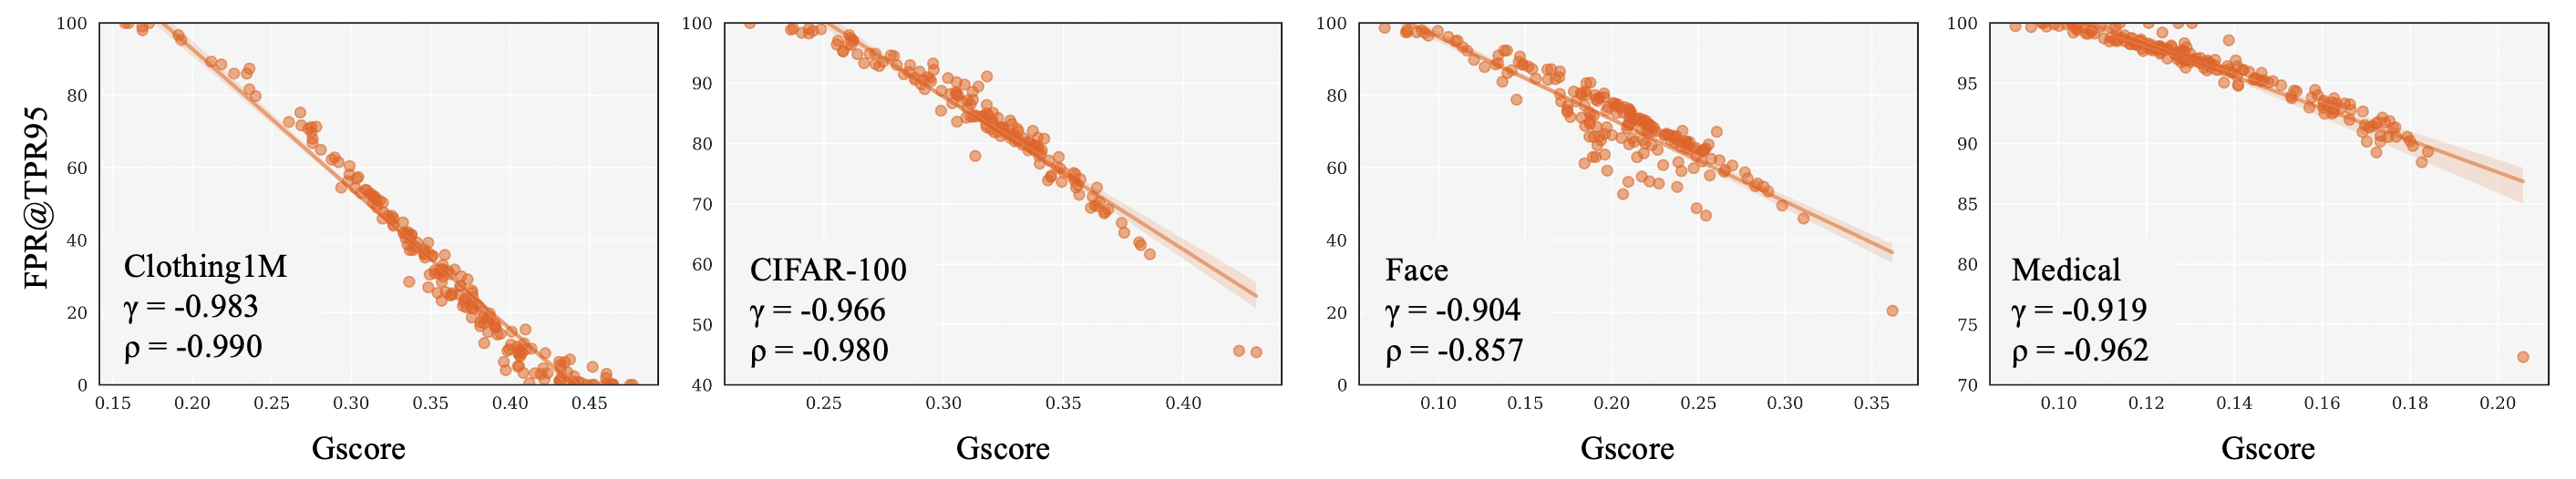
Impact of different IND data. To further analyze our performance prediction method, we change the IND dataset to Clothing1M [48], Face images [11], CIFAR-100 [29], and Medical images [27]. We plot FPR@TPR95 against Gscore in Fig. 5 with the MSP detector. We notice for medical images, there is an OOD dataset point with very good performance. We find that dataset contains various colormaps while medical images are grayscale images, which makes OOD detection very easy. More analysis and experiments with other detectors are shown in the supplementary material. The strong correlation between Gscore with FPR@TPR95 can still be observed in Fig. 5, which indicates our method works well under different IND datasets.

| IND set | Clothing1M | Face | CIFAR-100 | Medical |
| Acc | 71.26 | 73.25 | 71.36 | 70.83 |
| LT | 29.74 | 74.84 | 86.60 | 95.59 |
| Pred | 29.15 | 74.92 | 88.31 | 97.00 |
Moreover, we find from Table 3 that IND datasets have a non-negligible influence on the OOD detection performance. While the backbones have similar classification accuracy on IND datasets, the OOD detection performance varies in a wide range. There might be a few possible reasons. For example, Clothing1M, compared with CIFAR-100 may be much more different from the OOD datasets. It is also possible that Clothing1M forms a very compact feature space due to its small inter-class distance, and thus makes other label spaces more distinguishable. The difficulty of face images lies between Clothing1M and CIFAR-100. The detection performance is low when IND data are medical images. We speculate the reason lies in that the medical image dataset has only two classes, which impedes the backbone learning to extract useful features to generalize to various OOD datasets. Under all different IND datasets, our method generalizes well and predicts accurate OOD detection performance compared with the latent truth.
Impact of the size and IND:OOD ratio of test sets. In OOD detection community, it is typically assumed that test sets are reasonably large and have a similar number of IND and OOD test samples. However, both aspects might vary in practice. We thus analyze whether our method is still effective under different scenarios. To change the IND:OOD ratio, we first make sure each test set has IND:OOD ratio of 1:1, we then down-sample IND samples to make the ratio smaller, while down-sample OOD samples to make the ratio larger, generating a ratio from 1:100 to 100:1. To change the size of the test set, we keep the IND:OOD ratio at 1:1, and reduce the total sample number. Results are summarized in Fig. 9, from which we have the following findings.
First, when the ratio of IND to OOD data increases from 1:100 to 1:1 and then to 100:1, the correlation coefficient first increases and then decreases. The correlation remains at a high level between 1:10 and 10:1, which demonstrates the robustness of our algorithm.
Second, we find our method effective when the test set contains as few as 50 or 100 samples, effectively meaning mini-batches. It means we could predict OOD detection performance with mini-batches instead of a large test set.
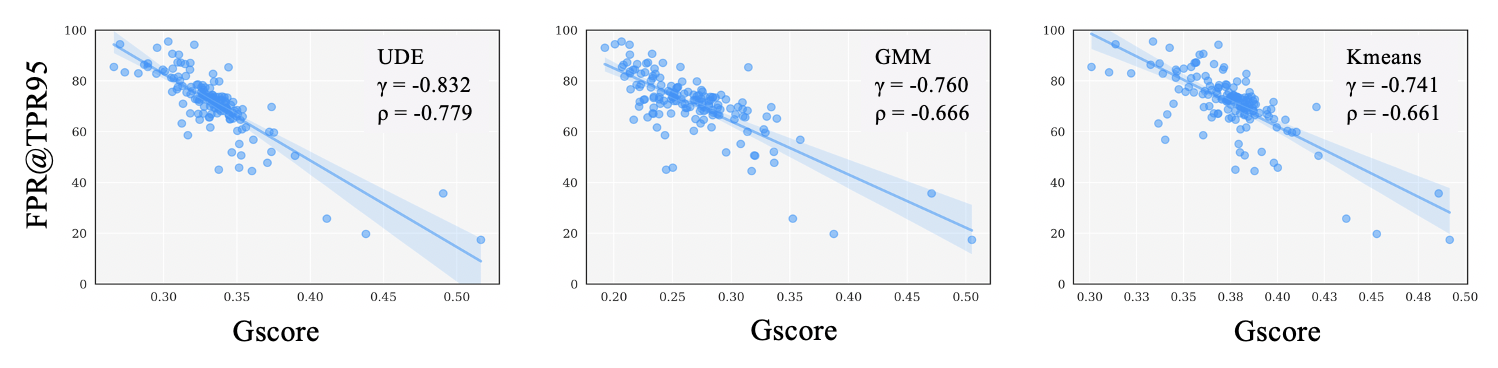
Third, we further carry out experiments on Gbench with both different ratios of IND and OOD data and different dataset sizes, which creates a rigorous evaluation scenario. The dataset size generation details are provided in the supplementary material. The results are shown in the right of Fig. 9, UDE outperforms GMM with the absolute value of correlation coefficient as 0.832 versus 0.760. The reason lies in that GMM neglects the IND distribution in the original meta-train set, which degrades its performance when the dataset sizes of IND and OOD data are highly imbalanced.
Predicting other OOD detection performance metrics. We demonstrate that our proposed method can predict various OOD detection metrics. We report the correlation coefficient and . The results in Tabele 4 show that Gscore generalizes well to other metrics. The performance on F@T60 is low because when TPR=60%, FPR is close to 0, in such case, the strong correlation ends with a flat line.
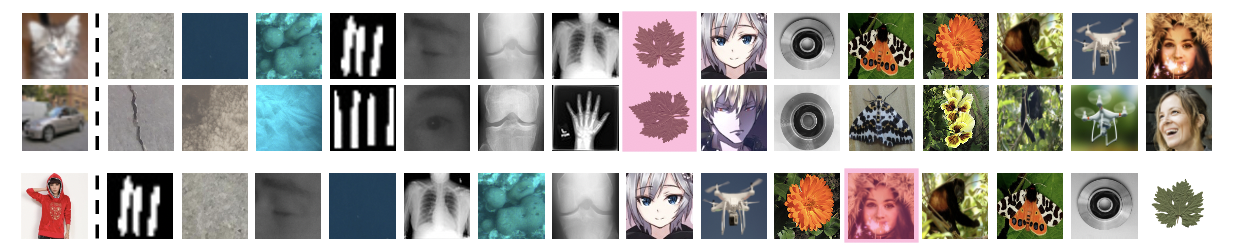
Difficulty of OOD sets: preliminary analysis. The Gbench allows us not only to evaluate the accuracy prediction performance, but also to visualize and analyze the difficulty of different datasets in OOD detection, i.e., which types of OOD data are harder to detect w.r.t a given IND set? To answer this question, we use different IND datasets and visualize OOD datasets from easy to hard in Fig. 7. The names of all the datasets are in the supplementary material.
| Metric | DE | F@T95 | F@T80 | F@T60 | AUROC | AUPR |
| Pearson | -0.976 | -0.977 | -0.866 | -0.746 | 0.842 | 0.771 |
| Spearman | -0.968 | -0.971 | -0.923 | -0.826 | 0.900 | 0.794 |
When CIFAR-10 is used as IND data, the most difficult OOD datasets are those related to faces, drones and monkeys. We speculate that faces and monkeys and their background look like the cat and dog categories in CIFAR-10. Drones have similar appearance to airplane. When we switch to Clothing1M as IND data, the hard OOD datasets are completely different. We notice Clothing1M contains many images with white ground, which makes OOD datasets with white backgrounds harder. Interestingly, the difficulty of OOD datasets changes drastically under different IND datasets. For example, the leaves dataset is a very hard OOD dataset for Clothing1M, while it is easy for CIFAR-10. We also notice that under both IND datasets, easy OOD datasets remain more or less the same: they generally have simple colors and simple patterns, such as crack images and number images. The above visualization and analysis are still preliminary but very interesting. We will investigate into this dataset understanding problem by developing more principled tools. A future direction would be tailoring OOD detectors for specific IND datasets.
7 Conclusion
When we deploy an OOD detection method, from the unlabelled test samples we can observe a distribution of OOD scores. From this distribution only, we aim to predict how well the OOD detector performs. We are particularly interested in this unsupervised evaluation problem under various OOD datasets with a wide range of label spaces. We design a Gscore indicator, computed as the distribution difference between IND and OOD samples, which can be best modeled by our proposed unilateral density estimation approach. On a newly collected benchmark with 200 datasets of various label spaces, we show that Gscore exhibits a strong correlation with OOD detection performance and allows us to use linear regression to accurately predict the performance without OOD labels. We show our algorithm is stable under various OOD detectors, backbones and IND datasets. We also provide interesting insights of the effect of different backbones, IND datasets, and the difficulty of OOD datasets.
References
- [1] Jacob Benesty, Jingdong Chen, Yiteng Huang, and Israel Cohen. Pearson correlation coefficient. In Noise reduction in speech processing. 2009.
- [2] Jiefeng Chen, Frederick Liu, Besim Avci, Xi Wu, Yingyu Liang, and Somesh Jha. Detecting errors and estimating accuracy on unlabeled data with self-training ensembles. NeurIPS, 34, 2021.
- [3] Mircea Cimpoi, Subhransu Maji, Iasonas Kokkinos, Sammy Mohamed, and Andrea Vedaldi. Describing textures in the wild. In CVPR, 2014.
- [4] Jia Deng, Wei Dong, Richard Socher, Li-Jia Li, Kai Li, and Li Fei-Fei. Imagenet: A large-scale hierarchical image database. In CVPR, 2009.
- [5] Weijian Deng, Stephen Gould, and Liang Zheng. What does rotation prediction tell us about classifier accuracy under varying testing environments? In ICML. PMLR, 2021.
- [6] Weijian Deng and Liang Zheng. Are labels always necessary for classifier accuracy evaluation? In CVPR, 2021.
- [7] Terrance DeVries and Graham W Taylor. Learning confidence for out-of-distribution detection in neural networks. arXiv preprint arXiv:1802.04865, 2018.
- [8] Xuefeng Du, Zhaoning Wang, Mu Cai, and Yixuan Li. Vos: Learning what you don’t know by virtual outlier synthesis. ICLR, 2022.
- [9] Saurabh Garg, Sivaraman Balakrishnan, Zachary C Lipton, Behnam Neyshabur, and Hanie Sedghi. Leveraging unlabeled data to predict out-of-distribution performance. arXiv preprint arXiv:2201.04234, 2022.
- [10] Saurabh Garg, Sivaraman Balakrishnan, Zachary Chase Lipton, Behnam Neyshabur, and Hanie Sedghi. Leveraging unlabeled data to predict out-of-distribution performance. In ICLR, 2022.
- [11] Ian J Goodfellow, Dumitru Erhan, Pierre Luc Carrier, Aaron Courville, Mehdi Mirza, Ben Hamner, Will Cukierski, Yichuan Tang, David Thaler, Dong-Hyun Lee, et al. Challenges in representation learning: A report on three machine learning contests. In International conference on neural information processing, pages 117–124. Springer, 2013.
- [12] Devin Guillory, Vaishaal Shankar, Sayna Ebrahimi, Trevor Darrell, and Ludwig Schmidt. Predicting with confidence on unseen distributions. In ICCV, 2021.
- [13] Kaiming He, Xiangyu Zhang, Shaoqing Ren, and Jian Sun. Deep residual learning for image recognition. In CVPR, 2016.
- [14] Dan Hendrycks, Steven Basart, Mantas Mazeika, Mohammadreza Mostajabi, Jacob Steinhardt, and Dawn Song. Scaling out-of-distribution detection for real-world settings. arXiv preprint arXiv:1911.11132, 2019.
- [15] Dan Hendrycks, Steven Basart, Norman Mu, Saurav Kadavath, Frank Wang, Evan Dorundo, Rahul Desai, Tyler Zhu, Samyak Parajuli, Mike Guo, Dawn Song, Jacob Steinhardt, and Justin Gilmer. The many faces of robustness: A critical analysis of out-of-distribution generalization. ICCV, 2021.
- [16] Dan Hendrycks and Kevin Gimpel. A baseline for detecting misclassified and out-of-distribution examples in neural networks. In ICLR, 2017.
- [17] Dan Hendrycks, Kimin Lee, and Mantas Mazeika. Using pre-training can improve model robustness and uncertainty. In ICML, pages 2712–2721. PMLR, 2019.
- [18] Dan Hendrycks, Mantas Mazeika, and Thomas Dietterich. Deep anomaly detection with outlier exposure. ICLR, 2019.
- [19] Dan Hendrycks, Kevin Zhao, Steven Basart, Jacob Steinhardt, and Dawn Song. Natural adversarial examples. CVPR, 2021.
- [20] Yen-Chang Hsu, Yilin Shen, Hongxia Jin, and Zsolt Kira. Generalized odin: Detecting out-of-distribution image without learning from out-of-distribution data. In CVPR, pages 10951–10960, 2020.
- [21] Gao Huang, Zhuang Liu, Laurens Van Der Maaten, and Kilian Q Weinberger. Densely connected convolutional networks. In CVPR, 2017.
- [22] Rui Huang, Andrew Geng, and Yixuan Li. On the importance of gradients for detecting distributional shifts in the wild. NeurIPS, 34, 2021.
- [23] Rui Huang and Yixuan Li. Mos: Towards scaling out-of-distribution detection for large semantic space. In CVPR, pages 8710–8719, 2021.
- [24] Disi Ji, Padhraic Smyth, and Mark Steyvers. Can i trust my fairness metric? assessing fairness with unlabeled data and bayesian inference. In H. Larochelle, M. Ranzato, R. Hadsell, M.F. Balcan, and H. Lin, editors, NeurIPS, volume 33. Curran Associates, Inc., 2020.
- [25] Robert J Joyce, Edward Raff, and Charles Nicholas. A framework for cluster and classifier evaluation in the absence of reference labels. In Proceedings of the 14th ACM Workshop on Artificial Intelligence and Security, 2021.
- [26] Maurice George Kendall. Rank correlation methods. 1948.
- [27] Daniel Kermany, Michael Goldbaum, Wenjia Cai, Carolina Valentim, Hui-Ying Liang, Sally Baxter, Alex McKeown, Ge Yang, Xiaokang Wu, Fangbing Yan, Justin Dong, Made Prasadha, Jacqueline Pei, Magdalena Ting, Jie Zhu, Christina Li, Sierra Hewett, Jason Dong, Ian Ziyar, and Kang Zhang. Identifying medical diagnoses and treatable diseases by image-based deep learning. Cell, 172:1122–1131.e9, 02 2018.
- [28] K Krishna and M Narasimha Murty. Genetic k-means algorithm. IEEE Transactions on Systems, Man, and Cybernetics, Part B (Cybernetics), 29(3), 1999.
- [29] Alex Krizhevsky, Geoffrey Hinton, et al. Learning multiple layers of features from tiny images. Tech Report, 2009.
- [30] Kimin Lee, Kibok Lee, Honglak Lee, and Jinwoo Shin. A simple unified framework for detecting out-of-distribution samples and adversarial attacks. NeurIPS, 31, 2018.
- [31] Shan Li, Weihong Deng, and JunPing Du. Reliable crowdsourcing and deep locality-preserving learning for expression recognition in the wild. In CVPR, pages 2852–2861, 2017.
- [32] Zeju Li, Konstantinos Kamnitsas, Mobarakol Islam, Chen Chen, and Ben Glocker. Estimating model performance under domain shifts with class-specific confidence scores. In International Conference on Medical Image Computing and Computer-Assisted Intervention. Springer, 2022.
- [33] Shiyu Liang, Yixuan Li, and R. Srikant. Enhancing the reliability of out-of-distribution image detection in neural networks. In ICLR, 2018.
- [34] Weitang Liu, Xiaoyun Wang, John Owens, and Yixuan Li. Energy-based out-of-distribution detection. In NeurIPS, 2020.
- [35] Ali Mollahosseini, Behzad Hasani, and Mohammad H Mahoor. Affectnet: A database for facial expression, valence, and arousal computing in the wild. IEEE Transactions on Affective Computing, 2017.
- [36] Yuval Netzer, Tao Wang, Adam Coates, A. Bissacco, Bo Wu, and A. Ng. Reading digits in natural images with unsupervised feature learning. In NeurIPS Workshop, 2011.
- [37] Haim Permuter, Joseph Francos, and Ian Jermyn. A study of gaussian mixture models of color and texture features for image classification and segmentation. Pattern recognition, 2006.
- [38] Olivier Risser-Maroix and Benjamin Chamand. What can we learn by predicting accuracy? arXiv preprint arXiv:2208.01358, 2022.
- [39] Chandramouli Shama Sastry and Sageev Oore. Detecting out-of-distribution examples with gram matrices. In ICML. PMLR, 2020.
- [40] Karen Simonyan and Andrew Zisserman. Very deep convolutional networks for large-scale image recognition. arXiv preprint arXiv:1409.1556, 2014.
- [41] Xiaoxiao Sun, Yunzhong Hou, Weijian Deng, Hongdong Li, and Liang Zheng. Ranking models in unlabeled new environments. In ICCV, 2021.
- [42] Xiaoxiao Sun, Yunzhong Hou, Hongdong Li, and Liang Zheng. Label-free model evaluation with semi-structured dataset representations. arXiv preprint arXiv:2112.00694, 2021.
- [43] Yiyou Sun, Chuan Guo, and Yixuan Li. React: Out-of-distribution detection with rectified activations. NeurIPS, 34:144–157, 2021.
- [44] Yiyou Sun, Yifei Ming, Xiaojin Zhu, and Yixuan Li. Out-of-distribution detection with deep nearest neighbors. ICML, 2022.
- [45] Jihoon Tack, Sangwoo Mo, Jongheon Jeong, and Jinwoo Shin. Csi: Novelty detection via contrastive learning on distributionally shifted instances. NeurIPS, 33:11839–11852, 2020.
- [46] Sagar Vaze, Kai Han, Andrea Vedaldi, and Andrew Zisserman. Open-set recognition: A good closed-set classifier is all you need. In ICLR, 2022.
- [47] Haoqi Wang, Zhizhong Li, Litong Feng, and Wayne Zhang. Vim: Out-of-distribution with virtual-logit matching. In CVPR, pages 4921–4930, 2022.
- [48] Tong Xiao, Tian Xia, Yi Yang, Chang Huang, and Xiaogang Wang. Learning from massive noisy labeled data for image classification. In CVPR, pages 2691–2699, 2015.
- [49] Jingkang Yang, Haoqi Wang, Litong Feng, Xiaopeng Yan, Huabin Zheng, Wayne Zhang, and Ziwei Liu. Semantically coherent out-of-distribution detection. In ICCV, pages 8301–8309, 2021.
- [50] Jingkang Yang, Pengyun Wang, Dejian Zou, Zitang Zhou, Kunyuan Ding, Wenxuan Peng, Haoqi Wang, Guangyao Chen, Bo Li, Yiyou Sun, et al. Openood: Benchmarking generalized out-of-distribution detection. arXiv preprint arXiv:2210.07242, 2022.
- [51] Fisher Yu, Dequan Wang, Evan Shelhamer, and Trevor Darrell. Deep layer aggregation. In CVPR, pages 2403–2412, 2018.
- [52] Qing Yu and Kiyoharu Aizawa. Unsupervised out-of-distribution detection by maximum classifier discrepancy. In ICCV, pages 9518–9526, 2019.
Appendix A The AUROC of Datasets in Gbench
Our collected dataset suite Gbench has various OOD datasets with different difficulties. We present the AUROC distribution of 150 OOD train sets (150 OOD sets mixed with CIFAR-10 test set separately) in Fig. 8. The ODIN method is used for detection. We observe that the AUROC ranges from around 57% to 100% (random guess yields AUROC of 50%), indicating that datasets in Gbench have a wide span in their OOD difficulty.
Appendix B The Hyperparameter Tuning Process
We choose the hyperparameter by enumerating its possible values from in the 150 OOD train sets. Our target is to minimize the regression loss on the 150 OOD train sets. Thus, we first enumerate with an interval of , we record the regression loss on each selected . After selecting the initial in the interval, for example, , we further enumerate the with an interval of and choose the with the minimal regression loss. We can also select the hyperparameter by enumerating from with an interval of . When IND:OOD ratio is 1:1, the is set to 0.99 using UDE, 0.95 using GMM. When the IND:OOD ratio is different across the OOD train sets, the is set to 0.93 using UDE and 0.50 using GMM. GMM and UDE are not very sensitive to the hyperparameter , thus, we tune the hyperparameter with OOD detector MSP and use the tuned hyperparameter across other OOD detectors.
|
|
Ischemia | Watch | Potato disease | Bengali | Vegetable | Men women | RMSE | ||||
| MSP | Kmeans + | 83.54/76.66 | 60.97/66.87 | 69.56/77.38 | 82.87/80.10 | 75.13/72.83 | 75.36/70.01 | 5.55 | ||||
| GMM + Wasserstein | 83.54/84.30 | 60.97/64.77 | 69.56/72.70 | 82.87/84.13 | 75.13/73.71 | 75.36/74.28 | 2.22 | |||||
| UDE + Wasserstein | 83.54/84.82 | 60.97/63.39 | 69.56/69.54 | 82.87/82.40 | 75.13/73.83 | 75.36/74.06 | 1.36 | |||||
| ODIN | Kmeans + | 26.82/40.27 | 30.04/30.40 | 52.38/53.00 | 50.87/42.56 | 50.92/47.27 | 27.73/27.71 | 6.63 | ||||
| GMM + Wasserstein | 26.82/42.08 | 30.04/32.85 | 52.38/64.42 | 50.87/46.40 | 50.92/47.50 | 27.73/30.04 | 8.39 | |||||
| UDE + Wasserstein | 26.82/37.52 | 30.04/30.64 | 52.38/58.21 | 50.87/51.69 | 50.92/49.72 | 27.73/28.17 | 5.02 | |||||
| ENERGY | Kmeans + | 53.61/55.14 | 24.88/32.54 | 45.14/56.46 | 67.91/59.04 | 53.97/50.11 | 49.18/47.03 | 6.92 | ||||
| GMM + Wasserstein | 53.61/57.80 | 24.88/32.31 | 45.14/54.41 | 67.91/56.56 | 53.97/51.09 | 49.18/48.53 | 7.03 | |||||
| UDE + Wasserstein | 53.61/53.58 | 24.88/29.38 | 45.14/52.29 | 67.91/65.28 | 53.97/52.65 | 49.18/47.21 | 3.74 | |||||
| MLS | Kmeans + | 56.12/57.09 | 27.40/33.48 | 45.19/56.48 | 67.96/60.13 | 54.57/50.84 | 49.66/48.18 | 6.36 | ||||
| GMM + Wasserstein | 56.12/65.96 | 27.40/32.81 | 45.19/53.04 | 67.96/54.97 | 54.57/50.02 | 49.66/54.68 | 8.19 | |||||
| UDE + Wasserstein | 56.12/55.64 | 27.40/30.65 | 45.19/51.94 | 67.96/65.94 | 54.57/53.41 | 49.66/48.21 | 3.26 | |||||
Appendix C Influence of Sizes of IND and OOD Data
To explore the influence of sizes of IND and OOD data on UDE and other unsupervised evaluation methods, we generate 150 OOD train sets of different sizes of IND and OOD data. Specifically, we randomly select a number from as the size of the IND or OOD data, where is the corresponding size of IND or OOD data. The IND and OOD size of the 150 OOD train sets are listed below:
IND: [6990, 5966, 8061, 2381, 4204, 5181, 7835, 7213, 7915, 1120, 6634, 8186, 5428, 3732, 7439, 8422, 9131, 5551, 9065, 1601, 9531, 3202, 7907, 2550, 8957, 8694, 3625, 4609, 1449, 9718, 365, 3712, 7081, 3684, 8852, 2138, 6509, 696, 2129, 473, 4358, 5032, 1100, 9872, 4362, 2875, 2692, 8774, 7346, 6815, 5951, 9284, 5603, 2309, 4816, 5183, 1422, 5578, 7442, 616, 866, 4347, 8083, 5440, 6901, 2238, 5280, 138, 1702, 5054, 7892, 4600, 2285, 2630, 766, 5256, 788, 7234, 3505, 245, 5562, 5641, 2784, 6013, 4907, 890, 1261, 5002, 9288, 5730, 8254, 5589, 6253, 3344, 228, 8603, 8105, 3659, 3706, 7165, 1146, 7499, 6620, 3637, 7610, 2579, 2531, 7034, 8266, 3684, 5314, 2530, 6309, 7807, 745, 765, 7449, 7648, 8780, 8586, 4845, 8000, 435, 8404, 1175, 6785, 2783, 4803, 7986, 9962, 6836, 7618, 2580, 5406, 3294, 1085, 2136, 6451, 3198, 6187, 1334, 4284, 9426, 1631, 6983, 2486, 1476, 1725, 7419, 8236]
OOD: [3255, 1076, 2194, 8368, 1653, 2507, 2804, 5896, 9152, 2233, 864, 5112, 4096, 2424, 378, 5343, 5038, 2342, 5041, 7390, 5294, 3112, 4360, 2233, 1939, 23210, 3958, 2474, 3027, 1096, 4081, 1544, 2824, 249, 2697, 537, 2061, 2001, 3130, 1100, 515, 1279, 3054, 745, 1733, 9435, 1715, 801, 9877, 7827, 5202, 2613, 747, 1250, 2985, 2268, 13680, 3250, 1927, 6889, 54917, 1146, 4421, 8203, 304, 1467, 3520, 1973, 5114, 3352, 1741, 457, 4302, 1042, 446, 18396, 7058, 7614, 465, 2484, 2323, 1635, 1204, 692, 2224, 4027, 4384, 5482, 1728, 2861, 337, 1336, 9348, 1487, 3252, 9217, 7637, 831, 6134, 2829, 15174, 8714, 4172, 789, 3343, 9052, 2098, 1407, 5383, 2323, 5880, 8703, 2654, 1570, 1157, 634, 24967, 1319, 491, 842, 1788, 6945, 3926, 719, 2825, 1340, 355, 4014, 688, 8158, 5879, 12770, 7815, 1187, 5779, 1918, 1432, 1141, 4351, 7383, 5941, 8065, 2830, 570, 8680, 332, 3557, 1130, 603, 593]
The IND:OOD ratio and the dataset size of different OOD train sets are all different. For example, OOD train set 1 has 6990 IND samples and 3255 OOD samples (IND:OOD ratio is 2.15, dataset size is 10245), while OOD train set 2 has 5966 IND samples and 1076 OOD samples (IND:OOD ratio is 5.54, dataset size is 7042).
We carry out experiments on the 150 generated OOD train sets to evaluate the performance of different unsupervised evaluation methods. The experiment results are shown in Fig. 9. UDE achieves the best performance as the absolute value of Pearson Correlation Coefficient reaches 0.832, outperforming 0.760 and 0.741.

| FPR@TPR95 | AUROC | |||||||
| Unsup. Eval. Methods | MSP | ODIN | ENERGY | MLS | MSP | ODIN | ENERGY | MLS |
| Gscore (Kmeans + l2) | 8.73±1.22 | 10.97±0.86 | 6.79±0.73 | 6.93±0.77 | 5.32±0.75 | 5.25±0.38 | 5.01±0.75 | 5.17±0.79 |
| Gscore (GMM + KL Divergence) | 5.19±0.56 | 13.44±0.94 | 7.10±0.62 | 7.40±0.73 | 4.24±0.66 | 7.18±0.97 | 6.75±0.76 | 6.32±0.99 |
| Gscore (GMM + Wasserstein) | 4.41±0.66 | 6.89±0.46 | 7.28±0.79 | 6.30±0.68 | 4.81±0.55 | 4.53±0.41 | 5.44±0.84 | 4.85±0.54 |
| Gscore (UDE + KL Divergence) | 4.10±0.92 | 4.77±1.08 | 4.67±1.30 | 5.07±1.34 | 3.90±0.38 | 3.80±0.61 | 3.92±0.65 | 4.04±0.62 |
| Gscore (UDE + Wasserstein) | 3.46±0.63 | 4.50±0.23 | 4.39±0.55 | 4.52±0.57 | 3.64±0.27 | 3.86±0.32 | 4.02±0.51 | 4.08±0.52 |
Appendix D Examples of Unsupervised Evaluation
We show some examples of unsupervised evaluation on unlabeled test sets in Table 5. We train the regression model on all 200 datasets of Gbench and collect another 6 unlabeled OOD sets for testing. Ischemia contains ECGs images of patients with Ischemia. Watch contains watch images. Potato disease contains potato leaves images for potato disease detection. Bengal contains sign language images. Vegetable contains images of vegetables. Men women contains images of men and women. We display the latent truth OOD detection performance and the predicted OOD detection performance. RMSE is calculated on the 6 unlabeled test sets for each method. The results show that UDE+Wasserstein (Ours) achieves the best performance under all four different OOD detectors. The best performance is achieved when the OOD detector is MSP, the RMSE is only 1.36%.
Appendix E Validation Set Size on UDE Performance
Our proposed UDE needs a validation set to infer the distribution of OOD scores of the IND data. We show the validation set size has negligible influence on the performance of our method in Fig. 10. When the OOD train sets have IND:OOD ratio of 1:1, then the validation set size has little effect on the performance of our unsupervised evaluation method. With only the validation set size of 100, we can find the strong correlation between Gscore and the OOD detection performance as is over 0.97. When the OOD train sets have various IND:OOD ratios and dataset sizes, validation set size has a relatively stronger influence. We need around 3000 validation samples to keep the unsupervised evaluation method effective.
Appendix F OOD Sets with Different IND Sets
When the IND dataset is changed, we need to remove the OOD datasets that have class overlap with the new IND dataset. When the IND dataset is Clothing1M, we remove Store, Fashion and Shoes sandals boots, and there remain 197 OOD datasets in Gbench. When the IND dataset is Face, we remove Faces age detection, RAF-DB, Affectnet, FER2013, Gender, LFW, Good and bad guys, Face mask, Female and male eyes, Real and fake face, Fake video and there remain 189 OOD datasets. When the IND dataset is Medical images, we remove Brain tumor, Medical MNIST, Breast ultrasound, Skin cancer MNIST, Knee X-Ray, Alzheimer MRI, Brain tumor MRI, Br35H, ChestX, COVID19, Brain CT, Kvasir and there remain 188 OOD datasets. When the IND dataset is CIFAR-100, we remove Faces age detection, MIML, Bonsai styles images, MIT indoor scenes, 102flowers, iSUN, RAF-DB, Affectnet, Sea animals, Facial expression, Fish, Gender, Butterfly, Imagenet, Monkey, ImageNet-A, ImageNet-O, ImageNet-R, Tiny-ImageNet resize, Intel image, Elephant, Snake, LFW, Flower, Tin and steel cans, Mobile and smartphone, Beauty classification, Good and bad guys, Plastic and paper cups, Cloud, Furniture, Natural scene, Flower extension, Ornamental plants, Butterflies 100, Weather, Real and fake face, Insect village synthetic, Blossom, AFFiNe, Fight, Fish species, Split garbage, Fruit and vegetable, Wild plants, Pests, Cattle, Fake video, Apple, Toxic plant, Pistol detection, Clock, Crocodile and there remain 147 OOD datasets.
Appendix G More Results of Other Distance Metrics
We add results of UDE and GMM with KL Divergence in Table 6 compared with the results in the paper. Kmeans utilizes loss as Kmeans only returns the centers of the two distributions. GMM and UDE do not use loss as they fit the OOD scores into two Gaussian distributions, we further consider the variances of the Gaussian distributions as different variances under the same mean values might lead to different OOD detection performance. Shown in Table 6, we can observe UDE+Wasserstein is the most effective unsupervised evaluation method on different OOD detectors. UDE+KL Divergence is slightly weaker than UDE+Wasserstein. GMM works well with Wasserstein distance while GMM + KL Divergence has low performance under ODIN, ENERGY and MLS. We speculate the reason lies in that the standard deviance is not accurately estimated by GMM. For example, for a random OOD train set, the estimated , , , by GMM are 0.1009, 0.1006, , , while the latent truths are 0.1009, 0.1007, , , we can see the estimated mean values of GMM are close to latent truth, while the estimated standard deviance values are much more different from latent truth. We further utilize 2 loss to only compute the distance between the estimated and by GMM, the RMSE is 9.77 under MLS detector with seed as 10000, when we utilize KL Divergence loss to incorporate the estimated and , the RMSE is 18.09, which further validate our speculation that the performance is low because the estimated standard deviance of GMM is not accurate.
Appendix H Results on Other OOD Detectors
In our paper, we show the experiment results when the IND dataset is changed under detector MSP. We further provide the experiment results in Fig. 11 on other detectors when the IND dataset is changed to Clothing1M to study the effect of different detectors under different IND datasets. The results illustrate that the strong correlation still exists under different OOD detectors when the IND dataset is changed to Clothing1M. Interestingly, when using Clothing1M as IND data, the correlation becomes flat when Gscore is large enough. This phenomenon can be attributed to the strong performance of OOD detectors on some relatively easy test sets, where FPR@TPR95 and AUROC reach saturation (close to 0 or 100). Under this circumstance, even if Gscore keeps increasing, the OOD detection performance no longer changes.
Appendix I Visualization of the Outlier OOD Datasets
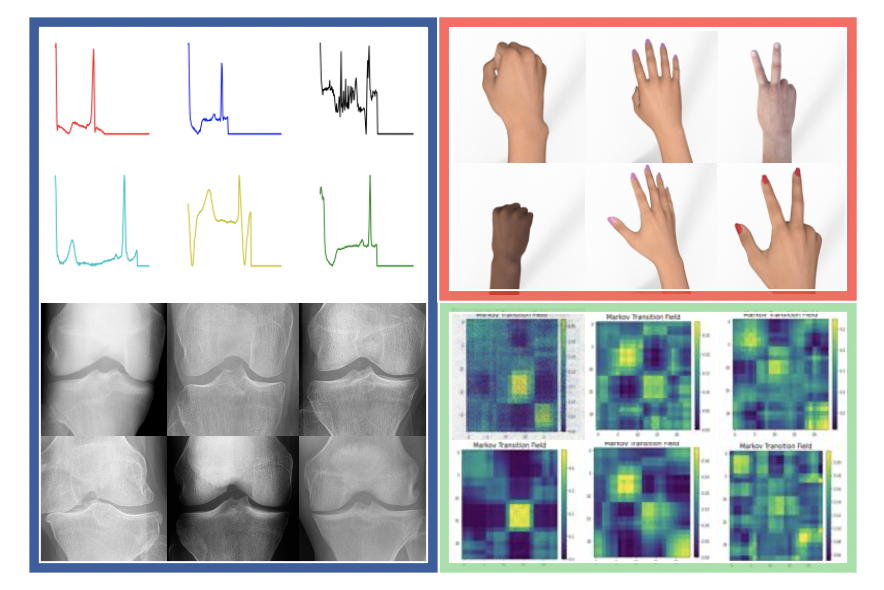
We find that when the IND dataset is changed to CIFAR-100, Face or Medical, there are some outlier OOD datasets with very high OOD detection performance. We provide some examples of these datasets in Fig. 12. When the IND dataset is CIFAR-100, the outlier easiest OOD datasets are ECG signal images and knee X-Ray images, they are with very simple patterns and each image contains almost a single color. When the IND dataset is Face, the easiest OOD dataset is rock paper scissors gestures, we speculate that the main content of gesture images (hands) and face images are with similar color, while the shape of hands is very different from faces plus the background of the two datasets are different, which make the gesture dataset an easy OOD dataset. When Medical is the IND dataset, the easiest OOD dataset is Pump colormaps, the reason might be colormap images have different colors while medical images are mainly gray, which makes the two datasets very different. From the analysis of the outlier datasets of different IND datasets, we further validate our proposal that OOD datasets have different difficulties regards different IND datasets. Future research direction might be studying the difficulty of OOD datasets under different IND datasets and designing specific OOD detectors for different IND datasets.
Appendix J List of the 6 datasets in Table 5
Appendix K Complete list of the 200 datasets in Gbench
Rock : Different Types of Rocks Images https://www.kaggle.com/datasets/shlokjain69/rock-classification
Faces age detection : Predict the Age of an Actor or Actress from Facial Attributes https://www.kaggle.com/datasets/arashnic/faces-age-detection-dataset
MIML : Multi-instance Multi-label Classification under Natural Scene https://www.kaggle.com/datasets/twopothead/miml-image-data
Tally marks : Tally Marks Image Dataset https://www.kaggle.com/datasets/duraidkhaalid/tally-marks
Color polygon images : The Simplest Dataset for Classification and Regression Practice https://www.kaggle.com/datasets/gonzalorecioc/color-polygon-images
Bonsai styles images : 2700 Images of Bonsai’s Styles, 9 Classes https://www.kaggle.com/datasets/vincenzors8/bonsai-styles-images
Drowsiness detection : Human Eye Images https://www.kaggle.com/datasets/kutaykutlu/drowsiness-detection
MIT indoor scenes : Indoor Scene Recognition https://www.kaggle.com/datasets/itsahmad/indoor-scenes-cvpr-2019
102flowers : Flower Images Dataset for Classification with a Large Number of Classes https://www.kaggle.com/datasets/hishamkhdair/102flowers-data
Eurosat : Dataset Contains All the RGB and Bands Images from Sentinel-2 https://www.kaggle.com/datasets/apollo2506/eurosat-dataset
iSUN : A Saliency Dataset for A Large Number of Natural Images https://turkergaze.cs.princeton.edu/
Santa : Santa Claus Classification https://www.kaggle.com/datasets/deepcontractor/is-that-santa-image-classification
RAF-DB : Real-world Affective Faces Database (RAF-DB) [31] http://www.whdeng.cn/raf/model1.html
LSUN : Large-scale Scene UNderstanding Dataset (LSUN) https://www.yf.io/p/lsun
Satellite image : Satellite Remote Sensing Images https://www.kaggle.com/datasets/mahmoudreda55/satellite-image-classification
Affectnet : Large-scale Facial Expression Recognition Dataset [35] http://mohammadmahoor.com/affectnet/
LSUN resize : Downsampled Version of LSUN. https://github.com/facebookresearch/odin
Sea animals : Images of Different Sea Creatures for Image Classification https://www.kaggle.com/datasets/vencerlanz09/sea-animals-image-dataste
Facial expression : Facial Expression Recognition 2013 Dataset [11] https://www.kaggle.com/datasets/msambare/fer2013
Shells : A dataset Containing Images of Shells and Pebbles for Image Classification https://www.kaggle.com/datasets/vencerlanz09/shells-or-pebbles-an-image-classification-dataset
Alphabet : Image Dataset for Alphabets in the American Sign Language https://www.kaggle.com/datasets/grassknoted/asl-alphabet
Fish : A Large-Scale Dataset for Fish Segmentation and Classification https://www.kaggle.com/datasets/crowww/a-large-scale-fish-dataset
Meat freshness : Meat Freshness Image Classification Dataset https://www.kaggle.com/datasets/vinayakshanawad/meat-freshness-image-dataset
Sign language : Turkey Sign Language Digits Dataset https://www.kaggle.com/datasets/ardamavi/sign-language-digits-dataset
Balls : 26 Types of Balls - Image Classification https://www.kaggle.com/datasets/gpiosenka/balls-image-classification
Food : Labeled Food Images in 101 Categories from Apple Pies to Waffles https://www.kaggle.com/datasets/kmader/food41
Sports : 100 Sports Image Classification https://www.kaggle.com/datasets/gpiosenka/sports-classification
Brain tumor : Brain Tumor Image Classification https://www.kaggle.com/datasets/kirolosmedhat264/brain-tumor
Gender : Male Female Image Dataset https://www.kaggle.com/datasets/cashutosh/gender-classification-dataset
Medical MNIST : Medical MNIST, 58954 Medical Images of 6 Classes https://www.kaggle.com/datasets/andrewmvd/medical-mnist
Breast ultrasound : Breast Ultrasound Images for Classification, Detection and Segmentation https://www.kaggle.com/datasets/aryashah2k/breast-ultrasound-images-dataset
German : GTSRB - German Traffic Sign Recognition Benchmark https://www.kaggle.com/datasets/meowmeowmeowmeowmeow/gtsrb-german-traffic-sign
Messy rooms : Messy vs Clean Room - A Small Dataset for Scene Image Classification https://www.kaggle.com/datasets/cdawn1/messy-vs-clean-room
SVHN : A Real-world Image Dataset Obtained from House Numbers in Google Street View Images [36] http://ufldl.stanford.edu/housenumbers/
Butterfly : Butterfly Dataset https://www.kaggle.com/datasets/veeralakrishna/butterfly-dataset
Grapevine : Grapevine Leaves Image Dataset https://www.kaggle.com/datasets/muratkokludataset/grapevine-leaves-image-dataset
Chinese MNIST : Chinese Numbers Handwritten Characters Images https://www.kaggle.com/datasets/gpreda/chinese-mnist
ImageNet : An Image Database Organized According to The WordNet Hierarchy [4] https://www.image-net.org/update-mar-11-2021.php
Monkey : 10 Monkey Species https://www.kaggle.com/datasets/slothkong/10-monkey-species
Textures : Describable Textures Dataset (DTD) - An Evolving Collection of Textural Images in the Wild [3] https://www.robots.ox.ac.uk/~vgg/data/dtd/
ImageNet-A : Natural Adversarial Example Dataset for Image Classifiers [19] https://github.com/hendrycks/natural-adv-examples
Elephant : Asian vs African Elephants https://www.kaggle.com/datasets/vivmankar/asian-vs-african-elephant-image-classification
ImageNet-O : Natural Adversarial Example Dataset for Out-of-distribution Detectors [19] https://github.com/hendrycks/natural-adv-examples
Pokemon : 7000 Hand-Cropped and Labeled Pokemon Images for Classification https://www.kaggle.com/datasets/lantian773030/pokemonclassification
Tom and Jerry : Collection of 5k+ Images with Labelled Data of Tom and Jerry Cartoon Show https://www.kaggle.com/datasets/balabaskar/tom-and-jerry-image-classification
ImageNet-R : Renditions of 200 ImageNet Classes [15] https://github.com/hendrycks/imagenet-r
Tree nuts : Tree Nuts Image Classification https://www.kaggle.com/datasets/gpiosenka/tree-nuts-image-classification
Tiny-ImageNet resize : Downsampled Version of Tiny-ImageNet. https://github.com/facebookresearch/odin
Instrument : Collection of Music Instrument Images with Labels https://www.kaggle.com/datasets/lasaljaywardena/music-instrument-images-dataset
Intel image : Intel Image Classification - Image Scene Classification of Multiclass https://www.kaggle.com/datasets/puneet6060/intel-image-classification
Recursion cellular : Recursion Cellular Image Classification https://www.kaggle.com/datasets/xhlulu/recursion-cellular-image-classification-224-jpg
Rice : Five different Rice Image Dataset https://www.kaggle.com/datasets/muratkokludataset/rice-image-dataset
Skin cancer MNIST : A Large Collection of Pigmented Lesions Images https://www.kaggle.com/datasets/kmader/skin-cancer-mnist-ham10000
Recycling : Recycling - Image Classification https://www.kaggle.com/datasets/aminizahra/recycling2
Cricket shots : Augmented Images of 4 Different Cricket Shots https://www.kaggle.com/datasets/aneesh10/cricket-shot-dataset
Shoe : 15,000 Images of Shoes, Sandals and Boots for Classification https://www.kaggle.com/datasets/hasibalmuzdadid/shoe-vs-sandal-vs-boot-dataset-15k-images
Domino tiles : Photographs of 28 Different Domino Tile Classes https://www.kaggle.com/datasets/bjorkwall/photographs-of-28-different-domino-tiles
Concrete defect : Concrete Defect Image Classification https://www.kaggle.com/datasets/datastrophy/concrete-train-test-split-dataset
Snake : HackerEarth Deep Learning Identify The Snake Breed https://www.kaggle.com/datasets/oossiiris/hackerearth-deep-learning-identify-the-snake-breed
LFW : Labelled Faces in the Wild (LFW) Dataset https://www.kaggle.com/datasets/jessicali9530/lfw-dataset
Knee X-Ray : Knee Osteoarthritis Dataset with Severity Grading https://www.kaggle.com/datasets/shashwatwork/knee-osteoarthritis-dataset-with-severity
Persian digits : 30000 Labeled Persian Digits with Noise in the Background. https://www.kaggle.com/datasets/aliassareh1/persian-digits-captcha
Four shapes : 16,000 Images of Four Basic Shapes (Star, Circle, Square, Triangle https://www.kaggle.com/datasets/smeschke/four-shapes
BreakHis : Breast Cancer Histopathological Database (BreakHis) https://www.kaggle.com/datasets/ambarish/breakhis
Mechanical tools : Mechanical Tools Classification Dataset https://www.kaggle.com/datasets/salmaneunus/mechanical-tools-dataset
License plate digits : License Plate Digits and Characters Classification Dataset https://www.kaggle.com/datasets/aladdinss/license-plate-digits-classification-dataset
LEGO Bricks : Images of LEGO Bricks https://www.kaggle.com/datasets/joosthazelzet/lego-brick-images
BarkVN-50 : Bark Texture Images Classification https://www.kaggle.com/datasets/saurabhshahane/barkvn50
Flower : 4242 Images of Flowers https://www.kaggle.com/datasets/alxmamaev/flowers-recognition
Rating OpenCV : Rating OpenCV Emotion Images https://www.kaggle.com/datasets/juniorbueno/rating-opencv-emotion-images
Tin and steel cans : 50,000 Synthetic Images of Steel and Tin Cans for Image Classification https://www.kaggle.com/datasets/vencerlanz09/tin-and-steel-cans-synthetic-image-dataset
Plastic, paper and garbage bags : Synthetic Images of Plastic, Paper, and Garbage Bags for Computer Vision Tasks. https://www.kaggle.com/datasets/vencerlanz09/plastic-paper-garbage-bag-synthetic-images
Mobile and smartphone : Collection of Mobile and Smartphone Images with Annotated Labels https://www.kaggle.com/datasets/lasaljaywardena/mobile-smartphone-images-dataset
Produce defect : Casting Product Image Data for Quality Inspection https://www.kaggle.com/datasets/ravirajsinh45/real-life-industrial-dataset-of-casting-product
Beauty classification : Beauty Classification Image Classification https://www.kaggle.com/datasets/gpiosenka/beauty-detection-data-set
Crack detection : Concrete Crack Images for Image Classification https://www.kaggle.com/datasets/arnavr10880/concrete-crack-images-for-classification
Mechanical parts : Images of Mechanical Parts (Bolt,Nut, Washer,Pin) https://www.kaggle.com/datasets/manikantanrnair/images-of-mechanical-parts-boltnut-washerpin
Good and bad guys : Good Guys and Bad Guys Image Dataset https://www.kaggle.com/datasets/gpiosenka/good-guysbad-guys-image-data-set
DeepWeedsX : A Large Weed Species Image Dataset Collected across Northern Australia https://www.kaggle.com/datasets/coreylammie/deepweedsx
Plastic and paper cups : Plastic and Paper Cups Synthetic Image Dataset https://www.kaggle.com/datasets/vencerlanz09/plastic-and-paper-cups-synthetic-image-dataset
Alzheimer MRI : Alzheimer MRI Preprocessed Dataset (Magnetic Resonance Imaging) https://www.kaggle.com/datasets/sachinkumar413/alzheimer-mri-dataset
Fashion : Fashion Product Images https://www.kaggle.com/datasets/paramaggarwal/fashion-product-images-small
Brain tumor MRI : Brain Tumor MRI Dataset https://www.kaggle.com/datasets/masoudnickparvar/brain-tumor-mri-dataset
HAR : Human Action Recognition (HAR) Dataset https://www.kaggle.com/datasets/meetnagadia/human-action-recognition-har-dataset
Devanagari : Devanagari Character Set https://www.kaggle.com/datasets/rishianand/devanagari-character-set
One piece : Manually Selected Images of Some One Piece Characters https://www.kaggle.com/datasets/ibrahimserouis99/one-piece-image-classifier
Cloud : Clouds Images Taken from the Ground https://www.kaggle.com/datasets/nakendraprasathk/cloud-image-classification-dataset
Diamond : Natural Diamonds Dataset https://www.kaggle.com/datasets/harshitlakhani/natural-diamonds-prices-images
Utensil : Binary and Raw Images of 20 Categories of Utensils https://www.kaggle.com/datasets/jehanbhathena/utensil-image-recognition
GTZAN : GTZAN Dataset - Music Genre Classification https://www.kaggle.com/datasets/andradaolteanu/gtzan-dataset-music-genre-classification
Trees satellite : Trees in Satellite Imagery https://www.kaggle.com/datasets/mcagriaksoy/trees-in-satellite-imagery
Movie posters : Movie Posters with Respected Genres https://www.kaggle.com/datasets/raman77768/movie-classifier
Furniture : Collection of Furniture Images Annotated with Labels https://www.kaggle.com/datasets/lasaljaywardena/furniture-images-dataset
PepsiCo : PepsiCo Lab Potato Chips Quality Control Image Dataset https://www.kaggle.com/datasets/concaption/pepsico-lab-potato-quality-control
Style color : Brand and Product Recognition https://www.kaggle.com/datasets/olgabelitskaya/style-color-images
Monkeypox skin lesion : Binary Classification Data for Monkeypox vs Non-monkeypox (Chickenpox, Measles) https://www.kaggle.com/datasets/nafin59/monkeypox-skin-lesion-dataset
Crustacea : Preprocessed Sample Plankton Image Database Containing 24 Classes of Crustacea https://www.kaggle.com/datasets/iandutoit/crustacea-zooscan-image-database
Hurricane damage : Satellite Images of Hurricane Damage https://www.kaggle.com/datasets/kmader/satellite-images-of-hurricane-damage
Indian traffic : Multi-Class Image Classification on Indian Traffic Signs Dataset (85 Classes) https://www.kaggle.com/datasets/sarangdilipjodh/indian-traffic-signs-prediction85-classes
B200C : High Quality Image Classification for the 200 Most Popular LEGO Parts https://www.kaggle.com/datasets/ronanpickell/b200c-lego-classification-dataset
Store : 6000+ Store Items Images Classified by Color https://www.kaggle.com/datasets/imoore/6000-store-items-images-classified-by-color?select=test
Crowd counting : Crowd Counting Dataset https://www.kaggle.com/datasets/fmena14/crowd-counting
American sign : American Sign Language Dataset https://www.kaggle.com/datasets/ayuraj/asl-dataset
Natural scene : Image Classification Dataset of Various Locations https://www.kaggle.com/datasets/shanmukh05/ml-hackathon
Treasure : Museum Art Mediums Image Classification Dataset https://www.kaggle.com/datasets/ferranpares/mame-dataset
Br35H : Brain Tumor Detection 2020 https://www.kaggle.com/datasets/ahmedhamada0/brain-tumor-detection
Gemstone : 87 classes of Gemstones for Image Classification https://www.kaggle.com/datasets/lsind18/gemstones-images
Flower extension : Flower Data Extension https://www.kaggle.com/datasets/eugeneryu/flower-data-extension
Planets and moons : Planets and Moons Dataset https://www.kaggle.com/datasets/emirhanai/planets-and-moons-dataset-ai-in-space
Rock Paper Scissors : Images from the Rock-Paper-Scissors Game https://www.kaggle.com/datasets/drgfreeman/rockpaperscissors
Ornamental plants : Image Dataset for Common Flowering Plants https://www.kaggle.com/datasets/abdalnassir/ornamental-plants
Coffee bean : Multiclass Classification Data for Each Seed Roasted Coffee Bean https://www.kaggle.com/datasets/gpiosenka/coffee-bean-dataset-resized-224-x-224
Butterflies 100 : 100 Butterfly Species Dataset https://www.kaggle.com/datasets/gpiosenka/butterflies-100-image-dataset-classification
FoodyDudy : The First Ever Database about Thai Food on Kaggle. https://www.kaggle.com/datasets/somboonthamgemmy/foodydudy
Tobacco3482 : Document Structure Learning Dataset https://www.kaggle.com/datasets/patrickaudriaz/tobacco3482jpg
Artworks : Collection of Paintings of the 50 Most Influential Artists of All Time https://www.kaggle.com/datasets/ikarus777/best-artworks-of-all-time
Face mask : Face Mask Detection https://www.kaggle.com/datasets/andrewmvd/face-mask-detection
Color : Dataset for Color Classification https://www.kaggle.com/datasets/ayanzadeh93/color-classification
Star wars : Images Classification on Star Wars Characters https://www.kaggle.com/datasets/mathurinache/star-wars-images
Weather : Different Types of Weather Image Dataset https://www.kaggle.com/datasets/jehanbhathena/weather-dataset
Real and fake face : Real and Fake Face Detection https://www.kaggle.com/datasets/ciplab/real-and-fake-face-detection
Turkey traffic : Traffic Sign Images From Turkey https://www.kaggle.com/datasets/erdicem/traffic-sign-images-from-turkey
Pattern : Indonesian Batik Motifs https://www.kaggle.com/datasets/dionisiusdh/indonesian-batik-motifs
UAV detection : UAV Detection Dataset https://www.kaggle.com/datasets/nelyg8002000/uav-detection-dataset-images
MIIA pothole : Images of Roads in South Africa Contain Potholes https://www.kaggle.com/datasets/salimhammadi07/miia-pothole-image-classification-challenge
Female and male eyes : Images of Female and Male Eyes. https://www.kaggle.com/datasets/pavelbiz/eyes-rtte
POLLEN20L : Pollen Dataset of 20 Species Annotated for the Detection https://www.kaggle.com/datasets/nataliakhanzhina/pollen20ldet
Coral detection : Coral Image Classification https://www.kaggle.com/datasets/bobaaayoung/coral-image-classification
AmsterTime : A Visual Place Recognition Benchmark Dataset for Severe Domain Shif t https://www.kaggle.com/datasets/byildiz/amstertime
Letters typefaces : Standard Windows Fonts with Letters Organized in Classes by Typeface https://www.kaggle.com/datasets/killen/bw-font-typefaces
Indian dance : Indian Dance Form Classification https://www.kaggle.com/datasets/aditya48/indian-dance-form-classification
Pump colormaps : Pump Image Classification https://www.kaggle.com/datasets/byvickey/pump-image-classification
Komering : Intelligent System Research Group Bina Darma Dataset https://www.kaggle.com/datasets/ykunang/aksara-komering
Simpsons : Image Dataset of 20 Characters from The Simpsons https://www.kaggle.com/datasets/alexattia/the-simpsons-characters-dataset
Cosmos : A Simple Collection of 3,600 Space Images for Space Image Generation GANs https://www.kaggle.com/datasets/kimbosoek/cosmos-images
Fingerprint : Sokoto Coventry Fingerprint Dataset https://www.kaggle.com/datasets/ruizgara/socofing
Geometric shapes : Geometric Shapes Mathematics https://www.kaggle.com/datasets/reevald/geometric-shapes-mathematics
Surface defect : Surface Defect Detection Dataset https://www.kaggle.com/datasets/yidazhang07/bridge-cracks-image
Cotatenis sneakers : Sneakers Images from Several Brands like Nike, Adidas, and Jordan. https://www.kaggle.com/datasets/ferraz/cotatenis-sneakers
Graphs : About 16k of Clean Images of Graphs https://www.kaggle.com/datasets/sunedition/graphs-dataset
Handwritten digits and operators : Handwritten Digits and Operators Dataset https://www.kaggle.com/datasets/sunedition/graphs-dataset
Insect village synthetic : Dataset Containing Synthetic Images of Insects within Varying Backgrounds https://www.kaggle.com/datasets/vencerlanz09/insect-village-synthetic-dataset
Eye diseases : Eye Diseases Retinal Images https://www.kaggle.com/datasets/gunavenkatdoddi/eye-diseases-classification
CAPTCHA : Alphanumeric Colorful Images https://www.kaggle.com/datasets/parsasam/captcha-dataset
Kvasir : Multi-class Image Dataset for Computer Aided Gastrointestinal Disease Detection https://www.kaggle.com/datasets/meetnagadia/kvasir-dataset
Meat quality : Meat Quality Assessment Dataset https://www.kaggle.com/datasets/crowww/meat-quality-assessment-based-on-deep-learning
Chicken disease : Machine Learning Dataset for Poultry Diseases Diagnostics https://www.kaggle.com/datasets/allandclive/chicken-disease-1
Facebook meme : Facebook Hateful Meme Dataset https://www.kaggle.com/datasets/parthplc/facebook-hateful-meme-dataset
Blossom : Hackathon Blossom (Flower Classification) https://www.kaggle.com/datasets/spaics/hackathon-blossom-flower-classification
Synthetic digits : Synthetically Generated Images of English Digits Embedded on Random Backgrounds https://www.kaggle.com/datasets/prasunroy/synthetic-digits
AFFiNe : Angling Freshwater Fish Netherlands https://www.kaggle.com/datasets/jorritvenema/affine
Fight : Fight dataset https://www.kaggle.com/datasets/anbumalar1991/fight-dataset
Fish species : Fish Species Image Data https://www.kaggle.com/datasets/sripaadsrinivasan/fish-species-image-data
Anime face : 21551 Anime Face Images Sctaped from Web https://www.kaggle.com/datasets/soumikrakshit/anime-faces
ECG : ECG Image Data https://www.kaggle.com/datasets/erhmrai/ecg-image-data
Tea disease : Dieasese in Tea Leaves Image Classification https://www.kaggle.com/datasets/shashwatwork/identifying-disease-in-tea-leafs
Google scraped : Google Scraped Image Dataset https://www.kaggle.com/datasets/duttadebadri/image-classification
Split garbage : Split Garbage Dataset https://www.kaggle.com/datasets/andreasantoro/split-garbage-dataset
WebScreenshots : Web Pages Classified by Their Screenshots https://www.kaggle.com/datasets/aydosphd/webscreenshots
ALL : Acute Lymphoblastic Leukemia (ALL) Image Dataset https://www.kaggle.com/datasets/mehradaria/leukemia
Hand : Hand Gesture Recognition Database https://www.kaggle.com/datasets/gti-upm/leapgestrecog
House price : House Prices and Images https://www.kaggle.com/datasets/ted8080/house-prices-and-images-socal
Fast food : Fastfood Image Classification https://www.kaggle.com/datasets/ganesh124/fastfood
Kannada : Kannada Handwritten Characters https://www.kaggle.com/datasets/dhruvildave/kannada-characters
Logos : Logos of BK, KFC, McDonald, Starbucks and Subway https://www.kaggle.com/datasets/kmkarakaya/logos-bk-kfc-mcdonald-starbucks-subway-none
Fruit and vegetable : Fruits, Vegetables and Flowers for Image Classification and Object Detection https://www.kaggle.com/datasets/tobiek/green-finder
Mars : Mars Surface and Curiosity Image Set https://www.kaggle.com/datasets/brsdincer/mars-surface-and-curiosity-image-set-nasa
YouTube : YouTube Thumbnail Dataset https://www.kaggle.com/datasets/praneshmukhopadhyay/youtube-thumbnail-dataset
Book : Book covers dataset https://www.kaggle.com/datasets/lukaanicin/book-covers-dataset
Belgium traffic : Belgium Traffic Signs https://www.kaggle.com/datasets/shazaelmorsh/trafficsigns
Traffic light : Traffic Light Detection Dataset https://www.kaggle.com/datasets/wjybuqi/traffic-light-detection-dataset
Montreal parking : Montreal Parking Hours per Street https://www.kaggle.com/datasets/alincijov/montreal-parking-hours-per-streetsign
Wild plants : Wild Plants Image Dataset https://www.kaggle.com/datasets/gverzea/edible-wild-plants
Pests : Pests Identification https://www.kaggle.com/datasets/abhinandanroul/pest-normalized
Cattle : Cattle Breeds Dataset https://www.kaggle.com/datasets/anandkumarsahu09/cattle-breeds-dataset
Fake video : Fake Video Images Dataset https://www.kaggle.com/datasets/volodymyrgavrysh/fake-video-images-dataset
ChestX : Chest Xrays Image Dataset https://www.kaggle.com/datasets/kostasdiamantaras/chest-xrays-bacterial-viral-pneumonia-normal
Brain CT : Brain CT Images with Intracranial Hemorrhage Masks https://www.kaggle.com/datasets/vbookshelf/computed-tomography-ct-images
PANDA : Prostate Cancer Grade Assessment (PANDA) Challenge https://www.kaggle.com/datasets/xhlulu/panda-resized-train-data-512x512
Concrete surface : Concrete Surface Image Processed with Match Filter https://www.kaggle.com/datasets/ahsanulislam/concrete-surface-image-filtered-with-match-filter
Apple : Apple Products Image Dataset https://www.kaggle.com/datasets/radvian/apple-products-image-dataset
Surgical : Labeled Surgical Tools and Images https://www.kaggle.com/datasets/dilavado/labeled-surgical-tools
Wind turbines : Airbus Wind Turbines Patches https://www.kaggle.com/datasets/airbusgeo/airbus-wind-turbines-patches
Apparel : Apparel images dataset https://www.kaggle.com/datasets/trolukovich/apparel-images-dataset
Blood cell :Blood Cell Images https://www.kaggle.com/datasets/paultimothymooney/blood-cells
Caltech101 : Caltech-101 Dataset Contains of 9,146 Images from 101 Object Categories https://www.kaggle.com/datasets/imbikramsaha/caltech-101
Diabetic : Google Diabetic Rateinopathy https://www.kaggle.com/datasets/sohaibanwaar1203/diabetic-rateinopathy-full
Toxic plant : Toxic Plant Image Dataset https://www.kaggle.com/datasets/hanselliott/toxic-plant-classification
League logo : English Premier League Logo Detection https://www.kaggle.com/datasets/alexteboul/english-premier-league-logo-detection-20k-images
COVID19 : COVID-19 Radiography Database https://www.kaggle.com/datasets/tawsifurrahman/covid19-radiography-database
Lunar rock : Lunar Rock Image Classification https://www.kaggle.com/datasets/pranshu29/lunar-rock
Noisy number : Noisy, Single-Digit Captcha Images https://www.kaggle.com/datasets/kadenm/noisy-digitbased-captcha-images
QR : Benign and Malicious QR Codes https://www.kaggle.com/datasets/samahsadiq/benign-and-malicious-qr-codes
Pistol detection : Pistol Detection https://www.kaggle.com/datasets/vaibhavtalekar/pistol-classification
Moth : Moths Image Dataset Classification https://www.kaggle.com/datasets/gpiosenka/moths-image-datasetclassification
Clock : Dataset Containing 50K Generated Images of Analog Clocks https://www.kaggle.com/datasets/shivajbd/analog-clocks
Tomato : Tomato Leaf Disease Image Classification https://www.kaggle.com/datasets/noulam/tomato
Lemon : Lemon Quality Dataset https://www.kaggle.com/datasets/yusufemir/lemon-quality-dataset
IoT signal : IoT Firmware Image Classification https://www.kaggle.com/datasets/datamunge/iot-firmware-image-classification
PLD : Potato Disease Leaf Dataset(PLD) https://www.kaggle.com/datasets/rizwan123456789/potato-disease-leaf-datasetpld
Crocodile : Crocodile—Alligator—Gharial Classification https://www.kaggle.com/datasets/rrrohit/crocodile-gharial-classification-fastai