An Experimentation Infrastructure for Quantitative Measurements of Cyber Resilience††thanks: This work was partially funded by Cyber Technologies, Deputy CTO for Critical Technologies/Applied Technology, Office of the Under Secretary of Defense Research and Engineering. Contributions from Dr. Vandekerckhove were accomplished under Cooperative Agreement Number W911NF-21-2-0284 with ARL. Mr. Ellis completed this work while a contractor with ICF International, and has since transitioned to a civilian role within ARL.
Abstract
The vulnerability of cyber-physical systems to cyber attack is well known, and the requirement to build cyber resilience into these systems has been firmly established. The key challenge this paper addresses is that maturing this discipline requires the development of techniques, tools, and processes for objectively, rigorously, and quantitatively measuring the attributes of cyber resilience. Researchers and program managers need to be able to determine if the implementation of a resilience solution actually increases the resilience of the system. In previous work, a table top exercise was conducted using a notional heavy vehicle on a fictitious military mission while under a cyber attack. While this exercise provided some useful data, more and higher fidelity data is required to refine the measurement methodology. This paper details the efforts made to construct a cost-effective experimentation infrastructure to provide such data. It also presents a case study using some of the data generated by the infrastructure.
I Introduction
Researchers have demonstrated the vulnerabilities of modern vehicles to cyber attacks [1, 2, 3, 4, 5, 6]. Many realize that perfect security is impractical, and that resilience is necessary [7, 8, 9, 10, 11]. In order for the field of cyber resilience to mature, there must be "techniques, tools, and processes for objectively measuring the attributes of phenomena occurring in the systems of that discipline” [12].
Here, we ask if we can construct an inexpensive experimental environment that produces data of sufficient quality to demonstrate a quantitative measurement of cyber resilience. The development of a cyber resilience measurement methodology does not require high fidelity experimental environments at this time; it is enough to reasonably approximate the performance of a generic military ground vehicle (MGV).
This paper describes an inexpensive experimental environment that may be used to test various malware and bonware (the totality of physical and cyber features that allow a system to resist and recover from cyber compromise) on the Controller Area Network (CAN) bus of a modern vehicle. A case study is presented, and the data from that case study is used to measure the cyber resilience of the simulated vehicle.
In Section II, we begin by reviewing the categories of methods used in researching vehicle cybersecurity. The various components of the experimental infrastructure are described in Section III. An illustrative case study is presented in Section IV. In Section VI, we provide discussion and concluding remarks.
II Prior Work
Much of the early work on the cybersecurity of automobiles was done using actual vehicles [1, 2, 13, 14, 15]. This provides the highest fidelity; however, it is very expensive to conduct research in this fashion. The number of runs required to generate the data necessary to validate a quantitative measurement of cyber resilience would be prohibitively expensive.
Some researchers conducted research by connecting multiple electronic control units together on a CAN bus independent of a vehicle [16, 3, 17]. These do indeed provided an inexpensive method to test malware and bonware in a vehicular network; however, they cannot capture impacts on the vehicle’s key performance parameters.
Shikata et al. [18] developed a Digital Twin: a system to reproduce real-world events in a digital environment. A virtualized vehicle with realistic virtual performance would provide high fidelity at low cost in terms of time to test and measure cyber resilience. However, constructing a virtual vehicle would be prohibitively expensive unless it was constructed by the vehicle manufacturer to facilitate design.
III Component Descriptions
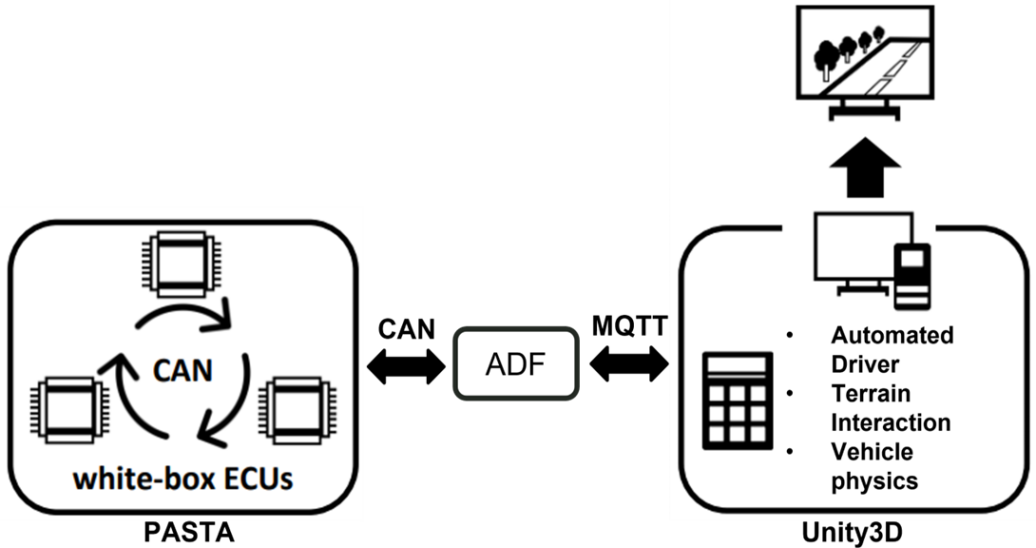
Multiple technologies have been integrated together to facilitate the generation of vehicle data. In our experimentation setup, these include the Toyota Portable Automotive Security Testbed with Adaptability (PASTA) by Toyota Motor Corporation, the Unity game development platform, the Active Defense Framework (ADF) developed in-house here at the DEVCOM Army Research Laboratory, and the OpenTAP test automation framework by Keysight Technologies. In general, Unity generates messages via the Message Queue Telemetry Transport (MQTT) publish-subscribe network protocol. ADF ingests these messages and translates them to CAN format, which are then injected onto the appropriate CAN bus within PASTA. Data flowing in the opposite direction is handled in a similar manner, but in reverse. Figure 1 illustrates the flow of data between components.
III-A The PASTA Testbed
PASTA, created by Toyota, is a vehicle security testbed designed to allow researchers the ability to develop and evaluate new security technology and approaches on realistic “white-box” ECUs [19]. There are three vehicle ECUs within the testbed, each encompassing a family of functionality and sitting on their own CAN bus: powertrain, body, and chassis. These three ECUs are responsible for their respective group of messages, each generating and responding to traffic on their bus. A fourth ECU, the central gateway (CGW), acts as a junction between the three previously mentioned buses. Based on the message and source bus, the CGW ferries messages to their appropriate destination bus. The firmware for all ECUs is open-source, and is accompanied by an integrated development environment (IDE) from Toyota to promote ease of customization.
PASTA has integrated simulation boards which calculate how the current CAN messages on the buses would physically influence a commercial sedan. These boards then update the vehicle ECUs with appropriate values. For example, when acceleration pedal operation is inputted, the chassis ECU sends a message with the indicated value. The simulation boards observe this message and calculate the physics that would result from the input. The results are used to update the values reported by the powertrain ECU, which it outputs onto its bus. In this instance, the powertrain ECU would send messages indicating the new engine throttle position, revolutions per minute (RPM), and vehicle speed. The simulation boards are connected directly to the vehicle ECUs via a serial port on each ECU board, so the physics data is not mixed with messages on the CAN bus.
An issue with the simulation boards is that they are essentially “black-boxes” and closed-source. We cannot alter, for instance, the parameters involving the engine (e.g., torque and horsepower), the weight of the vehicle, or the terrain that the boards are assuming is being traversed. To counteract this issue, we integrated a simulation engine that would allow for user-defined vehicle details as well as a custom terrain. In this configuration, PASTA becomes hardware-in-the-loop for the simulation engine. Attacks or defenses that affect the ECUs present in PASTA will also affect the vehicle within simulation. This is essential to observe realistic threats and defenses and their effects on vehicle performance.
III-B Unity
Unity is a widely used multi-platform game development platform implemented in C# [20]. It includes out-of-the-box tools, assets, and an IDE to aid developers in creating 3D designs and models. In particular, Unity provides built-in assets and classes regarding vehicle physics, which we leverage to model interactions between our simulated vehicle and custom terrain.
III-B1 Simulated Light Military Ground Vehicle
We implemented a light MGV within Unity, inspired by the Joint Light Tactical Vehicle (JLTV), designed to interface with data inputs from the white-box ECUs within PASTA. In general, the vehicle produces inputs in response to the simulated terrain. These inputs are sent to the corresponding ECUs within PASTA as if they were generated by PASTA itself. We then gather responses to these inputs from the ECUs and send them back to the simulated vehicle, which it uses to calculate parameters like torque and fuel consumption. For example, assume that the vehicle reports that the accelerator is set to 50%. This message is injected into PASTA as if the chassis ECU had generated it. The powertrain ECU responds to the message with the corresponding amount of engine throttle. A message with the engine throttle is sent back to Unity, which is then applied to engine power calculations. With this flow, any attacks present on the ECUs within PASTA will affect the simulated vehicle.
An automated driver is responsible for generating steering, acceleration, and braking inputs as the vehicle traverses the simulated terrain. Steering is guided by the use of a waypoint system. Both acceleration and braking inputs are calculated via a proportional-integral-derivative (PID) controller. The controller reliably responds to sudden changes in the terrain or vehicle performance, and maintains the target vehicle speed while preventing speed oscillation.
Engine performance is calculated through the use of torque, horsepower, and brake-specific fuel consumption (BSFC) curves. Engine RPM is derived using the vehicle speed, wheel circumference, and effective gear ratio. Using this RPM value, the curves are evaluated to discern the corresponding torque, horsepower, and BSFC value. Torque is multiplied by the throttle and the current effective gear ratio to obtain the total amount of torque that can be applied to the wheels. Since our vehicle is all-wheel drive (AWD), each wheel receives the total amount of torque divided by the number of wheels on the vehicle, which is six in this case. Horsepower and the BSFC value are used in conjunction to calculate the amount of fuel that has been used. Based upon the torque curve as a whole, gear shift points were calculated manually. The resulting shift points, being optimal in terms of torque output, confer an aggressive acceleration profile for the vehicle.
The vehicle is capable of providing sensor information that is either not present in PASTA or needs its functionality altered for our purposes. Currently, this applies to the engine coolant temperature. Engine temperature is present in PASTA, but is aligned to the temperature characteristics of a commercial sedan. Within Unity, we implemented a basic temperature model that can be controlled by an external fan controller ECU described in a later section. The fan controller monitors the coolant temperature reported by the vehicle and dictates the operation of a simulated fan on the vehicle. The fan itself takes around 50 horsepower to operate, which results in an approximate 25% drop in the available torque that can be applied to the wheels.
III-B2 Terrain
The simulated vehicle within Unity traverses a custom terrain map that is roughly 81.8 km by 100 km with altitudes up to 910 m. We crafted a course approximately 151 km in length across the map that encompasses multiple terrain types: flat main road, float off-road, hilly, prolonged incline, and prolonged decline. We placed trigger points on the map that set the target speed of the vehicle depending on the terrain type. If on a flat main road, the target speed is 60 km per hour. Otherwise, the target speed is 40 km per hour.
III-C Active Defense Framework
ADF is a government-developed framework used to rapidly prototype network-based active cyber-defense techniques. ADF currently supports Internet Protocol (IP) networks and vehicle control networks, namely the CAN bus and Society of Automotive Engineers (SAE) J1708 bus. The framework itself is written in Python and C programming languages, while active cyber-defense plugins can be written in Python. The framework acts as an intermediary for network traffic, as depicted in Figure 1, allowing it to control network message flow, as well as inspect, modify, drop, or generate network messages. Essentially, the plugin developer has free reign to prototype any network-based cyber-defense or detection technique they can imagine.
ADF is used here to provide a system/software-in-the-loop capability, and to provide simulated components. It allows communication between PASTA and Unity by translating CAN messages to and from MQTT, a standard publish-subscribe IP-based messaging protocol. ADF plugins are also used to provide simulated ECU hardware, and to implement attack and defense methods on the CAN bus via ADF’s ability to monitor, modify, inject, or drop CAN traffic.
III-C1 Unity-to-PASTA Message Translation
ADF runs on a standalone laptop and is connected to PASTA via two universal serial bus (USB) CAN over Serial (SLCAN) interface modules. One module is connected to the powertrain CAN bus, and the other module is connected to the chassis CAN bus. The PASTA CGW is disconnected from the CAN buses for our experiments, and the body CAN bus and body ECU are not used. ADF is configured to serve as a CGW between Unity and PASTA. Since Unity does not natively communicate with CAN interfaces, ADF translates CAN messages in real-time to MQTT messages and back. Unlike the PASTA CGW, ADF does not relay messages between the powertrain and chassis CAN buses themselves. ADF relays powertrain CAN messages between Unity and PASTA, and sends vehicle parameters from Unity to the chassis CAN bus for display on the PASTA instrument cluster. All communication channels are two-way.
III-C2 Virtual ECUs within ADF
The PASTA platform does not simulate a controllable cooling fan or provide a fan controller ECU. Therefore, we simulate a fan controller ECU using an ADF plugin. The fan controller engages the engine cooling fan on the simulated vehicle when the engine coolant temperature reaches a defined upper limit, and disengages the fan when temperature drops below a lower limit. For the purposes of our experiments, the fan controller ECU plugin can simulate an attack on its own firmware, stop the simulated attack, or reset/“re-flash” itself (i.e., replace the ECU firmware). During a reset, the fan controller is offline for 20 s.
We can create other simulated ECUs using ADF. For instance, a Central Tire Inflation System (CTIS) module is not implemented within PASTA. This functionality could be captured and controlled by a plugin to extend the attack surface of the simulated vehicle.
III-C3 Attack Possibilities via ADF
The simplest attack on a vehicle bus is to inject messages. Messages are broadcast on a CAN bus, so one injected at any point on the bus will reach all ECUs on the bus. While injection attacks cannot block or modify normal CAN bus traffic, they can impact vehicle performance if we inject messages to cause constant undesired vehicle behavior.
If an attacker can physically sever the CAN bus wiring at a strategic point and place additional hardware there, it is possible to block or modify the normal bus traffic. Attacks that block or modify messages can prevent ECUs from controlling the vehicle or falsify vehicle data.
III-C4 Defensive Capabilities via ADF
Defending against message injection, blocking, and modification at the bus-level requires detecting and filtering injected messages before they reach the ECU. The CAN bus can be split at potential access points and hardware placed in-line, hardware can be placed between the CAN bus and critical ECUs, or defenses can be integrated into the ECUs themselves. Examples of these defenses implemented previously using ADF include cryptographic watermarking and modeling observable vehicle states to compare current parameters to the model’s prediction.
Attacks on ECUs themselves must be approached differently. If an ECU is compromised, measures need be taken to restore proper ECU function. Many ECUs can be re-flashed while the vehicle is operational. The ECU may or may not be functional for some duration while being reset or re-flashed, and the impact this will have to vehicle performance depends on the function of the ECU. For the ECUs simulated by ADF plugins, the behavior is to make the ECU unresponsive for a set duration, after which normal ECU operation is restored.
III-D OpenTAP
OpenTAP is an open-source test automation framework developed by Keysight Technologies [21]. It provides a test sequencer to promote test repeatability, a customizable plugin facility capable of integrating plugin classes implemented in C# or Python, and result listeners responsible for capturing test data for further analysis. OpenTAP is used to automate the execution of experiments and provide a GUI for testing practitioners to configure experiment steps.
III-E Reportable Data
Data can be captured from two different yet related perspectives: the simulated vehicle or the PASTA CAN buses. Both views have their respective formats: a CSV containing multiple columns of data delineated by timestamp from the vehicle, or a CAN-formatted capture of traffic from the PASTA buses.
Within our infrastructure, there are multiple parameters that can be configured to generate varied data captures. Currently, these include experiment duration, attack start time, terrain type(s), starting location, ending location, target vehicle speed, and attack-defense pairing.
IV Illustrative Case Study
IV-A Scenario Description
We created and ran an experiment scenario wherein malware has infected the fan controller ECU present on the vehicle. The malware, once active, removes the ability to disengage the engine coolant fan from the fan controller ECU. This causes the vehicle to enter a state of prolonged degraded performance. Note that we did not employ actual malware in this experiment. We simulated the effects of such a malware and applied them to the fan controller ECU implemented within ADF.
The experiment runs for . Simulated bonware present on the vehicle monitors the engine coolant temperature for any abnormalities. From this sensor reading, it will notice the effect of the malware and attempt to recover after a period observation to ensure the behavior is not a short-lived anomaly. Recovery from this attack consists of re-flashing the firmware on the fan controller ECU.
IV-B Quantitative Measures of Cyber Resilience
In [22] we develop a model for the behavior of a system’s functionality over the course of an incident where it is being attacked by malware and defended by bonware. First, we assume that there is an observable, sufficiently smooth function representing mission accomplishment, and we define functionality to be its time derivative. Thus,
The normal functionality, when the system performs normally and does not suffer a cyber attack, may, in general, vary with time. For simplicity, throughout the paper, we assume the normal functionality to be constant in time,
To be able to compare measures of cyber resilience for multiple missions, we normalize the measure by dividing by the total mission time.
Often there are multiple objectives to a mission. Given a vector of resiliences, we define the overall cyber resilence to be the root-mean-square resilience of our mission.
Because each mission accomplishment may have a different relative importance, we may account for this by weighting the normal functionalities . To enforce an overall mission resilience in the range , we renormalize to obtain normalized resilience .
V Case Study Analysis
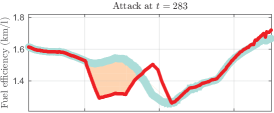
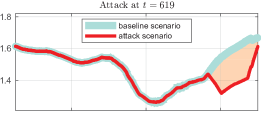
Figure 2 (top) shows the observed fuel efficiency plotted over the mission duration. The light blue line represents the observed fuel efficiency under the baseline scenario during which no attacks took place. The red line represents the fuel efficiency under two separate attack scenarios, with attacks occurring at and , respectively. The effects of the attacks can be seen starting around and , when the blue and red lines diverge. The loss in fuel efficiency, shaded orange, is the net effect of the attack on fuel efficiency. The magnitude of the effect, calculated as the decrease in area under the curve (AUC) over the interval where the attack curves deviate from the baselines, was 10.76% in the first scenario and 11.42% in the second.
The experimental data were then analyzed using the novel mathematical framework detailed in a companion paper [22]. Briefly, the framework is used to express the functionality of a vehicle over mission time in terms of a parameterized change process. The key parameters are the magnitudes of the impact of malware and the impact of bonware (the totality of physical and cyber features that allow a system to resist and recover from cyber compromise). Since the effect of malware is not immediate, the effective onset of malware is modeled as an additional free parameter .
The process model is governed by the differential equation , where and is the boxcar function, the difference of two unit step functions (resulting in a step from zero to one at time and from one to zero at time ). Bonware impact, activates at the switching time. Normative functionality, , is set to in this example.
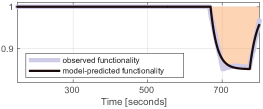
The process is applied to the functionality of the vehicle over mission time. Functionality at time is defined as the ratio of a vehicular performance metric (here, fuel efficiency) at time in the attack scenario divided by the same metric at time in either the baseline scenario or the attack scenario, whichever is lower. Note that due to the high variability of fuel efficiency over short time intervals, the time series was first smoothed with a moving average window before taking the ratio (Figure 2, top).
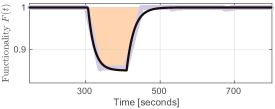
The parameters of the model can be estimated from data using standard model fitting tools. Our implementation relied on the estimation of a hidden Markov model as described in [22]. For the current data, we estimated , , , and for the first scenario and , , , and for the second. These model-based results allow us to quantify the relative impact of malware and bonware among different mission scenarios, vehicles, or attack and defense modalities.
Figure 2 (bottom) shows the functionality over time (solid light blue line) for the two case studies. Also shown is the functionality predicted by the three-parameter differential equation model (black line). The model captures the salient aspects of the data well.
VI Discussion and Conclusions
The illustrative case study demonstrates that the experimental infrastructure described generates data with sufficient fidelity to progress our model for the quantitative measurement of cyber resilience. Analysis of the data by subject matter experts confirm that it is similiar to data that would be generated by real-world systems.
The measurement of resilience is restricted to only those KPPs that the system is able to produce [23]. In future work, components will be added to simulate different vehicles and more KPPs. This data may then be used to further refine our measurement methodology. Also, similiar experiments will be conducted with an actual MGV. These results will be compared to the simulated results to establish the fidelity of the infrastructure and validity of the methodology.
References
- [1] T. Hoppe and J. Dittman, “Sniffing/replay attacks on CAN buses: A simulated attack on the electric window lift classified using an adapted CERT taxonomy,” in Proceedings of the 2nd workshop on embedded systems security (WESS), 2007, pp. 1–6.
- [2] K. Koscher, A. Czeskis, F. Roesner, S. Patel, T. Kohno, S. Checkoway, D. McCoy, B. Kantor, D. Anderson, H. Shacham et al., “Experimental security analysis of a modern automobile,” in 2010 IEEE symposium on security and privacy. IEEE, 2010, pp. 447–462.
- [3] M. Bozdal, M. Randa, M. Samie, and I. Jennions, “Hardware trojan enabled denial of service attack on CAN bus,” Procedia Manufacturing, vol. 16, pp. 47–52, 2018.
- [4] M. Bozdal, M. Samie, and I. Jennions, “A survey on CAN bus protocol: Attacks, challenges, and potential solutions,” in 2018 International Conference on Computing, Electronics Communications Engineering (iCCECE), 2018, pp. 201–205.
- [5] S. Stachowski, R. Bielawski, and A. Weimerskirch, “Cybersecurity research considerations for heavy vehicles,” University of Michigan, Ann Arbor, Transportation Research Institute, Washington DC, Tech. Rep. DOT HS 812 636, Dec. 2018.
- [6] M. Bozdal, M. Samie, S. Aslam, and I. Jennions, “Evaluation of CAN bus security challenges,” Sensors, vol. 20, no. 8, p. 2364, 2020.
- [7] “National preparedness,” Office of the President (US), Washington (DC), Presidential Policy Directive PPD-8, Mar. 30 2011.
- [8] “Critical infrastructure security and resilience,” Office of the President (US), Washington (DC), Presidential Policy Directive PPD-21, Feb. 12 2013.
- [9] A. Alexeev, D. S. Henshel, K. Levitt, P. McDaniel, B. Rivera, S. Templeton, and M. Weisman, “Constructing a science of cyber-resilience for military systems,” in NATO IST-153 Workshop on Cyber Resilience, 2017, pp. 23–25.
- [10] I. Linkov, B. D. Trump, and J. Keisler, “Risk and resilience must be independently managed,” Nature, vol. 555, p. 7694, 2018.
- [11] A. Kott and I. Linkov, Cyber resilience of systems and networks. New York, NY: Springer International Publishing, 2019.
- [12] ——, “To improve cyber resilience, measure it,” arXiv preprint arXiv:2102.09455, 2021.
- [13] C. Miller and C. Valasek, “Adventures in automotive networks and control units,” Def Con, vol. 21, no. 260-264, pp. 15–31, 2013.
- [14] ——, “Remote exploitation of an unaltered passenger vehicle,” Black Hat USA, vol. 2015, no. S 91, 2015.
- [15] I. Foster, A. Prudhomme, K. Koscher, and S. Savage, “Fast and vulnerable: A story of telematic failures,” in 9th USENIX Workshop on Offensive Technologies (WOOT 15). Washington, D.C.: USENIX Association, Aug. 2015.
- [16] J. Daily, R. Gamble, S. Moffitt, C. Raines, P. Harris, J. Miran, I. Ray, S. Mukherjee, H. Shirazi, and J. Johnson, “Towards a cyber assurance testbed for heavy vehicle electronic controls,” SAE International Journal of Commercial Vehicles, vol. 9, no. 2, pp. 339–349, 2016.
- [17] Q. Wang, Y. Qian, Z. Lu, Y. Shoukry, and G. Qu, “A delay based plug-in-monitor for intrusion detection in controller area network,” in 2018 Asian Hardware Oriented Security and Trust Symposium (AsianHOST), Dec 2018, pp. 86–91.
- [18] H. Shikata, T. Yamashita, K. Arai, T. Nakano, K. Hatanaka, and H. Fujikawa, “Digital twin environment to integrate vehicle simulation and physical verification,” SEI Technical Review, vol. 88, pp. 18–21, 2019.
- [19] T. Toyama, T. Yoshida, H. Oguma, and T. Matsumoto, “PASTA: Portable automotive security testbed with adaptability,” Black Hat Europe 2018, Dec. 3–6, 2018.
- [20] Unity real-time game development platform. (v2020.3.18f1). [Online]. Available: https://unity.com/
- [21] “Open source in test automation”. Keysight Technologies. (2021). [Online]. Available: https://opentap.io/assets/Open-Source-in-Test-Automation-v3.pdf/
- [22] A. Kott, M. J. Weisman, and Vandekerckhove, “Mathematical modeling of cyber resilience,” MILCOM, 2022.
- [23] S. C. Smith, S. Raio, R. F. Erbacher, M. Weisman, T. W. Parker, and J. E. Ellis, “Quantitative measurement of cyber resilience: A tabletop exercise,” DEVCOM Army Research Laboratory (US), Technical Report ARL-TR-9380, Jan. 2022.
- ADF
- Active Defense Framework
- AUC
- area under the curve
- AutoCRAT
- Automated Cyber Resilience Assessment Tool
- AWD
- all-wheel drive
- BSFC
- brake-specific fuel consumption
- CA
- Collaborative Agreement
- CAN
- Controller Area Network
- CGW
- central gateway
- DIR
- detect, isolate, and recover
- DoD
- Department of Defense
- ECU
- electronic control unit
- IDE
- integrated development environment
- IP
- Internet Protocol
- KPP
- key performance parameter
- LDI
- livelihood diversification index
- MEF
- mission essential function
- MGV
- military ground vehicle
- MQTT
- Message Queue Telemetry Transport
- OBD2
- on-board diagnostics 2
- PASTA
- Toyota Portable Automotive Security Testbed with Adaptability
- PGN
- parameter group number
- PID
- proportional-integral-derivative
- POI
- point of interest
- PSU/ARL
- Penn State University Applied Research Laboratory
- QMoCR
- Quantitative Measurement of Cyber Resilience
- RI
- resilience index
- RPM
- revolutions per minute
- SAE
- Society of Automotive Engineers
- SLCAN
- CAN over Serial
- SPN
- suspect parameter number
- USB
- universal serial bus
- CTIS
- Central Tire Inflation System
- JLTV
- Joint Light Tactical Vehicle