Mode-specific Coupling of Nanoparticle-on-Mirror Cavities with Cylindrical Vector Beams
Abstract
Abstract Nanocavities formed by ultrathin metallic gaps, such as the nanoparticle-on-mirror geometry, permit the reproducible engineering and enhancement of light-matter interaction thanks to mode volumes reaching the smallest values allowed by quantum mechanics. Although a large body of experimental data has confirmed theoretical predictions regarding the dramatically enhanced vacuum field in metallic nanogaps, much fewer studies have examined the far-field to near-field input coupling. Estimates of this quantity usually rely on numerical simulations under a plane wave background field, whereas most experiments employ a strongly focused laser beam. Moreover, it is often assumed that tuning the laser frequency to that of a particular cavity mode is a sufficient condition to resonantly excite its near-field. Here, we experimentally demonstrate selective excitation of nanocavity modes controlled by the polarization and frequency of the laser beam. We reveal mode-selectivity by recording fine confocal maps of Raman scattering intensity excited by cylindrical vector beams, which are compared to the known excitation near-field patterns. Our measurements allow unambiguous identification of the transverse vs. longitudinal character of the excited cavity mode, and of their relative input coupling rates as a function of laser wavelength. The method introduced here is easily applicable to other experimental scenarios and our results are an important step to connect far-field with near-field parameters in quantitative models of nanocavity-enhanced phenomena such as molecular cavity optomechanics, polaritonics and surface-enhanced spectroscopies.
I Introduction
Plasmonic nanocavities are capable of capturing and confining light in dimensions much smaller than the free-space wavelength, where optically active materials can be positioned. Light-matter interaction is thereby greatly enhanced; when its rate overcomes all intrinsic dissipation rates the strong-coupling regime can be reached [1, 2, 3, 4, 5]. More broadly, plasmonic nanocavities have become instrumental in a number cutting-edge technologies: Tip-Enhanced Raman Spectroscopy (TERS) [6, 7]; chemistry [8] and electroluminescence [9] at the single molecule limit; enhanced nonlinearities [10]; single-photon sources [11]; coherent frequency upconversion [12]. A common challenge for most applications is to achieve efficient coupling between a travelling electromagnetic wave (the far-field) and a confined plasmonic nanocavity mode (the near-field) [13, 14]. To this aim, a precise knowledge of the spectral and spatial distributions of the plasmonic modes are required, as well as techniques to identify, tune and optimize the coupling from far field radiation to specific subwavelength cavity modes.
Among many different geometries studied in the literature, nanoparticle-on-mirror (NPoM) structures [15, 16] constitute versatile, robust, reproducible and easy-to-fabricate plasmonic nanocavities with intrinsic antenna functionality [13, 14], enabling degrees of confinement and enhancement of optical fields reaching their fundamental limits [17]. The NPoM optical resonances have been classified as transverse waveguide (S) and antenna (L) modes, which typically mix to form hybridized (J) gap modes presenting distinct near- and far-field radiation patterns [18, 19, 20, 21, 22]. Rigorous quantization of these highly dissipative modes and definition of their mode volumes have also been developed in the framework of non hermitian quasi-normal modes [23, 24].
Near field intensities for all gap modes being tightly confined within the spacer material, direct and quantitative analysis via near-field scanning probe or electron energy loss spectroscopy has not been achieved. Consequently, experiments rely on elastic dark-field scattering spectra obtained under quasi-plane wave excitation to infer the nanocavity spectrum and which mode is excited at a particular laser wavelength [25, 20]. Not only is this approach underestimating or neglecting the contribution of ‘dark’ modes (which do not couple well to incident plane waves but can be efficiently excited by scatterers or emitters in the near field), it is also unable to make prediction as to the relative input coupling rate of a strongly focused laser beam to a particular mode, which can depend not only on laser wavelength, but also on the near field polarization at the focus [26, 27, 28, 29, 30]. Knowledge of the cavity input coupling rate is required to infer the intracavity excitation number, which in turns govern all optically-driven processes in various applications including SERS, photochemistry and photocatalysis, plasmon-enhanced luminescence, nonlinear optics and frequency conversion. Its role and physical meaning has been evidenced using various formalisms: indirectly via quantum master equations [31, 32], in plasmon induced transparency [33, 34, 35, 36] and also in the context of molecular cavity optomechanics [37, 38, 39, 40, 41], which aims at a more complete description of vibrational and plasmonic correlations and dynamics in SERS. Recent theoretical developments have moreover pointed out its importance for a correct estimate of dissipative coupling rates [42].
Here, we present a simple and efficient method to determine which nanocavity modes are effectively excited depending on adjustable laser wavelength and polarization. We record the SERS intensity from molecules embedded in NPoM structures under tightly-focused radially, azimuthally and linearly polarized excitation as a function of the NPoM position within the laser focus. We show that the intensity of the SERS signal is typically dominated by the coupling between a single vectorial component of the incoming light field and a single plasmonic gap mode. We demonstrate that polarization and wavelength tuning of the excitation beam allow to address specific ultraconfined plasmonic modes and optimize simultaneously their coupling to traveling light modes and their parametrically enhanced interaction with the gap material. Finally, we prove the flexibility of our technique on different plasmonic structures, whose resonances cannot be easily identified with elastic dark-field scattering. We anticipate that our method will help understanding, modelling and optimising mode-specific excitation and in-coupling efficiency for a broad range of nanocavities, thus boosting further the desired light-matter interaction while reducing unwanted effects such as Joule heating, and allowing to unlock the full potential of multimode photonic nanostructures.
II Results
Experimental setup. —
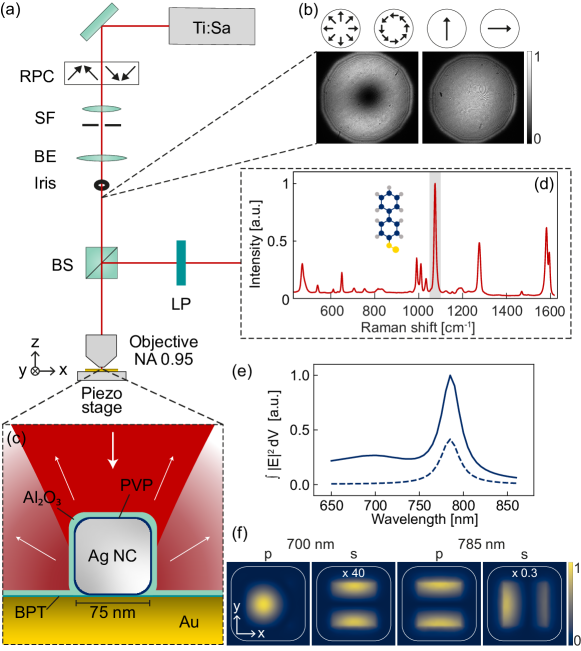
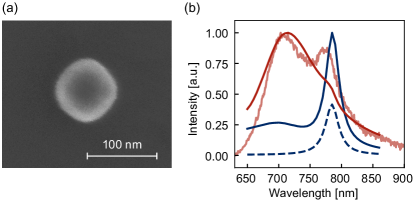
A simplified description of the experimental setup is provided in Figure 1a. On the laser path, a radial polarization converter followed by a spatial filter with a - pinhole generates radially and azimuthally polarized light beams, which display doughnut-shape intensity profiles (Figure 1b). The linearly-polarized Gaussian beam is obtained by bypassing the polarization converter. After a beam expander, an iris fixes the beam diameter to mm, which results in a filling factor of the objective back aperture. The incoming field couples to the sample via a -NA objective. The Stokes side of the inelastically scattered field is spectrally filtered before reaching the spectrometer.
The wavelength tunability of the Ti:Sapph laser source and the polarization modularity of our setup (see SI for details) enable a variety of different Raman excitation settings. The radial and azimuthal far fields correspond to superpositions of first-order Hermite-Gaussian modes () and , respectively, where () are unit vectors perpendicular to the propagation direction. These travelling modes, solutions of the Helmholtz equation, belong to the set of cylindrical vector beams and are currently used in a variety of nano-optics applications [43, 44]. Such beams feature position-dependent polarization and a singular point of zero intensity on the optical axis, giving them a characteristic doughnut-shaped intensity profile. In the same Hermite-Gaussian base, the linearly polarized Gaussian beams are defined as: and .
The sample is fixed on a piezo-stage that is finely scanned across the focal plane in and directions, for a fixed position along the optical axis (see SI for details). The Raman-active nanocavities are fabricated on a template-stripped nm thick gold film, on which biphenyl-4-thiol (BPT) molecules form a self-assembled monolayer (SAM) and -nm silver nanocubes (NC) are dropcasted (Figure 1c). The Polyvinylpyrrolidone (PVP) ligand attached to the cubes (NanoXact by nanoComposix) contributes to the gap size. A nm coating formed by atomic layer deposition (ALD) improves the stability of the nanostructures against oxidation and laser induced damage [3].
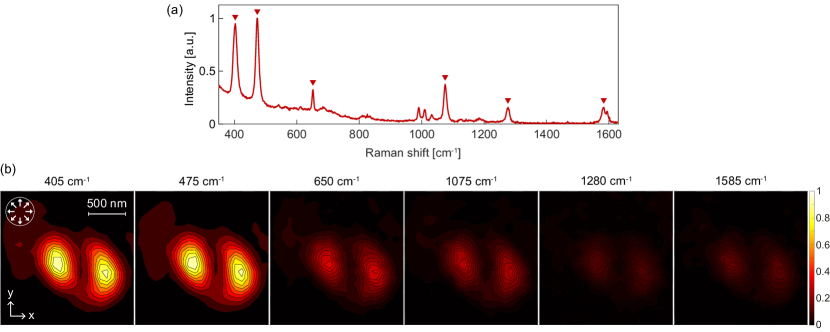
At each sample position, a cavity-enhanced Raman spectrum of the BPT molecules is acquired, as illustrated in Figure 1c. The three most intense peaks at cm-1, cm-1 and cm-1 correspond to the ring stretching, S-H stretching and C-H stretching vibrational modes, respectively. In the following, we use the integrated intensity over the ring stretching peak as a function of the coordinate of the sample scan to build near-field excitation maps (intensities of other vibrational modes are analysed in the SI). We used a large enough slit opening at the spectrometer input to ensure that the detection efficiency is independent of sample position over the range of the maps presented below. Consequently, we consider that the extracted intensity of the Raman signal is a faithful measure of the relative excitation efficiency when scanning the sample. We calibrated the wavelength- and polarization-dependent detection efficiency of the setup from the sample to the detector, as well as the wavelength- and polarization-dependent transmission of the excitation path, see Figure S2 and accompanying discussion.
Theory of polarization-dependent Raman signals. —
We briefly discuss how the enhancement of the Raman signal depends on the geometry of the nanocavity and on the excitation conditions (cf. near-field intensity simulations in Figure 1e-f). The considered NPoM geometry is expected to present one hybrid mode at nm and one transverse mode at nm. The mode comes from the mixing of the transverse and longitudinal modes and has a prevalent longitudinal polarization [46]. Note that the near-field polarization inside the nanogap is mostly longitudinal (along ) for all modes. As suggested by previous dark-field scattering studies [20], the coupling of this NPoM mode to a linearly polarized beam impinging at grazing angle would be optimal for -polarization. Oppositely, -polarized light would preferentially couple to the mode.
Consider now the Raman signal caused by a single molecule located inside the gap, when the nanocavity position in the excitation field is . For a given excitation frequency and polarization (radial, azimuthal, linear along and , respectively), the Stokes Raman power per unit of input power is proportional to
| (1) |
where is the longitudinal component of the single-molecule Raman polarizability tensor for the vibrational mode of interest (inside the gap the in-plane field is negligible in comparison to the out-of-plane field); is the radiative Purcell factor, which describes the out-coupling enhancement at the Stokes frequency corresponding to the vibrational mode at , and it depends on the full spectral response of the plasmonic cavity. The longitudinal field intensity inside the gap is given by
| (2) |
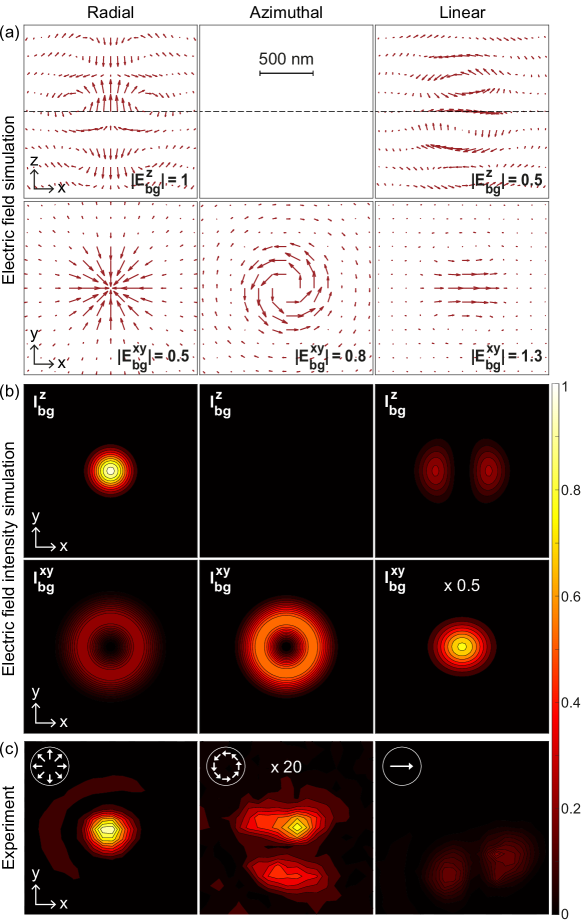
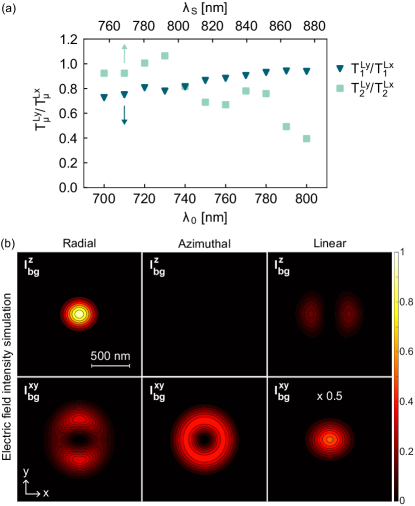
where is the intensity profile of the focused excitation field with , such that and (see Figure 2a,c). The longitudinal () and transverse () in-coupling enhancement factors depend on the exact position of the molecule inside the gap (and so does the Purcell factor) and can be estimated from electromagnetic simulations under linearly polarized plane wave excitation. When a molecular monolayer occupies the entire gap area, a proper computation of the Raman power should consider collective “bright” modes [37] but this more advanced treatment is not necessary here since we do not consider power-dependent collective effects [47]. Apart from a different scaling factor, eq. (1) remains valid.
The main conclusion is that eq. (2) describes how the total emitted Raman power depends on the sample position for a given frequency and polarization of the excitation field through the distinct in-coupling enhancement factors for the longitudinal and transverse background field components. In particular, if the excitation frequency is close to resonance with a longitudinal plasmonic mode, then and the Raman signal will be strongest when the sample position matches a maximum of ; conversely, if is close to resonance with a transversal plasmonic mode, then and the Raman signal will be strongest when the sample position matches a maximum of . This discussion allows to interpret the experimental confocal Raman maps by connecting them to the near field distribution of the focused excitation beam and the transverse vs. longitudinal nature of the antenna mode.
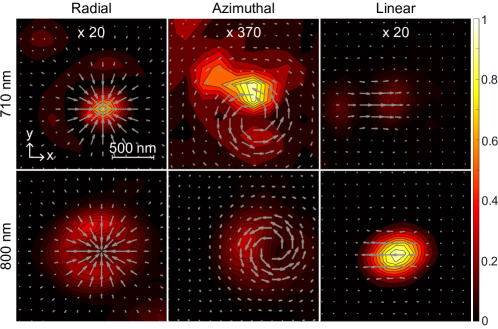
Experimental Raman maps of individual nanocavities. —
We excite a nanocube-on-mirror (NCoM) cavity (embedding BPT molecules) with the different light modes introduced earlier: . Figure 2a shows the calculated local field components produced by these light modes close to the focus of the objective in the and planes. A Raman intensity map of the cm-1 vibrational mode excited at nm (vacuum wavelength) is reported in Figure 2c. By comparing it with the numerically calculated intensity patterns and (at the focal plane ) plotted in Figure 2b we find that for this excitation wavelength Raman scattering improves significantly when the NCoM cavity is positioned in a region where the background excitation field has the largest out-of-plane (longitudinal) component. Indeed, Raman intensity maps collected under radially () and linearly () polarized illuminations match well the calculated distribution of (), both in their shapes and relative intensities. At the chosen excitation wavelength ( nm), our Raman maps thus clearly demonstrate the preferential coupling of the laser field to the longitudinally polarized mode.
Since the focusing of the azimuthally () polarized beam results in over the whole focal plane, Raman scattering can then only happen through the excitation of the far detuned transverse mode, resulting in a much lower coupling efficiency and weaker Stokes signal. More quantitatively, we found that the ratio between the maximum Raman intensities with radial and azimuthal polarization () is comparable to the ratio of near-field intensities integrated over the BPT volume with and polarization (, Figure 1e). The polarization of the out-going field is not analysed in these measurements, and it is in general different from the background polarization exciting the nanocavity. We therefore checked that our detection efficiency is largely polarization insensitive for nm excitation (Figure S2), so that we can safely attribute the change of Raman intensity to the change in input coupling efficiency.
Note that the experimental Raman map does not present a full ring pattern as expected for the transverse field of a focused azimuthally polarized beam. A first reason is the unbalanced superposition of and at the back aperture of the objective due to polarization-dependent transmission efficiency of some components (such as the beam splitter). We do measure that the polarization is attenuated by almost compared to the component in the excitation path, altering the predicted ring pattern (see Figure S2). A second reason is that the nanocavity breaks the cylindrical symmetry and in general exhibits non-degenerate transverse resonances.
Altogether, these first results confirm that Raman intensity maps reveal the polarization-dependent near-field excitation efficiency of localized surface plasmon resonances and can be used to determine the nature of the antenna modes to which the laser preferentially couples at a particular wavelength.
Mode-specific coupling.—
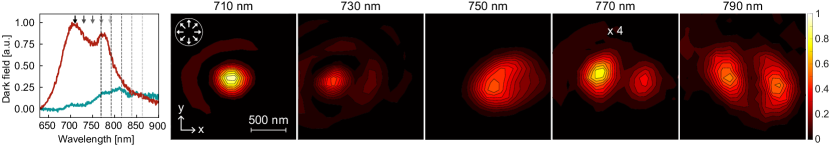
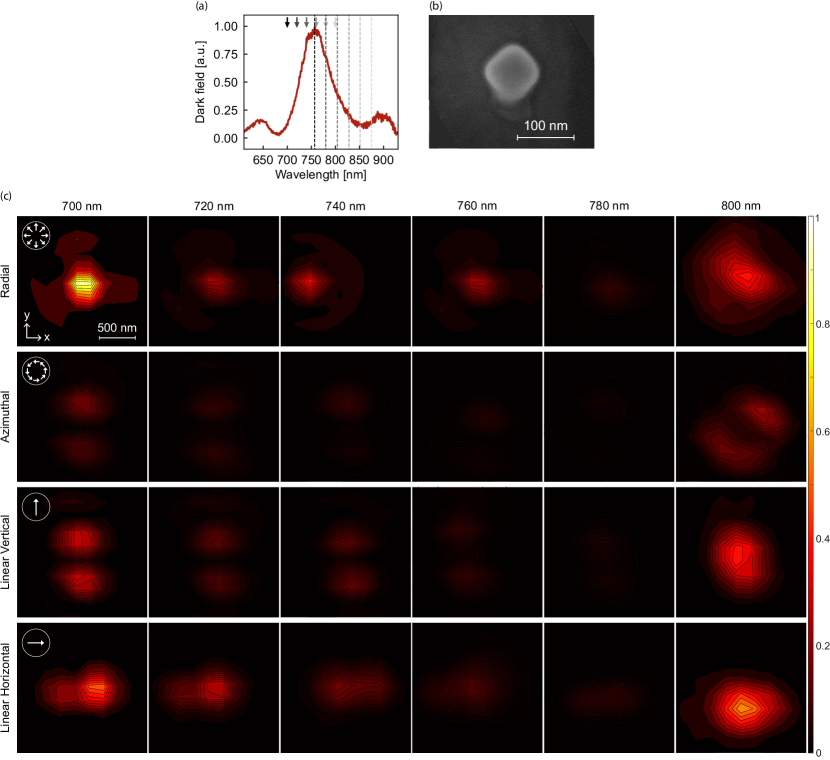
We now demonstrate how the respective contributions of distinct nanocavity modes to the SERS signals can be identified and modified by tuning the wavelength and polarization of the incoming beam. We sweep the excitation wavelength under fixed illumination on the same NCoM cavity. As shown in Figure 3, the single central lobe, consistent with input coupling to the longitudinal mode at nm, progressively transforms into two lobes as the excitation wavelength increases to nm. This intensity pattern should be compared with the calculated spatial distribution of in Figure 2. Here again, while we expect a ring pattern when the laser couples to the transverse mode, the cylindrical symmetry is broken by the nanoparticle shape as well as the polarization dependent transmission on the excitation path and results in a more efficient coupling to a particular transverse polarization, here close to the axis. Complementary data for different incoming light modes and other NCoMs are presented in the SI.
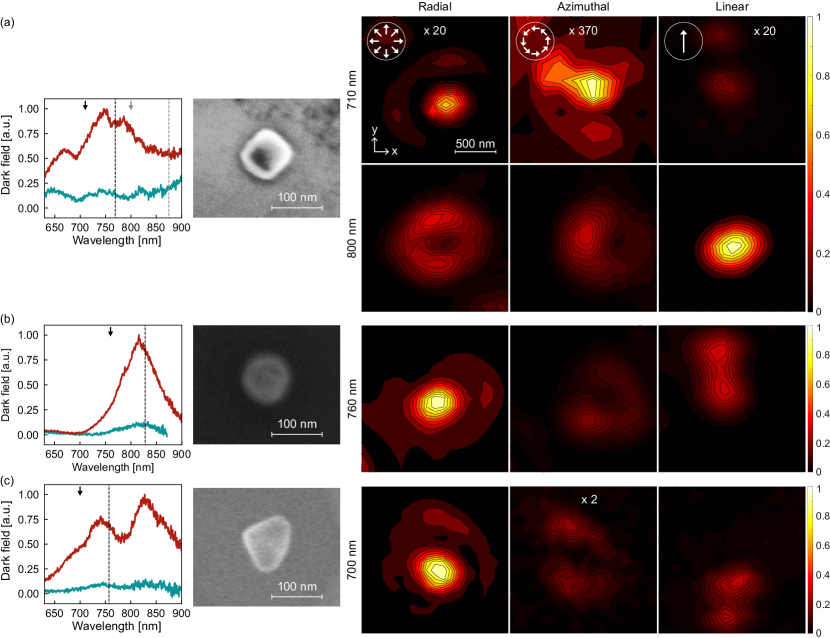
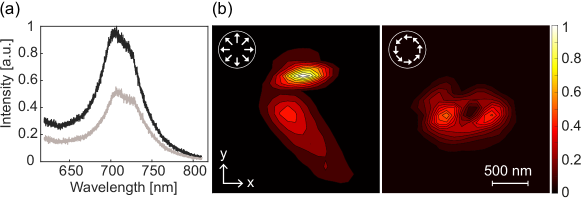
In Figure 4, we illustrate the use of our method on nanocavities with various nanoparticle shapes. Panel (a) presents data for another NCoM for which the polarization dependant dark-field scattering spectra is inconclusive as to the nature of the gap modes. From the Raman intensity maps, a clear passage from longitudinal to transverse mode coupling is monitored under both radial and linear polarization. In this example, the superiority of the confocal scanning approach compared to polarized dark-field measurements is evident when it comes to determine the nature of the excited modes vs. incoming wavelength.
Theoretical models and numerical studies have predicted how and modes of quasi-spherical NPoM undergo frequency crossing as a function of the size and shape of the bottom facet of the nanoparticle [21, 22] – a parameter that cannot be easily controlled during fabrication nor be measured by existing nanoscopy techniques. Interestingly, our technique can efficiently discriminate these modes’ contributions. In the case of the NPoM in panel (b), a single resonance appears in dark field: since the Raman intensity maps at nm excitation indicates a preferential longitudinal input coupling, we can associate this resonance to the longitudinal mode rather than . Finally, panel (c) corroborates the validity of the technique for a more irregularly shaped NPoM, where we can evidence more efficient coupling to a longitudinally polarized mode around 700 nm. It has to be highlighted that our technique could straightforwardly be applied for the characterization of a large variety of nanostructures, including other mirror-based nanocavities (dimer-on-mirror [48], magnetic resonances [49], etc.) and could be performed using a variety of signals. We illustrate this flexibility in the SI by performing complementary photoluminescence maps of our gold nanocavities under radial and azimuthal illumination.
III Conclusion
We demonstrated mode-selective laser excitation of nanoparticle-on-mirror systems using a simple technique based on the Raman signal from embedded molecules. By performing confocal Raman mapping under radial, azimuthal and linear polarization for different laser wavelengths, we could unambiguously determine the longitudinal vs. transverse nature of the antenna mode most efficiently coupled to the incoming beam and show the transition from one mode to another on a singular nanostructure as the laser wavelength is tuned. Our method vividly reveals the distinct nature of ultraconfined modes most efficiently excited at particular wavelengths and proves to be a versatile nanoscopy tool able to address irregular nanocavities. Using faster acquisition rates, the method could also be extended to interrogate unstable picocavities [50]. Thanks to its uncomplicated implementation our tool can be combined with other nanoscopy techniques to simultaneously acquire -space [51, 52] or phase information [53]. Other brighter signals emanating from resonant Raman scattering [54, 55] or fluorescence [1] could be used as a local probe to learn more and control better their interaction with gap modes, extending on the seminal studies that introduced the technique for focused laser beams [56, 57].
This work is a first step toward a precise and quantitative estimate of input coupling rates between far-field radiation and nanocavity modes. These are key quantities in several plasmonic sensing schemes [34, 35] and are essential for accurate modelling and testing of novel predictions of molecular cavity optomechanics, such as the appearance of dynamical backaction and optical-spring effects at the molecular level [37, 58]. Our results also pave the way for extended studies and optimization of input coupling rates for rapidly evolving hot-spots [50, 59, 60] with the help of adaptive-optics illumination [61]. More directly, we showed that the control of the incoming beam allows to select the gap mode contributing to the targeted light-matter interaction and enables pushing further the sensitivity of nano-devices using ultra-confined cavity modes.
Acknowledgements
This project has received funding from the Swiss National Science Foundation (grants No. 170684, 198898 and 206926) and from the European Union’s Horizon 2020 research and innovation program under Grant Agreement No. 820196 (ERC CoG QTONE). The authors thank Huatian Hu for assistance with numerical simulations and Prof. Kippenberg for offering laboratory access.
References
- Chikkaraddy et al. [2016] R. Chikkaraddy, B. de Nijs, F. Benz, S. J. Barrow, O. A. Scherman, E. Rosta, A. Demetriadou, P. Fox, O. Hess, and J. J. Baumberg, Single-molecule strong coupling at room temperature in plasmonic nanocavities, Nature 535, 127 (2016).
- Xiong et al. [2021] X. Xiong, N. Kongsuwan, Y. Lai, C. E. Png, L. Wu, and O. Hess, Room-temperature plexcitonic strong coupling: Ultrafast dynamics for quantum applications, Appl. Phys. Lett. 118, 130501 (2021).
- Heintz et al. [2021] J. Heintz, N. Markešević, E. Y. Gayet, N. Bonod, and S. Bidault, Few-Molecule Strong Coupling with Dimers of Plasmonic Nanoparticles Assembled on DNA, ACS Nano 15, 14732 (2021).
- Liu et al. [2021] X. Liu, J. Yi, S. Yang, E.-C. Lin, Y.-J. Zhang, P. Zhang, J.-F. Li, Y. Wang, Y.-H. Lee, Z.-Q. Tian, and X. Zhang, Nonlinear valley phonon scattering under the strong coupling regime, Nat. Mater. 20, 1210 (2021).
- Bylinkin et al. [2021] A. Bylinkin, M. Schnell, M. Autore, F. Calavalle, P. Li, J. Taboada-Gutièrrez, S. Liu, J. H. Edgar, F. Casanova, L. E. Hueso, P. Alonso-Gonzalez, A. Y. Nikitin, and R. Hillenbrand, Real-space observation of vibrational strong coupling between propagating phonon polaritons and organic molecules, Nature Photonics 15, 197 (2021).
- Zhang et al. [2013] R. Zhang, Y. Zhang, Z. C. Dong, S. Jiang, C. Zhang, L. G. Chen, L. Zhang, Y. Liao, J. Aizpurua, Y. Luo, J. L. Yang, and J. G. Hou, Chemical mapping of a single molecule by plasmon-enhanced Raman scattering, Nature 498, 82 (2013).
- Lee et al. [2019] J. Lee, K. T. Crampton, N. Tallarida, and V. A. Apkarian, Visualizing vibrational normal modes of a single molecule with atomically confined light, Nature 568, 78 (2019).
- Sun et al. [2012] M. Sun, Z. Zhang, H. Zheng, and H. Xu, In-situ plasmon-driven chemical reactions revealed by high vacuum tip-enhanced Raman spectroscopy, Sci Rep 2, 647 (2012).
- Kern et al. [2015] J. Kern, R. Kullock, J. Prangsma, M. Emmerling, M. Kamp, and B. Hecht, Electrically driven optical antennas, Nature Photon 9, 582 (2015).
- Celebrano et al. [2015] M. Celebrano, X. Wu, M. Baselli, S. Großmann, P. Biagioni, A. Locatelli, C. De Angelis, G. Cerullo, R. Osellame, B. Hecht, L. Duò, F. Ciccacci, and M. Finazzi, Mode matching in multiresonant plasmonic nanoantennas for enhanced second harmonic generation, Nature Nanotechnology 10, 412 (2015).
- Hoang et al. [2016] T. B. Hoang, G. M. Akselrod, and M. H. Mikkelsen, Ultrafast Room-Temperature Single Photon Emission from Quantum Dots Coupled to Plasmonic Nanocavities, Nano Lett. 16, 270 (2016).
- Chen et al. [2021a] W. Chen, P. Roelli, H. Hu, S. Verlekar, S. P. Amirtharaj, A. I. Barreda, T. J. Kippenberg, M. Kovylina, E. Verhagen, A. Martínez, and C. Galland, Continuous-wave frequency upconversion with a molecular optomechanical nanocavity, Science 374, 1264 (2021a).
- Li et al. [2018] G.-C. Li, Q. Zhang, S. A. Maier, and D. Lei, Plasmonic particle-on-film nanocavities: A versatile platform for plasmon-enhanced spectroscopy and photochemistry, Nanophotonics 7, 1865 (2018).
- Baumberg et al. [2019] J. J. Baumberg, J. Aizpurua, M. H. Mikkelsen, and D. R. Smith, Extreme nanophotonics from ultrathin metallic gaps, Nat. Mater. 18, 668 (2019).
- Aravind et al. [1982] P. K. Aravind, R. W. Rendell, and H. Metiu, A new geometry for field enhancement in surface-enhanced spectroscopy, Chemical Physics Letters 85, 396 (1982).
- Lee [2022] S. Lee, Nanoparticle-on-mirror cavity: A historical view across nanophotonics and nanochemistry, J. Korean Phys. Soc. 10.1007/s40042-022-00407-z (2022).
- Chen et al. [2018a] W. Chen, S. Zhang, M. Kang, W. Liu, Z. Ou, Y. Li, Y. Zhang, Z. Guan, and H. Xu, Probing the limits of plasmonic enhancement using a two-dimensional atomic crystal probe, Light: Science & Applications 7, 56 (2018a).
- Lassiter et al. [2013] J. B. Lassiter, F. McGuire, J. J. Mock, C. Ciracì, R. T. Hill, B. J. Wiley, A. Chilkoti, and D. R. Smith, Plasmonic Waveguide Modes of Film-Coupled Metallic Nanocubes, Nano Lett. 13, 5866 (2013).
- Tserkezis et al. [2015] C. Tserkezis, R. Esteban, D. O. Sigle, J. Mertens, L. O. Herrmann, J. J. Baumberg, and J. Aizpurua, Hybridization of plasmonic antenna and cavity modes: Extreme optics of nanoparticle-on-mirror nanogaps, Phys. Rev. A 92, 053811 (2015).
- Chikkaraddy et al. [2017] R. Chikkaraddy, X. Zheng, F. Benz, L. J. Brooks, B. de Nijs, C. Carnegie, M.-E. Kleemann, J. Mertens, R. W. Bowman, G. A. E. Vandenbosch, V. V. Moshchalkov, and J. J. Baumberg, How Ultranarrow Gap Symmetries Control Plasmonic Nanocavity Modes: From Cubes to Spheres in the Nanoparticle-on-Mirror, ACS Photonics 4, 469 (2017).
- Kongsuwan et al. [2020] N. Kongsuwan, A. Demetriadou, M. Horton, R. Chikkaraddy, J. J. Baumberg, and O. Hess, Plasmonic Nanocavity Modes: From Near-Field to Far-Field Radiation, ACS Photonics 7, 463 (2020).
- Elliott et al. [2022] E. Elliott, K. Bedingfield, J. Huang, S. Hu, B. de Nijs, A. Demetriadou, and J. J. Baumberg, Fingerprinting the Hidden Facets of Plasmonic Nanocavities, ACS Photonics 9, 2643 (2022).
- Hughes et al. [2021] S. Hughes, A. Settineri, S. Savasta, and F. Nori, Resonant Raman scattering of single molecules under simultaneous strong cavity coupling and ultrastrong optomechanical coupling in plasmonic resonators: Phonon-dressed polaritons, Phys. Rev. B 104, 045431 (2021).
- Wu et al. [2021] T. Wu, M. Gurioli, and P. Lalanne, Nanoscale Light Confinement: The Q’s and V’s, ACS Photonics 8, 1522 (2021).
- Li et al. [2020] C.-Y. Li, S. Duan, B.-Y. Wen, S.-B. Li, M. Kathiresan, L.-Q. Xie, S. Chen, J. R. Anema, B.-W. Mao, Y. Luo, Z.-Q. Tian, and J.-F. Li, Observation of inhomogeneous plasmonic field distribution in a nanocavity, Nature Nanotechnology 15, 922 (2020).
- Long et al. [2016] J. Long, H. Yi, H. Li, Z. Lei, and T. Yang, Reproducible Ultrahigh SERS Enhancement in Single Deterministic Hotspots Using Nanosphere-Plane Antennas Under Radially Polarized Excitation, Sci Rep 6, 33218 (2016).
- Fulmes et al. [2018] J. Fulmes, D. A. Gollmer, S. Jäger, C. Schäfer, A. Horrer, D. Zhang, P.-M. Adam, A. J. Meixner, D. P. Kern, and M. Fleischer, Mapping the electric field distribution of tightly focused cylindrical vector beams with gold nanorings, Opt. Express, OE 26, 14982 (2018).
- Shang et al. [2019] W. Shang, F. Xiao, W. Zhu, L. Han, T. Mei, and J. Zhao, Characterizing localized surface plasmon resonances using focused radially polarized beam, Applied Optics 58, 5812 (2019).
- Grosche et al. [2020] S. Grosche, R. Hünermann, G. Sarau, S. Christiansen, R. W. Boyd, G. Leuchs, and P. Banzer, Towards polarization-based excitation tailoring for extended Raman spectroscopy, Opt. Express 28, 10239 (2020).
- Tang et al. [2021] P. Tang, X. Xing, S. Liu, W. Cheng, X. Lu, and L. Zhong, Plasmonic Particle-on-Film Nanocavity in Tightly Focused Vector Beam: a Full-Wave Theoretical Analysis from Near-Field Enhancement to Far-Field Radiation, Plasmonics 16, 215 (2021).
- Esteban et al. [2014] R. Esteban, J. Aizpurua, and G. W. Bryant, Strong coupling of single emitters interacting with phononic infrared antennae, New Journal of Physics 16, 013052 (2014).
- Sánchez-Barquilla et al. [2020] M. Sánchez-Barquilla, R. E. F. Silva, and J. Feist, Cumulant expansion for the treatment of light–matter interactions in arbitrary material structures, The Journal of Chemical Physics 152, 034108 (2020).
- Liu et al. [2009] N. Liu, L. Langguth, T. Weiss, J. Kästel, M. Fleischhauer, T. Pfau, and H. Giessen, Plasmonic analogue of electromagnetically induced transparency at the Drude damping limit, Nature Materials 8, 758 (2009).
- Adato et al. [2013] R. Adato, A. Artar, S. Erramilli, and H. Altug, Engineered Absorption Enhancement and Induced Transparency in Coupled Molecular and Plasmonic Resonator Systems, Nano Letters 13, 2584 (2013).
- Neuman et al. [2015] T. Neuman, C. Huck, J. Vogt, F. Neubrech, R. Hillenbrand, J. Aizpurua, and A. Pucci, Importance of Plasmonic Scattering for an Optimal Enhancement of Vibrational Absorption in SEIRA with Linear Metallic Antennas, The Journal of Physical Chemistry C 119, 26652 (2015).
- Neubrech et al. [2017] F. Neubrech, C. Huck, K. Weber, A. Pucci, and H. Giessen, Surface-Enhanced Infrared Spectroscopy Using Resonant Nanoantennas, Chemical Reviews 117, 5110 (2017).
- Roelli et al. [2016] P. Roelli, C. Galland, N. Piro, and T. J. Kippenberg, Molecular cavity optomechanics as a theory of plasmon-enhanced Raman scattering, Nature Nanotechnology 11, 164 (2016).
- Schmidt et al. [2016] M. K. Schmidt, R. Esteban, A. González-Tudela, G. Giedke, and J. Aizpurua, Quantum Mechanical Description of Raman Scattering from Molecules in Plasmonic Cavities, ACS Nano 10, 6291 (2016).
- Schmidt et al. [2017] M. K. Schmidt, R. Esteban, F. Benz, J. J. Baumberg, and J. Aizpurua, Linking classical and molecular optomechanics descriptions of SERS, Faraday Discuss. (2017).
- Roelli et al. [2020] P. Roelli, D. Martin-Cano, T. J. Kippenberg, and C. Galland, Molecular Platform for Frequency Upconversion at the Single-Photon Level, Physical Review X 10, 031057 (2020).
- Esteban et al. [2022] R. Esteban, J. J. Baumberg, and J. Aizpurua, Molecular Optomechanics Approach to Surface-Enhanced Raman Scattering, Acc. Chem. Res. 10.1021/acs.accounts.1c00759 (2022).
- Primo et al. [2020] A. G. Primo, N. C. Carvalho, C. M. Kersul, N. C. Frateschi, G. S. Wiederhecker, and T. P. M. Alegre, Quasinormal-Mode Perturbation Theory for Dissipative and Dispersive Optomechanics, Phys. Rev. Lett. 125, 233601 (2020).
- Züchner et al. [2011] T. Züchner, A. V. Failla, and A. J. Meixner, Light Microscopy with Doughnut Modes: A Concept to Detect, Characterize, and Manipulate Individual Nanoobjects, Angew. Chem. Int. Ed. 50, 5274 (2011).
- Rosales-Guzmán et al. [2018] C. Rosales-Guzmán, B. Ndagano, and A. Forbes, A review of complex vector light fields and their applications, J. Opt. 20, 123001 (2018).
- Chen et al. [2018b] W. Chen, S. Zhang, Q. Deng, and H. Xu, Probing of sub-picometer vertical differential resolutions using cavity plasmons, Nat Commun 9, 801 (2018b).
- Zhang et al. [2019] C. Zhang, J.-P. Hugonin, J.-J. Greffet, and C. Sauvan, Surface Plasmon Polaritons Emission with Nanopatch Antennas: Enhancement by Means of Mode Hybridization, ACS Photonics 6, 2788 (2019).
- Zhang et al. [2020] Y. Zhang, J. Aizpurua, and R. Esteban, Optomechanical Collective Effects in Surface-Enhanced Raman Scattering from Many Molecules, ACS Photonics 7, 1676 (2020).
- Li et al. [2017] G.-C. Li, Y.-L. Zhang, J. Jiang, Y. Luo, and D. Y. Lei, Metal-Substrate-Mediated Plasmon Hybridization in a Nanoparticle Dimer for Photoluminescence Line-Width Shrinking and Intensity Enhancement, ACS Nano 11, 3067 (2017).
- Chen et al. [2018c] S. Chen, Y. Zhang, T.-M. Shih, W. Yang, S. Hu, X. Hu, J. Li, B. Ren, B. Mao, Z. Yang, and Z. Tian, Plasmon-Induced Magnetic Resonance Enhanced Raman Spectroscopy, Nano Letters 18, 2209 (2018c).
- Benz et al. [2016] F. Benz, M. K. Schmidt, A. Dreismann, R. Chikkaraddy, Y. Zhang, A. Demetriadou, C. Carnegie, H. Ohadi, B. d. Nijs, R. Esteban, J. Aizpurua, and J. J. Baumberg, Single-molecule optomechanics in “picocavities”, Science 354, 726 (2016).
- Lieb et al. [2004] M. A. Lieb, J. M. Zavislan, and L. Novotny, Single-molecule orientations determined by direct emission pattern imaging, JOSA B 21, 1210 (2004).
- Röhrich et al. [2018] R. Röhrich, C. Hoekmeijer, C. I. Osorio, and A. F. Koenderink, Quantifying single plasmonic nanostructure far-fields with interferometric and polarimetric k-space microscopy, Light: Science & Applications 7, 65 (2018).
- Bauer et al. [2014] T. Bauer, S. Orlov, U. Peschel, P. Banzer, and G. Leuchs, Nanointerferometric amplitude and phase reconstruction of tightly focused vector beams, Nature Photon 8, 23 (2014).
- Haynes and Van Duyne [2003] C. L. Haynes and R. P. Van Duyne, Plasmon-Sampled Surface-Enhanced Raman Excitation Spectroscopy, The Journal of Physical Chemistry B 107, 7426 (2003).
- Itoh and S. Yamamoto [2021] T. Itoh and Y. S. Yamamoto, Between plasmonics and surface-enhanced resonant Raman spectroscopy: toward single-molecule strong coupling at a hotspot, Nanoscale 13, 1566 (2021).
- Sick et al. [2000] B. Sick, B. Hecht, and L. Novotny, Orientational Imaging of Single Molecules by Annular Illumination, Physical Review Letters 85, 4482 (2000).
- Novotny et al. [2001] L. Novotny, M. R. Beversluis, K. S. Youngworth, and T. G. Brown, Longitudinal Field Modes Probed by Single Molecules, Phys. Rev. Lett. 86, 5251 (2001).
- Jakob et al. [2022] L. A. Jakob, W. M. Deacon, Y. Zhang, B. de Nijs, E. Pavlenko, S. Hu, C. Carnegie, T. Neuman, R. Esteban, J. Aizpurua, and J. J. Baumberg, Softening molecular bonds through the giant optomechanical spring effect in plasmonic nanocavities (2022), arXiv:2204.09641 [cond-mat, physics:physics, physics:quant-ph].
- Lindquist et al. [2019] N. C. Lindquist, C. D. L. de Albuquerque, R. G. Sobral-Filho, I. Paci, and A. G. Brolo, High-speed imaging of surface-enhanced Raman scattering fluctuations from individual nanoparticles, Nature Nanotechnology 14, 981 (2019).
- Chen et al. [2021b] W. Chen, P. Roelli, A. Ahmed, S. Verlekar, H. Hu, K. Banjac, M. Lingenfelder, T. J. Kippenberg, G. Tagliabue, and C. Galland, Intrinsic luminescence blinking from plasmonic nanojunctions, Nature Communications 12, 2731 (2021b).
- Lee et al. [2021] D. Y. Lee, C. Park, J. Choi, Y. Koo, M. Kang, M. S. Jeong, M. B. Raschke, and K.-D. Park, Adaptive tip-enhanced nano-spectroscopy, Nature Communications 12, 3465 (2021).
– Supplementary Material –
Mode-specific Coupling of Nanoparticle-on-Mirror Cavities with Cylindrical Vector Beams
FEM simulations. —
In order to understand the results obtained by mapping the Raman signal and confirm the nature of the plasmonic modes that we addressed, we performed FEM simulations with COMSOL Multiphysics (version 6). The simulation geometry is constituted by a - cubic box, including a gold substrate and a silver nanocube with rounded edges, separated by a molecular gap of height . The dielectric functions of gold and silver are interpolations of Johnson’s and Christy’s data [1], while the molecules are modelled as a dielectric layer of refractive index . The rounding factor of the cube’s edges is defined by , where nm is the total length of the cube and is the radius of curvature. We used - and -polarized plane-wave excitation with incidence angle from the mirror surface.
The SEM image in Figure S1a shows the nanocube used for the measurements in Figure 2 and 3 of the main text. We first performed DF measurements in order to locate the main plasmonic resonances. Then, we implemented FEM simulations of the scattering cross section with parameters nm and chosen to match the measured frequencies of the DF peaks, as shown in Figure S1b.
The gap height is determined by the length of the molecules and their orientation, and was shown to increase for longer incubation time of the BPT SAM [2]. The BPT molecule have a length of nm, while the PVP ligand have lengths around nm but tend to lie flat around the nanocube; therefore, nm appears to be a reasonable choice. A precise estimation of the rounding parameter is not less difficult, since the major contribution to the gap mode distribution comes from the bottom facet of the cube, which is hidden to SEM imaging. Furthermore, the SEM picture shows the top facet after ALD coating: on the one hand the coating slightly reshapes the silver cube, so that a picture before coating would not be illustrative of the measured nanostructure; on the other hand, ALD fails to strictly reproduce a curved surface because of its spongy nature [3]. As a consequence, while the rounding factor estimated from the SEM images of the producer (nanoComposix) is around , Figure S1a shows rounding factors between and for a total length of nm. The latter is in accordance with the presence of a -nm silver nanocube with -nm ALD coating. Considering a less in the value of for the actual silver structure and given the above mentioned complications, the choice of in the simulation is realistic.
Setup details. —
The excitation beam is provided by an MBR-01 Ti:Sapph ring cavity laser by Coherent, optically pumped by a Verdi-V10 532 nm diode-pumped solide-state laser (also by Coherent). The wavelength of the Ti:Sapph can be tuned from nm to nm. We set the polarization with a nematic liquid-crystal device, namely a radial polarization converter by ARCoptix. It is equipped with an electrical driving (LC Driver by ARCoptix) in order to convert the incoming linearly polarized beam into a radially or azimuthally polarized beam.
In order to map the Raman intensity along the sample surface, we place the sample on a piezo nanopositioner Nano-Align5-100 from Mad City Labs, Inc. It is actuated in closed loop and it has a resolution of nm in , and directions. Notice that the final resolution of the measured Raman intensity maps is also affected by mechanical drifts of the sample in the three directions, especially because a single map requires more than minutes of acquisition time. This explains why the Raman maps with two lobes usually show higher intensity from one of them, in particular the lobe close to the center of the figure: the maps are automatized scans taking the center of the figure as starting point. Before the acquisition, the starting point is optimized to obtain maximum detected Raman signal, while, during the acquisition, the sample can slightly shift out of the focal plane.
Setup calibration. — All the presented Raman measurements are normalized for the setup response. The calibration involves two steps: (i) for each excitation wavelength , the power at the sample position has been measured as a function of the reference power , which is recorded during the measurements; (ii) for each Stokes wavelength , the Ti:Sa has been tuned to and the intensity has been acquired with the spectrometer as a function of the power . Each measurement has been performed with linearly polarized illumination along and . If is the acquired Stokes intensity, where indicates the excitation polarization, the calibrated intensity is given by
| (S1) |
where we defined the transmission factors and , with . For radial and azimuthal illumination, we assumed . Note that corresponds to the efficiency of the Raman process.
We notice that, when the transverse mode is excited, most of our Raman maps present a stronger intensity of the polarization component, so that two intensity lobes appear instead of a doughnut. In fact, when the excitation beam is azimuthally polarized, the two lobes appear along the axis (see Figure 2b and Figure S6), while they appear along for radial polarization (see Figure 3). This is due to the fact that the two ortoghonal polarizations are not equally transmitted through the setup, as shown in Figure S2a, where the - ratios of the transmission factors are plotted as functions of the excitation and Stokes wavelengths. The polarization results more efficiently transmitted: the polarization unbalance in excitation is lower than , while in the detection it reaches up to . In Figure S2b, the longitudinal and transverse components of the focused field intensity are calculated by including a polarization unbalance factor of 0.7.
In few cases the preferential axis is not clearly defined, as in Figure 4(a-b). We think that in these cases a polarization unbalance in the excitation beam played a major role while summing up to the effect of the unequal - transmission. In fact, the quality of the doughnut beam, generated by the coupled effect of the LC device and the spatial filter, is very sensitive to alignment, and difficult to control while changing the Ti:Sa wavelength. Typical beam profiles, as the one shown in Figure 1b, present an axis of higher intensity.
Photoluminescence maps.— In order to perform photoluminescence (PL) measurements, the experimental setup has been complemented with an additional path enabling excitation at nm with radial and azimuthal polarization. The PL spectra and the maps obtained for the two polarization are shown in Figure S3. Both spatial distributions evidence the coupling of the in-plane components of the field with similarintensities and spectral profiles, confirming that the 532-nm excited PL is assisted by the transversal plasmonic resonance of the nanoparticle [5].
Additional data.— For completeness of the present work, additional figures are reported in this section.
In Figure S4 we show that the intensity maps do not change for different choices of the Stokes peak.
In order to have a more direct comparison between the calculated focused field distribution and the measured Raman maps, we superimposed them in Figure S5 while keeping the same scale.
Furthermore, we performed a wavelength sweep along the mode of the nanocube in Figure S6a for radial, azimuthal and two orthogonal linear polarizations.
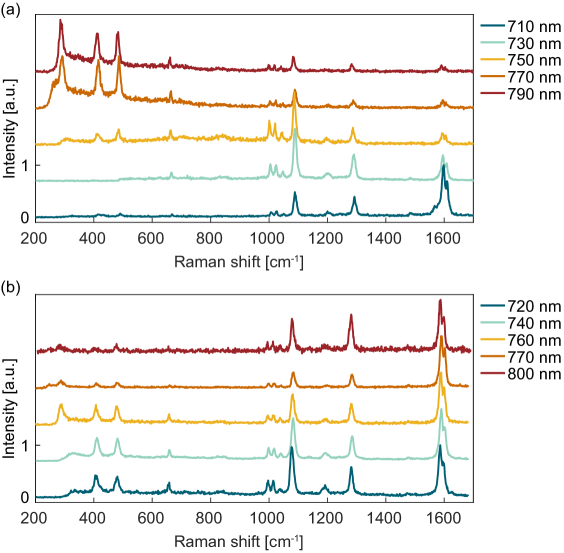
Finally, we evidence the effect of the plasmonic response on the spectra acquired from different nanocubes in Figure S7. The spectral response of the antenna shapes both the in-coupling and the out-coupling efficiencies. As a result, the relative enhancement of Raman peaks varies between spectra measured at different excitation wavelengths.
References
- Johnson and Christy [1972] P. B. Johnson and R. W. Christy, Optical Constants of the Noble Metals, Phys. Rev. B 6, 4370 (1972).
- Ahmed et al. [2021] A. Ahmed, K. Banjac, S. S. Verlekar, F. P. Cometto, M. Lingenfelder, and C. Galland, Structural Order of the Molecular Adlayer Impacts the Stability of Nanoparticle-on-Mirror Plasmonic Cavities, ACS Photonics 8, 1863 (2021).
- Chen et al. [2018] W. Chen, S. Zhang, Q. Deng, and H. Xu, Probing of sub-picometer vertical differential resolutions using cavity plasmons, Nat Commun 9, 801 (2018).
- Zuloaga and Nordlander [2011] J. Zuloaga and P. Nordlander, On the Energy Shift between Near-Field and Far-Field Peak Intensities in Localized Plasmon Systems, Nano Letters 11, 1280 (2011).
- Lumdee et al. [2014] C. Lumdee, B. Yun, and P. G. Kik, Gap-Plasmon Enhanced Gold Nanoparticle Photoluminescence, ACS Photonics 1, 1224 (2014).