Ultracold Feshbach molecules in an orbital optical lattice
Quantum gas systems provide a unique experimental platform to study a fundamental paradigm of quantum many-body physics: the crossover between Bose-Einstein condensed (BEC) molecular pairs and Bardeen Cooper Schrieffer (BCS) superfluidity. Some studies have considered quantum gas samples confined in optical lattices, however, focusing on the case, when only the lowest Bloch band is populated, such that orbital degrees of freedom are excluded. In this work, for the first time, ultracold Feshbach molecules of fermionic atoms are selectively prepared in the second Bloch band of an optical square lattice, covering a wide range of interaction strengths including the regime of unitarity. Binding energies and band relaxation dynamics are measured by means of a method resembling mass spectrometry. The longest lifetimes arise for strongly interacting Feshbach molecules at the onset of unitarity with values around ms for the lowest band and ms for the second band. In the case of strong confinement in a deep lattice potential, we observe bound dimers also for negative values of the -wave scattering length, extending previous findings for molecules in the lowest band. Our work prepares the stage for orbital BEC-BCS crossover physics.
The crossover between the regimes of BEC and BCS superfluidity is a hallmark of quantum gas physics Reg1:04 ; Reg2:04 ; Zwi:04 ; Bou:04 ; Bar:04 ; Ket:08 ; Zwe:12 ; Toe:15 . In most studies, the quantum gas sample is held in a nearly harmonic optical trapping potential. BEC-BCS crossover physics in optical lattices Lew:07 ; Gro:17 has been much less explored, and this research is limited to the lowest Bloch band, which exclusively provides local -orbitals. For example, in the ground state of a three-dimensional (3D) optical lattice, binding energies of strongly interacting fermionic potassium pairs have been studied Sto:06 . Signatures of coherence and superfluidity have been reported Chi:06 for strongly interacting fermionic lithium pairs. In an earlier work with fermionic potassium, prepared in the transverse ground state of an array of effectively one-dimensional wave guides Mor:05 , Feshbach dimers have been shown to exist even at negative scattering lengths owing to a confinement induced scattering resonance Ols:98 ; Ber:03 . Very recently, -wave interacting atomic pairs tightly confined in excited motional states of isolated microscopic traps have been investigated Ven:22 . Similarly, as orbital degrees of freedom in electronic condensed matter, e.g. in transition metal oxides Tok:00 ; Mae:04 , can give rise to unconventional order, the combination of the conventional BEC-BCS scenario with orbital physics in higher Bloch bands holds the intriguing perspective to discover unexplored fundamental many-body phases such as exotic forms of superfluidity Li:16 . Examples of chiral, nematic, or topological superfluids have been experimentally demonstrated for bosonic atoms in the second Bloch bands of square Wir:11 ; Koc:16 , triangular Wang:22 , or hexagonal Wang:21 optical lattices, respectively. Extending these scenarios to composite bosons composed of pairs of fermionic atoms would open up a new regime of unconventional BEC-BCS physics.
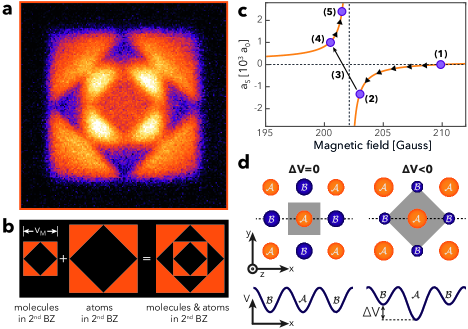
In a recent work Hac:21 , we have demonstrated spin-polarized non-interacting fermionic potassium atoms (40K) and weakly interacting spin-mixtures in higher Bloch bands of an optical square lattice. The present work investigates the vastly different regime of strong interactions between spin-up and spin-down fermions accessed by tuning a Feshbach resonance. This allows us to demonstrate and investigate bosonic Feshbach dimers Chi:10 , composed of fermionic 40K atoms, in higher Bloch bands of an optical square lattice. We study shallow and deep lattices, where the dimers can tunnel or are confined in one-dimensional channels. A method inspired by mass spectrometry is applied to discriminate atoms and dimers by separating them in a ballistic time-of-flight protocol (see Methods). This leads to images of the Brillouin zone (BZ) structures of atoms and molecules in velocity space, which differ in size by their mass ratio. This is seen in Fig. 1(a) for a mixture of molecules and atoms populating the second Bloch band. The molecules appear in the small - and the atoms in the large second BZ, forming a nested structure according to the sketch in Fig. 1(b). Hence, atoms and molecules can be separately counted. Using this method, we present measurements of binding energies, dissociation dynamics, and exceptionally long molecule lifetimes for a wide range of interaction strengths including the strongly correlated regime. Such long lifetimes exceeding all other relevant time scales are crucial, to study long-lived equilibrium states of the system.
Production of ultracold Feshbach molecules. In short, the production of Feshbach dimers in the second Bloch band of a square lattice proceeds as follows: A balanced fermionic spin mixture is produced in the lowest Bloch band of the lattice. Subsequently, spin-up and spin-down atoms are associated to form Feshbach dimers by rapid adiabatic tuning of the magnetic field across an -wave Feshbach resonance. Finally, a quench of the lattice potential selectively excites the dimers to the second Bloch band.
The following detailed protocol is applied. A non-interacting spin-polarized degenerate Fermi gas of 40K atoms in the state at a temperature of is prepared in an optical dipole trap (ODT), formed by two orthogonally intersecting laser beams with a wavelength of nm, where denotes the Fermi temperature. Note that for spin mixtures prepared at low magnetic fields, the lowest temperature reached in the ODT is . Next, a radio-frequency with a constant value of MHz is applied, while a homogeneous magnetic field (pointing along the -axis) is ramped up from zero to approximately G, such that a rapid adiabatic passage is obtained that inverts the sample to the state. Due to a Feshbach resonance located at G Reg1:04 , the -wave scattering length for contact interaction between the states and , approximated as
| (1) |
takes the value , which corresponds to position (1) in Fig. 1 (c). Here, is the background scattering length and G is the width of the Feshbach resonance. Subsequently, the sample is adiabatically loaded into the lowest Bloch band of a bipartite optical square lattice, formed by two mutually orthogonal standing waves with wavelengths nm, oriented perpendicularly to the -axis. The optical lattice is shaped in a Michelson-Sagnac interferometer that allows for precise control of the associated band structure (for details see Ref. Hac:21 ). The resulting optical potential is composed of two classes of independently tunable potential wells and arranged as the black and white squares of a chequerboard (see Fig. 1 (d)). In the -plane, the lattice potential can be approximated by
| (2) | ||||
with the wave number , the lattice depth parameter , and denoting the potential difference between the and wells. The experimental parameter can be tuned within the interval , i.e., . Note that tightly bound dimers with mass possess twice the polarizability and hence twice the value of as compared to atoms with mass . Henceforth, we indicate lattice depth parameter values for atoms and molecules as and , respectively. Along the direction, the atoms are held by the weak approximately harmonic confinement of the optical dipole trap, such that the lattice wells acquire a tubular shape. After lattice loading, we apply a radio frequency pulse during s to create a Fermi gas with equal populations in the states and at position (1) in Fig. 1(c). Next, by tuning to G (cf. position (2) in Fig. 1 (c)), the -wave scattering length for collisions between and is adjusted to a large negative value, in order to obtain efficient evaporative cooling of the atomic sample in presence of the lattice. Finally, the previously unpaired mixture of Fermions is converted into bosonic molecules by adiabatically sweeping the magnetic field across the Feshbach resonance from G to G (indicated as step (3) in Fig. 1(c)). For the lowest temperatures, upon arrival at position (4) in Fig. 1(c), we observe close to hundred percent conversion efficiencies with no discernible atomic fraction. Next, a quench from an initial value , used for loading the lowest band, to efficiently prepares a large fraction of the atoms or molecules in the second band (for details see Ref. Hac:21 ). By means of a final adiabatic change of (position (5) in Fig. 1 (c)), we may subsequently tune to a desired target value of , which lets us adjust the molecular binding energy.
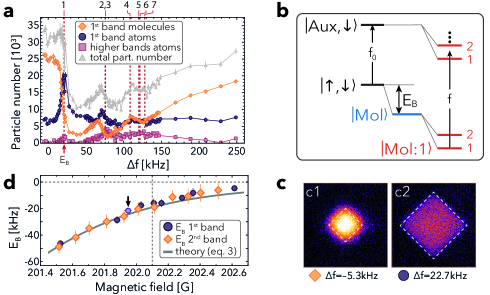
Binding energies Binding energy of Feshbach molecules are measured by dissociating them with a ms long radio frequency pulse, converting atoms into atoms in the auxiliary state . The unbound atoms, which remain trapped in the optical lattice, are readily discriminated from the molecules as explained in the context of Fig. 1 (a,b) and in Methods.
Let us first discuss the case of a deep optical lattice, such that tunnelling is practically suppressed for molecules and their motion is restricted to quasi one-dimensional (1D) tubes along the -direction. An example for this regime is realized by adjusting , and hence with denoting the single photon recoil energy for molecules. A typical example of a dissociation spectrum for molecules prepared in the lowest band is shown in Fig. 2(a) for G corresponding to the data point in (d) indicated by an arrow. We plot the numbers of molecules (diamonds) and atoms (disks) in the lowest band, the atoms in all excited bands (squares), and the total number of particles, i.e., atoms plus molecules (triangles), against , i.e., the applied radio frequency minus the transition frequency (see Fig. 2(b)). The latter depends only on and is readily measured after preparing a pure sample in the dipole trap. Hence, corresponds to zero molecular binding energy.
To understand the spectral features in Fig. 2(a), it is helpful to first look at the atomic and molecular levels sketched in Fig. 2(b). The black horizontal bars show the energies of the bare two-atom states and separated by the frequency . The blue horizontal bar shows the energy of the Feshbach molecules made of atom pairs , shifted by the binding energy . The red horizontal bars show the additional energy shifts for the Bloch bands due to the presence of the optical lattice. The molecules are prepared in the lowest molecular band, denoted in Fig. 2(b). As the radio frequency is increased, we expect the first drop of the molecular population in , when reaches the resonance frequency for the transition such that unbound atoms in the first Bloch band are produced. According to Fig. 2(a), this occurs at kHz, which is identified with the value of the binding energy . To further illustrate the conversion of molecules into atoms, mass spectrometry images are shown in Fig. 2(c) for kHz, well below (c1), and at (c2). In fact, in (c1), predominantly molecules in the first BZ are seen, while in (c2) most molecules are dissociated into atoms, giving rise to a first BZ expanded by a factor two.
At larger values of , further resonances occur, leading to reduced molecule numbers due to dissociation into higher bands with . The respective resonance frequencies are readily calculated by a band structure calculation and are plotted into Fig. 2(a) as vertical dashed red lines. Note that, for the fourth band , no resonance arises, which can be explained by the small Franck-Condon overlap between the wave function of and . This has been checked by calculating the respective Bloch functions, with the result that predominantly resides in the deep wells and in the shallow wells.
Dissociation spectra as in Fig. 2(a) let us determine the binding energies for molecules prepared in the first (dark purple disks) and second (orange diamonds) bands, shown in Fig. 2(d). The gray solid line shows a calculation using the implicit equation
| (3) |
adapted from Ref. Ber:03 for a single 1D tubular potential, where denotes the Hurwitz zeta function. We insert the radial fundamental frequency , measured in the radially symmetric quasi 1D tubes of our lattice, and the associated harmonic oscillator length for the relative atomic motion with denoting the reduced atomic mass. We multiply by with a small positive , to account for the anharmonicity of the tube potential. The free space -wave scattering length is expressed as a function of the magnetic field according to Eq. 1. Finally, following Ref. Gri:93 , to account for a realistic van der Waals scattering potential , we introduce the finite range parameter , and replace by . From Refs. Tic:04 ; Fal:08 we take and . Note that Eq. 3 is configured such that for zero interaction, zero binding energy is obtained. This theoretical model, based on Refs. Gri:93 ; Ols:98 ; Ber:03 , reproduces the binding energies in Fig. 2(d) remarkably well if one sets , which reasonably well agrees with the expected anharmonicity. The model accounts for effects of reduced dimensionality arising if the degree of radial confinement becomes comparable with , giving rise to a confinement induced resonance of the effective 1D scattering cross section. As a consequence, bound states become possible for negative values of as is seen in Fig. 2(d). This has been previously reported for potassium Feshbach molecules in the lowest transverse state of an array of isolated 1D optical traps in Ref. Mor:05 . Note that Fig. 2(d) shows equal binding energies for molecules prepared in the first and second bands. This results from engineering the lattice potentials via adjustment of and , such that the lattice wells with predominant population, i.e., the deep wells, if the molecules are prepared in the first and the shallow wells if prepared in the second band, respectively, exhibit equal values of and . For example, with and for molecules in the first band, and and for molecules in the second band, as used in Fig. 2(d), kHz is obtained.
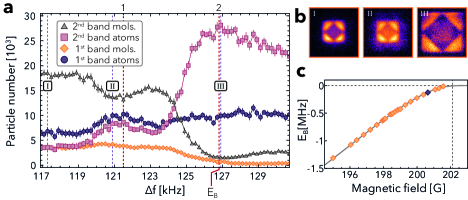
Next, we discuss molecules prepared in the second band () for a shallow lattice with , and hence for an extended range of the magnetic field below the Feshbach resonance, . In Fig. 3(a), we show a dissociation spectrum for molecules at G corresponding to the dark purple diamond-shaped data point in (c). The plot in (a) shows the second band molecules (grey triangles), whose number is initially maximized, second band atoms (magenta squares), and molecules (orange diamonds) and atoms (dark purple disks) in the first band. The red dashed lines emphasize the frequencies and , where local minima in the number of molecules in the second band are found, due to maximal efficiency of the dissociation process. At frequencies dissociation is not resonant such that in mass spectrometry images one observes the second BZ filled with molecules, as exemplified in the panel (I) of Fig. 3(b), recorded at position (I) in (a). At the left red dashed line (), dissociation arises due to a transition, mainly exciting second band molecules to atomic pairs in the first band. This is confirmed by the mass spectrometry image in panel (II) in (b), recorded at position (II) in (a), close to the left red dashed line. Here, a partial filling of the first BZ with atoms is observed. The dissociation process shows limited efficiency due to the small Franck Condon overlap between the wave functions involved, similarly as discussed in the context of Fig. 2(a) for the transition . Around the second red dashed line (), the dissociation transition couples to . Both states belong to second bands with a sizable Franck Condon overlap, such that the dissociation around is notably more efficient than for , as seen by the nearly complete depletion of the molecule population in (a) around kHz. Panel (III) in Fig. 3(b) confirms that the dissociated atoms in fact arise in the second band, giving rise to a filled second BZ for atoms, twofold increased as compared to the second BZ for molecules in panel (I). Note that is approximately given by the separation of the second and first bands for atoms. A determination of below the scale of a few kHz is not supported by the width of the spectral features observed near the red dashed lines in Fig. 3(a). In Fig. 3(c), binding energies for molecules in the second band are shown, measured by analyzing dissociation spectra as in (a) for different magnetic fields. The grey solid line represents the theoretical prediction according to Eq. 3, showing remarkable agreement.
Molecular decay dynamics. In this section we discuss the observation of two relaxation channels for Feshbach dimers Shi:11 . The first process dominates for ( Fermi momentum), i.e., for relatively weak scattering lengths, where Feshbach dimers become deeply bound. In this regime, the primary relaxation process is based on inelastic dimer-dimer collisions, where one molecule gains binding energy, while the other is dissociated, such that both molecules are lost. Dimer-atom collisions are less relevant since our experiments start with a nearly pure molecule sample. Larger binding energies provide larger Franck-Condon overlap between the involved molecular wave functions, so that the molecular lifetime should decrease with , in accordance with the scaling predicted in absence of a lattice Pet:05 . In the other extreme for , according to Ref. Pet:05 , the elastic dimer-dimer scattering length scales as and hence due to the large size of , molecular three-body collisions are expected to introduce molecule loss and to give rise to a lifetime that decreases, when approaches zero.
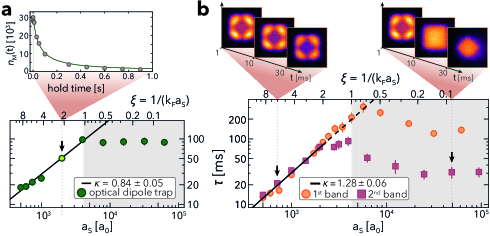
In Fig. 4(a), we benchmark the lifetimes of the Feshbach molecules trapped in the approximately harmonic optical dipole trap. After the dimers are formed (Fig. 1(c)), the scattering length is adjusted to a desired value via the magnetic field according to Eq. 1 and the dimers are held for a variable time in the trap. In order to count the remaining number of molecules , the magnetic field is rapidly tuned to G, associated with a moderate value of and the molecules are allowed to ballistically expand (nearly unimpaired by interaction) during ms, before an absorption image of the atoms is recorded. The dimer population plotted against the hold time is fitted with the two-body decay model , with the solution , the initial number of molecules , and the half-time of the molecule sample . An exponential fit, assuming density independent loss, or a three-body decay model fail to describe the data. The obtained half-time is plotted in Fig. 4(a) versus and . The inset shows an exemplary measurement of and leading to the light green data point indicated by a black arrow. The main panel shows strikingly different behaviour in the unitarity regime , where a nearly constant half-time around ms is observed, and in the regime , where the data are well fitted with a straight line, indicating a power law with an exponent . The largest values of are found at . Note that, does not agree with the prediction for dimer-dimer collisions in Ref. Pet:05 or the experimental value for mixed dimer-dimer and dimer-atom collisions, reported in Ref. Reg2:04 .
In Fig. 4(b), an analogous analysis is carried out in presence of a shallow optical lattice with , which permits nearest-neighbour tunneling on a sub-millisecond time scale. The orange disks show the observed half-lives for molecules prepared in the first Bloch band with and hence . The magenta squares correspond to (i.e., ) for molecules prepared in the second Bloch band. In the regime , both data sets show the same dependence on and are fitted with the same straight line (black solid line in (b)), indicating a power law model with . The dashed black line is a continuation into the domain. Note that also in the presence of a lattice, does not agree with the prediction in Ref. Pet:05 or the experimental value from Ref. Reg2:04 , both obtained for a scenario without a lattice. For , we find that grows with increasing . While the data for the second band very well agree with the results for the first band in the entire range , for a dramatic decrease of is observed for the second band, which only rises up to a threefold shorter lifetime than observed for the first band. This indicates that an additional relaxation channel opens for the second band if . In fact, as illustrated in the two insets at the upper edge of Fig. 4(b), for close to zero, e.g. for , we see an initial pronounced decay of molecules into the first band, followed by a subsequent decay of the first band population, while in the domain , e.g., close to , the molecules do not initially transit to the first band during relaxation. This may be explained as follows: For small , i.e., large , in the second band, the increasing elastic binary collision cross section can lead to a redistribution of energy from the lattice plane into the tube direction, which gives rise to an additional escape channel from the lattice. A similar relaxation channel for weakly interacting bosonic atoms has been recently reported in Ref. Nus:20 . Also effects of reduced dimensionality in the tubular lattice sites are expected to be larger in the first than in the second band, which may also contribute to explain the longer lifetimes of first band dimers Ven:22 .
In summary, our work demonstrates strongly correlated ultracold Feshbach dimers prepared in higher Bloch bands of an optical lattice, which give rise to orbital physics. Using a method reminiscent of mass spectrometry, we find surprisingly long molecular lifetimes in the unitarity regime on the order of hundred milliseconds and study binding energies and dissociation and relaxation dynamics. Our work prepares the stage for future studies of BEC-BCS cross over physics with orbital degrees of freedom.
Methods
Mass spectrometry protocol
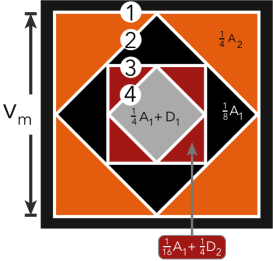
In order to uniquely distinguish and selectively count the populations of atoms and Feshbach dimers in presence of an optical lattice, they are separated in a ballistic time-of-flight protocol, which maps the population of the -th band to the -th Brillouin zone (BZ). This protocol consists of a rapid adiabatic termination of the lattice potential (in ms) followed by a ballistic expansion (in ms). During the second half of the expansion the magnetic field is tuned to G in order to enable absorption imaging at the same resonant frequency in each experimental run. For the case that the dimer mass is twice that of an atom , atoms travel twice as fast compared to homonuclear dimers with the same initial momentum. Hence, this protocol arranges the atoms and molecules in velocity space with a BZ structure scaled up by a factor two for atoms as compared to dimers. This is sketched in Fig. 5. The figure shows the first and second BZs for atoms in the background (black and orange areas) and for molecules in the foreground (grey and red areas), giving rise to a nested structure of four white squares denoted 1-4. The optical densities integrated across the areas enclosed by these squares are denoted as . We denote the total populations as and for atoms and molecules in the band with band index , respectively. If sectors in Fig. 5 comprise atoms and dimers, the counting protocol requires the assumption that the first band for atoms is uniformly filled. This assumption is reasonable since, in the experiments described in the main text, we typically start with the lowest band filled with fermionic atoms, form Feshbach dimers, and subsequently excite a fraction of them to the second band without changing their quasi-momenta Hac:21 . Note that due to the bosonic nature of the Feshbach dimers, the respective Brillouin zones (red and grey areas in Fig. 5) are not necessarily filled homogeneously, since Bose-enhancement and hence multiple occupancy of available energy states are possible. Under the condition of a homogeneous filling of the first atomic band, the populations in different sectors of Fig. 5 are indicated in the figure accounting for the four-fold rotation symmetry of the BZs and the four times larger BZ areas for atoms. This leads to the following relations: , , , and . If all atoms and molecules reside in the second Band, i.e. , the simple case and arises, in which case the condition of uniform filling is not required.
Acknowledgments
We thank Raphael Eichberger for help in the early stage of the experiment. We acknowledge support from the Deutsche Forschungsgemeinschaft (DFG) through the collaborative research center SFB 925 (Project No. 170620586, C1). M.H. was partially supported by the Cluster of Excellence CUI: Advanced Imaging of Matter of the Deutsche Forschungsgemeinschaft (DFG) - EXC 2056 - project ID 390715994.
References
References
- (1) Regal, C. A., Greiner, M. & Jin, D. S. Observation of resonance condensation of fermionic atom pairs, Phys. Rev. Lett. 92, 040403 (2004).
- (2) Regal, C. A., Greiner, M. & Jin, D. S. Lifetime of molecule-atom mixtures near a Feshbach resonance in 40K, Phys. Rev. Lett. 92, 083201 (2004).
- (3) Zwierlein, M. W., Stan, C. A., Schunck, C. H., Raupach, S. M. F., Kerman, A. J. & Ketterle, W. Condensation of pairs of fermionic atoms near a Feshbach Resonance, Phys. Rev. Lett. 92, 120403 (2004).
- (4) Bourdel, T., Khaykovich, L., Cubizolles, J., Zhang, J., Chevy, F., Teichmann, M., Tarruell, L., Kokkelmans, S. J. J. M. F. & Salomon, C. Experimental study of the BEC-BCS crossover region in 6Lithium, Phys. Rev. Lett. 93, 050401 (2004).
- (5) Bartenstein, M., Altmeyer, A., Riedl, S., Jochim, S., Chin, C., Hecker Denschlag, J. & Grimm, R. Crossover from a molecular Bose-Einstein condensate to a degenerate Fermi gas, Phys. Rev. Lett. 92, 120401 (2004).
- (6) Ketterle, W. & Zwierlein, M. W. Making, probing and understanding ultracold Fermi gases , Rivista del Nuovo Cimento 31, p.247-422 (2008).
- (7) Zwerger, W., ed., The BCS-BEC crossover and the unitary Fermi gas, Springer-Verlag Berlin, Heidelberg (2012).
- (8) Törmä, P. & Sengstock, K., eds., Quantum gas experiments, exploring many-body states , Imperial College Press London (2015).
- (9) Lewenstein, M., Sanpera, A., Ahufinger, V., Damski, B., Sen(De), A. & Sen, U. Ultracold atomic gases in optical lattices: mimicking condensed matter physics and beyond, Adv. Phys. 56, p.243-379 (2007).
- (10) Gross, C. & Bloch, I. Quantum simulations with ultracold atoms in optical lattices, Science 357, 995 (2017).
- (11) Stöferle, T., Moritz, H., Günter, K., Köhl, M. & Esslinger, T. Molecules of fermionic atoms in an optical lattice, Phys. Rev. Lett. 96, 030401 (2006).
- (12) Chin, J. K., Miller, D. E., Liu, Y., Stan, C., Setiawan, W., Sanner, C., Xu, K. & Ketterle, W. Evidence for superfluidity of ultracold Fermions in an optical lattice, Nature 443, 961 (2006).
- (13) Moritz, H., Stöferle, T., Günter, K., Köhl, M. & Esslinger, T. Confinement-induced molecules in a 1D Fermi gas, Phys. Rev. Lett. 94, 210401 (2005).
- (14) Olshanii, M. Atomic scattering in the presence of an external confinement and a gas of impenetrable Bosons, Phys. Rev. Lett. 81, 938 (1998).
- (15) Bergeman, T., Moore, M. G. & Olshanii, M. Atom-atom scattering under cylindrical harmonic confinement: numerical and analytic studies of the confinement-induced resonance, Phys. Rev. Lett. 91, 163201 (2003).
- (16) Venu, V., Xu, P., Mamaev, M., Corapi, F., Bilitewski, T., D’Incao, J. P., Fujiwara, C. J., Rey, A. M. & Thywissen, J. H. Observation of unitary -wave interactions between fermions in an optical lattice, Nature 613, 262-267 (2023).
- (17) Tokura, Y. & Nagaosa, N. Orbital physics in transition-metal oxides, Science 288, pp.462-468 (2000).
- (18) Maekawa, S., Tohyama, T., Barnes, S. E., Ishihara, S., Koshibae, W. & Khaliullin, G. Physics of transition metal oxides, Springer Series in Solid-State Sciences Vol. 144, Springer (2004).
- (19) Li, X. & Liu, W. V. Physics of higher orbital bands in optical lattices: a Review, Rep. Prog. Phys. 79, 116401 (2016).
- (20) Wirth, G., Ölschläger, M. & Hemmerich, A. Evidence for orbital superfluidity in the P-band of a bipartite optical square lattice, Nat. Phys. 7, 147-153 (2011).
- (21) Kock, T., Hippler, C., Ewerbeck, A. & Hemmerich, A. Orbital optical lattices with bosons, J. Phys. B: At. Mol. Opt. Phys. 49, 042001 (2016).
- (22) Wang, X.-Q., Luo, G.-Q., Liu, J.-Y., Huang, G.-H., Li, Z.-X., Wu, C., Hemmerich, A. & Xu, Z.-F. Observation of nematic orbital superfluidity in a triangular optical lattice, arXiv:2211.05578 (2022).
- (23) Wang, X.-Q., Luo, G.-Q., Liu, J.-Y., Liu, W. V., Hemmerich, A. & Xu, Z.-F. Evidence for an atomic chiral superfluid with topological excitations, Nature. 596, 227-231 (2021).
- (24) Hachmann, M., Kiefer, Y. H., Riebesehl, J., Eichberger, R. & Hemmerich, A. Quantum degenerate Fermi gas in an orbital optical lattice, Phys. Rev. Lett. 127, 21, 033201 (2021).
- (25) Chin, C., Grimm, R., Julienne, P. & Tiesinga, E. Feshbach resonances in ultracold gases, Rev. of Mod. Phys. 82, 1225 (2010).
- (26) Gribakin, G. F. & Flambaum, V. V. Calculation of the scattering length in atomic collisions using the semiclassical approximation, Phys. Rev. A 48, 546 (1993).
- (27) Ticknor, C., Regal, C. A., Jin, D.S. & Bohn, J. L. Multiplet structure of Feshbach resonances in nonzero partial waves, Phys. Rev. A 69, 042712 (2004).
- (28) Falke, S., Knöckel, H., Friebe, J., Riedmann, M., Tiemann, E. & Lisdat, Ch. Potassium ground-state scattering parameters and Born-Oppenheimer potentials from molecular spectroscopy, Phys. Rev. A 78, 012503 (12008).
- (29) Zhang, S. & Ho, T.-L. Atom loss maximum in ultracold Fermi gases, New J. of Phys. 13 055003 (2011).
- (30) Petrov, D. S., Salomon, C. & Shlyapnikov, G. V. Diatomic molecules in ultracold Fermi gases - novel composite bosons, J. Phys. B: At. Mol. Opt. Phys. 38, pp.645-660 (2005).
- (31) Nuske, M., Vargas, J., Hachmann, M., Eichberger, R., Mathey, L. & Hemmerich, A. Metastable order protected by destructive many-body interference, Phys. Rev. Res. 2, 043210 (2020).