Local barriers control relaxation near the glass transition up to millisecond time scales
Abstract
Which phenomenon slows down the dynamics in super-cooled liquids and turns them into glasses is a long-standing question of condensed-matter. Most popular theories posit that the dynamics becomes cooperative as the temperature decreases: many events must occur in a coordinated fashion on a growing length scale for relaxation to occur. Instead, other approaches consider that local barriers associated with the elementary rearrangement of a few particles or ‘excitations’ govern the dynamics. Here, we introduce a new algorithm, SEER, to resolve this conundrum. SEER can systematically extract hundreds of excitations and their energy from any given configuration. Remarkably, we find that the excitation density of states is essentially shifted to higher energy under cooling. This observation directly predicts how local barriers slow down the dynamics. We compare this prediction with the observed dynamics in liquids that can be equilibrated by swap algorithms up to millisecond time scales. The agreement is quantitative, revealing that cooperative effects are not controlling the fragility of the liquid, and suggesting new perspectives on the glass transition.
I Introduction
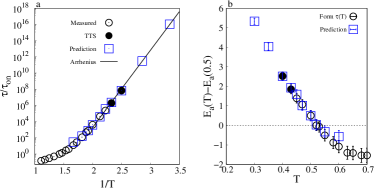
Although glass making appeared four thousand years ago [1], and was already used to make windows in Roman times [2], the physical process preventing glasses from flowing remains an enduring mystery [3, 4]. As a liquid is cooled, the relaxation time below which it acts as a solid continuously grows from picoseconds at high temperatures up to minutes at the glass transition temperature . In liquids called strong such as silica [5], follows an Arrhenius law , where is some microscopic time scale, the activation energy is constant and is the temperature, in units where the Boltzmann constant is unity. By contrast, in liquids called fragile, can increase by up to several folds as decreases. In both cases, as the dynamics slows down it also becomes correlated on a growing length scale [6, 7]. These phenomena, challenging to explain, occur while the static structure of the material displays limited changes under cooling.
This work focuses on the mechanism inducing the growth of the activation energy in liquids, which is the central problem of the glass transition. For our purpose, it is useful to classify theories into two groups. In most popular approaches, activation is cooperative: the activation energy increase stems from the growth of a correlation length , as sketched in Fig. 1b. In some views, including Adam-Gibbs and Random First Order Theory [8, 9, 10], characterizes a growing order associated with a thermodynamic phase transition. Breaking this order costs an energy where is some exponent. Kinetic constraints model (KCMs) [11, 12] are other theories for which thermodynamics properties are instead trivial. Popular KCMs consider independent defects that cost an energy , whose density decreases as under cooling, leading to a growing distance between defects . For certain rules on the kinetic of defects, including the popular ‘East model’ [13], grows with and becomes much larger than the cost of moving a single defect.
By contrast, free volume [14] or elastic [15, 16, 17] models assume that the activation energy is not cooperative as sketched in Fig. 1b: it is governed by the energy barrier of elementary rearrangements, independently of . In elastic models is controlled by the high-frequency shear modulus indeed known to grow in fragile liquids [15] or alternatively by a local elastic modulus [16, 17]. These views are consistent with the observation that thermal relaxation occurs more often in softer [18] or more plastic regions [19, 20]. Obviously, the activation energy may also have a contribution from localized events and one associated with cooperative dynamics. In some scenarios, cooperative effects become dominant at low temperatures [21].
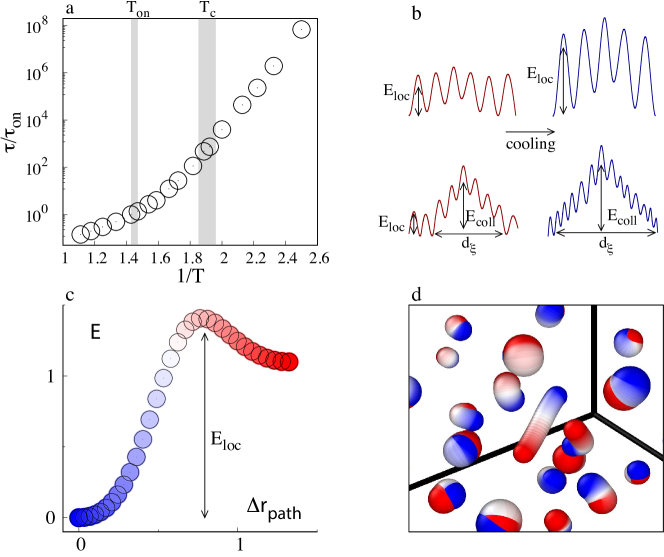
Even though local and cooperative theories are based on differing physical assumptions, they both find empirical support through observed correlations between the quantities they relate. Henceforth, our contention is that to distinguish these views, one must go beyond correlations and systematically measure the energy barrier of the localized activation events driving structural relaxation, illustrated in Fig. 1c and d.
Previous numerical studies related the relaxation dynamics to the exploration of the potential energy landscape . At low temperatures, this exploration proceeds via consecutive activated transitions, or excitations, through which the system transits from a minimum of , called inherent structures (IS), to an adjacent one. Earlier works [23, 24] focused on rather high temperatures and clarified that irreversibility occurs through a sequence of elementary excitations, also evidenced experimentally [25, 26, 27], corresponding to a displacement of a temperature-independent number of particles. Other studies considered the few lowest-energy excitations at lower temperatures to investigate the plastic and quantum properties of glassy solids [28, 29, 30, 31, 32]. Such low-energy excitations are well-known to be already active at temperatures much smaller than the glass transition. They thus cannot by themselves relax the material into a liquid. Overall, in the absence of a comprehensive description of how the distribution of energy barriers of localized relaxation events depends on temperature, it is hard to establish if the gradual increase in these energy barriers drives the formation of glasses, as suggested by local theories, or conversely, if the dynamics’ slowdown results from the increasing spatial organization of these events, as posited by cooperative theories.
In this work, we introduce SEER, an algorithm to systematically uncover high-energy excitations in numerical glasses. SEER allows us to measure the distribution of local energy barriers at various temperatures, around a given configuration. We use it in a system of continuously polydisperse particles. Such systems are known to reproduce the main facts of the glass transition, and can be efficiently thermalized [33], allowing us to explore a wide range of time scales. A remarkable result is that is essentially shifted to higher energy under cooling. This shift corresponds to an increase in local barriers, which must contribute to the rise in activation energy , alongside potential cooperative effects. Remarkably, our observations show that the increase in activation energy resulting from these local barriers accurately and fully accounts for the growth of the relaxation time over seven orders of magnitude. Thus local effects, rather than cooperative ones, control the dynamics near the glass transition.
II SEER: Systematic Excitation ExtRaction
We seek to uncover the excitations around a given inherent structure, which is a minimum of obtained by quenching an equilibrated configuration, determining the number of excitations with activation energy , . A standard method [23, 34, 35] to uncover excitations consists in performing a small temperature cycle of duration at a temperature before descending again the energy, possibly toward a new minimum. and are chosen so that typically none or a single excitation is triggered. In cases where a few excitations are triggered simultaneously, algorithms were developed to disentangle them if they are spatially separated [32], which we systematically use below. Unfortunately, such a method detects a given excitation with a probability : the first few lowest-energy excitations are found extremely often, already at low . At such temperatures, higher energy ones are essentially never obtained.
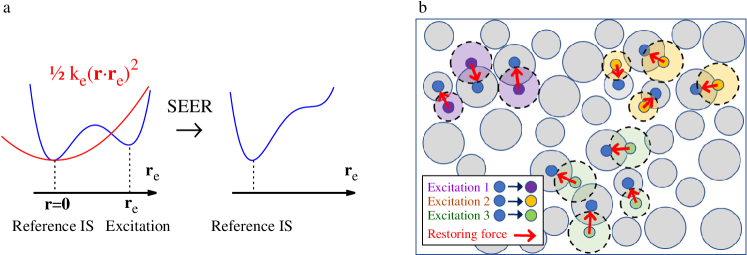
To overcome this limitation and access higher-energy excitation, we have developed a novel algorithm, SEER, whose detailed implementation is specified in Appendix C. To access high-energy excitations, SEER modifies the energy functional once an excitation is found. This modification is the minimal one that ensures that this excitation cannot be triggered again. It allows us to slowly increase the next cycling temperature , so as to discover sequentially higher energy excitations starting from the same configuration.
Specifically, consider an inherent structure . To lighten notations, we consider as specifying the reference position for all particles, such that denotes the displacement field from that configuration. Once we discover an excitation via a temperature cycle as discussed above, i.e. a new minimum of the potential energy, we modify the energy landscape along a single direction in phase space. Specifically, we add a term to the Hamiltonian, which penalizes motion in the direction of the discovered excitation. We fix to the minimum value ensuring that has not a minimum near , as illustrated in Fig. 2a,b. We repeat this procedure for each discovered excitation, such that future thermal cycles search excitations of the SEER energy:
| (1) |
where is the number of excitations already in our catalogue. We add to our catalogue the excitations of that are also excitations of , and stop the run when reaches a prescribed value. We discuss the stability of SEER with respect to its control parameters in Appendix E.
Once an excitation is detected, we use the nudge-elastic-band (NEB) method [36] to determine the minimal energy path connecting the two inherent structures, as illustrated in Fig. 1c,d. Obviously, this procedure is performed using the real energy , in the absence of added potential. It yields both the barrier height and the number of intermediate maxima.
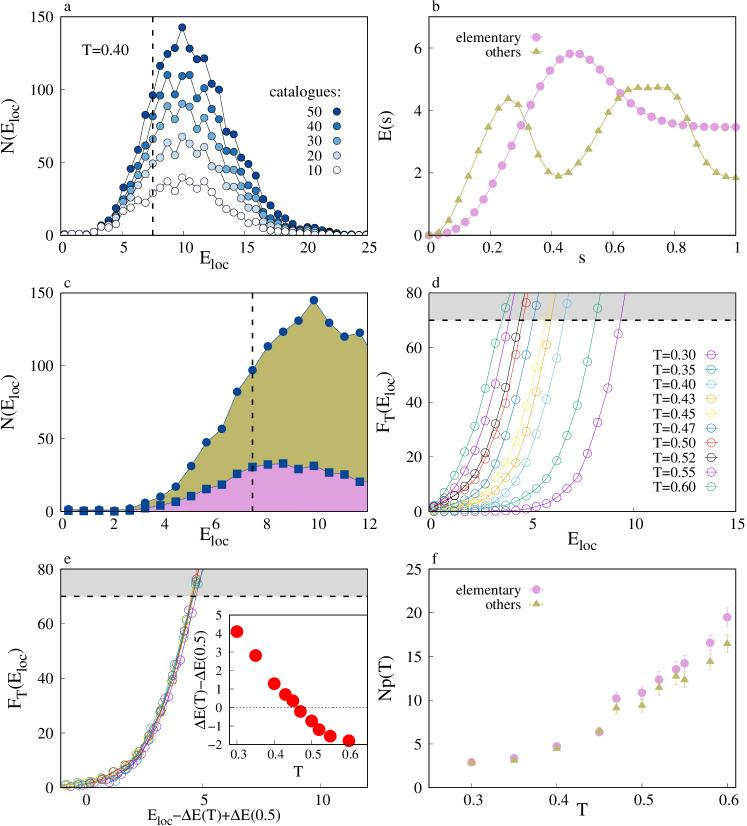
In principle, SEER’s modification to the Hamiltonian may hinder the discovery of new excitations in the vicinity of previously discovered ones. SEER alleviates this effect by choosing a minimal perturbation to the energy. More importantly, in a given run of SEER the order of apparition of excitations is stochastic. To estimate the number of excitations more accurately, we perform many runs, each delivering a catalogue of excitations. We then merge these into a more complete library, as detailed in Appendix D. By definition, counts the excitations obtained when the number of merged catalogues diverges. Practically, converges below some that depends on the number of merged catalogues. Below, we consider 50 catalogues. It will correspond to a number of excitations of the order of a hundred below , implying that SEERS only constraints a tiny fraction of the degrees of freedom, .
III Choice of Model
We consider the three-dimensional soft repulsive particles of Ref. [22]. This system belongs to the class of modern numerical models whose polydispersity allows us to use the efficient ‘swap’ algorithm [37, 38, 39, 40] to reach thermal equilibrium on a range of temperatures comparable to experiments. Such models are receiving a considerable attention [33, 41, 42, 43, 44, 45, 46, 47], as they capture the hallmarks of the glass transition. The size of the particles is distributed as with . Similar systems capture both the usual dynamical [39] and thermodynamical [48] properties of experimental liquids. The interaction is given by the purely repulsive potential
| (2) |
for and vanishes at larger distances, with chosen to enforce continuity at up to derivatives, and with an interaction range function of and . We study systems of particles of mass at number density in cubic simulation boxes with periodic boundary conditions. We express mass in units of , temperature in units of , lengths in units , and time in units of .
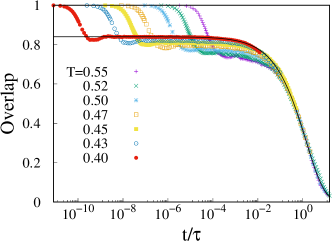
We then investigate the relaxation dynamics of equilibrium configurations via molecular dynamics simulations (MD), as detailed in Appendix. We extract the relaxation time from the decay of the overlap function
| (3) |
where is the displacement of particle during a time interval , and . We define the relaxation time as .
Using MD from equilibrated configurations, we can access the dynamics on about 6 decades. However, previous studies [43, 44] have found in related models that the shape of the correlation function does not significantly depend on the temperature [49], a property referred to as time-temperature superposition (TTS) [50]. We have verified in Appendix F that this property holds in our model and use it to infer even when the correlation function does not fully decay in our observation window, leading to the nine decades of observation of Fig.1a. As has been reported in other highly-polydisperse [51], in more conventional model systems [52] or in experimental data [53], the model seems to display Arrhenius-like behavior (corresponding to straight lines in the logarithmic representation of Fig.1a) above the onset temperature as well as at the lowest temperatures, with a super-Arrhenius behavior in between. Our analysis below (using reheating methods) will show that the activation energy is, in fact, not constant in any of the temperatures probed.
IV Results of SEER
IV.1 Temperature shifts the excitation density of state
Fig. 3a illustrates for extracted from SEER, as a function of the number of catalogs used to build the library. After 50 runs approximately converges below some energy . We uncover about 200 excitations with (dashed line). Many of these excitations have a single energy maximum along their reaction path, as illustrated in Fig. 3b. The density of such single excitations is compared with the total density in Fig. 3c. Considering all or only single excitations lead to similar results, in what follows we focus on the latter.
To study the temperature dependence of excitations, we consider the cumulative number of elementary excitations in Fig. 3d. The figure reveals a depletion of low-energy excitations under cooling. Our key observation, illustrated in Fig. 3e, is that different curves approximately collapse by simply shifting the energy by some value . We show the temperature dependence for the energy shift in the inset of Fig. 3e. The energy shift approaches a constant at temperatures close to the crossover one. It is consistent with the usual notion that above the crossover temperature , the properties of the inherent structures become temperature independent. As the temperature decreases, develops an approximate linear temperature dependence.
Thus, the density of excitations evolves under cooling as if all excitations were increasing their energy by some amount . Making the assumption that the activation energy is controlled by local barriers then implies that it must also shift by under cooling. In other words, for at low temperatures we must have:
| (4) |
This is our main prediction, which we can test below without fitting parameters.
IV.2 Excitations become more localized under cooling
To show that individual excitations themselves do not become more and more cooperative under cooling, we estimate the number of particles they involve from their participation ratio. This number is , where and the exitation displacement field. Fig. 3f illustrates the temperature dependence of averaged over all excitations below the energy convergence threshold. Excitations involve a few particles and become increasingly localized at low temperatures.
The small number of particles involved in each excitation suggests that the properties of the latter do not depend on the system size. Indeed, previous studies [24] demonstrated that the statistical features of the energy landscape of very small systems () already represent the thermodynamic limit.
V Local barriers control relaxation
The prediction Eq. 4 can be written alternatively as , which implies for the relaxation time grows:
| (5) |
In this expression, two parameters enter, and . The latter can be readily removed to test our hypothesis by considering the change of activation energy with temperature as in Eq. 4. Yet, this quantity is interesting to estimate. The microscopic time depends on a diversity of factors, including the entropy of individual barriers [54], and no formal expression for it is available for the under-damped dynamics we use. It could depend on temperature. Yet if the change of dynamics is dominated by the energy change of local barriers, the evolution of can be neglected. Below we test such a model, where is fixed.
There is no established procedure to measure the activation energy and . Previous works, see e.g. [55], focused on the apparent activation energy . Unfortunately, it overestimates the actual activation energy unless the latter is constant [56]. Regarding this point, note that while an Arrhenius-like behavior is often observed at low temperatures, it does not indicate a constant activation energy as often assumed, but rather an activation energy that depends linearly on temperature. The apparent activation energy cannot distinguish these two scenarios.
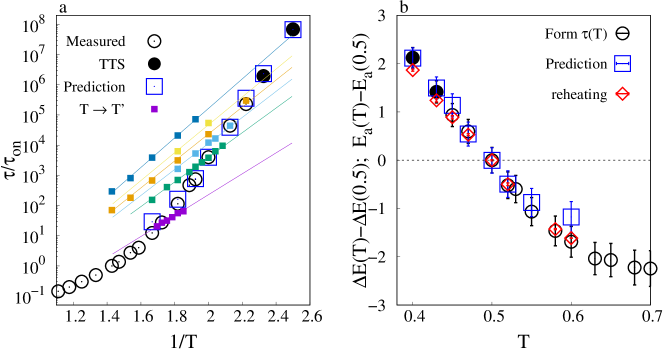
We overcome these difficulties by introducing a novel empirical approach to determine and . We consider equilibrated configurations at some temperature and suddenly change the temperature to some value . If and do not greatly differ 111If is significantly larger than , relaxation can occur via the nucleation of a hot liquid phase invading the material [49, 79], we expect the instantaneous relaxation time to follow an Arrhenius behavior in with a constant activation energy : . Fig. 4a tests this expression successfully as both and are varied. has no clear temperature dependence, and all curves are well-fitted by a single value. From these measurements, we extract .
From these results, the hypothesis that the change of the activation energy under cooling is governed by the change of local barriers energy, formalized by Eq. 4, can now be tested. Fig. 4b compares these two changes, respectively and , taking as a reference temperature. Remarkably, the agreement is quantitative. Equivalently stated, this result implies that knowing the relaxation time at some intermediate temperature, e.g. , we can predict the dynamics at lower temperatures and thus the fragility of the system, as illustrated in Fig. 4a.
These results do not imply that jumping over a single barrier is generally sufficient to relax the system into a new state of similar energy. Excitations tend to be in their lower-energy state, thus performing a single jump most often increases energy, and can be followed by the reverse jump. Denote by the number of local barriers that must act sequentially in the same location to form an irreversible event, i.e. to find a new state of energy similar to the original one. characterizes the cooperativity of the dynamics. In theories such as RFOT or the East model, the growth of the activation energy under cooling is due to a growth of cooperativity . Such an effect would contribute to the activation energy, in addition of the individual growth of local barriers we computed. This contribution is undetectable, thus the dependence on temperature can be neglected.
VI Conclusion
We have introduced SEER, a novel method to analyze the energy landscape of glasses, which systematically measures the elementary rearrangements around any given energy minimum. Our central result is that the density of state of these excitations is shifted toward higher energy under cooling. Using a novel method based on rapid temperature changes to analyze the dynamics and extract the activation energy, we showed that this shift precisely predicts the liquid slowing down. This finding reveals that up to milliseconds time scales for which such liquids can be simulated, fragility is controlled by the change of energy of individual excitations, which shrink in size under cooling. It is not due to the fact that the dynamics becomes more and more cooperative, as is often proposed.
At the practical level, the reheating methodology we introduced as well as SEER have potential to be of broad applicability. Concerning the former, developing sufficiently fast experimental temperature jumps [58] would be of high interest to measure directly the activation energy in super-cooled liquids. Concerning SEER, it is more directly usable in numerical models where the energy landscape of inherent structures is indicative of the dynamics. It excludes hard sphere interactions or interactions with very narrow wells [59, 60, 61], where the free energy landscape must be analyzed instead. Implementing SEER would then require more involved methods, such as using effective potentials [62, 63, 64, 65, 66].
We focused on modern numerical liquids made of poly-disperse particles, which are receiving an immense attention [33, 41, 42, 43, 44, 45, 46, 47] as they can be simulated on time scales closer to experimental conditions. It could be argued that these systems are specific, with small particles moving faster than larger ones [67]. Yet, just as for multicomponent metallic glasses [68, 69, 70] or silica where some atoms move much faster than others, these models present the usual hallmarks of glassy dynamics [51, 52]. In specific systems, however (e.g. such as those displaying a liquid-liquid phase transition [71] or hexatic ordering [10]), cooperative effects may influence the excitation energy, which will be interesting to investigate further.
Conceptually, our results indicate that a dynamical correlation length can grow while not affecting the relationship between relaxation time and local barriers. Such a scenario is captured in simplified descriptions of interacting excitations called ‘elasto-plastic models’, which are cellular automata initially introduced to study the plasticity of amorphous materials [72]. Their relaxation time is controlled, as in our case, by the density of excitations around visited configurations [73, 74], which also presents a gap or depletion similar to our observations. These models display a growing correlation length under cooling [74]. It can be explained in terms of slow avalanches of activated processes [75], whose statistics matches the longest available MD simulations of dynamical heterogeneities [76]. Thus, a description of the glass transition based on local barriers appears quantitatively consistent with both the slowing down of the dynamics presented here, and with the spatial correlations of the dynamics studied in these works.
Finally, an important question for the future is what makes local barriers grow under cooling. Do they follow a high-frequency elastic modulus [15], or instead local (instead of global) elasticity [17], perhaps affected by the presence of locally-favored structures [77, 78]? Alternatively, are they controlled by the varying geometry of elementary rearrangements under cooling, which appears to be shaped by the presence of a dynamical transition near [34]? The systematic extraction of excitations SEER allows may give a new handle to address this question in the future.
Acknowledgements.
We thank E. Lerner for providing some of the equilibrium configurations we investigated. We thank the Simons collaboration as well as L. Berthier, G. Biroli, C. Brito, C. Gavazzoni, E. Lerner, M. Muller, M. Popovic, M. Ozawa and A. Tahaei for discussions. M.P.C. discloses support for the research of this work from Singapore Ministry of Education [MOE-T2EP50221-0016]. M.W acknowledges support from the Simons Foundation Grant (No. 454953 Matthieu Wyart) and from the SNSF under Grant No. 200021-165509.Appendix A Extremely low-temperatures
In Fig. 3e, we evaluated the energy shift at small temperatures and , whose large relaxation time is inaccessible to numerical simulations. Figure 5b shows that the predicted shift in activation energy keeps its linear temperature dependence also in this regime, as also reported in some experimental data [53].
Appendix B Mode Coupling Critical Temperature
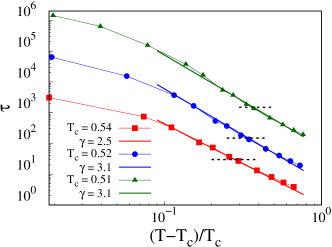
According to mode-coupling theory, the functional from should describe the relaxation time for . We estimate as a useful reference by examining the behavior of the relaxation time for selected putative values of in Fig. 6. For , MCT only describes a small increase in relaxation time, up to . For , MCT underestimates the relaxation time in an increasingly large temperature window. We thus estimate .
Appendix C SEER: Systematic Excitation ExtRaction
SEER constructs a catalogue of excitations associated with an inherent structure of a system governed by the energy functional . To identify the excitations with the smallest activation energy, SEER searches excitations via thermal cycles performed at a temperature , which is initially small , and gradually increased by . The velocities of the initial configuration are initially drawn from the equilibrium distribution at . This is the only source of randomness in the algorithm. When is changed, particle velocities are set by rescaling these initial velocities.
We detail SEER’s working principle below:
-
1.
We set the temperature to by rescaling the initial velocities .
-
2.
We perform a thermal cycle evolving the system up to a maximum time , while controlling the temperature via velocity rescaling. Thermal cycles at temperature and duration uncover excitations with a typical maximal activation energy . As such, if the thermal cycle reaches the maximum allocated time without uncovering any excitation, we expand the activation energy observation window increasing by by rescaling the initial velocities set in 1. Afterwards, we repeat this step. On the contrary, if the thermal cycle detects an excitation, we perform the following steps.
-
2.
We determine by the dichotomy method the smallest temperature in the interval at which a thermal cycle detects an excitation. Temperature is always controlled by rescaling the velocities set in 1. By lowering , we increase the probability we resolve an elementary transition.
-
3.
If the excitation is complex, we decompose it into elementary excitations as in Ref. [32].
-
4.
If the excitations of are also excitations of :
-
•
study the excitation with the nudge-elastic-band and add it to the catalogue.
-
•
for each excitation , we find the minimum that makes loose this excitation: descending this modified energy from goes back to . We determine with accuracy through the dichotomy method.
-
•
We modify by adding the excitation suppressing terms .
-
•
-
5.
We repeat the algorithm from 1 to search for a novel excitation.
Appendix D Removal of duplicate excitations
We associate many SEER’s generated catalogues with the same initial configuration by changing the initial particle velocities. Merging these catalogues yields our final catalogue. When merging catalogues, we remove repeated excitations. The distribution of the distance between discovered excitations illustrated in Fig.7 reveals that two excitations are coincident, , or well separated. This finding allows us to robustly ensure our final catalogue only contains distinct excitations by using a threshold on the distance.
Appendix E Stability with respect to and
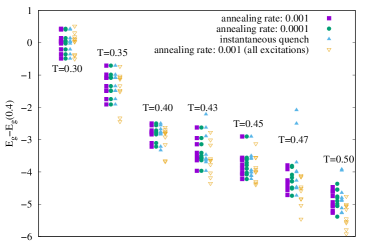
We estimated in Fig. 4e and f excitations’ energy shift by analysing the distribution of the energy barriers associated with the inherent structures of equilibrium configurations, at each temperature. The data reported in the figure are (i) obtained by quenching equilibrium configurations to a small temperature , and then quenching to zero temperature at a rate ; (ii) averaged over ten independent samples; and (iii) restricted to elementary excitations with a single maximum. Fig. 9 illustrates the robustness of our result by comparing different approaches to estimate the energy shift of each configuration.
Concerning (i), we avoid instantaneous quenches as it leads to a few outlier configurations with atypical at high , as apparent in Fig. 9. Direct inspection indicated that these configurations present at least one excitation in its high-energy state, very close to a saddle transition (i.e. with a small barrier). This situation can lead to instabilities in SEER, if these excitations relax to low their low-energy state while other excitations are studied. Eliminating such configurations (not shown), or annealing the system, eliminates this problem and leads to consistent results independently of the annealing rate, as shown in Fig. 9.
Concerning (ii), from the typical variance of the ten data points at each temperature, we find our typical error in the estimation of to be .
Concerning (iii), the analysis of all excitations (including complex ones, with multiple maxima as shown in open triangles), rather than the elementary ones, leads to analogous estimations of the gap energy at low temperatures, and slightly smaller estimations at the highest temperatures. This observation is plausibly related to the fact that, rigorously speaking, the density of states of all excitations is ill-defined. Indeed, in a large system, pairs of elementary excitations could be combined to generate a very large number of complex excitations. SEER seeks to avoid these fortuitous combinations (that can always occur by chance) by parsing complex excitations into elementary ones. Parsing is simple when two excitations are far away but difficult if they overlap. Overlaps will be more frequent at high temperatures, where excitations are more extended.
Appendix F Time temperature superposition
References
- Shortland et al. [2007] A. Shortland, N. Rogers, and K. Eremin, Trace element discriminants between egyptian and mesopotamian late bronze age glasses, Journal of Archaeological Science 34, 781 (2007).
- Fleming [1999] S. J. Fleming, Roman glass: reflections on cultural change (UPenn Museum of Archaeology, 1999).
- Anderson [1995] D. Anderson, Through the glass lightly, Science 267, 1618 (1995).
- Debenedetti and Stillinger [2001] P. Debenedetti and F. Stillinger, Supercooled liquids and the glass transition, Nature 410, 259 (2001).
- Angell [1985] C. Angell, Strong and fragile liquids, Relaxations in complex systems , 3 (1985).
- Kob et al. [1997] W. Kob, C. Donati, S. J. Plimpton, P. H. Poole, and S. C. Glotzer, Dynamical heterogeneities in a supercooled lennard-jones liquid, Physical review letters 79, 2827 (1997).
- Dalle-Ferrier et al. [2007] C. Dalle-Ferrier, C. Thibierge, C. Alba-Simionesco, L. Berthier, G. Biroli, J.-P. Bouchaud, F. Ladieu, D. L’Hôte, and G. Tarjus, Spatial correlations in the dynamics of glassforming liquids: Experimental determination of their temperature dependence, Phys. Rev. E 76, 041510 (2007).
- Lubchenko and Wolynes [2001] V. Lubchenko and P. Wolynes, Intrinsic Quantum Excitations of Low Temperature Glasses, Phys. Rev. Lett. 87, 195901 (2001).
- Biroli and Bouchaud [2012] G. Biroli and J.-P. Bouchaud, The random first-order transition theory of glasses: a critical assessment, Structural Glasses and Supercooled Liquids: Theory, Experiment, and Applications , 31 (2012).
- Tanaka et al. [2010] H. Tanaka, T. Kawasaki, H. Shintani, and K. Watanabe, Critical-like behaviour of glass-forming liquids, Nat. Mater. 9, 324 (2010).
- Keys et al. [2011] A. S. Keys, L. O. Hedges, J. P. Garrahan, S. C. Glotzer, and D. Chandler, Excitations are localized and relaxation is hierarchical in glass-forming liquids, Physical Review X 1, 021013 (2011).
- Ritort and Sollich [2003] F. Ritort and P. Sollich, Glassy dynamics of kinetically constrained models, Advances in physics 52, 219 (2003).
- Garrahan and Chandler [2002] J. P. Garrahan and D. Chandler, Geometrical explanation and scaling of dynamical heterogeneities in glass forming systems, Physical review letters 89, 035704 (2002).
- Turnbull and Cohen [1961] D. Turnbull and M. H. Cohen, Free-volume model of the amorphous phase: glass transition, The Journal of chemical physics 34, 120 (1961).
- Dyre [2006] J. Dyre, Colloquium: The glass transition and elastic models of glass-forming liquids, Rev. Mod. Phys. 78, 953 (2006).
- Rainone et al. [2020] C. Rainone, E. Bouchbinder, and E. Lerner, Pinching a glass reveals key properties of its soft spots, Proceedings of the National Academy of Sciences 117, 5228 (2020).
- Kapteijns et al. [2021] G. Kapteijns, D. Richard, E. Bouchbinder, T. B. Schrøder, J. C. Dyre, and E. Lerner, Does mesoscopic elasticity control viscous slowing down in glassforming liquids?, The Journal of Chemical Physics 155, 74502 (2021).
- Widmer-Cooper et al. [2008] A. Widmer-Cooper, H. Perry, P. Harrowell, and D. Reichman, Irreversible reorganization in a supercooled liquid originates from localized soft modes, Nat. Phys. 4, 711 (2008).
- Li et al. [2022] Y.-W. Li, Y. Yao, and M. P. Ciamarra, Local Plastic Response and Slow Heterogeneous Dynamics of Supercooled Liquids, Physical Review Letters 128, 258001 (2022).
- Lerbinger et al. [2022] M. Lerbinger, A. Barbot, D. Vandembroucq, and S. Patinet, Relevance of Shear Transformations in the Relaxation of Supercooled Liquids, Physical Review Letters 129, 195501 (2022), arXiv:2109.12639 .
- Mirigian and Schweizer [2013] S. Mirigian and K. S. Schweizer, Unified theory of activated relaxation in liquids over 14 decades in time, Journal of Physical Chemistry Letters 4, 3648 (2013).
- Lerner [2019] E. Lerner, Mechanical properties of simple computer glasses, J. Non-Cryst. Solids 522, 119570 (2019).
- Doliwa and Heuer [2003] B. Doliwa and A. Heuer, What does the potential energy landscape tell us about the dynamics of supercooled liquids and glasses?, Physical Review Letters 91, 235501 (2003).
- Heuer [2008] A. Heuer, Exploring the potential energy landscape of glass-forming systems: from inherent structures via metabasins to macroscopic transport, J. Phys. Condens. Matter 20, 373101 (2008).
- Simmons et al. [2012] D. S. Simmons, M. T. Cicerone, Q. Zhong, M. Tyagi, and J. F. Douglas, Generalized localization model of relaxation in glass-forming liquids, Soft Matter 8, 11455 (2012).
- Cicerone et al. [2014] M. T. Cicerone, Q. Zhong, and M. Tyagi, Picosecond Dynamic Heterogeneity, Hopping, and Johari-Goldstein Relaxation in Glass-Forming Liquids, Physical Review Letters 113, 117801 (2014).
- Cicerone et al. [2023] M. T. Cicerone, K. Badilla-Nunez, J. Zahn, J. P. Stoppelman, and J. G. McDaniel, Excitation populations provide a thermodynamic order parameter for liquids (2023), arXiv:2201.12593 [cond-mat.soft] .
- Ji et al. [2019] W. Ji, M. Popović, T. de Geus, E. Lerner, and M. Wyart, Theory for the density of interacting quasilocalized modes in amorphous solids, Phys. Rev. E 99, 023003 (2019).
- Schober et al. [1993] H. Schober, C. Oligschleger, and B. Laird, Low-frequency vibrations and relaxations in glasses, J. Non. Cryst. Solids 156-158, 965 (1993).
- Wang et al. [2019] L. Wang, A. Ninarello, P. Guan, L. Berthier, G. Szamel, and E. Flenner, Low-frequency vibrational modes of stable glasses, Nat. Commun. 10, 26 (2019).
- Khomenko et al. [2020] D. Khomenko, C. Scalliet, L. Berthier, D. Reichman, and F. Zamponi, Depletion of two-level systems in ultrastable computer-generated glasses, Phys. Rev. Lett. 124, 225901 (2020).
- Ji et al. [2020] W. Ji, T. de Geus, M. Popović, E. Agoritsas, and M. Wyart, Thermal origin of quasilocalized excitations in glasses, Phys. Rev. E 102, 062110 (2020).
- Ninarello et al. [2017a] A. Ninarello, L. Berthier, and D. Coslovich, Models and algorithms for the next generation of glass transition studies, Phys. Rev. X 7, 021039 (2017a).
- Ji et al. [2022] W. Ji, T. W. de Geus, E. Agoritsas, and M. Wyart, Mean-field description for the architecture of low-energy excitations in glasses, Physical Review E 105, 044601 (2022).
- Khomenko et al. [2021] D. Khomenko, D. Reichman, and F. Zamponi, Relationship between two-level systems and quasilocalized normal modes in glasses, Phys. Rev. Materials 5, 055602 (2021).
- Zarkevich and Johnson [2015] N. A. Zarkevich and D. D. Johnson, Nudged-elastic band method with two climbing images: Finding transition states in complex energy landscapes, The Journal of Chemical Physics 142, 24106 (2015).
- Briano and Glandt [1984] J. Briano and E. Glandt, Statistical thermodynamics of polydisperse fluids, J. Chem. Phys. 80, 3336 (1984).
- Gutiérrez et al. [2015] R. Gutiérrez, S. Karmakar, Y. Pollack, and I. Procaccia, The static lengthscale characterizing the glass transition at lower temperatures, Europhys. Lett. 111, 56009 (2015).
- Ninarello et al. [2017b] A. Ninarello, L. Berthier, and D. Coslovich, Models and Algorithms for the Next Generation of Glass Transition Studies, Phys. Rev. X 7, 021039 (2017b).
- Brito et al. [2018] C. Brito, E. Lerner, and M. Wyart, Theory for Swap Acceleration near the Glass and Jamming Transitions for Continuously Polydisperse Particles, Phys. Rev. X 8, 031050 (2018).
- Nishikawa et al. [2022] Y. Nishikawa, M. Ozawa, A. Ikeda, P. Chaudhuri, and L. Berthier, Relaxation dynamics in the energy landscape of glass-forming liquids, Physical Review X 12, 10.1103/physrevx.12.021001 (2022).
- Berthier and Reichman [2023] L. Berthier and D. R. Reichman, Modern computational studies of the glass transition, Nature Reviews Physics 5, 102 (2023).
- Guiselin et al. [2022] B. Guiselin, C. Scalliet, and L. Berthier, Microscopic origin of excess wings in relaxation spectra of supercooled liquids, Nature Physics 2022 , 1 (2022).
- Scalliet et al. [2022] C. Scalliet, B. Guiselin, and L. Berthier, Thirty milliseconds in the life of a supercooled liquid, Physical Review X 12, 041028 (2022).
- Berthier et al. [2019a] L. Berthier, P. Charbonneau, A. Ninarello, M. Ozawa, and S. Yaida, Zero-temperature glass transition in two dimensions, Nature communications 10, 1 (2019a).
- Scalliet et al. [2019] C. Scalliet, L. Berthier, and F. Zamponi, Nature of excitations and defects in structural glasses, Nat. Commun. 10, 5102 (2019).
- Ciarella et al. [2023] S. Ciarella, D. Khomenko, L. Berthier, F. C. Mocanu, D. R. Reichman, C. Scalliet, and F. Zamponi, Finding defects in glasses through machine learning, Nature Communications 14, 10.1038/s41467-023-39948-7 (2023).
- Berthier et al. [2019b] L. Berthier, M. Ozawa, and C. Scalliet, Configurational entropy of glass-forming liquids, The Journal of chemical physics 150, 160902 (2019b).
- Berthier and Ediger [2020] L. Berthier and M. D. Ediger, How to ’measure’ a structural relaxation time that is too long to be measured?, The Journal of Chemical Physics 153, 44501 (2020).
- Van Gurp and Palmen [1998] M. Van Gurp and J. Palmen, Time-temperature superposition for polymeric blends, Rheol. Bull 67, 5 (1998).
- Berthier et al. [2017] L. Berthier, P. Charbonneau, D. Coslovich, A. Ninarello, M. Ozawa, and S. Yaida, Configurational entropy measurements in extremely supercooled liquids that break the glass ceiling, Proc. Natl. Acad. Sci. U.S.A. 114, 11356 (2017).
- Das and Sastry [2022] P. Das and S. Sastry, Crossover in dynamics in the Kob-Andersen binary mixture glass-forming liquid, Journal of Non-Crystalline Solids: X 14, 100098 (2022), arXiv:2204.04411v1 .
- Mallamace et al. [2010] F. Mallamace, C. Branca, C. Corsaro, N. Leone, J. Spooren, S.-H. Chen, and H. E. Stanley, Transport properties of glass-forming liquids suggest that dynamic crossover temperature is as important as the glass transition temperature, Proceedings of the National Academy of Sciences 107, 22457 (2010).
- Pollak et al. [1998] E. Pollak, H. Grabert, and P. Hänggi, Theory of activated rate processes for arbitrary frequency dependent friction: Solution of the turnover problem, The Journal of Chemical Physics 91, 4073 (1998).
- Coslovich et al. [2018] D. Coslovich, M. Ozawa, and W. Kob, Dynamic and thermodynamic crossover scenarios in the Kob-Andersen mixture: Insights from multi-CPU and multi-GPU simulations, The European Physical Journal E 41, 62 (2018).
- Struik [1997] L. Struik, The apparent activation energy for mechanical and dielectric relaxation in glass-forming (polymeric) liquids: a misconception?, Polymer 38, 733 (1997).
- Note [1] If is significantly larger than , relaxation can occur via the nucleation of a hot liquid phase invading the material [49, 79].
- Hecksher et al. [2019] T. Hecksher, N. B. Olsen, and J. C. Dyre, Fast contribution to the activation energy of a glass-forming liquid, Proceedings of the National Academy of Sciences 116, 16736 (2019).
- Eckert and Bartsch [2002] T. Eckert and E. Bartsch, Re-entrant glass transition in a colloid-polymer mixture with depletion attractions, Physical Review Letters 89, 125701 (2002).
- Pham et al. [2002] K. N. Pham, A. M. Puertas, J. Bergenholtz, S. U. Egelhaaf, A. Moussaïd, P. N. Pusey, A. B. Schofield, M. E. Cates, M. Fuchs, and W. C. K. Poon, Multiple glassy states in a simple model system, Science 296, 104 (2002).
- Sciortino [2002] F. Sciortino, Disorderd materials: One liquid, two glasses, Nature Materials 1, 145 (2002).
- Brito and Wyart [2009] C. Brito and M. Wyart, Geometric interpretation of previtrification in hard sphere liquids, The Journal of chemical physics 131, 149 (2009).
- Degiuli et al. [2015] E. Degiuli, E. Lerner, and M. Wyart, Theory of the jamming transition at finite temperature, J. Chem. Phys. 142, 164503 (2015).
- Ghosh et al. [2010] A. Ghosh, R. Mari, V. Chikkadi, P. Schall, J. Kurchan, and D. Bonn, Density of states of colloidal glasses and supercooled liquids, Soft matter 6, 3082 (2010).
- Altieri [2018] A. Altieri, Higher-order corrections to the effective potential close to the jamming transition in the perceptron model, Physical Review E 97, 012103 (2018).
- Altieri et al. [2016] A. Altieri, S. Franz, and G. Parisi, The jamming transition in high dimension: an analytical study of the tap equations and the effective thermodynamic potential, Journal of Statistical Mechanics: Theory and Experiment 2016, 093301 (2016).
- Pihlajamaa et al. [2023] I. Pihlajamaa, C. C. L. Laudicina, and L. M. C. Janssen, Influence of polydispersity on the relaxation mechanisms of glassy liquids, Physical Review Research 5, 033120 (2023).
- Meyer et al. [2004] A. Meyer, J. Horbach, W. Kob, F. Kargl, and H. Schober, Channel Formation and Intermediate Range Order in Sodium Silicate Melts and Glasses, Physical Review Letters 93, 027801 (2004).
- Voigtmann and Horbach [2009] T. Voigtmann and J. Horbach, Double Transition Scenario for Anomalous Diffusion in Glass-Forming Mixtures, Physical Review Letters 103, 205901 (2009).
- Bartsch et al. [2010] A. Bartsch, K. Rätzke, A. Meyer, and F. Faupel, Dynamic Arrest in Multicomponent Glass-Forming Alloys, Physical Review Letters 104, 195901 (2010).
- Sastry and Austen Angell [2003] S. Sastry and C. Austen Angell, Liquid–liquid phase transition in supercooled silicon, Nature materials 2, 739 (2003).
- Nicolas et al. [2018] A. Nicolas, E. Ferrero, K. Martens, and J.-L. Barrat, Deformation and flow of amorphous solids: Insights from elastoplastic models, Rev. Mod. Phys. 90, 045006 (2018).
- Popović et al. [2021] M. Popović, T. de Geus, W. Ji, and M. Wyart, Thermally activated flow in models of amorphous solids, Phys. Rev. E 104, 025010 (2021).
- Ozawa and Biroli [2022] M. Ozawa and G. Biroli, Elasticity, facilitation and dynamic heterogeneity in glass-forming liquids, arXiv preprint arXiv:2209.08861 (2022).
- Tahaei et al. [2023] A. Tahaei, G. Biroli, M. Ozawa, M. Popović, and M. Wyart, Scaling description of dynamical heterogeneity and avalanches of relaxation in glass-forming liquids, arXiv preprint arXiv:2305.00219 (2023).
- Guiselin et al. [2021] B. Guiselin, C. Scalliet, and L. Berthier, Microscopic origin of excess wings in relaxation spectra of deeply supercooled liquids, arXiv preprint 2103.01569 10.48550/arXiv.2103.01569 (2021).
- Coslovich and Pastore [2007] D. Coslovich and G. Pastore, Understanding fragility in supercooled lennard-jones mixtures. i. locally preferred structures, The Journal of chemical physics 127, 124504 (2007).
- Royall and Williams [2015] C. P. Royall and S. R. Williams, The role of local structure in dynamical arrest, Physics Reports 560, 1 (2015).
- Mehri et al. [2022] S. Mehri, L. Costigliola, and J. C. Dyre, Single-parameter aging in the weakly nonlinear limit, Thermo 2, 160 (2022).