XMM-Newton Detection of X-ray Emission from the Metal-Polluted White Dwarf G 29-38
Abstract
A recent analysis of Chandra X-ray data of the metal-polluted white dwarf (WD) G 29-38 has revealed X-ray emission that can be attributed to the accretion of debris from a planetary body. In the light of this detection we revisit here archival XMM-Newton observations of G 29-38 from which only an upper limit was derived in the past due to the presence of a relatively bright nearby X-ray source. An analysis of these data in multiple energy bands allows disentangling the X-ray emission at the location of G 29-38 from that of the nearby source. The similar spectral properties of the source in the XMM-Newton and Chandra observations and their spatial shift, consistent with the proper motion of G 29-38 between these observations, strengthen the origin of that X-ray emission from G 29-38. The X-ray luminosities from both observations are consistent within 1- uncertainties, so too are the best-fit plasma temperatures. Although the count number is small, there is tantalizing evidence for line emission in the 0.7–0.8 keV energy band from an optically-thin hot plasma. The most likely candidate for this line emission would be the Fe complex at 16 Å.
1 Introduction
The late evolution of white dwarfs (WDs), the stellar end products of low- and intermediate-mass stars, can be described as a long-lasting cooling process as their thermal energy is radiated away (e.g., Renedo et al., 2010). By the time (20 Myr) a WD’s temperature falls below 25,000 K, metals are no longer radiatively supported in the high gravity atmosphere and sink below the surface (Chayer et al., 1995a, b; Koester et al., 2014), with diffusion time-scales from days to a few years for H-rich atmospheres (Koester et al., 2020). Therefore the presence of metallic absorption lines in the spectra of a cool degenerate WDs implies that they have accreted metal-rich material after their formation, most likely from circumstellar debris disks evidenced by infrared excess (Jura, 2003, 2008; Farihi et al., 2010; Hollands et al., 2018). This way metal-polluted WDs provide unique means to investigate the late fate of planetary systems and to determine their bulk abundances (e.g., Gänsicke et al., 2012).
Cunningham et al. (2022) (hereafter C2022) has recently presented Chandra observations of G 29-38 (a.k.a. WD 2326049), which resulted in the detection of 5 photons, implying an X-ray luminosity 1026 erg s-1 (at the distance of 17.530.01 pc, Gaia Collaboration, 2020). Since G 29-38 is a single cool degenerate WD, the origin of these X-rays can be excluded to be (i) the photospheric emission of a hot WD, (ii) the coronal emission from a late-type companion, or (iii) the emission from a close binary companion accretion disk (Chu et al., 2021).
G 29-38 was identified as the first metal-polluted WD (Koester et al., 1997) of the spectral subtype DAZ (Zuckerman et al., 2003), i.e., its atmosphere includes absorption lines both of H and a number of metals (mostly Ca, Mg, and Fe, Xu et al., 2014). It is also the first metal-polluted WD where infrared excess was identified (Zuckerman & Becklin, 1987). This was interpreted later as an orbiting dust disk attributed to the disruption of an asteroid or a minor planet (Jura, 2003; Reach et al., 2005).
The accretion of material from this disk onto G 29-38 would produce the X-ray emission (Kylafis & Lamb, 1982) detected by C2022. Very interestingly G 29-38 was observed in 2005 by XMM-Newton, which brings up the tantalizing possibility to investigate its X-ray variability. Jura et al. (2009) (hereafter J2009) originally analyzed that data set and reported an upper limit for its X-ray flux about two times smaller than that reported by C2022. J2009 remarked, however, that their upper limit was conservatively adopted given the presence of a nearby brighter background X-ray source. A more recent analysis of the same XMM-Newton data limited to its MOS cameras raised the upper limit of J2009 by a factor of three (Farihi et al., 2018, hereafter F2018), although it was attributed to contamination of the nearby background source.
The differing values of the X-ray upper limits derived from the XMM-Newton data of G 29-38 reported by J2009 and F2018 and the Chandra detection reported by C2022 certainly recommend the need for a re-analysis of the XMM-Newton data set. In this letter, guided by the recent Chandra detection of X-ray emission from G 29-38, we revisit its XMM-Newton observations to evaluate whether it was indeed detected or its X-ray flux has varied.
2 Observations and data preparation
We analyze the XMM-Newton observations of G 29-38 obtained on 2005 November 28 (Obs. ID 0302820101; PI: M. Muno) with total exposure time of 24.8 ks. The observations were processed using the Science Analysis Software (SAS, version 18.0.0; Gabriel et al., 2004). Event files of the European Photon Imaging Cameras (EPIC) pn and MOS cameras were created using the epproc and emproc SAS tasks, respectively. Time periods with background count rates in the 10–12 keV energy range above 0.15 counts s-1 for the MOS cameras and 0.4 counts s-1 for the EPIC pn were excised. The net exposure time for the EPIC-pn, which will be otherwise used in the following, is 17.2 ks.
To facilitate the investigation of the spatial distribution of X-rays in the region around G 29-38, very particularly to separate its emission from that of the nearby background source, we used the Extended Source Analysis Software (ESAS) package (Snowden et al., 2004, 2008; Kuntz & Snowden, 2008) to create exposure-corrected, background-subtracted images in different energy ranges. We note that the ESAS tasks have quite restrictive event selection criteria, resulting in a lower EPIC-pn net exposure time of 16.8 ks, but they leverage the presence of extended and point-like sources. EPIC-pn images were then created in the 0.3-1.0 keV (soft) and 1.0-2.0 keV (hard) energy bands. After the spectral analysis (see Section 3.3), evidence was found for line emission between 0.7 and 0.8 keV from G 29-38, which is otherwise not especially bright in the nearby background source. Thus an additional EPIC-pn image in this narrow energy range was produced to accentuate the separation between G 29-38 and the nearby X-ray source. The three images were adaptively smoothed using the ESAS task adapt requesting a minimum of 5 counts.
3 Data Analysis
3.1 Source Identification
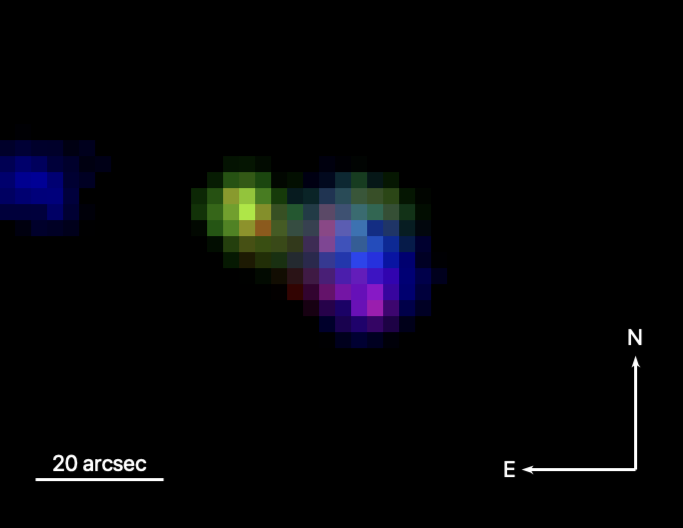
In their analysis of this same XMM-Newton dataset, J2009 reported the presence of a background X-ray source only from the expected location of G 29-38. This background source, being brighter than any X-ray emission from the location of G 29-38, certainly complicates its identification. The recent Chandra detection of X-ray emission from G 29-38 reported by C2022 clarifies its relative position with respect to background X-ray sources. The use of the ESAS task to produce a color-picture of the region around G 29-38 in the energy bands 0.3–1.0, 0.7–0.8, and 1.0–2.0 keV indeed confirms the presence of two distinct X-ray sources, one fainter and “yellow” and another brighter and “purple” to its Southwest (Figure 1-top).
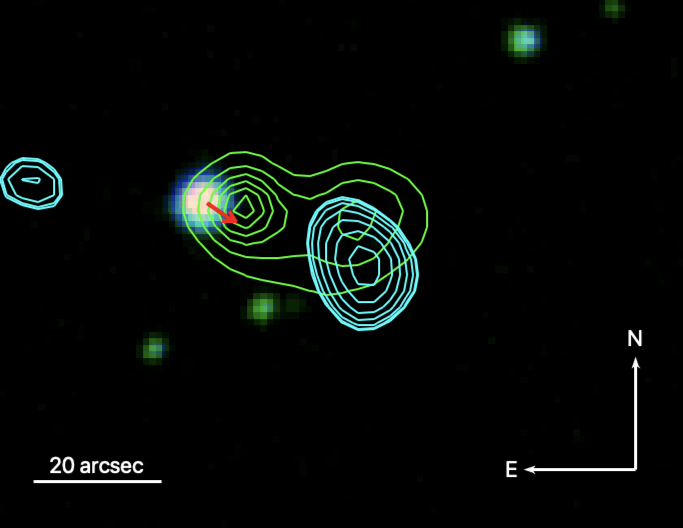
To assess whether any of these X-ray sources is associated to G 29-38, we retrieved optical and near-IR images in the POSS2/UKSTU Blue, Red and IR bands from the Digitized Sky Survey (DSS)111https://archive.stsci.edu/cgi-bin/dss_form/ and present it in Figure 1-middle overlaid by X-ray contours in the 0.7–0.8 and 1.0–2.0 keV bands that emphasize the emission from each of these sources. The J2000.0 coordinates of the peak emission of these sources are 23:28:47.39, +05:14:55.0 and 23:28:46.14, +05:14:46.1, respectively. The “yellow” source is actually located 2.5′′ from the expected position of G 29-38, once its large proper motion ( yr-1, yr-1, Gaia Collaboration, 2020) illustrated in Figure 1-middle by a red arrow is considered to compute the shift of its position from the DSS image (1993) to locate its position at the epoch of the XMM-Newton observation (2005.91). This offset is within the XMM-Newton spatial resolution.
3.2 Spectra Extraction
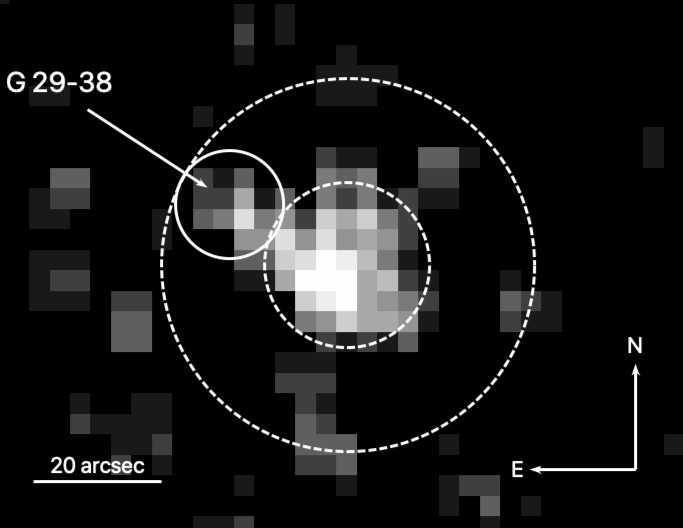
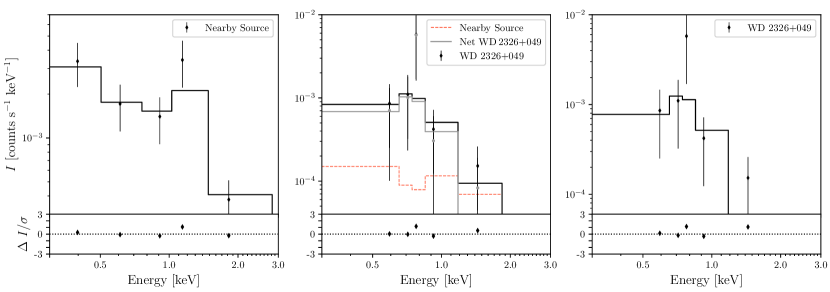
The XMM-Newton EPIC-pn point spread function has a half energy width (HEW) of 166, resulting in non-negligible contribution of the X-ray emission from the source nearby to the location of G 29-38222 As illustrated in the middle panel of Figure 1, the projected location of G 29-38 moves closer to that of the background X-ray source as time proceeds. Indeed their distance has reduced to 84 at the time of the Chandra observation in 2020. The earlier observation by XMM-Newton, when the sources separation was , is thus a fortunate fact that eases the separation of their respective emissions. . To reduce and to assess this contamination, we used a circular aperture 83 in radius to extract the spectrum of G 29-38 (Fig. 1-bottom), together with a suitable background region with an area 40 times larger than the source aperture consisting of several nearby circular apertures free from sources. Since the source aperture encompasses the EPIC-pn HEW, the encircled energy fraction in the background-subtracted spectrum shown in Fig. 2-center is 0.5. We then proceeded to extract the spectrum of the nearby source and fitted its background-subtracted spectrum (Fig. 2-left) with a suitable model. It is important to note the spectral differences between the nearby source and the WD suggested by the color-composite picture in Fig. 1-top and confirmed by their spectra presented in the left and center panels of Fig. 2. The EPIC-pn encircled energy fraction was used to compute the contribution of this source to the aperture used for G 29-38 and the spectrum of the nearby source adequately scaled subtracted from the spectrum of G 29-38 (Fig. 2-center). The net EPIC-pn count number from G 29-38 is 93 cnts that, after accounting for the encircled energy fraction of 0.5, corresponds to a count rate of 1.00.4 cnts ks-1.
Alternatively, we have selected a background region for G 29-38 from an annular region around the nearby source in the radius range of the source region (Figure 1-bottom). This background spectrum thus accounts for the expected contribution of this source to G 29-38. The comparison between this spectrum and the net spectrum of G 29-38 in the right and center panels of Fig. 2 shows noticeable agreement. Indeed, the net EPIC-pn count number and PSF-corrected count rate in this spectrum, 103 cnts and 1.20.4 cnts ks-1, respectively, are consistent within the uncertainties with those derived in the paragraph above. For comparison, the Chandra ACIS-S count rate reported by C2022 in the 0.5–2.0 keV band is 0.047 cnts ks-1, whereas the XMM-Newton EPIC-pn and EPIC-MOS count rate 3 upper limits in the 0.3–2.0 keV band reported by J2009 are 0.9 cnts ks-1 and 0.32 cnts ks-1, respectively. Meanwhile F2018 reported an XMM-Newton EPIC-MOS count rate 3 upper limit in the 0.3–2.0 keV band of 0.8 cnts ks-1.
3.3 Spectral Analysis
The total count number derived from the EPIC-pn background-subtracted spectra of G 29-38 in the center and right panels of Fig. 2-right is obviously too small to allow a detailed spectral modeling. Instead we compare these spectra using the XSPEC package (version 12.10.1; Arnaud, 1996) with the thin-plasma emission model described by C2022 consisting of an optically-thin plasma emission model with plasma temperature of 0.49 keV and chemical abundances of the WD photosphere (as described in Table 3 of Xu et al., 2014) absorbed by a hydrogen column density of 5.4 cm-2. Calibration matrices were obtained using the standard rmfgen and arfgen SAS tasks. The tbabs absorption component (Wilms et al., 2000) was adopted together with the variable abundances vapec model. We note that the adopted value of is about 100 times smaller than the value provided by the NASA’s HEASARC NH column density tool (HI4PI2016, Kalberla et al., 2005; Dickey & Lockman, 1990)333https://heasarc.gsfc.nasa.gov/cgi-bin/Tools/w3nh/w3nh.pl, but it most likely represents the small absortion towards this nearby WD. This model has an X-ray flux and luminosity of erg cm-2 s-1 and erg s-1, respectively, which are consistent with those estimated by C2022 for the 0.3 to 7.0 keV band. The model provides a reasonable description of the XMM-Newton data444We note that, although the source aperture used to extract the spectrum of G 29-38 only includes 50% of its emission, the calibration matrices correct the emission from the incomplete coverage of the source PSF., but it seems to underestimate the observed X-ray emission at 0.8 keV. To illustrate further the differences between our results and those presented by C2022, we list in Table 1 the model parameters used for the spectral analysis of the XMM-Newton and Chandra data, where we emphasize that our X-ray temperature was fixed to that derived by C2022.
| XMM-Newton | Chandra | |
|---|---|---|
| [keV] | 0.49 | 0.49 |
| [K] | 5.7 | (5.7) |
| [erg cm-2 s-1] | (2.21.1)10-15 | (2.0)10-15 |
| [erg s-1] | (8.34.1)1025 | (7.2)1025 |

To further investigate this apparent excess, we present in Figure 3 the unbinned EPIC-pn background-subtracted spectrum of G 29-38.
This is basically dominated by the emission in the 0.7–0.8 keV range, with 6 out of the 10 counts in this energy range.
The emission from G 29-38 in the 0.7-0.8 keV band even outshines that of the nearby source (Fig. 1-top).
This spectral behavior is also the case for the Chandra spectrum, with 4 out of its 5 counts in the 0.7 to 1.0 keV energy range (C2022).
The combined Chandra and XMM-Newton detection of 10 out of 15 counts in such a narrow energy range is highly suggestive of the presence of an emission line.
The EPIC-pn spectrum can indeed be fitted by a narrow emission line at 0.78 keV also absorbed by a of 5.4 cm-2.
The X-ray flux in the 0.3 to 7.0 keV band would also be consistent with the value reported by C2022.
4 Discussion and Concluding Remarks
C2022 had to devote a major effort in their analysis of the Chandra observations of G 29-38 to demonstrate that the data indeed implied a real detection of X-ray emission and that it could solely be attributed to this WD rather than to a cosmic background source. Our analysis of the XMM-Newton observation of G 29-38 confirms the detection of a source at the 2005.91 proper-motion-corrected location of the WD with similar spectral properties and X-ray emission level as the source detected by Chandra at the 2020.73 proper-motion-corrected location of G 29-38. This result provides strong support to the conclusions presented by C2022 confirming without any doubt the association of an X-ray source with G 29-38.
The spectral shape of the XMM-Newton EPIC-pn spectrum is also consistent with that of the Chandra ACIS-S one. C2022 favored a plasma emission model with the photospheric chemical abundances of G 29-38 with notable O and Fe enhanced abundances (Farihi et al., 2009; Xu et al., 2014), which are consistent with those of its debris disk (Reach et al., 2009). The spectral shapes of both X-ray observations are actually very highly indicative of line emission in the 0.7–0.8 keV range, which can be attributed to the O viii 16 Å line or to the Fe complex at 16 Å including emission lines of high excitation species from Fe xvi to Fe xix. The presence of these species would imply plasma temperature in the range from 2 to 8 MK, i.e., 0.17–0.7 keV. At higher temperatures, the ionic fractional abundances of Fe shift towards higher ionization species whose emission lines peak at energies above 1 keV. Tests with absorbed, optically-thin thermal plasma vapec model with chemical abundances of the photosphere of G 29-38 described by C2022 varying the plasma temperature indicated that the lowest possible plasma temperature is unconstrained, whereas the plasma temperature is certainly lower than 0.6 keV, in accordance with C2022 findings.

The XMM-Newton EPIC-pn X-ray flux determined from these different spectral analyses also confirms that the level of X-ray emission of the source is similar, within their 40% uncertainty, to that of the Chandra ACIS-S spectrum acquired almost 15 years apart. Although long-term variability is still possible, this consistency excludes the detection of a sudden accretion event either by the Chandra or the XMM-Newton observations. An inspection of the time arrival of the (few) photons detected by the XMM-Newton observations within the aperture of G 29-38 in the range from 0.4 to 1.2 keV, which minimizes the contributions of the softer background and harder nearby source, finds that the measured count rate is consistent with a constant X-ray flux.
The possible variability of the accretion rate onto chemically polluted WDs, maybe involving stochastic discrete events of accretion, is an appealing idea (Wyatt et al., 2014; Kenyon & Bromley, 2017), which can be also connected with the IR variability of dusty disks around them as they are replenished and subsequently depleted of material (Swan et al., 2019). Indeed von Hippel & Thompson (2007) and then von Hippel et al. (2009) reported variations in the photospheric Ca and Mg line-strengths of G 29-38 attributed to episodic accretion events, but this result has been disputed (Debes & López-Morales, 2008). Since the X-ray flux is mostly dependent on the accretion rate onto the WD, the steady count rate from G 29-38 is consistent with a stable accretion rate. Furthermore it argues against the presence of an accretion hot spot on the surface of G 29-38, that would indicate channeling of infall material by a magnetic field, as has also been rejected in the case of GD 394 (Wilson et al., 2019).
The analysis of the archival XMM-Newton observations presented here confirms the X-ray emission from G 29-38 and is consistent with a stable accretion rate on time scales of years and hours. The spectral shape is highly indicative of Fe and/or O rich material that would originate from a rocky planet debris. The high Fe abundances of the X-ray-emitting material is in line with the abundances of the dusty disk around G 29-38 (Farihi et al., 2009), which are then diminished in the stellar atmosphere as it settles in time-scales of a few weeks (Xu et al., 2014).
The low luminosity erg s-1 (and thus accretion rate) and plasma temperature 0.17-0.7 keV of the X-ray emission from G 29-38 is far from systems with high accretion rates such as symbiotic stars and CVs ( erg s-1 and 1 keV, see Figure 3 in Guerrero et al., 2019).
The X-ray luminosity is also below that of putative single WDs with hard X-ray emission, which may still present plasmas at similar temperatures ( erg s-1 and 0.1–1.5 keV, Chu et al., 2021, Estrada-Dorado et al., submitted to ApJ).
The hard X-ray emission from these WDs, which is found to be variable (e.g., with a period of 4.7 hr for KPD 00055106, Chu et al., 2021), would arise from the accretion of material from a late-type stellar or a substellar companion.
The low X-ray luminosity and plasma temperature, and the steady level of X-ray emission favor a bombardment solution (Kuijpers & Pringle, 1982).
The authors are thankful to the anonymous referee for comments and suggestions that improved the presentation and interpretation of our results. S.E.-D. thanks Consejo Nacional de Ciencia y Tecnología (CONACyT, Mexico) for a student scholarship. S.E.-D. and J.A.T. acknowledges funding by the Dirección General de Asuntos del Personal Académico (DGAPA) of the Universidad Nacional Autónoma de México (UNAM) project IA101622. J.A.T. thanks the Sistema Nacional de Investigadores (SNI-CONACyT, Mexico) and the Visiting-Incoming programme of the IAA-CSIC through the Centro de Excelencia Severo Ochoa (Spain). M.A.G. and C.R.-L. acknowledge financial support from State Agency for Research of the Spanish MCIU through the “Center of Excellence Severo Ochoa” award to the Instituto de Astrofísica de Andalucía (SEV-2017-0709). M.A.G. thanks support from the Spanish Ministerio de Ciencia, Innovación y Universidades (MCIU) grant PGC2018-102184-B-100. Y.H.-C. acknowledges the grant MOST 110-2112-M-001-020 from the Ministry of Science and Technology (Taiwan). This work has made extensive use of NASA’s Astrophysics Data System.
References
- Arnaud (1996) Arnaud, K. A. 1996, Astronomical Data Analysis Software and Systems V, 101, 17
- Chayer et al. (1995a) Chayer, P., Fontaine, G., & Wesemael, F. 1995, ApJS, 99, 189
- Chayer et al. (1995b) Chayer, P., Vennes, S., Pradhan, A. K., et al. 1995, ApJ, 454, 429
- Chu et al. (2021) Chu, Y.-H., Toalá, J. A., Guerrero, M. A., et al. 2021, ApJ, 910, 119.
- Cunningham et al. (2022) Cunningham, T., Wheatley, P. J., Tremblay, P.-E., et al. 2022, Nature, 602, 219.
- Debes & López-Morales (2008) Debes, J. H. & López-Morales, M. 2008, ApJ, 677, L43.
- Dickey & Lockman (1990) Dickey, J. M. & Lockman, F. J. 1990, ARA&A, 28, 215
- Farihi et al. (2009) Farihi, J., Jura, M., & Zuckerman, B. 2009, ApJ, 694, 805.
- Farihi et al. (2010) Farihi, J., Barstow, M. A., Redfield, S., et al. 2010, MNRAS, 404, 2123.
- Farihi et al. (2018) Farihi, J., Fossati, L., Wheatley, P. J., et al. 2018, MNRAS, 474, 947.
- Gabriel et al. (2004) Gabriel, C., Denby, M., Fyfe, D. J., et al. 2004, Astronomical Data Analysis Software and Systems (ADASS) XIII, 314, 759
- Gaia Collaboration (2020) Gaia Collaboration 2020, VizieR Online Data Catalog, I/350
- Gänsicke et al. (2012) Gänsicke, B. T., Koester, D., Farihi, J., et al. 2012, MNRAS, 424, 333.
- Guerrero et al. (2019) Guerrero, M. A., Toalá, J. A., & Chu, Y.-H. 2019, ApJ, 884, 134.
- Hollands et al. (2018) Hollands, M. A., Gänsicke, B. T., & Koester, D. 2018, MNRAS, 477, 93.
- Jura (2003) Jura, M. 2003, ApJ, 584, L91.
- Jura (2008) Jura, M. 2008, AJ, 135, 1785.
- Jura et al. (2009) Jura, M., Muno, M. P., Farihi, J., et al. 2009, ApJ, 699, 1473.
- Kalberla et al. (2005) Kalberla, P. M. W., Burton, W. B., Hartmann, D., et al. 2005, A&A, 440, 775
- Kenyon & Bromley (2017) Kenyon, S. J. & Bromley, B. C. 2017, ApJ, 844, 116.
- Koester et al. (2020) Koester, D., Kepler, S. O., & Irwin, A. W. 2020, A&A, 635, A103.
- Koester et al. (2014) Koester, D., Gänsicke, B. T., & Farihi, J. 2014, A&A, 566, A34
- Koester et al. (1997) Koester, D., Provencal, J., & Shipman, H. L. 1997, A&A, 320, L57
- Kuijpers & Pringle (1982) Kuijpers, J. & Pringle, J. E. 1982, A&A, 114, L4
- Kuntz & Snowden (2008) Kuntz, K. D. & Snowden, S. L. 2008, A&A, 478, 575.
- Kylafis & Lamb (1982) Kylafis, N. D. & Lamb, D. Q. 1982, ApJS, 48, 239.
- Reach et al. (2005) Reach, W. T., Kuchner, M. J., von Hippel, T., et al. 2005, ApJ, 635, L161.
- Reach et al. (2009) Reach, W. T., Lisse, C., von Hippel, T., et al. 2009, ApJ, 693, 697.
- Renedo et al. (2010) Renedo, I., Althaus, L. G., Miller Bertolami, M. M., et al. 2010, ApJ, 717, 183.
- Snowden et al. (2004) Snowden, S. L., Collier, M. R., & Kuntz, K. D. 2004, ApJ, 610, 1182.
- Snowden et al. (2008) Snowden, S. L., Mushotzky, R. F., Kuntz, K. D., et al. 2008, A&A, 478, 615.
- Swan et al. (2019) Swan, A., Farihi, J., & Wilson, T. G. 2019, MNRAS, 484, L109.
- von Hippel & Thompson (2007) von Hippel, T. & Thompson, S. E. 2007, ApJ, 661, 477.
- von Hippel et al. (2009) von Hippel, T., Thompson, S. E., Reach, W. T., et al. 2009, Journal of Physics Conference Series, 172, 012059.
- Wilms et al. (2000) Wilms, J., Allen, A., & McCray, R. 2000, ApJ, 542, 914
- Wilson et al. (2019) Wilson, D. J., Gänsicke, B. T., Koester, D., et al. 2019, MNRAS, 483, 2941.
- Wyatt et al. (2014) Wyatt, M. C., Farihi, J., Pringle, J. E., et al. 2014, MNRAS, 439, 3371.
- Xu et al. (2014) Xu, S., Jura, M., Koester, D., et al. 2014, ApJ, 783, 79.
- Zuckerman & Becklin (1987) Zuckerman, B. & Becklin, E. E. 1987, Nature, 330, 138.
- Zuckerman et al. (2003) Zuckerman, B., Koester, D., Reid, I. N., et al. 2003, ApJ, 596, 477.