JWST unveils the brown dwarf sequence of 47 Tucanæ
Abstract
We have developed a technique to restore scientific usage in compromised (publicly-available) images collected with the James Webb Space Telescope (JWST) of the Galactic globular cluster NGC 104 (47 Tucanæ). In spite of the degradation and limited data, we were able to recover photometry and astrometry for the coolest stellar objects ever observed within a globular cluster, possibly unveiling the brightest part of the brown dwarf (BD) sequence. This is supported by: (i) proper motion membership, derived by the comparison with positions obtained from Hubble Space Telescope archival early epochs; (ii) the predicted location of the BD sequence; and (iii) the mass function for low-mass stars derived from models. Future JWST observations will provide the necessary deep and precise proper motions to confirm the nature of the here-identified BD candidates belonging to this globular cluster.
keywords:
brown dwarfs – globular clusters: individual: NGC 104.1 Introduction
Globular clusters (GCs) have always been fundamental benchmarks to test models of stellar evolution, as they are formed by stars spanning a wide range of masses and with roughly the same age, chemical composition and distance. GCs are among the oldest known objects of the Milky Way and possibly in the Universe, and their properties can be determined using stellar colour-magnitude diagrams (CMDs).
The Hubble Space Telescope (HST) has made significant contributions to our understanding of these systems, both in the Galactic (e.g., Bedin et al. 2004; Piotto et al. 2007) and extra-galactic context (Nardiello et al. 2019). With its superior resolution and infrared (IR) sensitivity we can expect that the James Webb Space Telescope (JWST) will also greatly enhance the study of GCs. Arguably, the most probable finding of JWST will be the complete characterisation of GCs down to the entire lowest masses along the Main Sequence (MS), and in the so far unexplored regions of brown dwarfs (BDs).
BDs are objects that do not have enough mass to fuse Hydrogen in their cores and instead contract to the size of Jupiter, cooling and dimming over time (Hayashi & Nakano 1963; Kumar 1963). While thousands of BDs of Solar metallicity have been identified and studied near the Sun and in nearby young clusters and associations (Rebolo et al. 1995; Kirkpatrick et al. 2019; Best et al. 2021), they have not yet been observed in GCs despite dedicated searches (Dieball et al. 2016, 2019). Identifying BDs in old and metal-poor GCs would greatly improve our knowledge of BDs and GCs. Indeed, the chemical composition of BDs has a major impact on their properties. For example, the mass at the Hydrogen burning limit (HBL) is set by the internal opacity and metallicity: metal-free BDs have higher HBL mass (0.090 ) than BDs of Solar abundance (0.072 ; Saumon et al. 1994). Cooling is also affected by the chemical composition through opacity. Low temperatures allow for the formation of complex molecules in BDs’ atmospheres, which in turn, affect significantly their spectra (Birky et al. 2020). As BDs cool down (i.e., age), they increasingly separate in luminosity from stars. In the case of the extreme ages of GCs (10 Gyrs), a significant gap in luminosity is expected, the width of which depends on the interior equation of state and low-temperature fusion processes. Studies of GCs with the HST have identified the beginning of this gap, but the most massive BDs (the brightest) at the bottom of the gap have not been detected yet. It is expected that the capabilities of JWST will reach these BDs in GCs, allowing for an independent measurement of the age of GC populations through the HBL gap (Caiazzo et al. 2017; Caiazzo et al. 2019).
Concerning the multiple population phenomenon observed within GCs (Piotto et al. 2015; Nardiello et al. 2015, 2018a; Bastian et al. 2019), particularly in the most massive and dynamically less evolved ones (Bedin et al. 2004; Piotto et al. 2007; Siegel et al. 2007), BDs can provide important information. Indeed, BDs are highly sensitive to variations in composition and can serve as amplifiers of these differences, which can help to fine-tune models of the atmospheres of ultra-cool stars and sub-stellar objects of different masses, ages, and chemical properties. This can help relate the properties of observed stellar populations at higher masses, in order to better understand the observed differences in chemical compositions among multiple generations of stars, which are not yet fully understood (Renzini et al. 2015).
In this letter, we derived photometry and astrometry for the coolest stellar objects ever observed in a GC, possibly unveiling for the first time the brightest part of the BD sequence in a GC.
2 Observations and data reduction
The data employed in this paper are JWST public archival material which was compromised by technical problems. The program is GO-2560 (PI: Marino) which focus on characterizing multiple stellar populations in very-low mass M-dwarfs of the relatively close and massive Galactic GC 47 Tucanæ (NGC 104). Visit 13 of GO-2560 suffered of a guide star acquisition failure, that has resulted in imperfect images. These images were judged unsuitable for the main science of that program and requested (and approved) to be repeated in June 2023. The discarded data, according to STScI policies, becomes immediately public.
The data for this article was collected using the Near Infrared Camera (NIRCam) on JWST and centred on a region located about 6 arcmin from the 47 Tuc’s centre. The observations took place on July 13–14, 2022 and utilised two filters: F115W (short wavelength) and F322W2 (long wavelength); 40 exposures of 1030.7s were taken with each filter, using the DEEP8 readout mode. The observations were collected with two large dithers to fill gaps between the detectors within a module, but not the gap between the two modules.
In our efforts to extract optimal astrometric and photometric capabilities of JWST cameras (Nardiello et al. 2022; Griggio et al. 2022), we searched the archive for dense stellar fields, and quickly realised that these failed images are an optimal benchmark to test our algorithms. Our procedures derive completely empirical effective PSFs (ePSFs) of any shape, and rely on well-characterised geometric distortion for the cameras. In the following, we briefly describe the data reduction. First, taking advantage of the large dithers of the images and of the geometric distortion solution obtained by Griggio et al. (2022), we extracted a grid of library ePSFs both for the F115W and F322W2 filters, following the procedure described by Nardiello et al. (2022). By using the brightest and most isolated stars in each image, we perturbed the ePSFs to take into account their time variations and we used them to obtain positions and fluxes of the sources detected in any given image (we refer to this as first-pass photometry). For each filter, we transformed positions and magnitudes in a common reference frame, defined by the Gaia DR3 catalogue (Gaia Collaboration et al. 2021) and the first image in each filter. We used images, perturbed ePSFs, and transformations to carry out the so-called second-pass photometry, by using the KS2 software, developed by J. Anderson (Anderson et al., 2008), which was employed and described in several works (e.g., Bellini et al. 2017; Nardiello et al. 2018b; Scalco et al. 2021), and here adapted to NIRCam images. This routine, analysing all images simultaneously in a consistent reference frame, allows us to go deeper than the first-pass photometry and to detect extremely faint sources which would be otherwise lost in the noise of individual exposures. We carefully cleaned the final catalogue from the artifacts and bad sources (in part due to the imperfection of the images) by using the quality parameters output of the KS2 routine (Anderson et al., 2008). Calibration of the instrumental magnitudes were obtained as in Nardiello et al. (2022).
In this study, we made also use of the partially overlapped HST Wide Field Camera 3 (WFC3) optical and IR observations collected during the GO-11677 (PI: Richer, Kalirai et al. 2012) in F606W, F110W, and F160W. Astro-photometric catalogues were obtained from this data-set following the data reduction procedure described by Nardiello et al. (2018b) and Bedin & Fontanive (2018, 2020).
3 Colour-magnitude diagrams & motions
In spite of the degradation suffered by these JWST images, our procedures were able to recover exquisite photometry and astrometry, which allowed us to undertake an independent investigation –on a quite different subject– off the nominal main goal of program GO-2560. In this paper we present our study of the BDs of 47 Tuc.
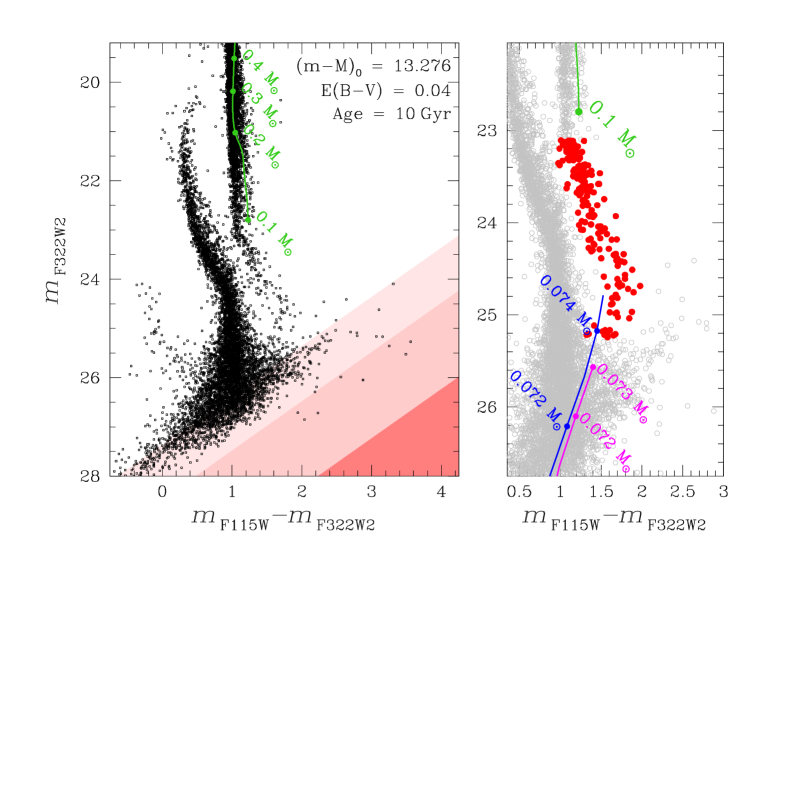
In left-panel of Figure 1 we show the versus CMD for the all stars in the field, where the cluster’s lower MS, the white dwarf (WD) sequence, and the Small Magellanic Cloud (SMC) MS are all well populated and clearly defined. Shaded regions show the 1, 3, 5 floor-noise level (computed as described in Bedin et al. 2023). We overlapped (in green) a BaSTI-IAC 10 Gyr isochrone (Hidalgo et al. 2018; Pietrinferni et al. 2021) to the MS of 47 Tuc. We used the distance modulus tabulated by Vasiliev & Baumgardt (2021) and the reddening as reported by Harris (1996). Beside usual uncertainties of models in reproducing the observed very low-mass MS stars, it is also clear that the lower MS of 47 Tuc (down to ) is far from being well represented by a single stellar population (as expected). A more detailed analysis of the multiple population phenomenon in the lower MS of 47 Tuc will be the subject of a future article (Nardiello et al. in prep.). These theoretical models end at the lower limit at magnitude .
In right-panel of Fig. 1 we highlighted in red the stars that are likely cluster members and have masses . To interpret the sub-stellar objects we employed the BD tracks by Phillips et al. (2020, ATMO2020) and computed 10 Gyr isochrones for solar-metallicity BDs (being not available to us BDs models at 47 Tuc metallicities). The line in blue shows the isochrone obtained from chemical equilibrium atmosphere (CEQ) models, while the one in magenta shows the one obtained employing atmosphere with non-equilibirum chemistry and ‘strong’ mixing (NEQ strong). Although these models do not reflect the exact chemistry of the stars in 47 Tuc, it is possible to note that the most massive BDs () positions on the CMD are consistent with the observed sources highlighted in red.
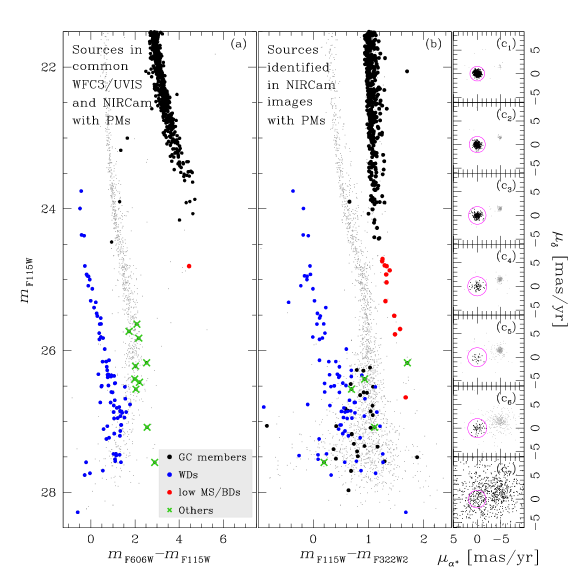
In order to verify the cluster membership of these low-mass stars (indicated in red in Fig. 1), and the membership of even fainter stellar-object (which are completely lost in the MS of the SMC in these CMDs), we reduced deep HST observations collected with the WFC3 (see Sect. 2). These early epochs, along with the new JWST positions, were then employed to compute the relative proper motions (PMs) as in Bedin et al. (2014), by using 47 Tuc’s stars as reference system for the motion, and MS stars as reference for the local transformations. The average temporal baseline between the two epochs is years. The resulting PMs are reported in panels (c) of Fig. 2: we selected the likely cluster members by tagging the stars inside the magenta circles as sources with a proper motion in agreement with the cluster motion. Very red, cool objects are not visible in the versus CMD, and we used this CMD (panel (a) of Fig. 2) to identify, among the likely cluster members, the WDs (in blue) and other faint objects that can not be low MS stars/BDs (in green). In panel (b) we show the stars for which we have proper motions; likely WDs and other objects are marked as in panel (a), while with a red circle we highlighted stars and candidate BDs.
In the next section we compare the observed CMDs with synthetic CMDs obtained from theoretical models.
4 Comparison with theoretical isochrones
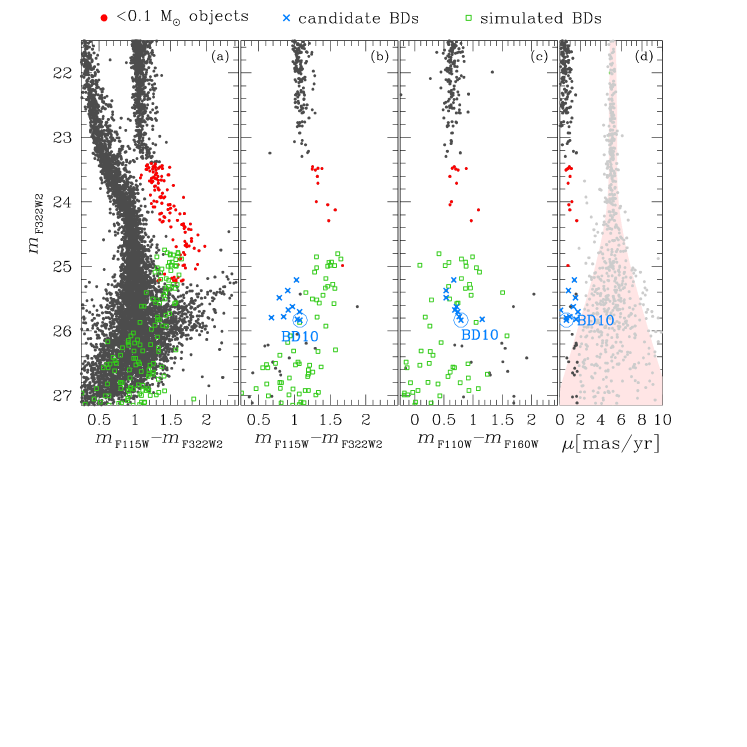
To obtain a qualitative estimate of the expected number of BDs at different magnitudes and their approximate location in the CMD, we first derived the mass-function (MF) for the observed MS stars, employing the BaSTI-IAC models. The derived masses turned-out to be rather flat in the mass range 0.15-0.35 M⊙. We then extrapolated this derived flat MF value down to the BDs mass range (0.015-0.075 M⊙), and computed a synthetic CMD (ignoring completeness) by employing the only BD isochrones at our disposal (described in previous section), which however are for Solar metallicity. To generate the synthetic CMD we proceeded as follows: we first generated a random in the interval [,] following a uniform distribution. For each random mass we associated a magnitude in the JWST and HST filters using the BDs models, linearly interpolating between the two nearest theoretical points. We then added a random noise in magnitude with errors as estimated from the real data.
Synthetic BDs are shown with green symbols (squares) in
Fig. 3, while the observed sources with black points.
Panel (a) shows all the observed stars, while panels (b) and (c) only
the sub-sample of the observed stars with an estimate for the PMs, for
the CMDs versus
(JWST-only) and versus (HST-only), respectively.
Finally, panel (d) shows the combined 2-D proper motions as a function
of JWST’s magnitude .
This panel reveals an almost-perfect separation between field objects
(mainly SMC stars) and cluster members down to , below which the membership become less clear.
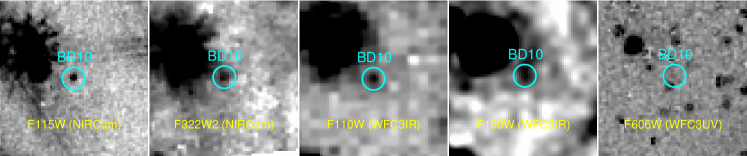
We have identified (and highlighted with azure crosses) a group of ten
sources, which had proper motion consistent with the cluster’s mean
motion, survived to all the selections and were located in the area of
the CMDs where BDs with mass of are expected
(synthetic BDs in green). We can also exclude that these objects are
foreground BDs, as those would be close-by, with considerably large
dispersion and high proper motions.
In summary, in this observational effort, we have employed compromised public images collected with NIRCam at the focus of JWST, recovering exquisite photometry and astrometry that enable scientific investigations. We used our reduced data to explore the faintest stellar objects in a field of 47 Tuc, where we isolated a group of 10-objects that we identify as candidate BD members of 47 Tuc. Their membership is supported by the following arguments: (i) their PMs are consistent with them being cluster members; (ii) their location on CMD is qualitatively consistent with the expected location by approximate models; and finally, (iii) the observed number of candidate BDs is consistent with the simulated number obtained extrapolating the MS MF into the BD domain, also considering all the uncertainties (models, MF extrapolated, completeness, etc.).
Only adequate JWST follow-up observations will be able to confirm the nature of these BD candidates as true members of 47 Tuc, by means of multi-wavelength deep observations and JWST-only derived proper-motion.
Acknowledgements
The authors thank the anonymous referee for carefully reading the manuscript and for the useful suggestions. DN, MG, and LRB acknowledge support by MIUR under PRIN program #2017Z2HSMF and by PRIN-INAF 2019 under program #10-Bedin. This work is based on observations made with the NASA/ESA/CSA JWST. The data were obtained from the Mikulski Archive for Space Telescopes at the Space Telescope Science Institute, which is operated by the Association of Universities for Research in Astronomy, Inc., under NASA contract NAS 5-03127 for JWST. These observations are associated with program GO-2560 (PI: Marino). This research is also based on observations made with the NASA/ESA Hubble Space Telescope obtained from the Space Telescope Science Institute, which is operated by the Association of Universities for Research in Astronomy, Inc., under NASA contract NAS 5–26555. These observations are associated with the program GO-11677 (PI: Richer). This work has made use of data from the European Space Agency (ESA) mission Gaia (https://www.cosmos.esa.int/gaia), processed by the Gaia Data Processing and Analysis Consortium (DPAC, https://www.cosmos.esa.int/web/gaia/dpac/consortium). Funding for the DPAC has been provided by national institutions, in particular the institutions participating in the Gaia Multilateral Agreement.
Data Availability
The data underlying this article are publicly available in the Mikulski Archive for Space Telescopes at https://mast.stsci.edu/. As electronic material, we provide coordinates and magnitudes, for the 47 Tuc’s BD candidates identified in this work (see also Table 1).
| ID | ||||||
|---|---|---|---|---|---|---|
| (deg.) | (deg.) | |||||
| BD01 | 5.62526350 | 72.17662930 | 26.23 | 25.21 | 25.77 | 25.10 |
| BD02 | 5.63161207 | 72.15088600 | 26.27 | 25.48 | 26.10 | 25.56 |
| BD03 | 5.65459538 | 72.16556903 | 26.28 | 25.37 | 26.45 | 25.92 |
| BD04 | 5.60850256 | 72.16865613 | 26.47 | 25.79 | 26.29 | – |
| BD05 | 5.69237883 | 72.17938380 | 26.58 | 25.67 | 26.50 | 25.81 |
| BD06 | 5.60578561 | 72.15298701 | 26.59 | 25.62 | 26.68 | 25.96 |
| BD07 | 5.59451482 | 72.17008771 | 26.62 | 25.77 | 26.70 | 25.94 |
| BD08 | 5.58150990 | 72.16819902 | 26.77 | 25.70 | 27.56 | 26.82 |
| BD09 | 5.63124706 | 72.15303712 | 26.85 | 25.81 | 27.24 | 26.08 |
| BD10 | 5.62582295 | 72.15644952 | 26.90 | 25.83 | 26.82 | 26.03 |
References
- Anderson et al. (2008) Anderson J., et al., 2008, AJ, 135, 2055
- Bastian et al. (2019) Bastian N., et al., 2019, MNRAS, 489, L80
- Bedin & Fontanive (2018) Bedin L. R., Fontanive C., 2018, MNRAS, 481, 5339
- Bedin & Fontanive (2020) Bedin L. R., Fontanive C., 2020, MNRAS, 494, 2068
- Bedin et al. (2004) Bedin L. R., Piotto G., Anderson J., Cassisi S., King I. R., Momany Y., Carraro G., 2004, ApJ, 605, L125
- Bedin et al. (2014) Bedin L. R., Ruiz-Lapuente P., González Hernández J. I., Canal R., Filippenko A. V., Mendez J., 2014, MNRAS, 439, 354
- Bedin et al. (2023) Bedin L. R., et al., 2023, MNRAS, 518, 3722
- Bellini et al. (2017) Bellini A., Anderson J., Bedin L. R., King I. R., van der Marel R. P., Piotto G., Cool A., 2017, ApJ, 842, 6
- Best et al. (2021) Best W. M. J., Liu M. C., Magnier E. A., Dupuy T. J., 2021, AJ, 161, 42
- Birky et al. (2020) Birky J., Hogg D. W., Mann A. W., Burgasser A., 2020, ApJ, 892, 31
- Caiazzo et al. (2017) Caiazzo I., Heyl J. S., Richer H., Kalirai J., 2017, arXiv e-prints, p. arXiv:1702.00091
- Caiazzo et al. (2019) Caiazzo I., et al., 2019, BAAS, 51, 521
- Dieball et al. (2016) Dieball A., Bedin L. R., Knigge C., Rich R. M., Allard F., Dotter A., Richer H., Zurek D., 2016, ApJ, 817, 48
- Dieball et al. (2019) Dieball A., Bedin L. R., Knigge C., Geffert M., Rich R. M., Dotter A., Richer H., Zurek D., 2019, MNRAS, 486, 2254
- Gaia Collaboration et al. (2021) Gaia Collaboration et al., 2021, A&A, 649, A1
- Griggio et al. (2022) Griggio M., Nardiello D., Bedin L. R., 2022, arXiv e-prints, p. arXiv:2212.03256
- Harris (1996) Harris W. E., 1996, AJ, 112, 1487
- Hayashi & Nakano (1963) Hayashi C., Nakano T., 1963, Progress of Theoretical Physics, 30, 460
- Hidalgo et al. (2018) Hidalgo S. L., et al., 2018, ApJ, 856, 125
- Kalirai et al. (2012) Kalirai J. S., et al., 2012, AJ, 143, 11
- Kirkpatrick et al. (2019) Kirkpatrick J. D., et al., 2019, ApJS, 240, 19
- Kumar (1963) Kumar S. S., 1963, ApJ, 137, 1121
- Nardiello et al. (2015) Nardiello D., et al., 2015, MNRAS, 451, 312
- Nardiello et al. (2018a) Nardiello D., et al., 2018a, MNRAS, 477, 2004
- Nardiello et al. (2018b) Nardiello D., et al., 2018b, MNRAS, 481, 3382
- Nardiello et al. (2019) Nardiello D., Piotto G., Milone A. P., Rich R. M., Cassisi S., Bedin L. R., Bellini A., Renzini A., 2019, MNRAS, 485, 3076
- Nardiello et al. (2022) Nardiello D., Bedin L. R., Burgasser A., Salaris M., Cassisi S., Griggio M., Scalco M., 2022, MNRAS, 517, 484
- Phillips et al. (2020) Phillips M. W., et al., 2020, A&A, 637, A38
- Pietrinferni et al. (2021) Pietrinferni A., et al., 2021, ApJ, 908, 102
- Piotto et al. (2007) Piotto G., et al., 2007, ApJ, 661, L53
- Piotto et al. (2015) Piotto G., et al., 2015, AJ, 149, 91
- Rebolo et al. (1995) Rebolo R., Zapatero Osorio M. R., Martín E. L., 1995, Nature, 377, 129
- Renzini et al. (2015) Renzini A., et al., 2015, MNRAS, 454, 4197
- Saumon et al. (1994) Saumon D., Bergeron P., Lunine J. I., Hubbard W. B., Burrows A., 1994, ApJ, 424, 333
- Scalco et al. (2021) Scalco M., et al., 2021, MNRAS, 505, 3549
- Siegel et al. (2007) Siegel M. H., et al., 2007, ApJ, 667, L57
- Vasiliev & Baumgardt (2021) Vasiliev E., Baumgardt H., 2021, MNRAS, 505, 5978
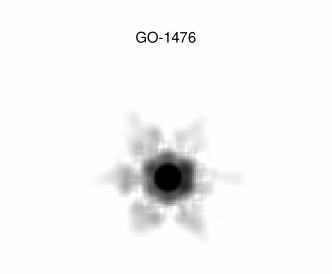
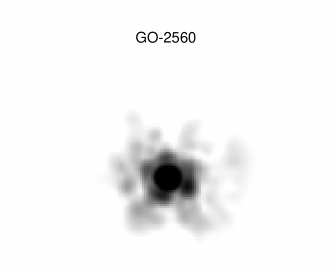
Appendix A Astro-ph bonus: compromised PSFs versus real PSFs
As reported in Sect. 2, the data used in this work was compromised by technical problems. These problems translate in stellar shapes totally different from the real ones. In Fig. 5 we report the comparison between the same ePSF of the detector A1 obtained both with the compromised data from the GO-2560 and with the good data of the Large Magellanic Cloud from GO-1476. The differences between the two PSFs are clear.