2 Astrophysics Research Center and Ulupınar Observatory, Çanakkale Onsekiz Mart University, TR-17100, Çanakkale, Türkiye
3 Department of Space Sciences and Technologies, Faculty of Science, Çanakkale Onsekiz Mart University, Terzioğlu Kampüsü, TR-17100, Çanakkale, Türkiye
4 Department of Physics, Faculty of Science, Çanakkale Onsekiz Mart University, Terzioğlu Kampüsü, TR-17100, Çanakkale, Türkiye
5 Department of Physics, University of Johannesburg, PO Box 524, Auckland Park 2006, South Africa
First detailed study of two eccentric eclipsing binaries:
TYC 5378-1590-1 and TYC 8378-252-1
Aims: The analysis of combined photometry and spectroscopy of eccentric eclipsing binary systems facilitates the derivation of very precise values for a large ensemble of physical parameters of the component stars and their orbits, thereby providing stringent tests of theories of stellar structure and evolution. In this paper two eccentric eclipsing binary systems, TYC 5378-1590-1 and TYC 8378-252-1, are studied in detail for the first time.
Methods: Radial velocities were obtained using cross-correlation methods applied to mid-resolution spectra covering almost the entire orbital phase domains of these two systems. TESS photometry was used for the analysis of TYC 5378-1590-1, whereas ASAS-SN photometry was used for the analysis of TYC 8378-252-1.
Results: We obtained the first precise derivation of the physical parameters of these systems. Both systems display moderately eccentric orbits ( and ) with periods of 3.73235 and 2.87769 days, respectively. The apsidal motion is very slow, with a duration of several centuries for both systems. We present two models for the apsidal motion of TYC 5378-1590-1. The internal structure constant derived from observations for TYC 8378-252-1 is approximately lower than theoretical predictions. We discuss possible reasons for this discrepancy. Our analysis indicates that the components of both systems are on the main sequence. The components of TYC 5378-1590-1 are relatively young stars (age Myr) close to the ZAMS, whereas the components of TYC 8378-252-1 are relatively old stars (age Gyr) close to the TAMS. Our finding that the circularization timescale for TYC 5378-1590-1 is times longer than its evolutionary age is compatible with circularization theory; however, our finding that the evolutionary age of TYC 8378-252-1 is approximately ten times longer than the circulation age, while its orbital eccentricity is quite high (), challenges the present theories of circularization.
Key Words.:
stars: binaries: eclipsing – stars: binaries: spectroscopic – stars: fundamental parameters1 Introduction
The importance of eclipsing binaries for advancing our understanding of stellar structure and evolution was reviewed by Southworth (2012). Eccentric eclipsing binaries contribute particular insights in this respect (see, e.g., Claret, 2019). For eccentric systems, high-precision photometry from TESS (Ricker et al., 2015) enables tests of relativistic predictions of apsidal motion to be performed with unprecedented accuracy (Baroch et al., 2021). A recent study (Kim et al., 2018) implied a possible relation between the orbital period and the apsidal motion period among known systems displaying apsidal motion; however, the possibility of observational bias in this respect has not been discounted. Notwithstanding this caveat, the existence of a hard upper limit to the eccentricity (which is a function of the orbital period) has been firmly established in the observed period-eccentricity () diagram. The appearance of the observational diagram corresponds to theoretical expectations based on the dynamics of the tidal circularization process; however, tidal effects are expected to have diverse impacts on early- and late-type stars because of their differing internal structures. A corresponding divergence between the behavior of eclipsing systems composed of hot stars and systems composed of cool stars was demonstrated recently (Van Eylen et al., 2016). These statements call for an expansion of the number of eccentric systems for which physical parameters can be obtained with high precision, so that theoretical models may be assessed more incisively. In this study, we present a study of two previously unexplored eclipsing eccentric systems, using both photometry and spectroscopy.
2 Sources of data
The data for TYC 5378-1590-1 and TYC 8378-252-1 were obtained partly from dedicated observational campaigns on these stars. This is specifically true of the spectroscopic data, where several dozen radial velocity observations were obtained during multi-year campaigns using the Cassegrain-mounted spectrograph on the 1.9m telescope at the South African Astronomical Observatory (SAAO).
2.1 Spectroscopy


Spectroscopic observations of TYC 5378-1590-1 and TYC 8378-252-1 were conducted with the Spectrograph Upgrade: Newly Improved Cassegrain (SpUpNIC) instrument (see Crause et al., 2016, 2019, for details) mounted at the Cassegrain focus of the 1.9m telescope at the SAAO.
We selected grating 4 of the spectrograph. This 1200 lines/mm grating has a wavelength coverage of 400 – 525 nm with a blaze peak at 510 nm and a resolution of 0.062 nm/px (corresponding to a resolution of approximately 80 km s-1 in radial velocity and an approximate resolving power at the wavelength of the H line). The wavelength range between 400 and 525 nm provided a spectral interval that allowed an accurate derivation of radial velocities (RVs) of both components on most of the spectra obtained. We used a slit width of 1.35 arcsec for all spectroscopic observations of the two eclipsing systems and the associated RV standards, which were observed contemporaneously. A total of 62 and 86 spectra were obtained for TYC 5378-1590-1 and TYC 8378-252-1, respectively, across the 2019, 2020, and 2021 observing seasons.
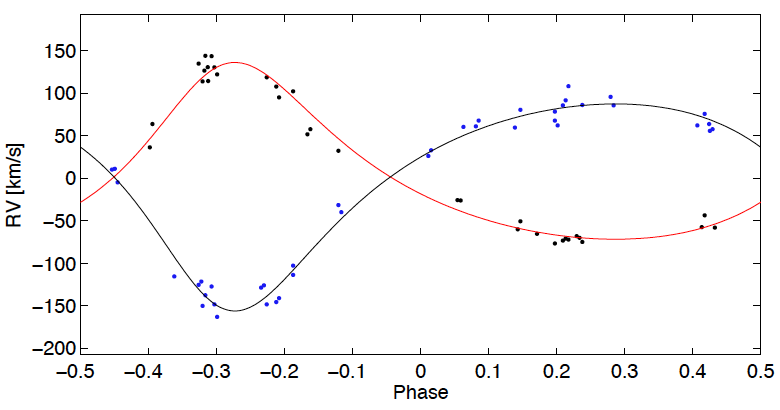
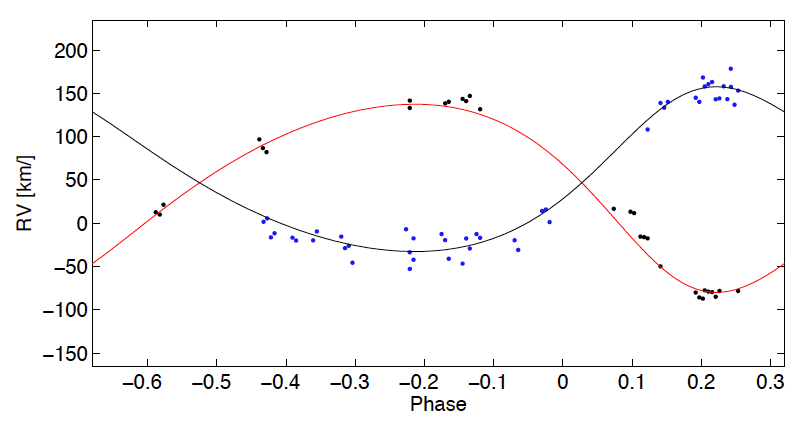
HR 3383 (A1V, km ) and HR 6031 (A1V, km ) were observed contemporaneously as standard stars for the RV measurements of the two binary systems. The exposure times were set at the maximum feasible value of 1200 seconds for each spectrum because of the faintness of the two targets (exposure times longer than 1200 s are usually compromised by a high frequency of cosmic ray events in the spectra at the SAAO site). The relatively large errors in the measured RV values (see Figs. 3 and 7) are predominantly the result of this upper limit on the feasible exposure time for these two relatively faint targets. Arc spectra using a Cu-Ar lamp were taken as comparison spectra before and after each stellar spectrum. A set of quartz-iodine lamp images was also taken every night for flat-field calibrations. Standard IRAF procedures were used for the spectral data reduction and calibrations.
An example of the observed spectra for each of TYC 5378-1590-1 and TYC 8378-252-1 is shown in Fig. 1. The sample spectra in Fig. 1 were selected from the conjunction phases of the components, with the more massive component transiting in front of the less massive component in each instance. The characteristic lines of early A-type stars are seen in the spectrum of TYC 5378-1590-1, whereas the characteristic lines of middle F-type stars are seen in the spectrum of TYC 8378-252-1.
2.2 Radial velocities
The cross-correlation method was applied to derive RVs of the component stars of these two eccentric binaries, using the IRAF package Fxcor (Tonry & Davis, 1979; Popper & Jeong, 1994). The spectral region around the Mg II (4481) line, which is the most prominent line apart from the hydrogen Balmer lines (see Fig. 1), was used for the RV calculations of TYC 5378-1590-1 (with spectral type A0V). For TYC 8378-252-2 (with spectral type F4/5V), the spectral range from 4360 to 4800 Å containing Mg II (4384, 4481, and 4668) and Fe I (4383) lines was used for the RV calculations. The spectra of HR 6031 and HR 3383 were used as a template for deriving the RVs of the binary components. The calculated RVs obtained from the cross-correlation method are depicted in Figs. 3 and 7 and are listed in Tables 5 and 6 in Appendix A for TYC 5378-1590-1 and TYC 8378-252-1, respectively.
2.3 Photometry
Our spectroscopic data were obtained from our own long-term observing campaigns; instead, we drew the photometric data primarily from open surveys, satellite missions, and other long-term databases. We relied primarily on TESS satellite data (Ricker et al., 2015) for TYC 5378-1590-1. We used the lightkurve package (Lightkurve Collaboration et al., 2018) to extract the photometry from the TESS database. For TYC 8378-252-1, we based our light curve solution exclusively on ground-based ASAS-SN data (Shappee et al., 2014; Kochanek et al., 2017).
3 Analysis
In view of the large TESS pixels (especially problematic in dense stellar fields with many neighboring stars appearing on a pixel together with the target star), coupled with artificial instrumental trends in the TESS photometry, a flattening method has to be applied to TESS data, and great caution needs to be exercised when interpreting these data and conducting consequent modeling. However, the TESS light curves constitute the best available photometric data for this system by a long margin.
The PHOEBE package, version 0.32svn (Prša & Zwitter, 2005), which was originally based on the Wilson-Devinney code (Wilson & Devinney, 1971) and applies Roche geometry, was used for our analysis of the photometric data. By virtue of the good phase coverage of both the photometric and radial velocity data for both our systems, our modeling procedure generated realistic physical parameters for both of the eclipsing components in each system, and for their mutual orbits. Only a few additional assumptions were required. The principal assumptions related to the gravity-brightening coefficients and the albedos for both stars, together with the assumption of a pseudo-synchronization of rotation in periastron for both systems; the obtained spectra were too noisy to be used for deriving the actual rotational velocities of the components.
| Parameter | TYC 5378-1590-1 | TYC 8378-252-1 |
|---|---|---|
| (HJD) | 2453946.517 | 2451981.779 |
| (d) | 3.7323493 | 2.8776874 |
| (R⊙) | 15.88 0.07 | 11.39 0.15 |
| (km/s) | 1.38 0.45 | 46.8 1.4 |
| 0.308 0.037 | 0.193 0.012 | |
| (deg) | 18.0 7.1 | 142.7 8.3 |
| 0.853 0.008 | 1.14 0.04 | |
| (deg) | 85.52 0.06 | 87.08 0.26 |
| (K) | 9800 (fixed) | 6308 209 |
| (K) | 8824 87 | 6600 (fixed) |
| 9.344 0.019 | 8.637 0.036 | |
| 9.549 0.015 | 8.421 0.062 | |
| (mean) | 0.16 0.01 | 0.14 0.01 |
| (mean) | 0.22 0.01 | 0.16 0.01 |
| (TESS) | 0.55 0.02 | – |
| (TESS) | 0.33 0.02 | – |
| (TESS) | 0.12 0.05 | – |
| (ASAS-SN g) | – | 0.43 0.03 |
| (ASAS-SN g) | – | 0.57 0.03 |
| , | 0.78, 0.27 | 0.55, 0.22 |
| , | 0.59, 0.29 | 1.18, 0.23 |
| Parameter | TYC 5378-1590-1 | TYC 8378-252-1 |
|---|---|---|
| (HJD) | ||
| (d) | ||
| (deg) | ||
| (deg yr-1) | ||
| (yr) | 10000 |
3.1 TYC 5378-1590-1
TYC 5378-1590-1 (= 2MASS J06454395-0850355 = TIC 120023539, RA 06h 45m 43.95s DE -08∘ 50′ 35.50′′, V = 10.9 mag) is a known eccentric eclipsing system. However, its properties were derived very approximately in previous studies. The system was first identified as an eccentric eclipsing system with a correct orbital period by Martignoni (2013). The system was included in our previous study (Zasche et al., 2018), where we used the poor photometric data from the discovery paper and no spectroscopy. In that study a very slow rate of apsidal motion and an eccentricity of 0.32 were derived for the system.
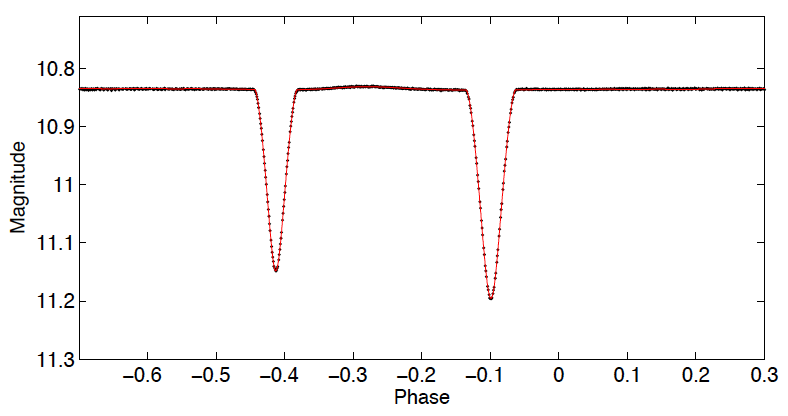
Our present study addresses this system with far superior TESS data and a longer time span of photometric observations, and with the recent spectroscopy obtained as part of our long-term campaigns from 2019 to 2021. The results of our fitting procedure are listed in Table 1 and plotted in Figs. 2 and 3. The fit of the TESS data is superb. The RV data are much noisier (for the reasons mentioned earlier), but still present valuable information for inclusion in our analysis.
The solution presented in Table 1 was derived from our combined fit using both LC and RV data together and constitutes a statistically meaningful result. A significant contribution of third light emerged from the TESS data, in addition to the fluxes from the two main components. This effect was caused by the relatively large TESS pixels, which allowed nearby stars unrelated to the TYC 5378-1590-1 system to contribute flux to the same pixels as the main target. We cannot speculate about any third body in the system since no variation in the diagram is visible (see below).
Three different methods were used to determine the effective temperatures of the components of TYC 5378-1590-1, a system that has not been widely covered in the literature (e.g., it had no assigned spectral type prior to this study). First, the color index of , which was derived from the Høg et al. (2000) study, shows that the spectral type of the system is close to A0. Second, the solution of the RV curves obtained in the present study corresponds to a mass of the primary component of approximately 2 M⊙, which is in agreement with a spectral type of A0. Third, using the line-matching method, especially for the H, H, and Mg II 4481 lines in the observed spectra of the components and the sample spectra of the early A-type main-sequence stars in the Gray & Corbally (2008) book, the spectral type of the system was estimated to be close to A0. Based on these results, we adopted a temperature of K, corresponding to a spectral type of A0V in the calibrated data of Pecaut & Mamajek (2013). The effective temperature of the primary component, which has a higher mass according to the solution for the RV curves, was taken as 9800 K, and this value was fixed in the WD iterations, whereas the effective temperature of the secondary component was adjusted during iterations.
As we discuss in Section 4.2, both eclipsing components appear to be normal stars located on the main sequence, most likely of spectral types A0 and A3. The primary component might be slightly smaller in volume than expected for a typical A0V star, while the secondary appears slightly hotter than a typical A3V star. The locations of the two components on the main sequence correspond with the young ages implied by the presence of an eccentric orbit.
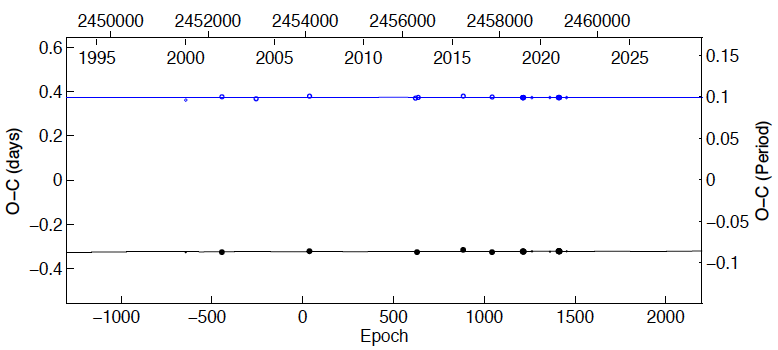
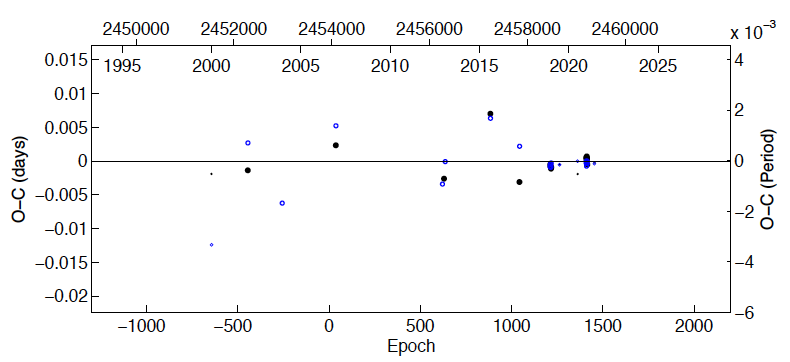
Using all available photometric data for the star TYC 5378-1590-1, we also performed a period analysis using the longest possible time interval. The data added to those used in our former study (Zasche et al., 2018) were primarily composed of the TESS observations, supplemented by more recent ASAS-SN data. However, our results indicate only a slight evolution of the apsidal angle , meaning that the apsidal motion occurs at a very slow rate (on the order of thousands of years). No additional trend is visible in the residuals, which are perfectly symmetric in their distribution (see Fig. 5).
3.2 TYC 8378-252-1
TYC 8378-252-1 (= ASAS J185951-4711.8, RA 18h 59m 51.29s DE -47∘ 11′ 47.59′′, V = 11.2 mag) has been mentioned only briefly as an eclipsing binary system in prior work based on survey data from CRTS and ASAS. It was also included in our previous study (Zasche et al., 2018), where we derived an eccentricity of for its orbit, and slow apsidal motion with yr. A more detailed analysis of this star has not been published to date.
The star was checked in various databases for photometric indices or any other indication of its color or effective temperature. Markedly different values were obtained from various sources, for example, K (Stevens et al., 2017), K (Bai et al., 2019), and K (Ammons et al., 2006). Similar discrepant values were found for its distance. For example, Ammons et al. (2006) presented the star’s distance as 51 pc, whereas GAIA EDR3 (Gaia Collaboration, 2020) presents a distance of 670 pc.
Therefore, three methods (as for the temperature determination of TYC 5378-1590-1) were applied to determine the surface temperature of TYC 8378-252-1. First, according to the color index of derived from the study of Høg et al. (2000), both components are thought to be late F-type main-sequence stars. Second, the solution of the RV curves obtained in this study corresponds to a mass of the more massive (secondary) component of approximately 1.3 M⊙, which implies a spectral type close to F5V. Third, using the line matching method for the H, H, Ca I (4226), Mg II (4481), Fe I (4383, 5041), Fe II (4923), and Mg I (5167 - 5183) triplet lines, and using the (CH) G band (see Fig. 1 for TYC 8378-252-1) in the spectra observed at the conjunction phases of the secondary component and the sample spectra of the middle F-type main-sequence stars in the book by Gray & Corbally (2008), the spectral type of the secondary component was estimated as F5V. Based on these results, we assigned a temperature corresponding to a spectral type of F5V, equal to K, according to the calibrated data of Pecaut & Mamajek (2013). The preliminary solution of the ASAS-SN light curves indicated that the light contribution of the secondary component is dominant. The secondary component also has a higher mass according to the solution of the RV curves. Therefore, the temperature of the secondary component () was fixed at 6600 K, and the temperature of the primary component () was adjusted in the iterations.
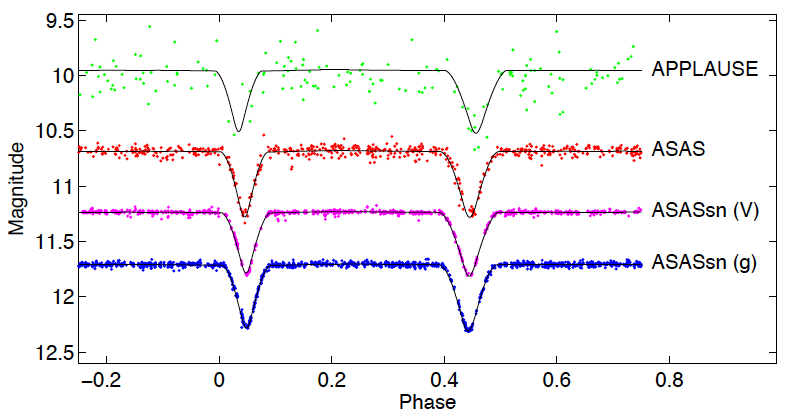
No TESS photometry for this system is yet available (TESS will observe the system in July 2023), and the existing photometry is of low quality. However, we used the best available photometric data obtained by the ASAS-SN survey in its filter for a photometric analysis. We fitted these data using PHOEBE together with the radial velocities (29 primary and 46 secondary velocities), resulting in the solution presented in Table 1. The fits are plotted in Figs. 6 and 7.
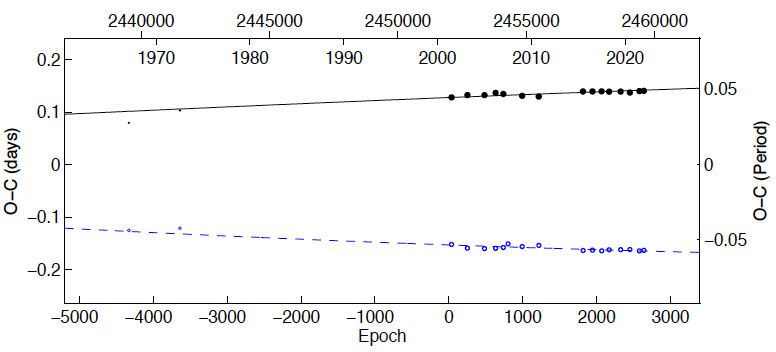
Our analysis of long-term period changes was conducted using all available photometric data. Fortunately, the star was also found in the database of old photographic plates from German observatories named APPLAUSE, available online,111https://www.plate-archive.org/query/ where the star was observed during the 1960s and 1970s. From that photometry we were able to derive (albeit with poor precision) the times of several eclipses. These data are highly important for constraining the value of the long apsidal period with a higher degree of statistical confidence. In total, we collected 19 primary and 19 secondary times of eclipses for the analysis, covering a time span of more than 50 years. However, as seen from the diagram in Fig. 8, the change in the omega angle is still very small and, accordingly, the apsidal motion is very slow. Our estimation of the period of apsidal motion is on the order of 1000 yr. Our resulting eccentricity value is 0.193, only slightly different from the value that was published by Shivvers et al. (2014), who presented the system’s orbital eccentricity as , and from our former value published in Zasche et al. (2018).

4 Discussion and conclusions
In the present era of large-scale photometric and spectroscopic surveys, the question arises of whether a dedicated study of one particular system is sufficient to produce results of astrophysical importance. We answer in the affirmative. Currently, of the more than two million known eclipsing binary systems (Watson et al., 2006; Mowlavi et al., 2022), only 288 systems have had their physical parameters derived to better than 2% accuracy (Southworth, 2015). Only a small proportion of these systems are eccentric systems. Additional statistics to augment the small present sample of eccentric systems, in the form of the P-e diagram that depicts the progress of circularization in binary systems, would provide much-needed insight into the physical processes occurring in stellar interiors, and into the orbital dynamics. We are therefore confident that this study makes an important contribution to building the statistics of well-studied eccentric systems showing apsidal motion.
4.1 Absolute parameters
The absolute parameters of binary stars are generally obtained by combining the information contained in spectroscopic and photometric data and using the appropriate laws of physics. As a first step, the masses of the components are calculated from Kepler’s third law. The fractional radii of the components (, ), obtained from the photometric data, are used to derive the absolute radii (, ). Subsequently, surface gravities (, ) are derived directly. Using the effective temperatures listed in Table 3, we computed the bolometric magnitudes () and luminosities () of the component stars of the two systems considered in the present study. We used the nominal set of solar values adopted by IAU 2015 Resolutions B2 and B3 as input in our calculations. The absolute visual magnitudes were derived from the bolometric correction formula, = – . Bolometric corrections for the components were taken from the online version of the color tabulation of Pecaut & Mamajek (2013), according to their effective temperatures.
The distance to each system was calculated from the well-known adaptation of Pogson’s law: = + 5 – 5log – . The interstellar absorption and intrinsic color index were computed using the following method. First, the total absorption towards the system in the galactic disk in the band, , was taken from Schlafly & Finkbeiner (2011), using the NASA Extragalactic Database222 http://ned.ipac.caltech.edu/forms/calculator.html. Second, the interstellar absorption corresponding to the distance to the system, , was derived from the formula given by Bahcall & Soneira (1980) (in their Eq. 8), using the system’s Gaia-DR3 parallax (Gaia Collaboration, 2022). Finally, the color excess for the system at the distance was estimated as BV = /3.1.
The distance to TYC 5378-1590-1 (with corrections for interstellar absorption) was computed as 728 60 pc using the distance modulus. When interstellar absorption was ignored, the distance was computed as 1110 80 pc. The photometric parallax formulation of Budding & Demircan (2007) produces a distance of pc. However, considering the distance provided by Gaia-DR3 (Gaia Collaboration, 2022), 1292 39 pc, the interstellar absorption for TYC 5378-1590-1 thus appears to be overestimated. This would be in agreement with only low extinction towards the star as derived by Bai et al. (2020). The different effective temperatures of the component stars play a marginal role.
For TYC 8378-252-1, the distance was calculated as 40 pc when interstellar absorption was taken into account, and was calculated as 580 50 pc when interstellar absorption was ignored. The photometric parallax formulation of Budding & Demircan (2007) produces a distance of pc. The Gaia-DR3 (Gaia Collaboration, 2022) distance for this star is provided as 670 10 pc, which is somewhat larger than the distance values calculated from the photometric data. As for the previous case, we can speculate about slightly incorrect extinction or, on the contrary, our results may be affected by larger errors than presented.
The absolute parameters of TYC 5378-1590-1 and TYC 8378-252-1 as determined by our analysis, together with their errors, are listed in Table 3.
| TYC 5378-1590-1 | TYC 8378-252-1 | |||
| Parameter | Primary | Secondary | Primary | Secondary |
| (R⊙) | 15.88 0.07 | 11.39 0.15 | ||
| (M⊙) | ||||
| (R⊙) | ||||
| log (cm s-2) | ||||
| (K) | ||||
| log (L⊙) | ||||
| (mag) | ||||
| (mag) | ||||
| (-) (mag) | 0.30 | 0.04 | ||
| - (mag) | 0.01 0.09a | 0.60 0.18a | ||
| (mag) | 10.95 0.07a | 11.18 0.12a | ||
| (mag) | 0.17 | 0.18 | ||
| (pc) | 728 60 | 550 40 | ||
| (pc) | 1292 39b | 670 10b | ||
4.2 Evolutionary status
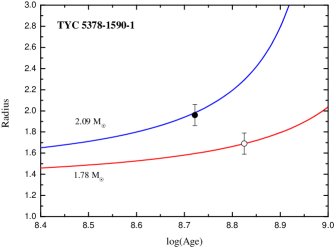
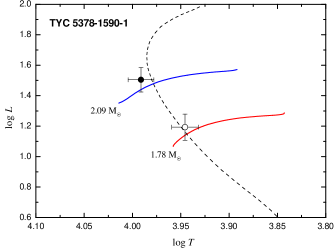
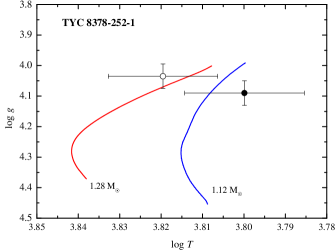
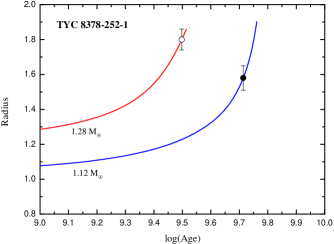
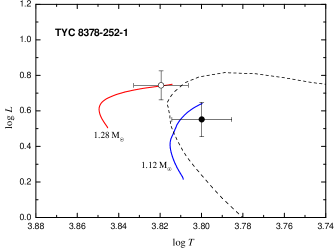
The Granada (e.g., Claret, 2006) and Padova (e.g., Bressan et al., 2012) evolution models were used to study the evolutionary status of these two eccentric binary systems, using the physical parameters listed in Table 3. The log versus log diagram and the log versus log diagram (i.e., the H-R diagram) were used to determine the metallicity values of the component stars, whereas the log (age) versus radius diagram and the H-R diagram were used to determine their ages.
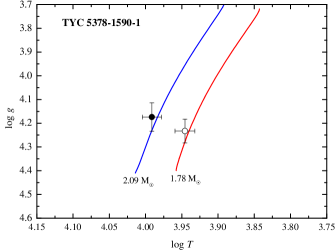
In Figs. 10 and 11, we display the evolutionary tracks of the component stars that correspond to their measured masses. The positions of the component stars indicated in the log versus log diagram and in the H-R diagram correspond to values of the metallicity for TYC 5378-1590-1 and TYC 8378-252-1 of and , respectively.
The evolutionary progression of the radii of the components of TYC 5378-1590-1 in accordance with their determined masses and are displayed in the middle panel in Fig. 10. The positions of the components are plotted according to their radii, as listed in Table 3. The calculated radius of the primary component corresponds to a log(age)=8.72 and the calculated radius of the secondary component corresponds to a log(age)=8.83. In the H-R diagram (lower panel of Fig. 10), the positions of the components determined according to their calculated physical parameters fit the isochrone of log(age)=8.73 within the error limits. We assigned the value log(age)= to TYC 5378-1590-1 (i.e., an age of Myr). This value for the age implies that the theoretical model predicts a smaller radius than the observational radius of the secondary component, as shown in the radius evolution diagram of the component stars (displayed in the middle panel of Fig. 10).
The evolutionary progression of the radii of the components of TYC 8378-252-1 in accordance with their determined masses and are displayed in the middle panel in Fig. 11. The positions of the components are plotted according to their radii, as listed in Table 3. The calculated radius of the primary component corresponds to a log(age)=9.71 and the calculated radius of the secondary component corresponds to a log(age)=9.50. According to the H-R diagram in the lower panel of Fig. 11, the positions of the components determined according to their calculated physical parameters fit the isochrone of log(age)=9.60 within the error limits. We assigned the value log(age)= to TYC 8378-252-1 (i.e., an age of Gyr). This value for the age implies that the theoretical model predicts a smaller radius than the observational radius for the primary component (the less massive component, as explained above), as shown in the radius evolution diagram of the component stars (displayed in the middle panel of Fig. 11).
4.3 Internal structure constant
In this section we describe the results of our calculations of the internal structure constants of these two eccentric binary systems, using the method and equations given by Claret et al. (2021) and references therein.
The observational apsidal motion rates were derived from the analysis in Section 3, as deg cycle-1 for TYC 5378-1590-1 and deg cycle-1 for TYC 8378-252-1.
The relativistic term in the rate of apsidal motion was calculated using the following equation, which was described by Levi-Civita (1937) and presented by Giménez (1985):
| (1) |
Here and represent the masses of the component stars in solar units, the orbital eccentricity, and the orbital period in days. Subsequently, the relativistic terms were calculated as deg cycle-1 for TYC 5378-1590-1 and deg cycle-1 for TYC 8378-252-1.
There is a remarkable result here for TYC 5378-1590-1. If we extract the classical term from the well-known equation =+, the term takes a negative value since . This scenario is often encountered in eclipsing binary systems with a very slow rate of apsidal motion (e.g., Giménez, 1985). The most famous of these examples is the system DI Her (e.g., Guinan & Maloney, 1985). Albrecht et al. (2009) observationally demonstrated that this phenomenon in DI Her is caused by misaligned spin and orbital axes of the component stars (see also Shakura 1985). We were not able to perform a similar procedure in order to show whether there is spin-axis misalignment in the components of TYC 5378-1590-1 because of our lack of access to high-resolution spectra taken at the conjunction phases of this system.
The classical term was derived as deg cycle-1 for TYC 8378-252-1, contributing approximately 82 of the observed rate of apsidal motion. Using the absolute parameters listed in Table 3, the mean observational internal structure constant of this system was calculated as .
The theoretical internal structure constants were predicted from the Granada evolution models (Claret & Giménez, 1992; Claret, 2006). The Granada models produce theoretical values of for a grid of masses, surface gravities, luminosities, effective temperatures, ages, and metallicities. Values of for each component star were calculated by interpolating between the model values and the observed physical properties listed in Table 3.
The predicted metallicities and ages of TYC 5378-1590-1 and TYC 8378-252-1 based on our analysis of Granada models are summarized in Table 4. These results were also checked against the Padova and Geneva models. Using the absolute parameters given in Table 3 (in accordance with the masses of the components and the values of and 0.007), interpolating, taking the weighted average and then the logarithm, the mean observational internal structure constants of TYC 5378-1590-1 and TYC 8378-252-1 were determined as and , respectively, from the Granada Models. These values are given in Table 4 for ease of comparison of the observational and theoretical values.
| Parameter | TYC 5378-1590-1 | TYC 8378-252-1 |
|---|---|---|
| 0.010 0.001 | 0.007 0.002 | |
| log | — | |
| log | ||
| Age (yr) | ||
| (yr) |
For TYC 5378-1590-1, log could not be calculated because the term is negative, as mentioned before, and therefore this parameter could not be entered in Table 4. As an approach to solving this problem, we started by accepting the expected result (i.e., log = log ) and used the equations given by Claret et al. (2021) to calculate the classical apsidal motion rate as = 0.00199 deg cycle-1 (hence, the period of apsidal motion as yr). Upon entering these values as input values to the analysis and repeating the iterations, we obtained deg cycle-1 (and yr). Calculations of other parameters resulted in the same values as those listed in Table 2, within the error limits. Thus, in the analysis of TYC 5378-1590-1, two different models appeared for the apsidal motion of the system: Model A with a long period of apsidal motion ( yr, ), and Model B with a short period of apsidal motion ( yr, ). In the comparison of these two models, while the values point to Model A as the most likely solution, the negative result of the classical term in this model creates a problem similar to the situation in DI Her. However, the fact that the values between these two models are not very different in terms of statistical significance prevents a definitive determination of the most realistic model from being made. In addition, the fact that the periods of apsidal motion in both models are on the order of a thousand years implies that a sufficient number of eclipse times could only be obtained in a few centuries to indicate which model is correct. Therefore, the solution to this problem for TYC 5378-1590-1 remains open-ended for the time being.
For TYC 8378-252-1, the value of predicted from the Granada models was approximately 11 larger than the observed value (that is, by ). In comparing the values of and , the absolute parameters derived from the observations are expected to be compatible with those of the evolution models and to indicate the same age for both components of a given binary star. In the case of TYC 8378-252-1 (see Sect. 4.2), in Fig. 11, for the less massive primary component, the upper and lower panels show that the evolution model predicts a temperature value greater than the observational value within the margins of error, while the middle and lower panels show that the evolution model predicts a smaller radius than the observational value. Although the age determination in the H-R diagram is accepted as log(age)=9.60 within the error limits, the middle panel also shows that the measured radii of the component stars indicate different ages for the system.
Lester & Gies (2018) pointed out that the mismatch between the observational and theoretical radii of these component stars (which translates to incompatible ages for the components) is encountered for for evolved F-type eclipsing binary components similar to TYC 8378-252-1. As Lester & Gies (2018) mentioned, convective cores have started developing in evolved F-type stars, given their mass in the range of 1.1–1.7 Msun, and given that convective core overshooting disturbs central condensation. This situation is not adequately represented in current evolution models. For example, in the case of the TYC 8378-252-1 system, the evolution model gives an internal structure constant larger than the observational value, which indicates that the components are more centrally condensed than predicted by models.
The evolutionary age of TYC 8378-252-1, which has a remarkably eccentric orbit (), is quite large, and both components appear to have evolved almost to the TAMS as main-sequence stars. This casts doubt on whether the expected orbit-circularization mechanism has been operating in this system. To investigate this problem, the circularization timescale was calculated using the Zahn (1977) theory.
Considering the spectral types (and effective temperatures) of the components of TYC 8378-252-1 (see Section 3.2), it can be accepted that these stars have convective envelopes. In this case, using Eq. (6.2) in Zahn (1977) for stars with convective envelopes and the corresponding absolute parameters in Table 3 (above), the circularization timescale was calculated as yr. Comparing the results in Table 4, since the evolutionary age of TYC 8378-252-1 is approximately ten times older than its circularization age, this binary system would be expected to have a circular orbit at present. Therefore, our results are not compatible with the predictions of the Zahn (1977) theory of circularization.
The spectral types of the components of TYC 5378-1590-1 (see Section 3.1) indicate that these stars should have convective cores and radiative envelopes. Therefore, the Claret & Cunha (1997) formulation of the Zahn (1977) theory for stars with convective cores and radiative envelopes was used to find the circularization timescale of TYC 5378-1590-1. The tidal torque constant and fractional gyration radius in the formulas were determined by interpolating, according to the mass and surface gravity of the component stars, from the Granada evolution models (Claret, 2006). Using , and , for the primary and secondary components of TYC 5378-1590-1 and the absolute parameters listed in Table 3, the equations of Claret & Cunha (1997) predict the circularization timescale to be yr. As a result, the circularization age of TYC 5378-1590-1 is approximately 200 times older than its evolutionary age and the orbit of the system is still eccentric, which shows that the observational findings for this system agree with the Zahn (1977) theory of circularization.
Acknowledgements.
This research was supported by TÜBİTAK (Scientific and Technological Research Council of Türkiye) under Grant No. 121F203. We would like to thank the Time Allocation Committee of the SAAO for ample observing time. CE and FM thank the National Research Foundation of South Africa and the University of Johannesburg for funding. Funding for APPLAUSE has been provided by DFG (German Research Foundation, Grant), Leibniz Institute for Astrophysics Potsdam (AIP), Dr. Remeis Sternwarte Bamberg (University Nuernberg/Erlangen), the Hamburger Sternwarte (University of Hamburg) and Tartu Observatory. Plate material also has been made available from Thüringer Landessternwarte Tautenburg. It is a pleasure to express our appreciation of the high quality and ready availability, via the Mikulski Archive for Space Telescopes (MAST), of data collected by the TESS mission. Funding for the TESS mission is provided by the NASA Explorer Program. The authors thank the ASAS, ASAS-SN, CRTS, NSVS and TESS teams for making all of the observations easily public available. This research has made partial use of data from the European Space Agency (ESA) mission Gaia (https://www.cosmos.esa.int/gaia), processed by the Gaia Data Processing and Analysis Consortium (DPAC, https://www.cosmos.esa.int/web/gaia/dpac/consortium). Funding for the DPAC has been provided by national institutions, in particular the institutions participating in the Gaia Multilateral Agreement. This research has partly made use of the SIMBAD and VIZIER databases, operated at CDS, Strasbourg, France, and of NASA’s Astrophysics Data System Bibliographic Services.References
- Ammons et al. (2006) Ammons, S. M., Robinson, S. E., Strader, J., et al. 2006, ApJ, 638, 1004
- Albrecht et al. (2009) Albrecht, S., Reffert, S., Snellen, I. A. G., Winn, J. N., 2009, Natur, 461, 373
- Bahcall & Soneira (1980) Bahcall J. N., & Soneira R. M., 1980, ApJS, 44, 73
- Bai et al. (2019) Bai, Y., Liu, J., Bai, Z., et al. 2019, AJ, 158, 93
- Bai et al. (2020) Bai, Y., Liu, J., Wang, Y., et al. 2020, AJ, 159, 84. doi:10.3847/1538-3881/ab63d5
- Baroch et al. (2021) Baroch, D., Giménez, A., Ribas, I., et al. 2021, A&A, 649, A64
- Bressan et al. (2012) Bressan, A., Marigo, P., Girardi, L., Salasnich, B., Dal Cero, C., Rubele, S., & Nanni, A., 2012, MNRAS, 427, 127
- Budding & Demircan (2007) Budding, E., & Demircan, O., 2007, An Introduction to Astronomical Photometry, Cambridge Univ. Press
- Claret & Giménez (1992) Claret, A., & Giménez, A., 1992, A&AS, 96, 255
- Claret & Cunha (1997) Claret, A., & Cunha, N. C. S., 1997, A&A, 318, 187
- Claret (2006) Claret, A., 2006, A&A, 453, 769
- Claret (2019) Claret, A. 2019, A&A, 628, A29
- Claret et al. (2021) Claret, A., Giménez, A., Baroch, D., Ribas, I., Morales, J. C., & Anglada-Escudé, G., 2021, A&A, 654, id.A17, 19 pp.
- Crause et al. (2016) Crause, L. A., Carter, D. Daniels, A. et al., 2016, Proceedings of the SPIE, Volume 9908, id. 990827 19 pp.
- Crause et al. (2019) Crause, L. A., Gilbank, D., Gend, Carel van et al., 2019, Journal of Astronomical Telescopes, Instruments, and Systems, Volume 5, id. 024007
- Drake et al. (2017) Drake, A. J., Djorgovski, S. G., Catelan, M., et al. 2017, MNRAS, 469, 3688
- Gaia Collaboration (2020) Gaia Collaboration 2020, VizieR Online Data Catalog, I/350
- Gaia Collaboration (2022) Gaia Collaboration, A. Vallenari, et al. (2022k) Gaia DR3: data release content and main properties. A&A, in prep.
- Giménez (1985) Giménez, A., 1985, ApJ, 297, 405-412
- Gray & Corbally (2008) Gray, R. O., & Corbally, C. J., 2008, Stellar Spectral Classification, Princeton University Press
- Guinan & Maloney (1985) Guinan, E. F. & Maloney, F. P., 1985, AJ, 90, 1519-1528.
- Høg et al. (2000) Høg, E., Fabricius, C., Makarov, V. V. et al., 2000, A&A, 355, L27
- Kim et al. (2018) Kim, C.-H., Kreiner, J. M., Zakrzewski, B., et al. 2018, ApJS, 235, 41
- Kochanek et al. (2017) Kochanek, C. S., Shappee, B. J., Stanek, K. Z., et al. 2017, PASP, 129, 104502
- Lester & Gies (2018) Lester, K. V. & Gies, D. R., 2018, AJ, 156, id. 8, 10 pp.
- Levi-Civita (1937) Levi-Civita, T., 1937, Am. J. Math., 59, 225
- Lightkurve Collaboration et al. (2018) Lightkurve Collaboration, Cardoso, J. V. de M., Hedges, C., et al. 2018, Astrophysics Source Code Library. ascl:1812.013
- Martignoni (2013) Martignoni, M. 2013, IBVS, 6100, 12
- Mowlavi et al. (2022) Mowlavi, N., Holl, B., Lecœur-Taïbi, I., et al. 2022, arXiv:2211.00929
- Pecaut & Mamajek (2013) Pecaut, M. J., & Mamajek, E. E., 2013, ApJS, 208, 9
- Pojmanski (2002) Pojmanski, G. 2002, AcA, 52, 397
- Popper & Jeong (1994) Popper, D. M., & Jeong, Y.-C., 1994, PASP, 106, 189
- Prša & Zwitter (2005) Prša, A., & Zwitter, T. 2005, ApJ, 628, 426
- Ricker et al. (2015) Ricker, G. R., Winn, J. N., Vanderspek, R., et al. 2015, Journal of Astronomical Telescopes, Instruments, and Systems, 1, 014003
- Schlafly & Finkbeiner (2011) Schlafly, E. F., & Finkbeiner, D. P., 2011, ApJ, 737, 103
- Shakura (1985) Shakura, N. I. 1985, Soviet Astronomy Letters, 11, 224
- Shappee et al. (2014) Shappee, B. J., Prieto, J. L., Grupe, D., et al. 2014, ApJ, 788, 48
- Shivvers et al. (2014) Shivvers, I., Bloom, J. S., & Richards, J. W. 2014, MNRAS, 441, 343
- Southworth (2012) Southworth, J. 2012, Orbital Couples: Pas de Deux in the Solar System and the Milky Way, 51
- Southworth (2015) Southworth, J. 2015, Living Together: Planets, Host Stars and Binaries, 496, 164
- Stevens et al. (2017) Stevens, D. J., Stassun, K. G., & Gaudi, B. S. 2017, AJ, 154, 259
- Tonry & Davis (1979) Tonry, J., & Davis, M., 1979, AJ, 84, 1511
- Van Eylen et al. (2016) Van Eylen, V., Winn, J. N., & Albrecht, S. 2016, ApJ, 824, 15
- Watson et al. (2006) Watson, C. L., Henden, A. A., & Price, A. 2006, SASS, 25, 47
- Wilson & Devinney (1971) Wilson, R. E., & Devinney, E. J. 1971, ApJ, 166, 605
- Woźniak et al. (2004) Woźniak, P. R., Vestrand, W. T., Akerlof, C. W., et al. 2004, AJ, 127, 2436
- Zahn (1977) Zahn, J.-P., 1977, A&A., 57, 383
- Zasche et al. (2018) Zasche, P., Wolf, M., Uhlař, R., et al. 2018, A&A, 619, A85
Appendix A Tables of radial velocity measurements of TYC 5378-1590-1 and TYC 8378-252-1
| No | Time | ||||
|---|---|---|---|---|---|
| (HJD-2450000) | (km s-1) | (km s-1) | (km s-1) | (km s-1) | |
| 1 | 8817.4829 | ||||
| 2 | 8817.5002 | ||||
| 3 | 8817.5154 | ||||
| 4 | 8819.5261 | ||||
| 5 | 8819.5413 | ||||
| 6 | 8820.5616 | ||||
| 7 | 8820.5772 | ||||
| 8 | 8822.5559 | ||||
| 9 | 8822.5714 | ||||
| 10 | 8823.5480 | ||||
| 11 | 8823.5638 | ||||
| 12 | 8823.5790 | ||||
| 13 | 8825.5261 | ||||
| 14 | 8825.5412 | ||||
| 15 | 8825.5564 | ||||
| 16 | 9127.5835 | ||||
| 17 | 9127.5986 | ||||
| 18 | 9127.6137 | ||||
| 19 | 9128.5847 | ||||
| 20 | 9129.5795 | ||||
| 21 | 9129.5947 | ||||
| 22 | 9129.6112 | ||||
| 23 | 9129.6296 | ||||
| 24 | 9152.5714 | ||||
| 25 | 9152.5868 | ||||
| 26 | 9155.5726 | ||||
| 27 | 9157.5631 | ||||
| 28 | 9214.4971 | ||||
| 29 | 9214.5123 | ||||
| 30 | 9217.3792 | ||||
| 31 | 9217.3943 | ||||
| 32 | 9219.5826 | ||||
| 33 | 9219.5975 | ||||
| 34 | 9300.3373 | ||||
| 35 | 9300.3685 | ||||
| 36 | 9301.3390 | ||||
| 37 | 9301.3542 | ||||
| 38 | 9301.3695 | ||||
| 39 | 9303.3432 | ||||
| 40 | 9303.3583 | ||||
| 41 | 9303.3738 | ||||
| 42 | 9305.3434 | ||||
| 43 | 9305.3587 | ||||
| 44 | 9305.3740 | ||||
| 45 | 9306.2612 | ||||
| 46 | 9306.2765 | ||||
| 47 | 9307.2611 | ||||
| 48 | 9307.2782 | ||||
| 49 | 9308.2574 | ||||
| 50 | 9308.2726 | ||||
| 51 | 9308.2879 | ||||
| 52 | 9309.2512 | ||||
| 53 | 9310.2542 | ||||
| 54 | 9310.2696 |
| No | Time | ||||
|---|---|---|---|---|---|
| (HJD-2450000) | (km s-1) | (km s-1) | (km s-1) | (km s-1) | |
| 1 | 9060.3844 | ||||
| 2 | 9060.3995 | ||||
| 3 | 9060.4146 | ||||
| 4 | 9060.5298 | ||||
| 5 | 9060.5450 | ||||
| 6 | 9061.2945 | ||||
| 7 | 9061.3100 | ||||
| 8 | 9061.3251 | ||||
| 9 | 9061.4786 | ||||
| 10 | 9061.4937 | ||||
| 11 | 9061.5091 | ||||
| 12 | 9061.5243 | ||||
| 13 | 9061.5397 | ||||
| 14 | 9062.5218 | ||||
| 15 | 9062.5370 | ||||
| 16 | 9062.5526 | ||||
| 17 | 9062.5678 | ||||
| 18 | 9063.3494 | ||||
| 19 | 9063.3646 | ||||
| 20 | 9063.3796 | ||||
| 21 | 9063.5659 | ||||
| 22 | 9063.5810 | ||||
| 23 | 9064.3187 | ||||
| 24 | 9064.3338 | ||||
| 25 | 9064.3489 | ||||
| 26 | 9064.4351 | ||||
| 27 | 9064.4501 | ||||
| 28 | 9064.4654 | ||||
| 29 | 9064.4805 | ||||
| 30 | 9064.4956 | ||||
| 31 | 9065.3820 | ||||
| 32 | 9065.3970 | ||||
| 33 | 9065.4122 | ||||
| 34 | 9065.5201 | ||||
| 35 | 9065.5352 | ||||
| 36 | 9068.4837 | ||||
| 37 | 9068.4989 | ||||
| 38 | 9069.4358 | ||||
| 39 | 9069.4510 | ||||
| 40 | 9069.4665 | ||||
| 41 | 9070.2203 | ||||
| 42 | 9127.3567 | ||||
| 43 | 9127.3720 | ||||
| 44 | 9129.3012 | ||||
| 45 | 9129.3171 | ||||
| 46 | 9129.3323 | ||||
| 47 | 9304.5708 | ||||
| 48 | 9304.5863 | ||||
| 49 | 9304.6020 | ||||
| 50 | 9304.6174 | ||||
| 51 | 9308.5816 | ||||
| 52 | 9309.5552 | ||||
| 53 | 9309.5715 | ||||
| 54 | 9309.5870 | ||||
| 55 | 9311.5704 | ||||
| 56 | 9311.5853 | ||||
| 57 | 9311.6004 |