Band-of-Interest-based Channel Impulse Response Fusion for Breathing Rate Estimation with UWB ††thanks: This research has been kindly supported by the Swiss National Science Foundation under Grant-ID 182621.
Abstract
The channel impulse response (CIR) obtained from the channel estimation step of various wireless systems is a widely used source of information in wireless sensing. Breathing rate is one of the important vital signs that can be retrieved from the CIR. Recently, there have been various works that extract the breathing rate from one carefully selected CIR delay bin that contains the breathing information. However, it has also been shown that the accuracy of this estimation is very sensitive to the measurement scenario, e.g., if there is any obstacle between the transceivers and the target, the position of the target, and the orientation of the target, since only one CIR delay bin does not contain a sufficient periodic component to retrieve the breathing rate. We focus on such scenarios and propose a CIR delay bin fusion method to merge several CIR bins to achieve a more accurate and reliable breathing rate estimate. We take measurements and showcase the advantages of the proposed method across scenarios.
Index Terms:
Breathing rate estimation, Channel impulse response, Ultra-widebandI Introduction
Detecting and monitoring vital signs using Internet of Things (IoT) devices have become trending topics in the last decade [1, 2, 3] and have a wide range of applications such as elderly care, sleep monitoring, and home surveillance. Various sensors are integrated into different wearable devices [4, 5] and home electronics to collect vital sign information. Apart from built-in sensors, wireless communication signals can also be used to extract environment information. Nowadays with the emerging wireless communications technologies, wireless communication signals are ubiquitous in the environment. In fact, communication signals show considerable potential to be utilized as a source for different types of information, including vital signs. Breathing rate is one of the most important vital signs and an early and extremely good indicator of physiological conditions [6]. A normal and healthy breathing rate is stable and in the range of Hz to Hz [7]. Radar systems have been used for breathing rate estimation before wireless communication signals, and the breathing rate is calculated from the round-trip time of the radar signal that is reflected on the human chest [8, 9].
Apart from radar, there is a more convenient solution using WiFi or ultra-wideband (UWB) transceivers, from which a more detailed channel characteristic, namely the channel impulse response (CIR), can be measured. The CIR is a complex-valued vector that represents the magnitude and phase of the signal paths across multiple different delays. The wireless signal that is reflected by the human chest shows a periodic feature across time [10]. Multiple CIR snapshots must be recorded over time to extract breathing rate information. However, since each CIR snapshot contains multiple delay bins, an effective dimension-reduction method needs to be developed. The most intuitive method is to select one CIR delay bin and observe it over time. There are several selection criteria, such as the periodicity [11] calculated from the recurrence plot (RP) [12] and the signal energy in the frequencies of breathing rate (band-of-interest (BoI)) [13]. Other works assume prior knowledge of the position of the target and select the bins of interest [14, 13]. A discrete Fourier transform (DFT) can be applied to each CIR snapshot to obtain the channel frequency response (CFR), which is also referred to as channel state information (CSI). The CSI is a complex-valued vector whose entries represent the amplitude and phase of different subcarriers, which are different linear combinations of the delay bins in the CIR based on the DFT matrix. These can also be used to retrieve the breathing rate. The mean absolute deviation in the phase of the CSI [10], the variance of the complex-valued CSI [15], and the periodicity of CSI [16] have been proposed as selection criteria for choosing one subcarrier in the CSI for breathing rate estimation.
Unfortunately, there is a drawback to all these selection methods. When the breathing components are spread across more than one CIR bin or CSI subcarrier, selecting only one bin or subcarrier leads to a loss of information and impacts the performance. Most previous works assume that the target is in the line-of-sight (LOS) of both the transmitter and the receiver. In such cases, the CIR bin that corresponds to a direct reflection on the human chest contains most of the relevant breathing period information. For the non-line-of-sight (NLOS) case, the signal on the direct reflection path can be attenuated by obstacles. Moreover, based on our observation and conclusions from previous work [17], even for the LOS case, the breathing rate estimation performance is very sensitive to the location and the orientation of the target. In practice, assuming the location, orientation of the targets or the absence of obstacles in front of the target restricts valid locations of the target, or constrains the choice of the mounting position of the measurement devices, i.e., the transmitter and the receiver in order to provide a reasonably extensive coverage area. Especially when the transmitter and the receiver are embedded in personal electronic devices such as tablets and cell phones, it is not convenient for users to put the device in a deliberated position for breathing rate estimation. In a more complex environment, where there are more obstacles, especially between the target and the transceivers, and the location and the orientation of the target are unknown, it is hard to determine which CIR bin contains the most breathing component and due to multiple reflections, the periodic components in each individual bin may be very small.
Contributions
In this work, we propose to focus on and consider all CIR bins that contain periodic components that are in the range of human breathing rate. Only the static or noisy bins in the CIR are discarded during breathing rate estimation. This is achieved by combining multiple CIR bins based on their energy in the BoI. To this end, we formulate a BoI-based fusion method to linearly combine multiple CIR bins such that the combined signal power in the BoI is maximized to improve the breathing rate estimation performance.
Moreover, we build up a breathing rate measurement setup with UWB transceivers. To estimate the breathing rate, we obtain the calibrated CIR and merge the CIR bins based on our BoI fusion method. We use a moving computer numerical control (CNC) machine as a breathing emulator to simulate the movement of the human chest located at different distances and orientations from the UWB transceivers. We also examine both cases where the breathing emulator is and is not in the LOS of the transceivers and compare the estimation performance with the BoI selection method implemented in [13]. We demonstrate that our proposed method shows especially better performance compared to the BoI selection method [13] in the NLOS case and when the breathing movement is small. Finally, we validate the results with real human breathing experiments.
II Background
In this section, we introduce the background for breathing rate estimation using the CIR. We first introduce the structure of the CIR and the employed CIR calibration method. Then we discuss how the CIR is influenced by breathing movement, and introduce the mathematical expression for the BoI for breathing rate estimation. In the end, we introduce the power spectral density (PSD)-based breathing rate estimation method.
II-A Channel Impulse Response (CIR) and CIR calibration
The ground truth CIR can be written as [18]
| (1) |
where is the pulse shape function, is the number of multipath components, and are the attenuation and delay of path , respectively, is the bandwidth and is the carrier frequency. A coherent UWB receiver determines the exact CIR between the transmitter and the receiver by a preamble sequence that has a perfect periodic auto-correlation. The CIR we obtain from the UWB receiver is a sampled CIR vector, , whose entries are .
There is usually a delay offset and an amplitude distortion in the estimated CIR because of the non-synchronized transmitter and the receiver and the automatic gain control (AGC) in the receiver, respectively. We calibrate the CIR delay offset by using the method described in [18]. To calibrate the amplitude distortion, we use the same amplitude calibration method as proposed in [13].
II-B Impact of Breathing Movement on CIR with NLOS
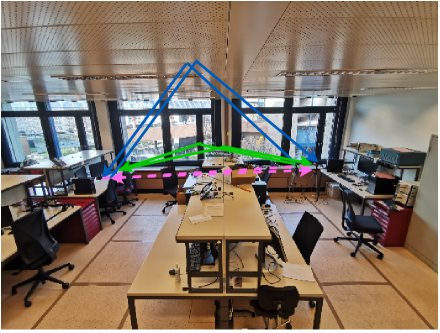
In a complex environment with numerous obstacles, a direct reflection path on the human chest can be attenuated. However, all the transmission paths that have been reflected at least once on the target contain the periodic component that lies in the BoI. As shown in Fig. 3b, there are multiple paths reflected on different sets of objects including the target. Different from the direct path with only one reflection which has a distinct delay that is related to the distance between the transmitter and receiver (referred to as the transceivers) and the target, the other paths with multiple reflections have various delay values. Therefore, multiple delay bins in the CIR may also contain valuable breathing information.
II-C Band-of-Interest for Breathing Rate
The energy in the BoI for breathing is defined as the sum of the entries of the PSD of a snapshot sequence that are within the possible breathing rate range.
| (2) | ||||
| (3) |
where denotes rows in the DFT matrix corresponding to the frequencies between and , where and are the lower and upper bounds of human breathing rate, respectively. In the work of [13], the CIR bin that contains the most energy in the BoI is selected for breathing rate estimation, which shows good performance compared to other methods in [13]. We use this method as the baseline (BoI selection), and the selected CIR bin is referred to as in the following.
II-D Breathing Rate Estimation
III System Structure
The objective of this work is to estimate the breathing rate of humans in different positions and orientations by using UWB transceivers. In order to deal with the cases where the periodic component is small but presents in multiple different CIR bins, such as when the person is not in the LOS of the transceivers and when the person is not facing the transceivers, we introduce the BoI fusion method to combine multiple relevant CIR bins. The corresponding system structure is shown in Fig. 1. We implement both the BoI selection method [13] and our BoI fusion method to compare the performance. In this section, we introduce the calibration method we implement and the BoI fusion method we propose.

III-A CIR Calibration with Transmission Line
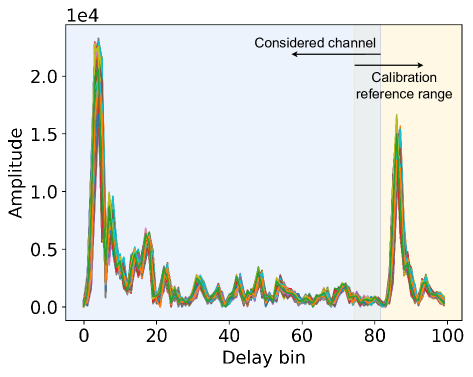
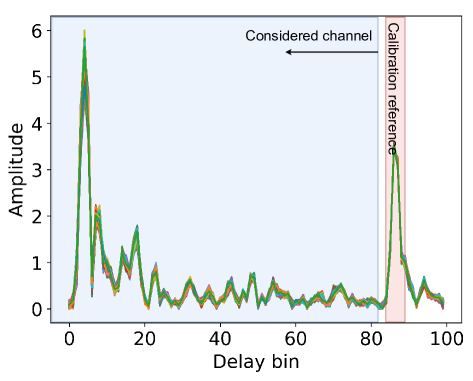
In order to compare the performance of the BoI fusion method with the baseline method, i.e., the BoI selection method, we need to first calibrate the CIR with high precision. The phase and amplitude are calibrated as described in II-A. Instead of assuming a static LOS path between the transmitter and the receiver, we insert a transmission line between the transmitter and the receiver as the reference path for calibration. We use power splitters on the transmitter and the receiver such that part of the RF signal is transmitted through the transmission line with a fixed delay with an attenuator as a known reference for calibration. The transmission line should be longer than the wireless channel we take into consideration, and in our setup, we use a transmission line that is about m long. The UWB receiver synchronizes with the shortest path to the transmitter, which is the first peak in Fig. 2. As mentioned in Section II-A, there is always a delay offset and amplitude difference between the snapshots. Therefore, as shown in Fig. 2a, before calibration, the CIR s are shifted with different delay offsets and the amplitude for different snapshots varies. To calibrate the delay offset, we need to find the static reference signal peak position in the CIR, which corresponds to the signal transmitted through the transmission line. Knowing that the distance between the transmitter and the receiver is m and the distance between adjacent bins in the CIR that we obtained is ns, we can expect the peak from the transmission line to be about bins after the first peak in the CIR, where is the speed of light. Thus we pick the bins after bin as the potential calibration reference. By finding the bin with the maximum amplitude within the calibration reference range and its four adjacent bins and using these five bins as the reference, the synchronized delay offset can be faithfully removed. Then we calibrate the amplitude based on the CIR with calibrated delay. We search the maximum bins again within the reference range, and use the maximum bin and its four adjacent bins to calibrate the amplitude such that the energy contained in the reference bins is the same for all snapshots. Fig. 2b shows the calibrated CIR s, where the random delay offset and amplitude difference are removed. In the following, the calibrated CIR is denoted by a complex-valued vector and a snapshot sequence of is denoted by a complex-valued matrix , where each row represents one at a given time instance.
| Position 1 | Position 2 | Position 3 | Position 4 | Position 5 | Position 6 | |||||||
|---|---|---|---|---|---|---|---|---|---|---|---|---|
| Displacement | Sel. | Fus. | Sel. | Fus. | Sel. | Fus. | Sel. | Fus. | Sel. | Fus. | Sel. | Fus. |
| 2 mm | 0.110 | 0.002 | 0.171 | 0.192 | 0.204 | 0.186 | 0.084 | 0.111 | 0.139 | 0.175 | 0.050 | 0.001 |
| 3 mm | 0.077 | 0.002 | 0.098 | 0.002 | 0.144 | 0.233 | 0.079 | 0.102 | 0.119 | 0.130 | 0.002 | 0.002 |
| 4 mm | 0.027 | 0.001 | 0.019 | 0.001 | 0.176 | 0.180 | 0.157 | 0.174 | 0.110 | 0.120 | 0.002 | 0.001 |
| 5 mm | 0.003 | 0.001 | 0.003 | 0.001 | 0.137 | 0.167 | 0.108 | 0.039 | 0.075 | 0.056 | 0.003 | 0.001 |
| 6 mm | 0.002 | 0.001 | 0.001 | 0.001 | 0.110 | 0.078 | 0.071 | 0.108 | 0.091 | 0.062 | 0.001 | 0.001 |
| 7 mm | 0.001 | 0.001 | 0.001 | 0.001 | 0.080 | 0.106 | 0.102 | 0.064 | 0.137 | 0.001 | 0.001 | 0.001 |
| 8 mm | 0.001 | 0.001 | 0.001 | 0.001 | 0.067 | 0.061 | 0.125 | 0.041 | 0.054 | 0.001 | 0.001 | 0.001 |
| Position 1 | Position 2 | Position 3 | Position 4 | Position 5 | Position 6 | |||||||
|---|---|---|---|---|---|---|---|---|---|---|---|---|
| Displacement | Sel. | Fus. | Sel. | Fus. | Sel. | Fus. | Sel. | Fus. | Sel. | Fus. | Sel. | Fus. |
| 2 mm | 0.031 | 0.001 | 0.167 | 0.267 | 0.118 | 0.010 | 0.083 | 0.140 | 0.201 | 0.226 | 0.112 | 0.125 |
| 3 mm | 0.002 | 0.001 | 0.099 | 0.005 | 0.093 | 0.003 | 0.082 | 0.144 | 0.233 | 0.177 | 0.189 | 0.208 |
| 4 mm | 0.001 | 0.001 | 0.044 | 0.003 | 0.079 | 0.001 | 0.113 | 0.056 | 0.126 | 0.002 | 0.094 | 0.007 |
| 5 mm | 0.001 | 0.001 | 0.001 | 0.001 | 0.023 | 0.002 | 0.102 | 0.085 | 0.038 | 0.002 | 0.149 | 0.003 |
| 6 mm | 0.001 | 0.001 | 0.003 | 0.001 | 0.008 | 0.001 | 0.126 | 0.011 | 0.005 | 0.001 | 0.043 | 0.002 |
| 7 mm | 0.001 | 0.001 | 0.003 | 0.001 | 0.006 | 0.001 | 0.107 | 0.036 | 0.020 | 0.001 | 0.049 | 0.003 |
| 8 mm | 0.001 | 0.001 | 0.002 | 0.001 | 0.003 | 0.001 | 0.143 | 0.004 | 0.020 | 0.001 | 0.026 | 0.001 |
III-B Band-of-Interest Fusion Method
Instead of selecting one CIR bin as in [13], we propose to linearly combine multiple bins with a weight in the CIR such that the signal energy within the BoI is maximized. The linear combination is calculated as . Based on (3), the optimization problem can be written as
| (4) |
We also need to define a constraint, , where is the DFT matrix, to avoid the trivial all-infinite solution. By defining and defining , the corresponding optimization problem is given by
| (5) | ||||
| s.t. | (6) |
We first write the stationary condition from the Karush-Kuhn-Tucker (KKT) conditions [20] and obtain
| (7) |
where is the KKT multiplier, which leads to a generalized eigenvalue problem [21], denoted by , and is an eigenvector of . We obtain the eigenvectors from the eigenvalue decomposition of . Afterwards, each is scaled to obtain one candidate for the optimal solution based on the primal feasibility of the KKT conditions with
| (8) |
Finally, we select the that leads to the largest as the optimal solution . The combined sequence based on the BoI is calculated by . This sequence is the input to the PSD peak detection block in the pipeline of our BoI-fusion method.
IV Experimental Study
In this section, we evaluate the performance of our BoI fusion method with experimental data and compare it with the BoI selection method.
IV-A Experiment Setup
The breathing displacement and breathing rate vary between individuals. In order to test the performance of our method in different situations, we use a breathing emulator with a reflection plate of size cm cm to simulate the human chest movement during breathing. We vary the moving speed and displacement of the breathing emulator to simulate different frequencies within the range of human breathing rates. The breathing displacement varies from mm to mm [22], and the movement speed is in the range from mm/s to mm/s to emulate breathing rates from Hz to Hz, which leads to different breathing cases. We also place the breathing emulator in different positions in the room, and rotate the breathing emulator degrees ( degrees is towards north) such that the reflection plate is facing different directions to simulate different positions and orientations of humans.
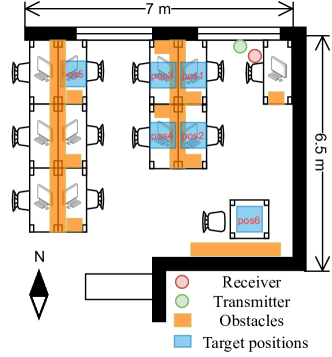
The transmitter and the receiver are located in the corner of the computer room as shown in Fig. 3a. The breathing emulator is located on the desks in different positions. At positions , and , there is at least one obstacle (shelves, PC desktops, monitors, etc.) on the LOS between the target and the transceivers. For example, as shown in Fig. 3b, the pink LOS path can be attenuated by the obstacles and there are potential paths with more reflections where we can extract periodic components. While the breathing emulator is moving, we record CIR snapshots for seconds as one measurement for each position, each orientation, and each breathing case. Two EVK1000 [23] working on UWB channel are used as the transmitter and receiver. The CIR is captured with a sampling rate of Hz.111The sampling rate is programmed to Hz. Because of packet loss and jitters, the achieved sampling rate is Hz. Estimation is done in an -snapshot sliding window, thus for each measurement, we obtain s Hz breathing rate estimation windows. Since there are jitters in the UWB packets, we interpolate the data based on the received time stamps to remove the jitters in each window before estimation. The resolution of the PSD peak detection is Hz. The estimates are compared with the ground truth breathing rate based on the moving speed and displacement of the breathing emulator.
IV-B Results
We compare the estimation accuracy of our BoI fusion method and the BoI selection method. Apart from the absolute estimation error, we also want to have an insight into the PSD of the snapshot sequence. When there is no distinct periodic component, the PSD of the snapshot sequence shows multiple peaks. We want to check if the periodic component is distinct and the breathing rate estimate corresponds to the main peak in the PSD instead of having the largest peak that is coincidentally close to the ground truth breathing rate. We, therefore, introduce another criterion: The confidence index indicates how likely the detected peak in the PSD of the snapshot sequence is the main peak. The confidence index is calculated by the absolute difference between the first and the second peak in the PSD of the snapshot sequence.
IV-B1 Performance Overview
The median value of the estimation error for the BoI selection method and the BoI fusion method is shown in Table I ( degrees) and Table II ( degrees). For most of the scenarios, the BoI fusion method performs better than the BoI selection method. However, we observed that the absolute performance and the performance improvement also depend on the displacement and the target position and orientation. In the following, we evaluate the performance for these two parameters.
IV-B2 Breathing Displacement
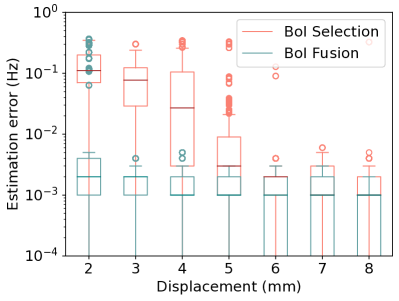
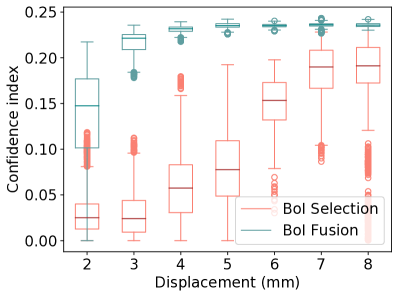
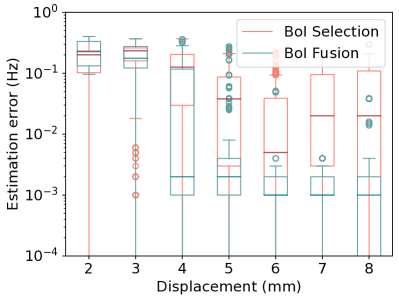
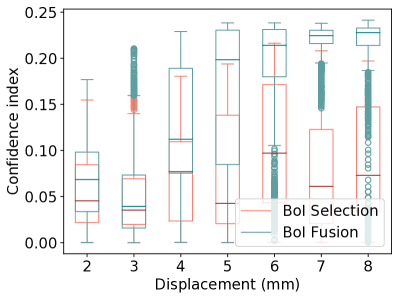
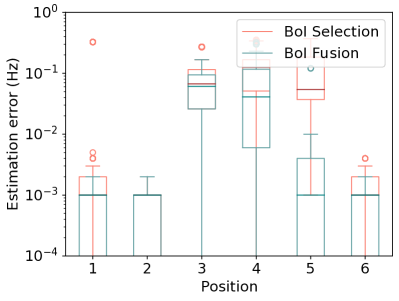
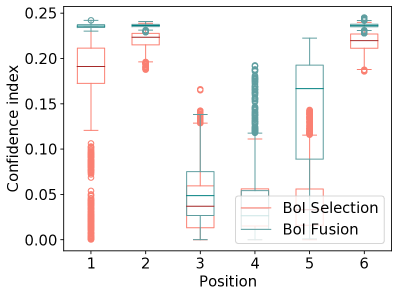
We first observe the performance with different breathing displacements. When the target is located in position , i.e., the target is in the LOS of the transceivers and is close to the transceivers, as shown in Fig. 4, both methods show good performance when the displacement is larger than mm. However, when the displacement is small, even in the LOS situation, the periodic component in a single CIR bin is very small. Hence, the error of the BoI selection method is large. On the contrary, our BoI fusion methods show good performance when the displacement is small. For the confidence index, our method shows a median confidence index above for displacements larger than mm, whereas the confidence index of the BoI selection method is lower and decreases when the displacement is smaller. For position which is further away from the transceiver and the LOS is blocked by an obstacle, as shown in Fig. 5, it is difficult for both methods to estimate the breathing rate when the displacement is smaller than mm. However, our BoI fusion method shows a higher confidence index and estimates the breathing rate with higher accuracy compared to the BoI selection method when the displacement increases.
IV-B3 Object Position and Orientation
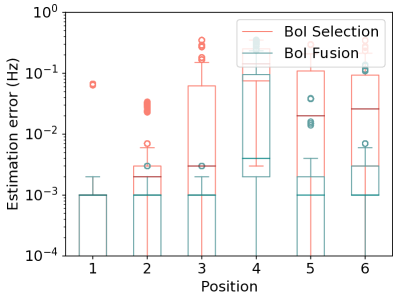
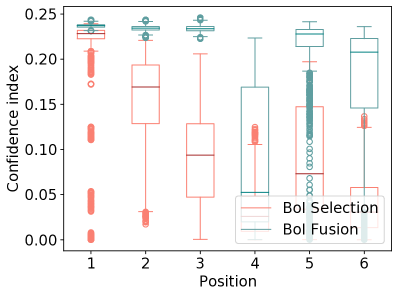
We observe that the position and the orientation of the target influence the estimation performance. As shown in Fig. 6, for the largest displacement, it is more difficult to estimate the breathing rate in the NLOS positions, i.e., positions , and for the BoI selection method. However, the BoI fusion method shows better performance at positions and . When we rotate the breathing emulator for degrees as shown in Fig. 7, it is less challenging for the BoI selection method at positions and and more difficult at position . However, our BoI fusion method still shows a smaller median estimation error compared to the BoI selection method at all positions.
| Position 1 | Position 2 | Position 3 | Position 4 | Position 5 | Position 6 | |||||||
|---|---|---|---|---|---|---|---|---|---|---|---|---|
| 0 deg | 90 deg | 0 deg | 90 deg | 0 deg | 90 deg | 0 deg | 90 deg | 0 deg | 90 deg | 0 deg | 90 deg | |
| Neulog (Gound truth) | 0.300 | 0.323 | 0.291 | 0.284 | 0.268 | 0.285 | 0.278 | 0.264 | 0.258 | 0.266 | 0.291 | 0.326 |
| BoI Selection | 0.308 | 0.325 | 0.296 | 0.285 | 0.112 | 0.285 | 0.113 | 0.264 | 0.145 | 0.260 | 0.288 | 0.326 |
| Boi Fusion | 0.308 | 0.325 | 0.294 | 0.283 | 0.269 | 0.286 | 0.282 | 0.262 | 0.273 | 0.265 | 0.292 | 0.327 |
IV-C Validation with Human Breathing
Finally, we test the performance with real human breathing in different positions and orientations. The person is always sitting on the chairs for each position. In degrees case, the person is facing north, and in the degrees case, the person is always facing his desk. The person is wearing a respiration monitor belt and the breathing rate is recorded by Neulog devices [24] as ground truth. We found that it is easier to estimate the breathing rate for humans compared to that of the breathing emulator for the most challenging positions and since the moving volume of real human breathing is larger than the reflection plate. However, as shown in Table. III, there are still challenging cases, e.g., position ( degrees), position ( degrees), and position ( degrees), where the estimated breathing rate from the BoI selection method is not close to the ground truth breathing rate. For those cases, the proposed BoI fusion method can achieve a better estimate.
V Conclusions
In this paper, we showed that for breathing rate estimation, when there are obstacles between the target and the transceivers, and when the breathing displacement is small, it is difficult to extract the breathing rate based on only one CIR delay bin. Moreover, the position and orientation of the target also influence the performance of breathing rate estimation. To deal with those difficult cases, our BoI fusion method combines the bins that contain energy in the BoI in an effective manner and maximized the breathing periodic component and leads to a more accurate and reliable breathing rate estimate.
References
- [1] A. J. Jara, M. A. Zamora, and A. F. Skarmeta, “Knowledge acquisition and management architecture for mobile and personal health environments based on the Internet of Things,” in 2012 IEEE 11th International Conference on Trust, Security and Privacy in Computing and Communications. IEEE, Jun. 2012, pp. 1811–1818.
- [2] M. S. D. Gupta, V. Patchava, and V. Menezes, “Healthcare based on IoT using Raspberry Pi,” in 2015 International Conference on Green Computing and Internet of Things (ICGCIoT). IEEE, Oct. 2015, pp. 796–799.
- [3] F. Wu, T. Wu, and M. Yuce, “An Internet-of-Things (IoT) network system for connected safety and health monitoring applications,” Sensors, vol. 19, no. 1, p. 21, Dec. 2018.
- [4] S. M. A. Iqbal, I. Mahgoub, E. Du, M. A. Leavitt, and W. Asghar, “Advances in healthcare wearable devices,” npj Flexible Electronics, vol. 5, no. 1, p. 9, Apr. 2021.
- [5] G. V. Angelov, D. P. Nikolakov, I. N. Ruskova, E. E. Gieva, and M. L. Spasova, “Healthcare sensing and monitoring,” in Enhanced Living Environments, I. Ganchev, N. M. Garcia, C. Dobre, C. X. Mavromoustakis, and R. Goleva, Eds. Springer International Publishing, 2019, vol. 11369, pp. 226–262, series Title: Lecture Notes in Computer Science.
- [6] A. Nicolò, C. Massaroni, E. Schena, and M. Sacchetti, “The importance of respiratory rate monitoring: From healthcare to sport and exercise,” Sensors, vol. 20, no. 21, p. 6396, Nov. 2020.
- [7] G. Benchetrit, “Breathing pattern in humans: diversity and individuality,” Respiration Physiology, vol. 122, no. 2-3, pp. 123–129, Sep. 2000.
- [8] A. Droitcour, O. Boric-Lubecke, and G. Kovacs, “Signal-to-noise ratio in Doppler radar system for heart and respiratory rate measurements,” IEEE Transactions on Microwave Theory and Techniques, vol. 57, no. 10, pp. 2498–2507, Oct. 2009.
- [9] S. Costanzo, “Software-defined Doppler radar sensor for human breathing detection,” Sensors, vol. 19, no. 14, p. 3085, Jul. 2019.
- [10] X. Wang, C. Yang, and S. Mao, “PhaseBeat: Exploiting CSI phase data for vital sign monitoring with commodity WiFi devices,” in 2017 IEEE 37th International Conference on Distributed Computing Systems (ICDCS). IEEE, Jun. 2017, pp. 1230–1239.
- [11] C. Dou and H. Huan, “Full respiration rate monitoring exploiting Doppler information with commodity Wi-Fi devices,” Sensors (Basel, Switzerland), vol. 21, no. 10, p. 3505, May 2021.
- [12] J.-P. Eckmann, S. O. Kamphorst, and D. Ruelle, “Recurrence plots of dynamical systems,” Europhysics Letters (EPL), vol. 4, no. 9, pp. 973–977, Nov. 1987.
- [13] S. Li, A. T. Kristensen, A. Burg, and A. Balatsoukas-Stimming, “ComplexBeat: Breathing rate estimation from complex CSI,” in 2021 IEEE Workshop on Signal Processing Systems (SiPS). IEEE, Oct. 2021, pp. 217–222.
- [14] C. E. Goldfine, F. T. Oshim, S. P. Carreiro, B. P. Chapman, D. Ganesan, and T. Rahman, “Respiratory rate monitoring in clinical environments with a contactless ultra-wideband impulse radar-based sensor system,” Proceedings of the … Annual Hawaii International Conference on System Sciences. Annual Hawaii International Conference on System Sciences, vol. 2020, pp. 3366–3375, 2020.
- [15] J. Liu, Y. Wang, Y. Chen, J. Yang, X. Chen, and J. Cheng, “Tracking vital signs during sleep leveraging off-the-shelf WiFi,” in Proceedings of the 16th ACM International Symposium on Mobile Ad Hoc Networking and Computing. ACM, Jun. 2015, pp. 267–276.
- [16] X. Liu, J. Cao, S. Tang, and J. Wen, “Wi-Sleep: Contactless sleep monitoring via WiFi signals,” in 2014 IEEE Real-Time Systems Symposium. IEEE, Dec. 2014, pp. 346–355.
- [17] H. Wang, D. Zhang, J. Ma, Y. Wang, Y. Wang, D. Wu, T. Gu, and B. Xie, “Human respiration detection with commodity wifi devices: do user location and body orientation matter?” in Proceedings of the 2016 ACM International Joint Conference on Pervasive and Ubiquitous Computing. ACM, Sep. 2016, pp. 25–36.
- [18] S. Li, A. Balatsoukas-Stimming, and A. Burg, “Device-free movement tracking using the UWB channel impulse response with machine learning,” in 2022 IEEE 23rd International Workshop on Signal Processing Advances in Wireless Communication (SPAWC). IEEE, Jul. 2022, pp. 1–5.
- [19] P. Hillyard, A. Luong, A. S. Abrar, N. Patwari, K. Sundar, R. Farney, J. Burch, C. A. Porucznik, and S. H. Pollard, “Comparing respiratory monitoring performance of commercial wireless devices,” 2018, publisher: arXiv Version Number: 1.
- [20] S. Boyd and L. Vandenberghe, Convex Optimization, 1st ed. Cambridge University Press, Mar. 2004.
- [21] B. Ghojogh, F. Karray, and M. Crowley, “Eigenvalue and generalized eigenvalue problems: Tutorial,” 2019, publisher: arXiv Version Number: 2.
- [22] J. Tong, L. Jugé, P. G. Burke, F. Knapman, D. J. Eckert, L. E. Bilston, and J. Amatoury, “Respiratory-related displacement of the trachea in obstructive sleep apnea,” Journal of Applied Physiology, vol. 127, no. 5, pp. 1307–1316, Nov. 2019.
- [23] Decawave, “Qurvo EVK1000 user manual,” https://www.qorvo.com/products/d/da007993, visited 2023-01-29.
- [24] Neulog, “Neulog respiration monitor belt,” https://neulog.com/respiration-monitor-belt/, visited 2023-01-27.