SRG/eROSITA-triggered XMM-Newton observations of three Be/X-ray binaries in the LMC: Discovery of X-ray pulsations
Abstract
Context. Using data from eROSITA, the soft X-ray instrument aboard Spectrum-Roentgen-Gamma (SRG), we report the discovery of two new hard transients, eRASSU J050810.4660653 and eRASSt J044811.1691318, in the Large Magellanic Cloud. We also report the detection of the Be/X-ray binary RX J0501.67034 in a bright state.
Aims. We initiated follow-up observations to investigate the nature of the new transients and to search for X-ray pulsations coming from RX J0501.67034.
Methods. We analysed the X-ray spectra and light curves from our XMM-Newton observations, obtained optical spectra using the South African Large Telescope to look for Balmer emission lines and utilised the archival data from the Optical Gravitational Lensing Experiment (OGLE) for the long-term monitoring of the optical counterparts.
Results. We find X-ray pulsations for eRASSU J050810.4660653, RX J0501.67034, and eRASSt J044811.1691318 of 40.6 s, 17.3 s, and 784 s, respectively. The H emission lines with equivalent widths of -10.4 Å (eRASSU J050810.4660653) and -43.9 Å (eRASSt J044811.1691318) were measured, characteristic for a circumstellar disc around Be stars. The OGLE I- and V-band light curves of all three systems exhibit strong variability. A regular pattern of deep dips in the light curves of RX J0501.67034 suggests an orbital period of 451 days.
Conclusions. We identify the two new hard eROSITA transients eRASSU J050810.4660653 and eRASSt J044811.1691318 and the known Be/X-ray binary RX J0501.67034 as Be/X-ray binary pulsars.
Key Words.:
galaxies: individual: LMC – X-rays: binaries – stars: emission-line, Be – stars: neutron pulsars: individual: eRASSU J050810.4660653, eRASSt J044811.1691318, RX J0501.670341 Introduction
The soft X-ray instrument eROSITA on board the Spektrum-Roentgen-Gamma (SRG) mission (Predehl et al. 2021) began scanning the sky in great circles in December 2019. Until December 2021, one full eROSITA sky survey was completed every half-year (eRASS1 to eRASS4), whereas eRASS5 was stopped in February 2022. The survey strategy with scans along great circles (six per day), which intersect at the ecliptic north and south poles leads to a higher number of scans across sources near the poles. The Large Magellanic Cloud (LMC) is located sufficiently close to the south-ecliptic pole to have the north-eastern side scanned for up to three weeks.
The first scans from eRASS1 imaged the northern part of the LMC, leading to the discovery of eRASSU J050810.4660653 (Haberl et al. 2020) and eRASSU J052914.9662446 (Maitra et al. 2020a). Following its discovery, eRASSU J052914.9662446 was observed with NuSTAR and pulsations in the X-ray flux were discovered (Maitra et al. 2020b). The results of a detailed analysis are presented in Maitra et al. (2023). One year later, eRASSU J050810.4660653 was seen to have brightened and we executed an anticipated target of opportunity (ToO) observation with XMM-Newton, which allowed us to discover X-ray pulsations (Haberl et al. 2021). The source became brightest at the end of eRASS4/beginning of eRASS5 when it was detected by Mikhail Pavlinsky ART-XC (Pavlinsky et al. 2021), the hard X-ray instrument on board SRG. A NuSTAR observation independently revealed the pulsations of eRASSU J050810.4660653 (Salganik et al. 2022).
Over the course of eRASS3, when eROSITA was scanning over RX J0501.67034, the source was found in a bright state, whereas it was not detected during eRASS1 and eRASS2. In particular, RX J0501.67034 is known since it was discovered with the Einstein observatory (CAL 9; Long et al. 1981) and identified as a Be/X-ray binary (Crampton et al. 1985; Cowley et al. 1984). The cited authors suggested the variable star SV* HV 2289 as optical counterpart and found H in emission in their blue spectrum which indicates a B0e spectral type. We again triggered an XMM-Newton ToO observation with the aim to confirm the identification and detect pulsations.
Another new transient X-ray source with a hard spectrum (eRASSt J044811.1691318) was found during eRASS4 on the western side of the LMC towards the Magellanic Bridge. As a possible optical counterpart, we identified a star with colour and brightness consistent with a B star, suggesting a Be/X-ray binary suitable for an XMM-Newton follow-up observation.
In this paper, we describe the results from our X-ray observations of eRASSU J050810.4660653, RX J0501.67034, and eRASSt J044811.1691318, using eROSITA, XMM-Newton, and Swift. These results are detailed in Sect. 2. In Sect. 3, we present the identification of the optical counterparts, their long-term monitoring recorded by the Optical Gravitational Lensing Experiment (OGLE; Udalski et al. 2008, 2015) and optical spectra (Sect. 3.1) obtained with the South African Large Telescope (SALT; Buckley et al. 2006). We discuss our final results in Sect. 4 and conclusions in Sect. 5.
2 X-ray observations and data analysis
2.1 eROSITA
To analyse the data, we used the eROSITA Standard Analysis Software System (eSASS Brunner et al. 2022) version eSASSusers_211214. To produce eROSITA source products like light curves and spectra, we used the eSASS task srctool (see e.g. Maitra et al. 2021; Haberl et al. 2022a). We defined circular regions to extract source (radius 50″, 60″, and 40″) and background events (from a nearby source-free region; radius 50″, 90″, and 65″) for eRASSU J050810.4660653, RX J0501.67034, and eRASSt J044811.1691318, respectively. For the spectra and light curves, we selected all valid pixel patterns (PATTERN = 15). For the light curves, we combined the data from all cameras (telescope modules TM 1–7) and applied a cut in the fractional exposure of 0.15 (FRACEXP0.15) to exclude data from the edge of the detectors. We created combined spectra using only data from TM 1–4 and 6, the five cameras with an on-chip filter. We note that TM5 and TM7 suffer from a light leak (Predehl et al. 2021) and no reliable energy calibration is available yet. The eROSITA source spectra were binned to a minimum of one count per bin to use Cash statistics (Cash 1979).
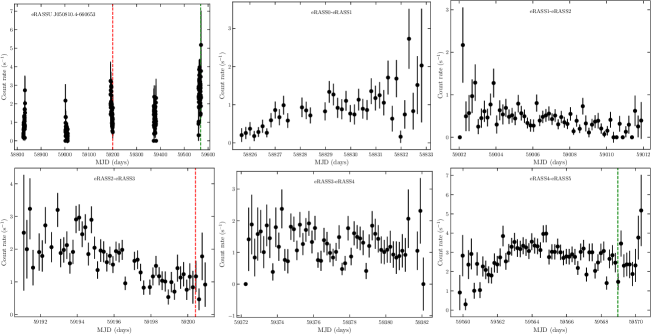
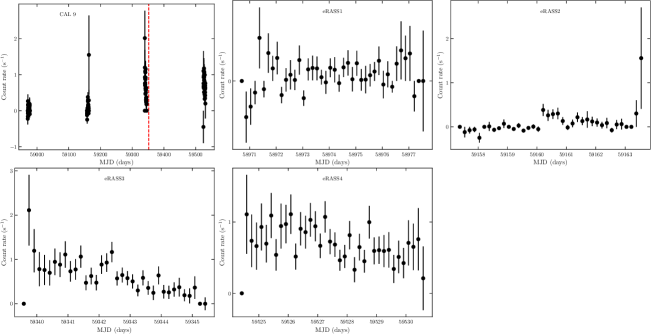
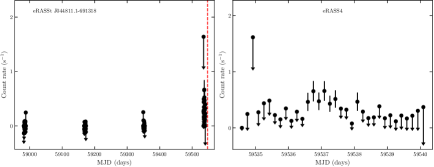
The eROSITA light curves of eRASSU J050810.4660653, RX J0501.67034, and eRASSt J044811.1691318 are shown in Figs. 13, 14, and 15. eRASSU J050810.4660653 is located closest to the south-ecliptic pole and was scanned most often, including the first part of eRASS5 in total 272 times, while eRASSt J044811.1691318 in the west of the LMC was scanned 134 times. The light curves of eRASSU J050810.4660653 and RX J0501.67034 show variability by a factor of a few on timescales of weeks and between surveys. eRASSt J044811.1691318 was detected only during eRASS4 and too faint to draw conclusions about variability over days.
The analysis of the eROSITA spectra (and also XMM-Newton EPIC spectra, see below) was performed using XSPEC v12.10.1f (Arnaud 1996). We fitted the eROSITA spectra using a simple absorbed power-law model with two absorption components, one accounting for the foreground absorption in the Galaxy with ISM abundances following Wilms et al. (2000) and atomic cross-sections from Verner et al. (1996). The Galactic column density, N, was taken from Dickey & Lockman (1990) and fixed in the fits (4.4, 8.6 and 7.2 cm-2 for eRASSU J050810.4660653, RX J0501.67034, and eRASSt J044811.1691318, respectively). For the absorption along the line of sight through the LMC and local to the source, we fixed the elemental abundances at 0.49 solar (Rolleston et al. 2002; Luck et al. 1998) and left the column density free in the fit. Errors on spectral fit parameters indicate 90% confidence intervals throughout the paper.
We started to fit the eROSITA spectra of eRASSU J050810.4660653 from the five epochs individually. The best-fit parameters are assembled in Table 1 (upper part) and indicate no significant changes in spectral shape (column density or power-law index) with time. The overall flux varies by a factor of 6.3 (4.0–13.4). Given the constant spectral shape, we next fitted the spectra simultaneously using a common absorption and power-law index (Table 1, second part). In this case the flux varies by a factor of 7.4 (5.9–9.5). The power-law index is typical for HMXBs observed in the 0.2–10 keV band (Haberl et al. 2008) and the X-ray luminosity varied between 0.5 and 3.6 erg s-1 on the half-year timescale defined by the eROSITA surveys.
RX J0501.67034 was also detected in each of the first four eRASS surveys, but at a fainter flux level. Therefore, we fitted the four eROSITA spectra simultaneously with common power-law index and absorption. No significant LMC absorption was required in the fit. The best-fit parameters are listed in Table 1.
| eRASS(a)𝑎(a)(a)𝑎(a)footnotemark: | Power-law | N (b)𝑏(b)(b)𝑏(b)footnotemark: | Fx(c)𝑐(c)(c)𝑐(c)footnotemark: | Lx(d)𝑑(d)(d)𝑑(d)footnotemark: |
| index | ||||
| cm-2 | erg cm-2 s-1 | erg s-1 | ||
| eRASSU J050810.4660653 | ||||
| 0–1 | 1.2 | 30.0 | 3.0 | 1.03 |
| 1–2 | 0.8 | 11.5 | 1.8 | 0.57 |
| 2–3 | 1.07 | 17.8 | 6.1 | 2.00 |
| 3–4 | 0.98 | 11.4 | 4.7 | 1.52 |
| 4–5 | 0.97 | 12.9 | 11.4 | 3.7 |
| eRASSU J050810.4660653 simultaneous fit | ||||
| C-statistic = 1216; = 1511; d.o.f. = 1510(e)𝑒(e)(e)𝑒(e)footnotemark: | ||||
| 0–1 | 3.2 | 1.04 | ||
| 1–2 | 1.52 | 0.49 | ||
| 2–3 | 1.00 | 14.5 | 6.4 | 2.07 |
| 3–4 | 4.7 | 1.53 | ||
| 4–5 | 11.2 | 3.63 | ||
| RX J0501.67034 simultaneous fit | ||||
| C-statistic = 352.6; = 363.3; d.o.f. = 426(e)𝑒(e)(e)𝑒(e)footnotemark: | ||||
| 1 | 0.10 | 0.031 | ||
| 2 | 1.10 | ¡7 | 0.22 | 0.070 |
| 3 | 2.05 | 0.66 | ||
| 4 | 2.60 | 0.83 | ||
| eRASSt J044811.1691318 eRASS4 | ||||
| C-statistic = 76.2; = 82.9; d.o.f. = 89(e)𝑒(e)(e)𝑒(e)footnotemark: | ||||
| 4 | 0.7 | ¡102 | 1.8 | 0.59 |
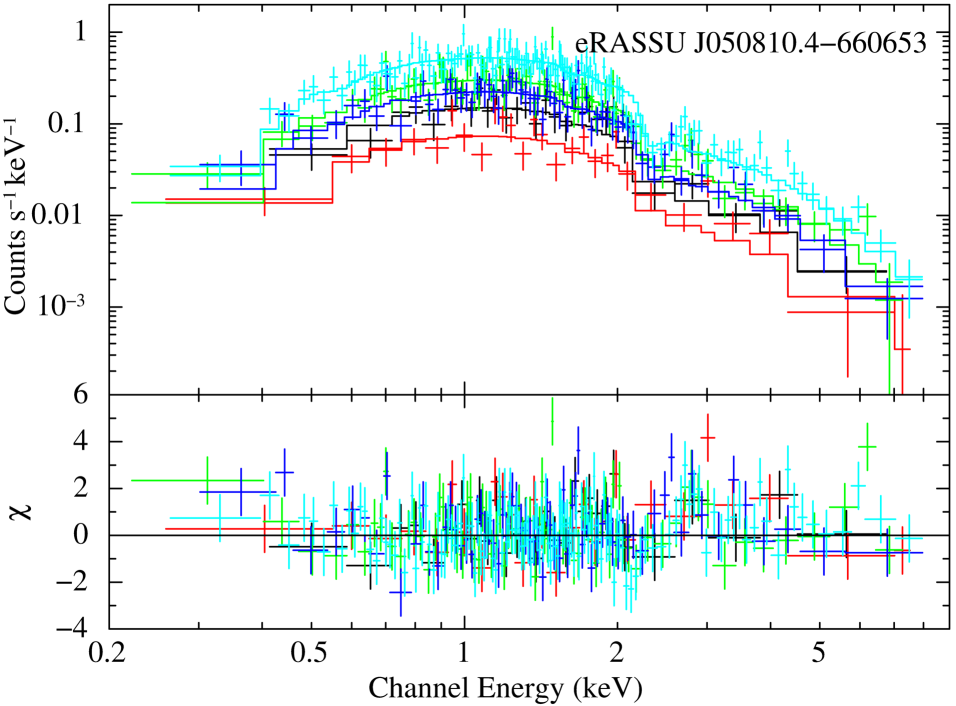
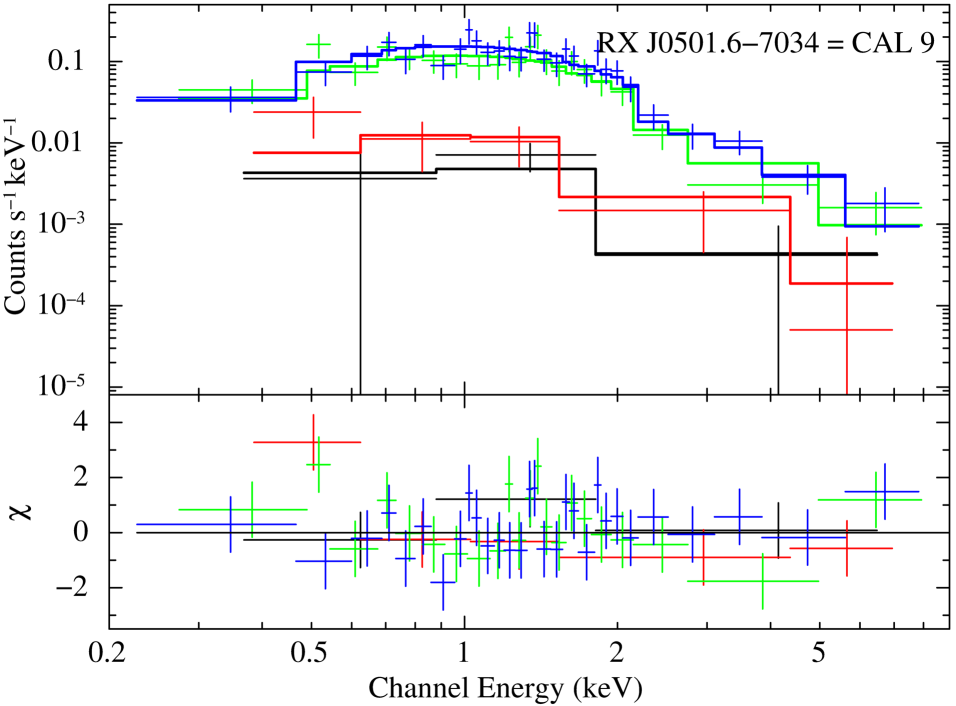
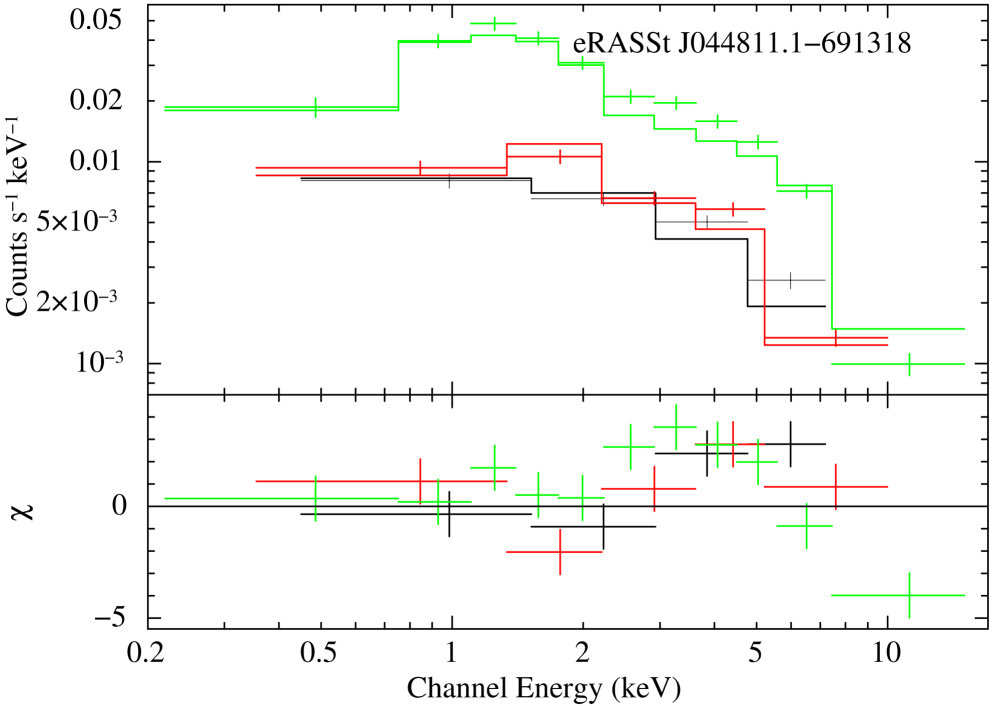
eRASSt J044811.1691318 was only detected during eRASS4 and we used the corresponding spectrum for our spectral analysis (Table 1). Although it is not very well constrained, the derived power-law index indicates a harder X-ray spectrum compared to the other two sources. Again, no significant LMC absorption was required, but column densities up to cm-2 cannot be ruled out. The luminosity was at a similar level as seen from RX J0501.67034 and at the lower luminosity range covered by eRASSU J050810.4660653. The eROSITA spectra with their best-fit models are plotted in Fig. 1.
2.2 XMM-Newton
We triggered XMM-Newton follow-up observations from our anticipated ToO programs for the three targets (see Table 2). We used the XMM-Newton Science Analysis Software (SAS) 19.1.0222https://www.cosmos.esa.int/web/xmm-newton/sas package to process the data from the European Photon Imaging Camera (EPIC), which is equipped with pn- (Strüder et al. 2001) and MOS-type (Turner et al. 2001) charge-coupled device (CCD) detectors. From the processed EPIC event files, we created such products as images, spectra, and light curves using the SAS task evselect.
We performed a maximum likelihood source detection simultaneously on the 15 images from the three EPIC instruments in five energy bands (0.2–0.5 keV, 0.5–1 keV, 1–2 keV, 2–4.5 keV, and 4.5–12 keV) as described in Sturm et al. (2013). The resulting X-ray positions are listed in Table 2.
We extracted energy spectra from circular regions around source (radius 40″, 45″, and 30″) and nearby background (radius 60″, 60″, and 50″) for eRASSU J050810.4660653, RX J0501.67034, and eRASSt J044811.1691318, respectively. Events with PATTERN 1–4 for EPIC-pn (Strüder et al. 2001) and PATTERN 1–12 for EPIC-MOS (Turner et al. 2001) were selected, applying the conservative event filtering with FLAG 0 for EPIC-pn and EPIC-MOS. The EPIC source spectra were binned to a minimum of 20 counts per bin to use Gaussian statistics and the response files were computed with the SAS tasks arfgen and rmfgen.
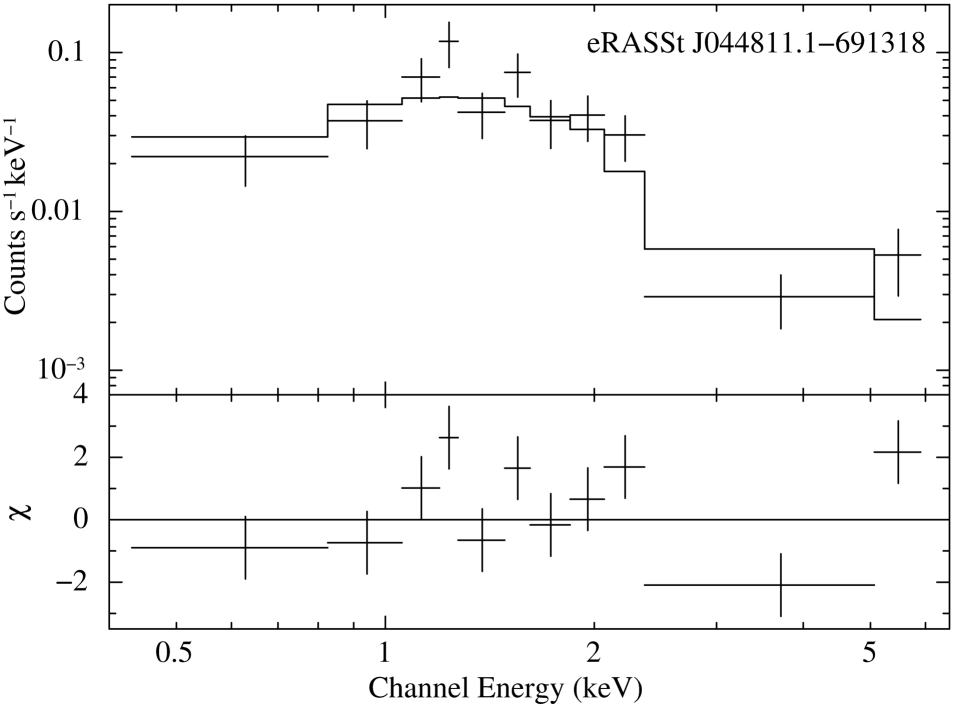
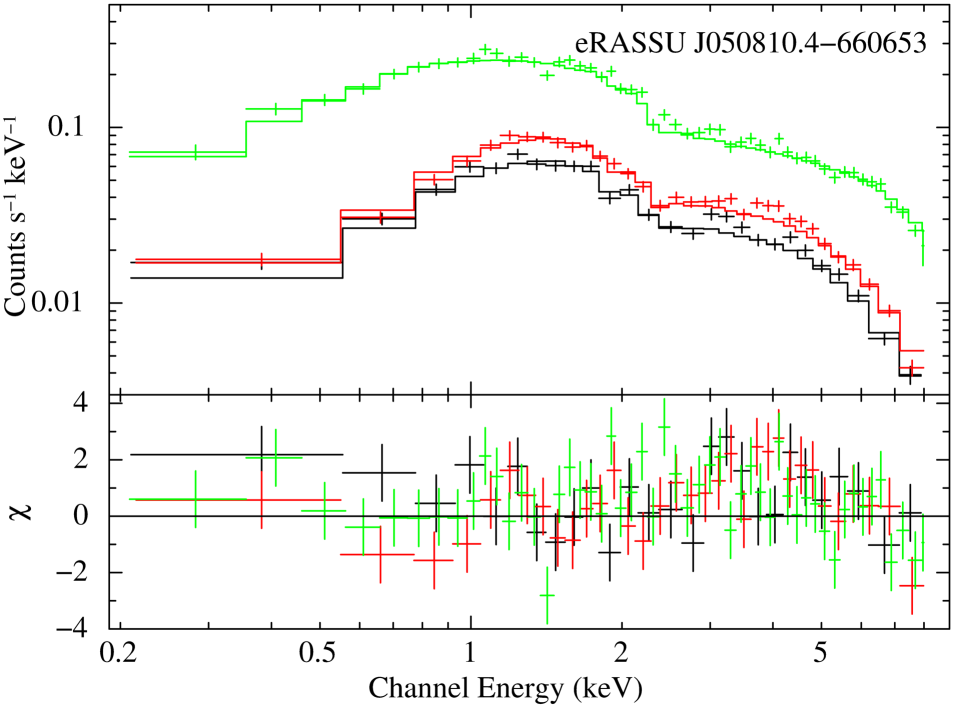
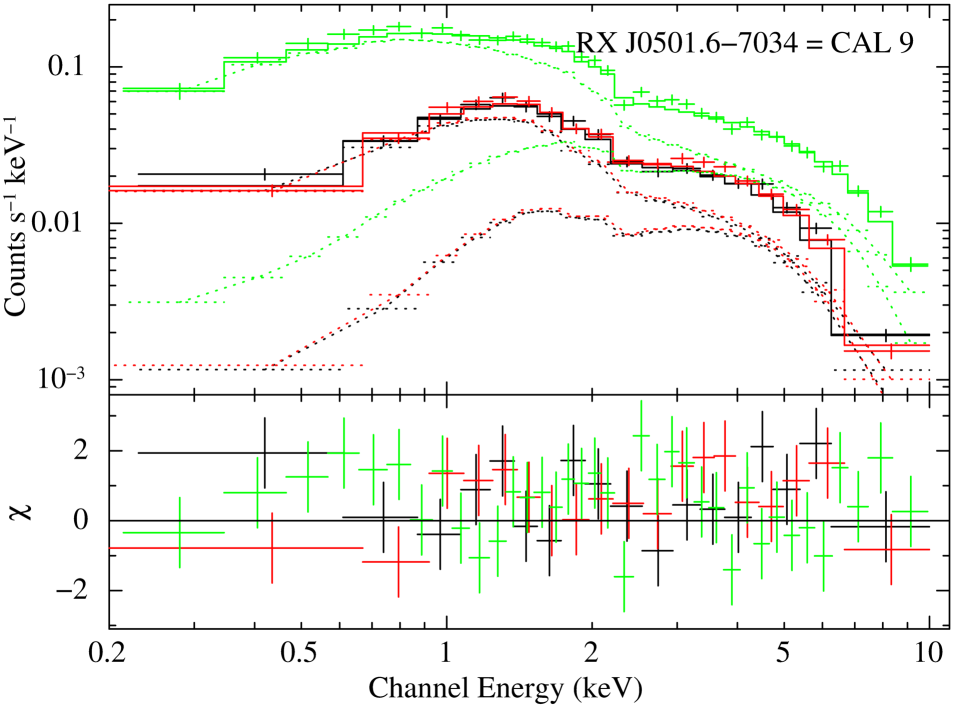
In modelling the EPIC spectra, we followed the same approach as for the eROSITA spectra with a power law with two absorption column densities as basic model. This model adequately fits the spectra from eRASSU J050810.4660653. However, the residuals from the fit to the spectra of RX J0501.67034 reveal a systematic pattern that indicates a second emission component. We added a black-body component which was also used for other BeXRBs (e.g. Haberl et al. 2022b). Also, the fit to the spectra of eRASSt J044811.1691318 suggests that the pure power-law model is too simple, but the low statistical quality of the spectrum prevents a more detailed spectral study. The derived best-fit parameters for the three sources are summarised in Table 3 and the spectra with best-fit model are shown in Fig. 2.
| Source | Obs. | Observation | Exposure time | R.A. | Dec. | Err |
|---|---|---|---|---|---|---|
| name | ID | time | pn, MOS1, MOS2 | (J2000) | 1 | |
| (s) | (h m s) | (° ′ ″) | (″) | |||
| eRASSU J050810.4660653 | 0860800301 | 2020-12-17 09:54 – 19:24 | 19500, 31779, 32332 | 05 08 09.99 | -66 06 51.6 | 0.51 |
| RX J0501.67034 (CAL 9) | 0883950101 | 2021-05-18 00:30 – 08:57 | 20300, 24743, 24617 | 05 01 23.66 | -70 33 34.0 | 0.51 |
| eRASSt J044811.1691318 | 0883950201 | 2021-11-29 01:59 – 08:22 | 16383, 21075, 21424 | 04 48 10.67 | -69 13 18.0 | 0.52 |
| Source | Perioda𝑎aa𝑎aFor the definition of the observing epochs see the Appendix. | N | Photon | kT | Fluxb𝑏bb𝑏bThe total absorption column consists of N, which is fixed to the Galactic foreground with solar abundances, and N, which accounts for the additional absorption component within the LMC. | Lxb,c𝑏𝑐b,cb,c𝑏𝑐b,cfootnotemark: | /dof |
|---|---|---|---|---|---|---|---|
| (short) | (s) | ( cm-2) | index | (keV) | (erg cm-2 s-1) | (erg s-1) | |
| J0508 | 40.602544 7.2 | 8.0 1.5 | 0.76 0.02 | – | 5.62 | 1.74 | 0.96/1107 |
| J0501 d𝑑dd𝑑dCorresponding unabsorbed luminosity assuming a source distance of 50 kpc. | 17.3321 3.8 | 2.5 | 1.20 | 1.61 | 2.88 | 9.01 | 1.00/729 |
| J0448 | 783.75 0.55 | 13.4 6.2 | 0.80 0.06 | – | 1.02 | 3.19 | 1.40/186 |
| Source | Va𝑎aa𝑎aMost probable period with 1 error. | Qa,b𝑎𝑏a,ba,b𝑎𝑏a,bfootnotemark: | 2MASS | J | H | Ks | R.A. | Dec. | Dd𝑑dd𝑑d To model the spectra of RX J0501.67034 an additional black-body component was included. It contributes 36.7% to the total flux and 35.3% to the luminosity. The for the fit without the black-body component was 1.10 for 731 degrees of freedom (dof). The F-test probability of 3.2 justifies the addition of this component. |
|---|---|---|---|---|---|---|---|---|---|
| (short) | (J2000)c𝑐cc𝑐cObserved flux in the energy range of 0.2–8 keV.Absorption-corrected luminosity assuming a distance of 50 kpc. | ||||||||
| (mag) | (mag) | (mag) | (mag) | (mag) | (h m s) | (° ′ ″) | (″) | ||
| J0508 | 14.15 | -0.89 | 050809936606523 | 13.98 | 13.93 | 13.70 | 05 08 09.94 | -66 06 52.1 | 0.61 |
| J0501 | 14.36 | -0.84 | 050124197033346 | 13.98 | 13.17 | 13.06 | 05 01 23.84 | -70 33 33.9 | 0.95 |
| J0448 | 15.77 | -0.76 | – | – | – | – | 04 48 10.65 | -69 13 17.0 | 0.99 |
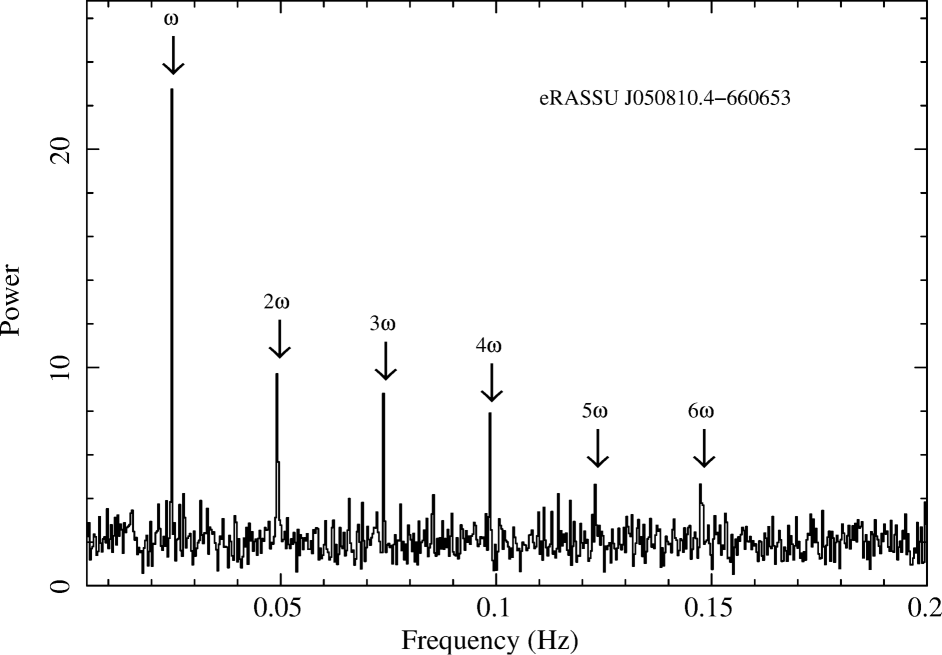
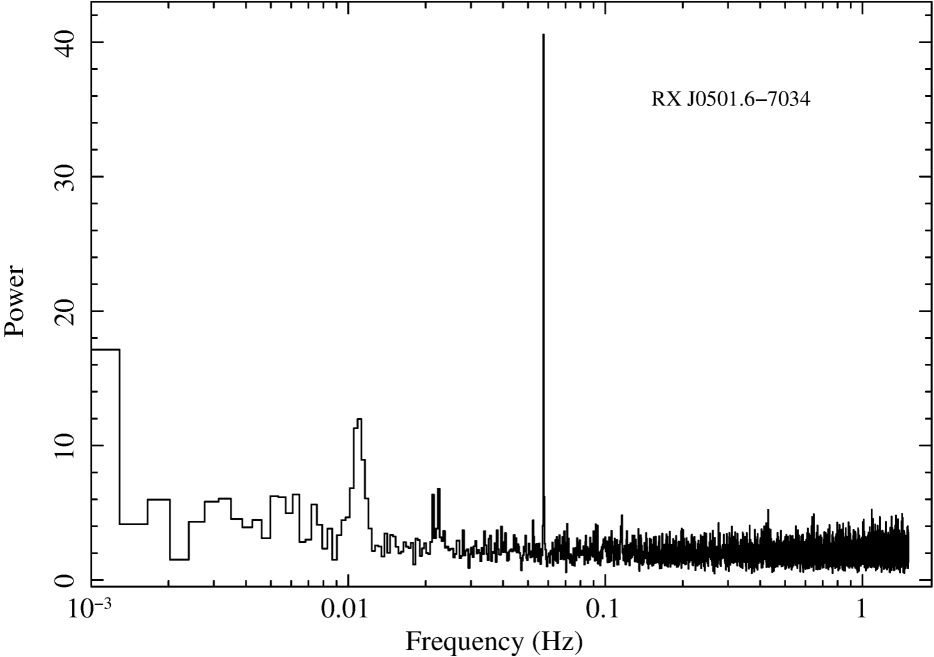
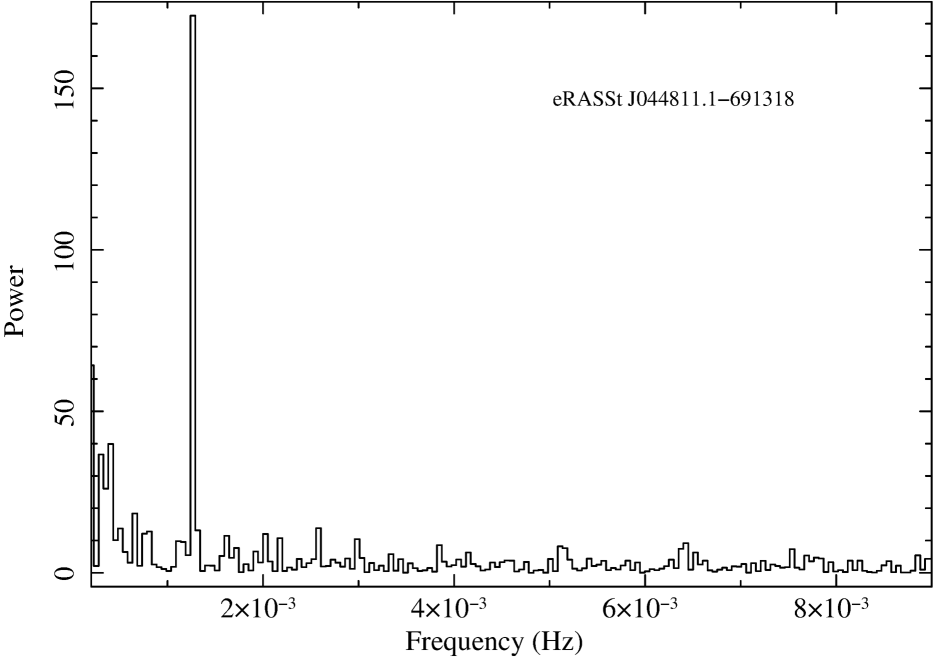
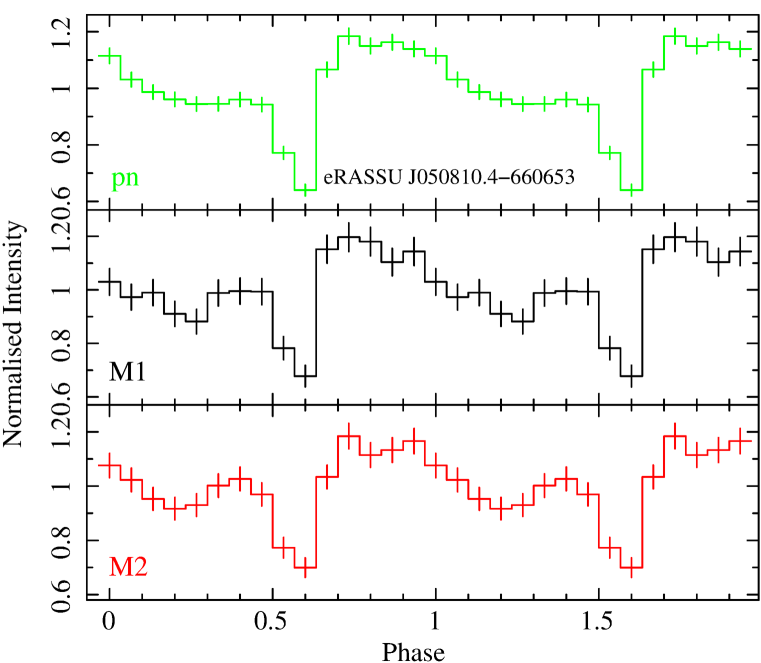
Correcting the event arrival times to the solar system barycentre and relaxing the selection to valid pixel patterns (PATTERN 1–12), we created EPIC-pn light curves in the 0.2–8.0 keV energy band from the same extraction regions as used for the spectra. For our search for X-ray pulsations in the light curves, we first created power spectra which revealed pulsations for all our three targets. The power spectra obtained from the 0.2–8.0 keV EPIC-pn light curves are presented in Fig. 3. The power spectrum of eRASSU J050810.4660653 with five harmonics of the fundamental frequency indicates a complex pulse profile. The power spectra of the other two pulsars, RX J0501.67034 and eRASSt J044811.1691318, only reveal their fundamental frequencies.
To determine the precise period and its error we applied in a second step the Bayesian approach described by Gregory & Loredo (1996) in a restricted frequency range around the fundamental frequency, which was determined from the power spectrum. This method was used already for other HMXB pulsars in the Magellanic Clouds (e.g. Haberl et al. 2022b; Vasilopoulos et al. 2017, 2013; Haberl et al. 2008).
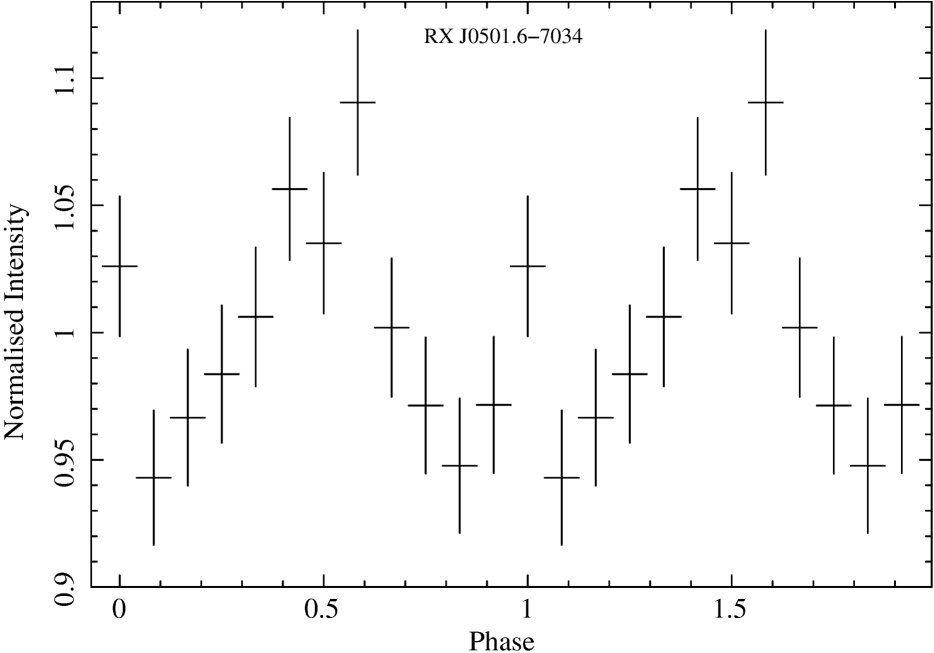
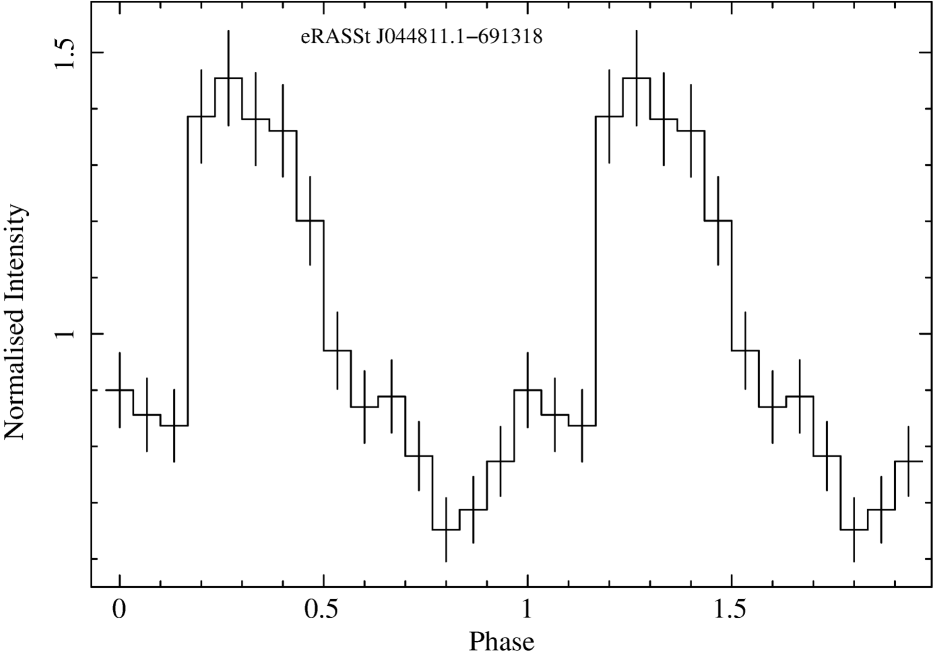
The derived periods of the three new pulsars with their 1 errors are listed in Table 3. We folded the light curves with the most probable period and show the pulse profiles in Fig. 4. The pulse profile of eRASSU J050810.4660653 is highly structured with a deep minimum. This dip is barely resolved in time and lasts 0.15 in phase. The statistical quality of the pulse profile from RX J0501.67034 is low. It is characterised by a main peak of triangular shape and an indication for a second smaller peak. Similarly, eRASSt J044811.1691318 shows a main peak with fast rise preceded by a smaller one.
3 Optical counterparts
We identified stars with V-magnitudes between 14.1 and 15.8 as optical counterparts for the three HMXB candidates, based on the values given in the Magellanic Cloud Photometric Survey (MCPS) of Zaritsky et al. (2004). Two of them also have entries in the Two Micron All Sky Survey (2MASS; Skrutskie et al. 2006) catalogue. In all three cases, the counterpart is found within the 2- error circle of the X-ray position (Tables 2 and 4). Furthermore, no other star brighter than V=17 mag and colours compatible with an early-type star is found within 10″. The brightness and colours (Table 4), together with the X-ray spectral and temporal properties strongly suggest a Be/X-ray binary nature for all three objects.
3.1 SALT spectroscopy
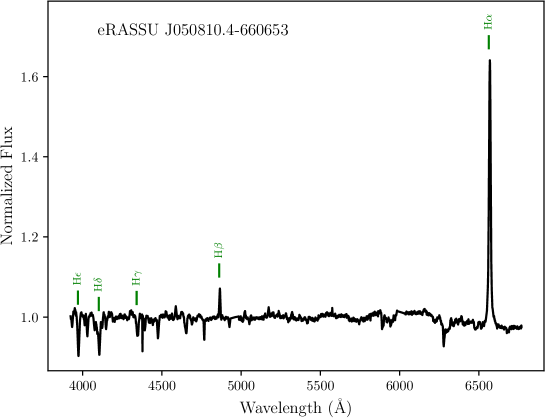
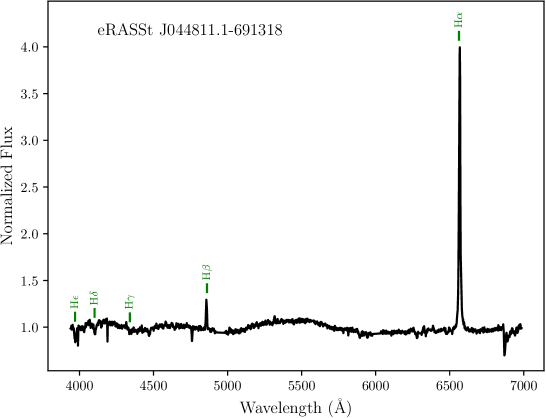
We obtained optical spectra from eRASSU J050810.4660653 and eRASSt J044811.1691318 using the Robert Stobie Spectrograph (RSS; Burgh et al. 2003) on SALT. To investigate the H line, the PG0900 VPH grating was used, which covered the spectral region 3920–7000 Å at a resolution of 6.2 Å. The observations were conducted under the SALT transient follow-up program and are detailed in Table 5.
The RSS spectra are presented in Fig. 5. Both sources show a single-peaked H emission line, which dominates the spectrum and is suggestive for a low to intermediate inclination angle of the Be disc. Also, H was seen in emission in both spectra. The measured equivalent width (EW) and full width at half maximum (FWHM) of the H lines seen from eRASSU J050810.4660653 and eRASSt J044811.1691318 are summarised in Table 5. In particular, the very strong H line measured for eRASSt J044811.1691318 indicates a large circum-stellar disc (Grundstrom & Gies 2006) and a long orbital period (Reig et al. 1997). Together with RX J0501.67034, which was identified as Be star previously (Negueruela & Coe 2002; Schmidtke et al. 1994), this also confirms eRASSU J050810.4660653 and eRASSt J044811.1691318 as Be/X-ray binary pulsars.
| Source | Observation | Exposure | EW (H) | FWHM (H) |
|---|---|---|---|---|
| name | start (UTC) | (s) | (Å) | (Å) |
| eRASSU J050810.4660653 | 2020-03-21 18:17:52 | 900 | -10.42 0.50 | 13.27 0.10 |
| eRASSt J044811.1691318 | 2021-12-14 20:09:42 | 1600 | -43.9 1.4 | 9.70 0.23 |
3.2 OGLE monitoring
| Source | OGLE III | OGLE IV | ||
|---|---|---|---|---|
| name | I-band | V-band | I-band | V-band |
| eRASSU J050810.4660653 | – | – | LMC512.20.12 | LMC512.20.v.2 |
| RX J0501.67034 | LMC129.2.19005 | LMC129.2.v.22055 | LMC508.31.16128 | LMC508.31.v.22929 |
| eRASSt J044811.1691318 | LMC142.3.163 | LMC142.3.v.52 | LMC531.23.22017 | LMC531.23.v.27359 |
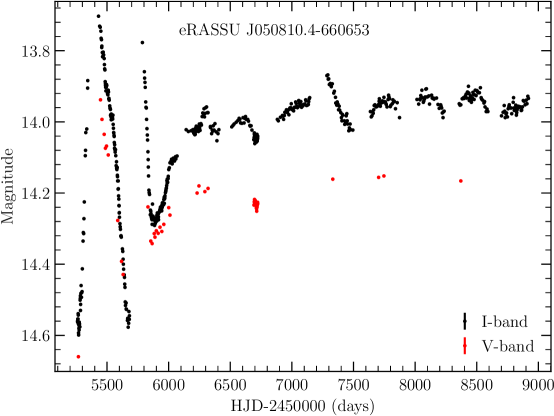
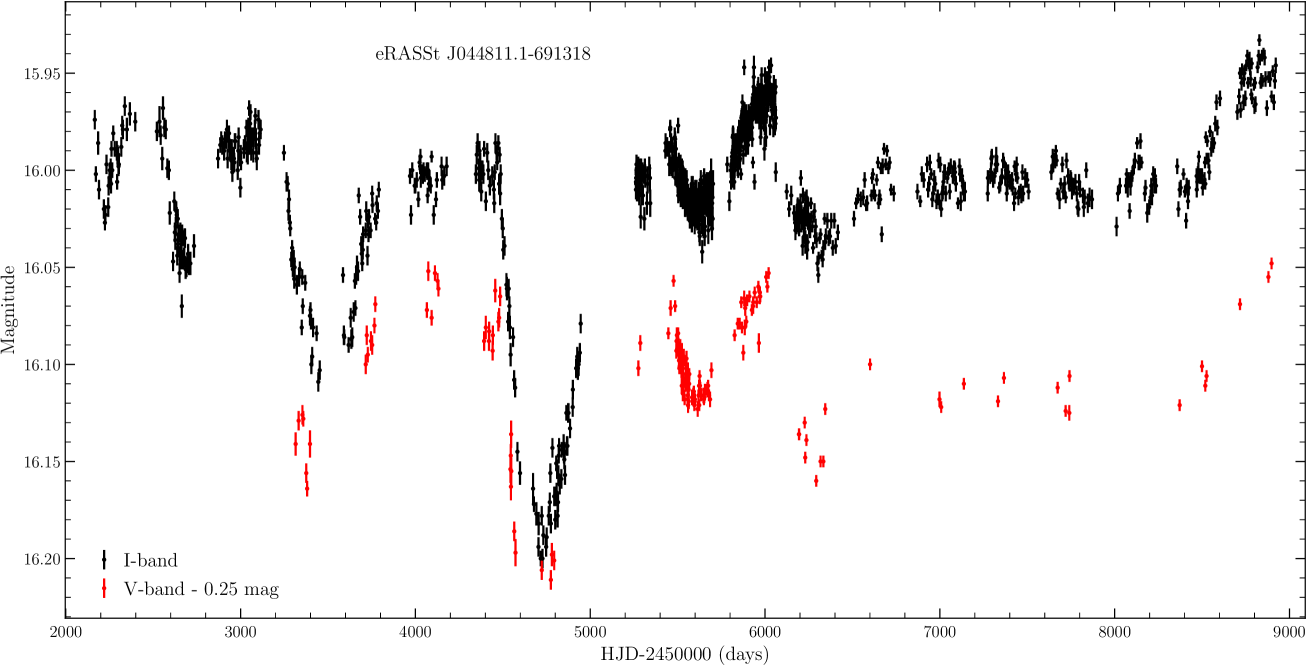
The optical counterparts of the three new Be/X-ray binary pulsars were monitored regularly as part of the OGLE project. Images were taken in the I- and V-band with the photometric magnitudes calibrated to the standard VI system. For all our three targets, their I- and V-band light curves are available, for eRASSU J050810.4660653 during phase IV of the OGLE project (ten years of monitoring; see Fig. 6) and for RX J0501.67034 and eRASSt J044811.1691318 during OGLE phases III and IV (in total 19.5 years, Fig. 7). Table 6 lists the OGLE IDs of the optical counterparts.
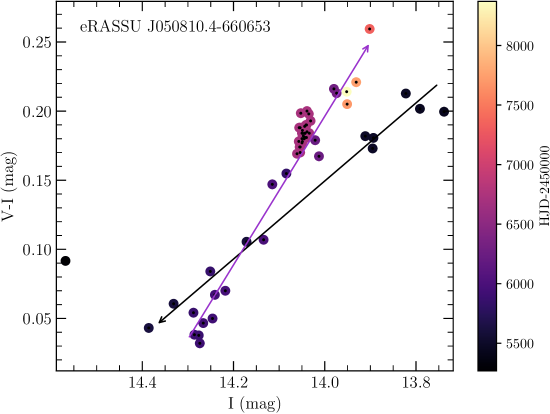
The OGLE light curves of eRASSU J050810.4660653 show large oscillations, initially by nearly one magnitude in I. The time between the first two deepest minima is 420 days. The decay in brightness after the second maximum seems to have stopped half way and the behaviour changed to much smaller brightness variations of 0.1 mag in I. These two phases in the light curves can also be identified in the V-I colour index, which is plotted in the top panel of Fig. 8. During the initial phase the colour index decreases, that is, the system gets bluer when fading in I. During the second phase, the system brightens again and returns to a redder colour. However, it did not reach the maximum brightness again and the colour ended up even redder than at the beginning of the light curve. In other words, the slopes of the paths in the V-I versus I plane were different during the two phases.
———-
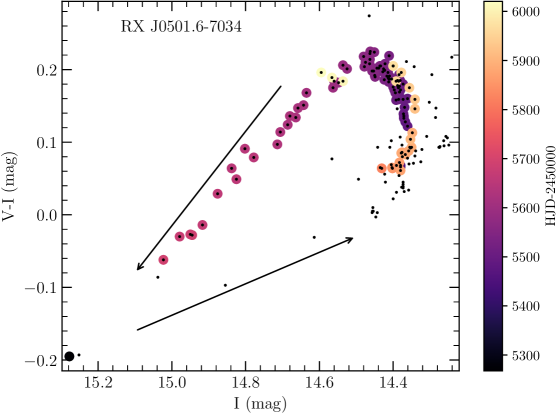
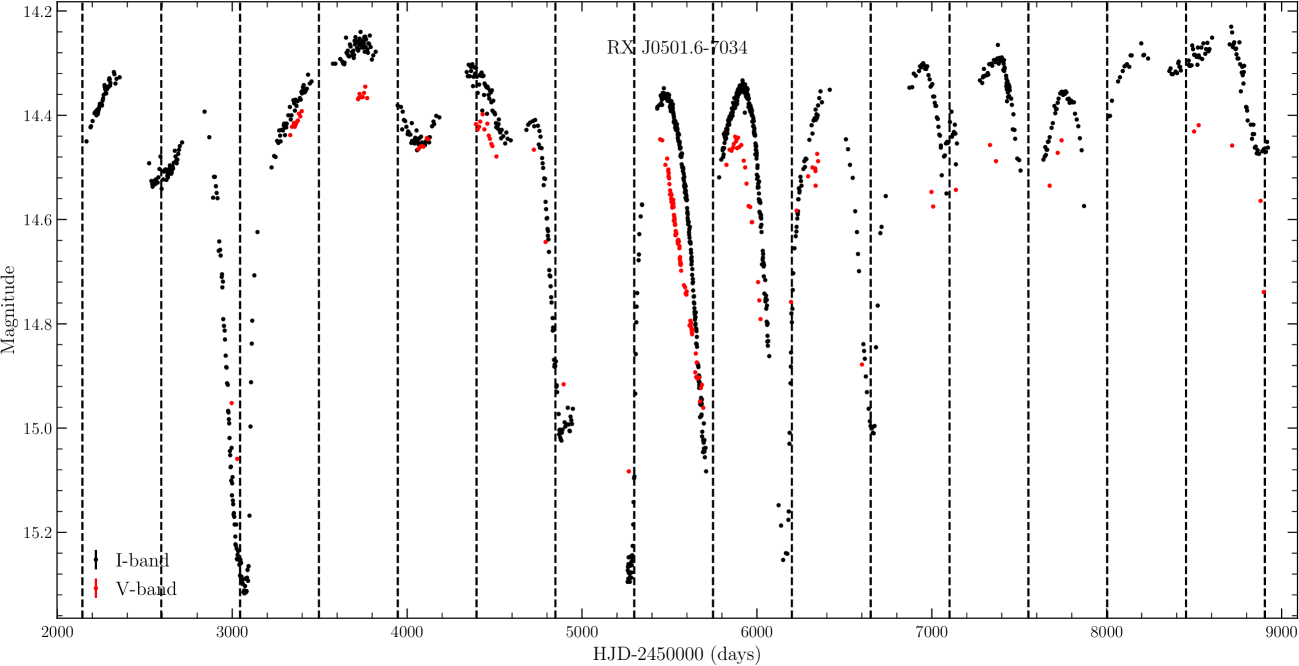
A similar behaviour is seen in the OGLE light curves of RX J0501.67034. Large brightness variations by up to 1 mag in the I band occurred several times with six deep minima during the OGLE monitoring period. The timescale between the deep minima is 450 days, also very similar to eRASSU J050810.4660653. The V-I colour index during the steep brightness declines became also bluer and returned to red during brightening in a closed loop as shown in Fig. 8 (middle panel).
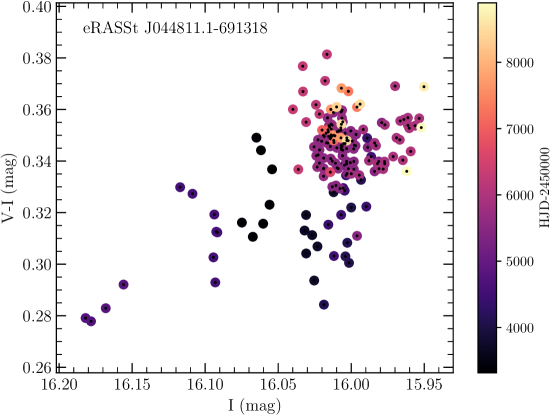
The optical counterpart of eRASSt J044811.1691318 is fainter and the largest variation was a 0.22 mag brightness decrease into a minimum with following recovery, which, unfortunately, was not fully covered by the OGLE observations. The V-I colour index does not follow such well-defined paths as in the other two systems, but eRASSt J044811.1691318 is also redder when brighter (Fig. 8, bottom panel).
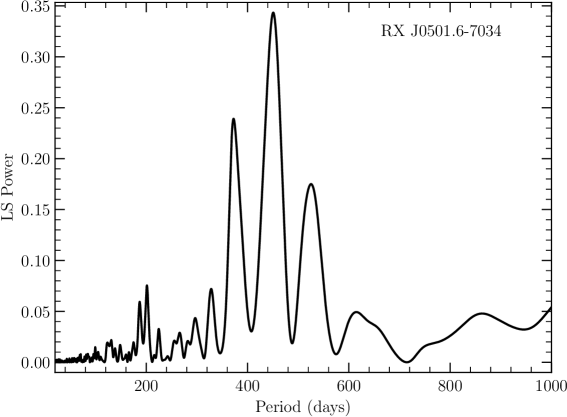
The strong variations in the OGLE I-band light curve of RX J0501.67034 (Fig. 7, top) follow a regular pattern. We conducted a Lomb-Scargle (LS) periodogram analysis (Lomb 1976; Scargle 1982) in the range of 20–1000 days to check for a periodic behaviour. The strongest peak in the LS periodogram (Fig. 9) is indeed found at 450.7 days. However, the deep dips in the light curves do not occur strictly periodic: some are shifted to earlier phases and some to later ones.
4 Discussion
We analysed X-ray and optical data of three HMXB candidates in the LMC. Two of them, eRASSU J050810.4660653 and eRASSt J044811.1691318, were discovered as new hard X-ray transients in eROSITA data, while RX J0501.67034 was known from observations with the Einstein observatory and ROSAT as candidate for a Be/X-ray binary (Long et al. 1981; Schmidtke et al. 1994). The arc-second accuracy of the XMM-Newton/EPIC positions allowed us to uniquely identify the optical counterparts of the new transients and confirm the association of the suggested counterpart SV* HV 2289 with RX J0501.67034. Their X-ray spectral and temporal properties, together with the long-term behaviour of optical brightness and colours of the counterparts, and, lastly, the existence of H emission, confirm all three objects as Be/X-ray binaries.
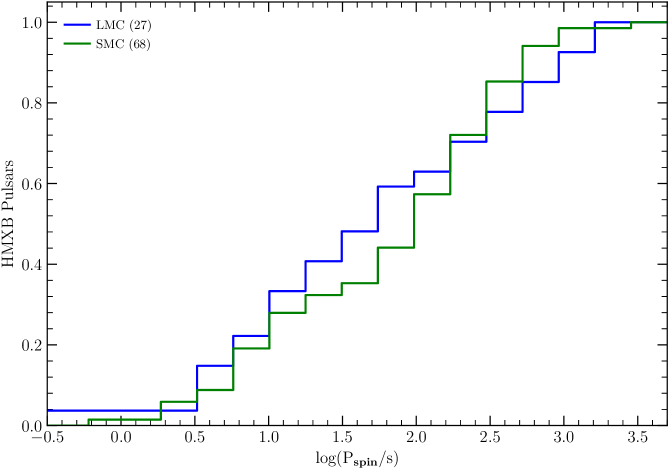
In addition, the analysis of the EPIC light curves revealed X-ray pulsations with periods of 40.6 s, 17.3 s, and 783.8 s, for eRASSU J050810.4660653, RX J0501.67034, and eRASSt J044811.1691318, respectively. The spin period distribution in the Small Magellanic Cloud (SMC) shows a remarkable bimodality with peaks at 10 s and 200 s and a minimum at 25–40 s (Haberl & Sturm 2016; Knigge et al. 2011). Although the number of known HMXB pulsars in the LMC (27 including the new discoveries from this work; Haberl et al. 2022b, who had already included eRASSU J050810.4660653) is still significantly lower than in the SMC (68), such a minimum is not obvious for the LMC. Figure 10 compares the cumulative spin period distributions of the known HMXBs in the Magellanic Clouds. The relative abundance of pulsars with spin periods between 10 s and 100 s is higher in the LMC. However, a statistical two-sample Kolmogorov-Smirnov test reveals only a difference of the cumulative distributions at the 1 level and more LMC systems are required to confirm the difference. It remains unclear if any of the suggested theories to explain the bimodality seen from the SMC by different types of supernovae (Knigge et al. 2011) or different accretion modes (Cheng et al. 2014) can also explain a smoother period distribution as possibly seen in the LMC.
To investigate the long-term X-ray light curve of the three BeXRBs we used the HIgh-energy LIght curve GeneraTor (HILIGT; König et al. 2022; Saxton et al. 2022)666http://xmmuls.esac.esa.int/upperlimitserver/ to search for serendipitous observations with XMM-Newton and Swift. From the available spectral models to convert count rates to fluxes we used a power law with photon index 1.0 and an absorption column density of cm-2. We converted the HILIGT 0.2–12 keV fluxes to the 0.2–10 keV band by re-normalising them to the values obtained from our spectral fits to the XMM-Newton spectra. The tool provides upper limits (2) when the source was not detected. We excluded ROSAT values due to its limited energy band. In the following, we further discuss our results from the sources individually.
4.1 eRASSU J050810.4660653
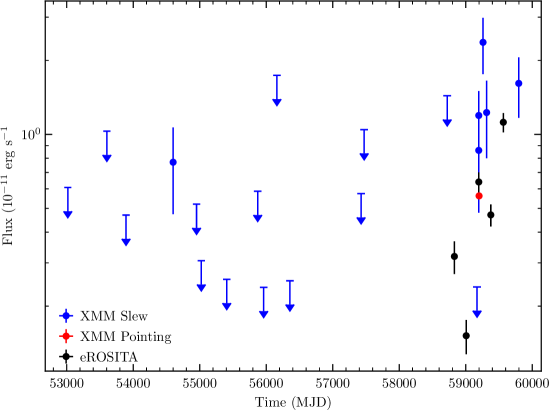
While most HMXBs in the north of the LMC are located in or near the well-observed supergiant shell LMC 4, this new BeXRB was found further west between the supergiant shells LMC 1 and LMC 5 (Meaburn 1980). The position of eRASSU J050810.4660653 was not covered by earlier XMM-Newton pointed observations, nor by Swift. HILIGT lists 20 XMM-Newton slews across the position of eRASSU J050810.4660653, which resulted in six detections, four of these close in time to the ToO observation. During one of them (on 2021 February 14) the highest flux was measured with 2.5 erg cm-2 s-1 while the lowest flux level was inferred from the eRASS1-eRASS2 scans (see Fig. 11), resulting in a flux ratio of 15.6. This is typical for persistent low-luminosity BeXRBs that do not exhibit large outbursts (Haberl & Sturm 2016) and this behaviour is most likely explained by a wide and nearly circular neutron star orbit (La Palombara et al. 2013). Several such systems were recently discovered in the LMC (Haberl et al. 2022b; Maitra et al. 2023).
4.2 RX J0501.67034
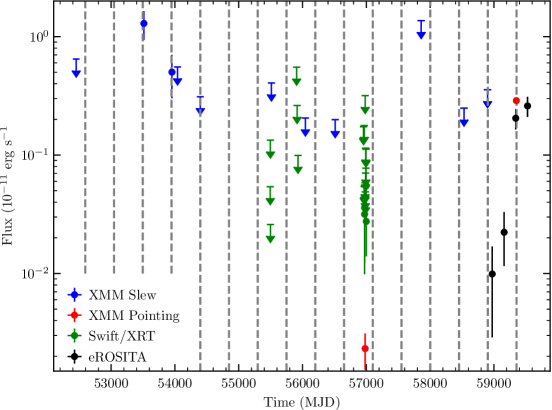
RX J0501.67034 (CAL 9) was discovered with the Einstein observatory with a 0.15–4.5 keV luminosity of 4 erg s-1. Although this estimate is only accurate to a factor of two (due to a model-dependent count rate conversion), it is within the range observed during the eROSITA and our XMM-Newton ToO observations. Using HILIGT, we found 11 XMM-Newton slews across RX J0501.67034. During a slew on 2005 May 23, the highest flux was recorded with 1.3 erg cm-2 s-1, while the lowest flux was measured at 2.3 erg cm-2 s-1 from an XMM-Newton pointed observation on 2014 November 20 (see Fig. 12), resulting in a flux ratio of 550. The position of RX J0501.67034 was also covered by 23 Swift/XRT observations. Five detections and 18 upper limits for the flux were all between the minimum and maximum flux seen by XMM-Newton. The long-term X-ray light curve demonstrates RX J0501.67034 as a highly variable BeXRB. Together with the relatively short spin period of the neutron star, the high variability of at least a factor of 300 is in line with the anti-correlation between these two measured variables found by Haberl & Sturm (2016) from BeXRB pulsars in the SMC.
In the OGLE light curves of RX J0501.67034 (Fig. 7, top), six extremely deep dips were observed in which the system faded by about one magnitude, while other variations had typical amplitudes of 0.2 mag. These brightness changes repeat nearly periodic every 451 days. However, the sharp deep dips do not occur always strictly at the same phases and shift slightly with time. Such a quasi-periodic behaviour suggests a binary orbital period of about 451 days, with additional effects originating in the interaction of the neutron star with the circum-stellar disc. Such behaviour was also observed from other BeXRBs in the Magellanic Clouds and could be caused by disc truncation, disc precession, or misalignment between the disc and the orbital plane (Martin et al. 2011; Okazaki 2012; Treiber et al. 2021).
Unfortunately, no X-ray measurements are available during the six deep optical dips. However, the highest X-ray fluxes were detected at phases when dips were expected, but did not occur. In particular, during the first two XMM-Newton slew detections the system stayed optically bright. On the other hand, lowest flux measurements are found between dip phases. This suggests the dips occur at the periastron passage of the neutron star, which is also likely to cause the dips. The additional long-term effects, as described in the previous paragraph, are then likely to be responsible for the appearance and depth of the dips in the optical light curves.
A similar hysteresis behaviour with closed loops as shown by RX J0501.67034 in the colour-magnitude diagram (Fig. 8) was seen from XMMU J010331.7730144 (Monageng et al. 2020). The authors discuss periodic mass loss from the Be star to be responsible for the quasi-periodicity of the outbursts and also for the colour-magnitude hysteresis seen from XMMU J010331.7730144. In their picture, the optically thick inner part of a truncated disc (blue) is removed faster than the outer part (optically thinner, redder) after the mass outflow from the Be star has stopped. The authors argue that the long periodicity of 1200 days from XMMU J010331.7730144 is unusual for an orbital period, particularly given the relatively small EW of the H line, which suggests a short orbital period according to the EW - orbital period correlation seen from BeXRBs (Reig et al. 1997). However, XMMU J010331.7730144 and RX J0501.67034 also show differences in their OGLE light curves. XMMU J010331.7730144 is characterised by extreme outbursts with amplitudes of 1 mag in the I-band, which occur quasi-periodically every 1200 days, while RX J0501.67034 shows dips with brightness decreases by a similar amount and on a shorter timescale of 451 days. The shorter period found for RX J0501.67034 together with a larger H EW (-10.4 Å measured in February 2001, Riquelme et al. 2012) may favour the orbital period scenario. In that case the neutron star truncates the outer disc when approaching periastron. This leads to decreasing disc brightness and bluer colour, as indicated by the upper arrow in the middle panel of Fig. 8. After periastron passage, the neutron star departs from the disc, which is then replenished, getting brighter and redder, following the path indicated by the lower arrow.
4.3 eRASSt J044811.1691318
This new BeXRB long-period pulsar (784 s) is located at the rim of the supergiant shell LMC 7 in the west of the LMC, where two others had been found: XMMU J045736.9692727 (318 s, Haberl et al. 2022b) and Swift J045106.8694803 (187 s, Klus et al. 2013). In particular, eRASSt J044811.1691318 is among the X-ray faintest BeXRBs in the Magellanic Clouds. From 13 XMM-Newton slew observations, only the upper limits of typically a few erg cm-2 s-1 have been inferred, similar or above the detections with eROSITA and XMM-Newton (ToO). HILIGT lists two deep archival XMM-Newton observations on 2017 September 28 with 0.210 keV flux of (1.40.6) erg cm-2 s-1 and 2019 October 15 with (2.00.6) erg cm-2 s-1. With the maximum observed flux during eRASS4, the variability is a factor of 100, but given the large flux uncertainties, it is not very well constrained (100). Nevertheless, this variability is still within the range observed from BeXRB pulsars with long spin periods of nearly 1000 s (Haberl & Sturm 2016).
5 Conclusions
The discovery of two new Be/X-ray binary systems in eROSITA data and the detection of pulsations from RX J0501.67034 increase the number of Be/X-ray binary pulsars in the LMC to 27. Their spin-period distribution does not show the bimodal characteristics of the SMC pulsars, but more LMC systems are still needed to test if this difference is significant.
Acknowledgements.
This work is based on data from eROSITA, the soft X-ray instrument aboard SRG, a joint Russian-German science mission supported by the Russian Space Agency (Roskosmos), in the interests of the Russian Academy of Sciences represented by its Space Research Institute (IKI), and the Deutsches Zentrum für Luft- und Raumfahrt (DLR). The SRG spacecraft was built by Lavochkin Association (NPOL) and its subcontractors, and is operated by NPOL with support from the Max Planck Institute for Extraterrestrial Physics (MPE). The development and construction of the eROSITA X-ray instrument was led by MPE, with contributions from the Dr. Karl Remeis Observatory Bamberg & ECAP (FAU Erlangen-Nürnberg), the University of Hamburg Observatory, the Leibniz Institute for Astrophysics Potsdam (AIP), and the Institute for Astronomy and Astrophysics of the University of Tübingen, with the support of DLR and the Max Planck Society. The Argelander Institute for Astronomy of the University of Bonn and the Ludwig Maximilians Universität Munich also participated in the science preparation for eROSITA. The eROSITA data shown here were processed using the eSASS/NRTA software system developed by the German eROSITA consortium. This work used observations obtained with XMM-Newton, an ESA science mission with instruments and contributions directly funded by ESA Member States and NASA. The XMM-Newton project is supported by the DLR and the Max Planck Society. This research has made use of the VizieR catalogue access tool, CDS, Strasbourg, France. The original description of the VizieR service was published in A&AS 143, 23. This work has made use of data from the European Space Agency (ESA) mission Gaia (https://www.cosmos.esa.int/gaia), processed by the Gaia Data Processing and Analysis Consortium (DPAC, https://www.cosmos.esa.int/web/gaia/dpac/consortium). Funding for the DPAC has been provided by national institutions, in particular the institutions participating in the Gaia Multilateral Agreement. LD acknowledges support from the Bundesministerium für Wirtschaft und Energie through the DLR grant FKZ 50 QR 2102.References
- Arnaud (1996) Arnaud, K. A. 1996, in ASP Conf. Ser. 101: Astronomical Data Analysis Software and Systems V, 17
- Brunner et al. (2022) Brunner, H., Liu, T., Lamer, G., et al. 2022, A&A, 661, A1
- Buckley et al. (2006) Buckley, D. A. H., Swart, G. P., & Meiring, J. G. 2006, in Society of Photo-Optical Instrumentation Engineers (SPIE) Conference Series, Vol. 6267, Society of Photo-Optical Instrumentation Engineers (SPIE) Conference Series, ed. L. M. Stepp, 62670Z
- Burgh et al. (2003) Burgh, E. B., Nordsieck, K. H., Kobulnicky, H. A., et al. 2003, in Society of Photo-Optical Instrumentation Engineers (SPIE) Conference Series, Vol. 4841, Instrument Design and Performance for Optical/Infrared Ground-based Telescopes, ed. M. Iye & A. F. M. Moorwood, 1463–1471
- Cash (1979) Cash, W. 1979, ApJ, 228, 939
- Cheng et al. (2014) Cheng, Z.-Q., Shao, Y., & Li, X.-D. 2014, ApJ, 786, 128
- Cowley et al. (1984) Cowley, A. P., Crampton, D., Hutchings, J. B., et al. 1984, ApJ, 286, 196
- Crampton et al. (1985) Crampton, D., Cowley, A. P., Thompson, I. B., & Hutchings, J. B. 1985, AJ, 90, 43
- Dickey & Lockman (1990) Dickey, J. M. & Lockman, F. J. 1990, ARA&A, 28, 215
- Gaia Collaboration et al. (2021) Gaia Collaboration, Brown, A. G. A., Vallenari, A., et al. 2021, A&A, 649, A1
- Gaia Collaboration et al. (2016) Gaia Collaboration, Prusti, T., de Bruijne, J. H. J., et al. 2016, A&A, 595, A1
- Gregory & Loredo (1996) Gregory, P. C. & Loredo, T. J. 1996, ApJ, 473, 1059
- Grundstrom & Gies (2006) Grundstrom, E. D. & Gies, D. R. 2006, ApJ, 651, L53
- Haberl et al. (2008) Haberl, F., Eger, P., & Pietsch, W. 2008, A&A, 489, 327
- Haberl et al. (2022a) Haberl, F., Maitra, C., Carpano, S., et al. 2022a, A&A, 661, A25
- Haberl et al. (2020) Haberl, F., Maitra, C., Carpano, S., et al. 2020, The Astronomer’s Telegram, 13609, 1
- Haberl et al. (2022b) Haberl, F., Maitra, C., Vasilopoulos, G., et al. 2022b, A&A, 662, A22
- Haberl et al. (2021) Haberl, F., Salganik, A., Maitra, C., et al. 2021, The Astronomer’s Telegram, 15133, 1
- Haberl & Sturm (2016) Haberl, F. & Sturm, R. 2016, A&A, 586, A81
- Klus et al. (2013) Klus, H., Bartlett, E. S., Bird, A. J., et al. 2013, MNRAS, 428, 3607
- Knigge et al. (2011) Knigge, C., Coe, M. J., & Podsiadlowski, P. 2011, Nature, 479, 372
- König et al. (2022) König, O., Saxton, R. D., Kretschmar, P., et al. 2022, Astronomy and Computing, 38, 100529
- La Palombara et al. (2013) La Palombara, N., Mereghetti, S., Sidoli, L., Tiengo, A., & Esposito, P. 2013, Mem. Soc. Astron. Italiana, 84, 626
- Lomb (1976) Lomb, N. R. 1976, Ap&SS, 39, 447
- Long et al. (1981) Long, K. S., Helfand, D. J., & Grabelsky, D. A. 1981, ApJ, 248, 925
- Luck et al. (1998) Luck, R. E., Moffett, T. J., Barnes, Thomas G., I., & Gieren, W. P. 1998, AJ, 115, 605
- Maitra et al. (2020a) Maitra, C., Haberl, F., Carpano, S., et al. 2020a, The Astronomer’s Telegram, 13610, 1
- Maitra et al. (2020b) Maitra, C., Haberl, F., Koenig, O., et al. 2020b, The Astronomer’s Telegram, 13650, 1
- Maitra et al. (2021) Maitra, C., Haberl, F., Vasilopoulos, G., et al. 2021, A&A, 647, A8
- Maitra et al. (2023) Maitra, C., Kaltenbrunner, D., Haberl, F., et al. 2023, A&A, 669, A30
- Martin et al. (2011) Martin, R. G., Pringle, J. E., Tout, C. A., & Lubow, S. H. 2011, MNRAS, 416, 2827
- Massey (2002) Massey, P. 2002, ApJS, 141, 81
- Meaburn (1980) Meaburn, J. 1980, MNRAS, 192, 365
- Monageng et al. (2020) Monageng, I. M., Coe, M. J., Buckley, D. A. H., et al. 2020, MNRAS, 496, 3615
- Negueruela & Coe (2002) Negueruela, I. & Coe, M. J. 2002, A&A, 385, 517
- Okazaki (2012) Okazaki, A. T. 2012, in Astronomical Society of the Pacific Conference Series, Vol. 464, Circumstellar Dynamics at High Resolution, ed. A. C. Carciofi & T. Rivinius, 177
- Pavlinsky et al. (2021) Pavlinsky, M., Tkachenko, A., Levin, V., et al. 2021, A&A, 650, A42
- Predehl et al. (2021) Predehl, P., Andritschke, R., Arefiev, V., et al. 2021, A&A, 647, A1
- Reig et al. (1997) Reig, P., Fabregat, J., & Coe, M. J. 1997, A&A, 322, 193
- Riquelme et al. (2012) Riquelme, M. S., Torrejón, J. M., & Negueruela, I. 2012, A&A, 539, A114
- Rolleston et al. (2002) Rolleston, W. R. J., Trundle, C., & Dufton, P. L. 2002, A&A, 396, 53
- Salganik et al. (2022) Salganik, A., Tsygankov, S. S., Lutovinov, A. A., et al. 2022, MNRAS, 514, 4018
- Saxton et al. (2022) Saxton, R. D., König, O., Descalzo, M., et al. 2022, Astronomy and Computing, 38, 100531
- Scargle (1982) Scargle, J. D. 1982, ApJ, 263, 835
- Schmidtke et al. (1994) Schmidtke, P. C., Cowley, A. P., Frattare, L. M., et al. 1994, PASP, 106, 843
- Skrutskie et al. (2006) Skrutskie, M. F., Cutri, R. M., Stiening, R., et al. 2006, AJ, 131, 1163
- Strüder et al. (2001) Strüder, L., Briel, U., Dennerl, K., et al. 2001, A&A, 365, L18
- Sturm et al. (2013) Sturm, R., Haberl, F., Pietsch, W., et al. 2013, A&A, 558, A3
- Treiber et al. (2021) Treiber, H., Vasilopoulos, G., Bailyn, C. D., et al. 2021, MNRAS, 503, 6187
- Turner et al. (2001) Turner, M. J. L., Abbey, A., Arnaud, M., et al. 2001, A&A, 365, L27
- Udalski et al. (2008) Udalski, A., Szymanski, M. K., Soszynski, I., & Poleski, R. 2008, Acta Astron., 58, 69
- Udalski et al. (2015) Udalski, A., Szymański, M. K., & Szymański, G. 2015, Acta Astron., 65, 1
- Vasilopoulos et al. (2013) Vasilopoulos, G., Maggi, P., Haberl, F., et al. 2013, A&A, 558, A74
- Vasilopoulos et al. (2017) Vasilopoulos, G., Zezas, A., Antoniou, V., & Haberl, F. 2017, MNRAS, 470, 4354
- Verner et al. (1996) Verner, D. A., Ferland, G. J., Korista, K. T., & Yakovlev, D. G. 1996, ApJ, 465, 487
- Wilms et al. (2000) Wilms, J., Allen, A., & McCray, R. 2000, ApJ, 542, 914
- Zaritsky et al. (2004) Zaritsky, D., Harris, J., Thompson, I. B., & Grebel, E. K. 2004, AJ, 128, 1606
Appendix A eROSITA light curves