Sub-kiloparsec empirical relations and excitation conditions of HCN and HCO+ =3-2 in nearby star-forming galaxies
We present new HCN and HCO+ (=3–2) images of the nearby star-forming galaxies (SFGs) NGC 3351, NGC 3627, and NGC 4321. The observations, obtained with the Morita ALMA Compact Array, have a spatial resolution of 290–440 pc and resolve the inner 0.6-1 kpc of the targets, as well as the southern bar end of NGC 3627. We complement this data set with publicly available images of lower excitation lines of HCN, HCO+, and CO and analyse the behaviour of a representative set of line ratios: HCN(3–2)/HCN(1–0), HCN(3–2)/HCO+(3–2), HCN(1–0)/CO(2–1), and HCN(3–2)/CO(2–1). Most of these ratios peak at the galaxy centres and decrease outwards. We compare the HCN and HCO+ observations with a grid of one-phase, non-local thermodynamic equilibrium (non-LTE) radiative transfer models and find them compatible with models that predict subthermally excited and optically thick lines. We study the systematic variations of the line ratios across the targets as a function of the stellar surface density (), the intensity-weighted CO(2–1) (), and the star formation rate surface density (). We find no apparent correlation with , but positive correlations with the other two parameters, which are stronger in the case of . The HCN/CO- relations show 0.3 dex galaxy-to-galaxy offsets, with HCN(3–2)/CO(2–1)- being 2 times steeper than HCN(1–0)/CO(2–1). In contrast, the HCN(3–2)/HCN(1–0)- relation exhibits a tighter alignment between galaxies. We conclude that the overall behaviour of the line ratios cannot be ascribed to variations in a single excitation parameter (e.g. density or temperature).
Key Words.:
Galaxies: star formation – Radio lines: galaxies – Radio lines: ISM – Galaxies: individual: NGC 3351; NGC 3627; NGC 43211 Introduction
Gas volume density (; hereafter, density) is a key parameter of star formation (SF) theories since it regulates the onset and timescale of the gravitational collapse of molecular clouds (McKee & Ostriker 2007; Klessen & Glover 2016). Unfortunately, density is also an elusive quantity from an observational point of view. In the last decades, the =1–0 lines of HCN and HCO+ have been widely adopted as proxies for the dense molecular phase in external galaxies (Helfer & Blitz 1997; Gao & Solomon 2004; Graciá-Carpio et al. 2008). Compared with the low- lines of CO (the default bulk gas tracer), HCN and HCO+ lines have 30-40 times stronger dipoles (Schöier et al. 2005) and lower opacities, thus requiring 1-2 dex higher densities to be effectively excited. This would favour the HCN and HCO+ emission being dominated by dense gas close the phase that is actually forming stars. Based on this assumption, several surveys have derived constraints on SF theories by studying how the CO and HCN (or HCO+) emission correlates with the star formation rate (SFR) within galaxies (Usero et al. 2015; Gallagher et al. 2018b; Jiménez-Donaire et al. 2019) or among different galaxy populations (Gao & Solomon 2004; Graciá-Carpio et al. 2008; García-Burillo et al. 2012).
The assumption that HCN and HCO+ lines are tracers of dense gas mass has been questioned by some studies of Galactic clouds (Kauffmann et al. 2017; Pety et al. 2017; Barnes et al. 2020; Tafalla et al. 2021). In agreement with recent simulations (Jones et al. 2021), those studies have found that the total HCN(1–0) and HCO+(1–0) luminosities of some clouds have significant contributions from gas at moderate or even low volume densities ( cm-3). This can be explained by a decrease in the effective density for excitation due to radiative trapping (Scoville & Solomon 1974), and by the fact that density PDFs of molecular clouds are bottom-heavy.
It is thus mandatory to revise the excitation of the HCN(1–0) and HCO+(1–0) lines in an extragalactic context. The HCN or HCO+ =3–2 lines are ideal tools for this purpose since their fiducial critical densities for excitation are 1 dex higher (Shirley 2015), thus reducing the contribution from low-density gas. Due to their faintness, observations of the =3–2 lines in external galaxies have been relatively scarce and mostly limited to bright sources (e.g. Graciá-Carpio et al. 2008; Saito et al. 2018; Tan et al. 2018). Very few works have observed them in normal, star-forming galaxies (SFGs; L), let alone resolving their spatial distributions. Dedicated =3–2 observations can help to understand the general behaviour of the =1–0 lines, which, regardless of the ambiguities pointed out by Galactic studies, remain more accessible in nearby galaxies.
In this series of papers, we report on 290–440 pc resolution images of the HCN(3–2) and HCO+(3–2) emission in three SFGs obtained with the Morita Atacama Compact Array (ACA). This first paper describes the new data, which we compare with previous interferometer images of lower-excitation lines (HCN(1–0), HCO+(1–0), CO(1–0), and CO(2–1)). We use this data set to resolve and discuss the excitation of HCN and HCO+ across the discs of SFGs for the first time. In a subsequent paper (hereafter Paper II), we study the distribution of the molecular interstellar medium (ISM) properties across the three galaxies by means of a detailed multi-zone radiative transfer modelling.
2 Sample selection
| NGC | Morph. | RA | DEC | SFR | Scale at | |||||
|---|---|---|---|---|---|---|---|---|---|---|
| Type | (hh:mm:ss.s) | (::) | (Mpc) | () | ( yr-1) | () | () | (km s-1) | (kpc) | |
| 3351 | SB(r)b | 10:43:57.8 | 11:42:13.2 | 10.0 | 2.3 | 1.3 | 45 | 193 | 775 | 0.29 |
| 3627 | SAB(s)b | 11:20:15.0 | 12:59:29.4 | 11.3 | 6.8 | 3.8 | 57 | 173 | 715 | 0.33 |
| 4321 | SAB(s)bc | 12:22:54.9 | 15:49:20.3 | 15.2 | 5.6 | 3.6 | 38 | 156 | 1572 | 0.44 |
The motivation for our HCN(3–2) and HCO+(3–2) observations was to resolve the excitation of these species in SFGs, which has been poorly studied so far (Sect. 1). To select the targets for the ACA, we searched the ALMA archive for nearby SFGs with available high-quality maps of lower-excitation lines (i.e. HCN(1–0), HCO+(1–0), and low- CO). We selected NGC 3351, NGC 3627, and NGC 4321 (Table 1), which are the brightest objects in a small HCN(1–0) and HCO+(1–0) survey by Gallagher et al. (2018b), belong to the PHANGS-ALMA sample (Leroy et al. 2021b), and have a rich ancillary data set.
The targets are barred spiral galaxies with Milky Way-like stellar masses and SFRs, hosting negligible (NGC 3351) to weak (NGC 3627: LINER; NGC 4321: Hii/LINER) nuclear activity (Ho et al. 1997; Gadotti et al. 2019). However, they show different gas morphologies over the inner disc regions studied here (Fig. 1, bottom). NGC 3351 hosts a prominent starburst ring (SFR0.6 M⊙; Gadotti et al. 2019; Linden et al. 2020) at 0.4 kpc radius, where dynamical resonances have piled up the gas at the two contact points with the bar (Leaman et al. 2019; Williams et al. 2021). NGC 3627 hosts interaction-triggered gas inflows through the spiral arms and bar (Iles et al. 2022) that enhance the star formation rate in the bar ends through gas compression (Murphy et al. 2015; Watanabe et al. 2019). NGC 4321’s powerful bar is flanked by two spiral-like dust lanes down to the nuclear region, where they join a 0.6 kpc-long secondary bar (Garcia-Burillo et al. 1998; Erwin 2004) that is parallel to the main one. At our 290–440 pc resolution, some of these morphological features are partly blurred (e.g. compare colours and contours in Fig. 1-bottom), but still recognisable in some line maps.
3 Data and physical parameters
3.1 Molecular line data
3.1.1 New ACA band-6 observations
| NGC | Obs. Time | Mosaic | No. EB | Lengths | MRS | Native Beam | RMS noise†,⋆ () | Jy/K† |
|---|---|---|---|---|---|---|---|---|
| (h) | (m) | (′′) | () | (mK) | ||||
| 3351 | 5.0 | 1 pointing | 4 | 7.0–44.2 | 33 | 2.0 | 2.07 | |
| 3627 | 8.6 | 3-point linear | 6 | 7.0–44.7 | 29 | 1.8 | 2.07 | |
| 4321 | 4.3 | 1 pointing | 3 | 7.0–44.5 | 34 | 2.1 | 2.06 |
: measured at the final 610 km s-1 resolution.
: measured at the phase centre.
We obtained new band-6 (211–275 GHz) observations with the ACA in ALMA Cycle 6 under project 2018.1.01530 (PI: A. Usero). We simultaneously observed HCN(3–2) and HCO+(3–2) (265-267 GHz sky frequency) in the three target galaxies. Table 2 presents a summary of the observations. The data were acquired during April and May 2019, with 11 antennas available in all but a few cases. We observed a single pointing towards the inner discs of NGC 3351 and NGC 4321 – the full width at half maximum (FWHM) of the primary beam at the observing frequency is – and a three-pointing linear mosaic in NGC 3627. The footprints are shown in Fig. 1 (bottom). The spectral setup included two 1.875 GHz spectral windows centred on the redshifted HCN(3–2) and HCO+(3–2) lines with a spectral resolution of 1.938 MHz ( km s-1).
The raw ACA data were calibrated with the ALMA calibration pipeline implemented in the CASA software (version 5.4.0-70; McMullin et al. 2007). We only added a few minor flags when one of the antennas showed an unexpected amplitude or phase behaviour in the point-source calibrators. Next, we processed the calibrated measurement set (MS) files with the PHANGS-ALMA pipeline (version 2.0; for details, see Leroy et al. 2021a). The pipeline generated CLEANed, continuum-subtracted line cubes corrected for primary beam attenuation, expressed in Kelvin units, with a pixel size of , and a typical beam of . We confirmed that the output cubes had good quality and did not show apparent emission in the residuals. We also verified that the statistics of negative values is similar in channels with and without line emission, suggesting that the CLEANing – performed on 8.8 km s-1 channels as a tradeoff between resolution and the signal-to-noise ratio (S/N) – was as deep as possible given our sensitivity. As a final step, we brought all the data cubes to a common angular and spectral resolution using the GILDAS software package333https://www.iram.fr/IRAMFR/GILDAS/. The elliptical Gaussian beam was rounded to 6 (290–440 pc) by convolution with a Gaussian kernel. Velocity channels were bilinearly interpolated onto a 10 km s-1 grid. We truncated the images where the primary beam correction is 4. For each line cube, we generated a noise map by measuring the rms over channels outside the velocity range of the galaxy (Table 2).
We checked if the observations filter out a significant fraction of extended emission above their maximum recoverable scale (MRS; 30 1.6–2.4 kpc). We compared the fluxes of the PHANGS-ALMA CO(2–1) maps of our targets derived from ACA observations with and without short-spacing corrections at matching resolution. Since CO(2–1), HCN(3–2), and HCO+(3–2) have similar rest frequencies, the beam sizes and MRS of the 7m-array observations are similar. We found that, on a pixel-by-pixel basis within our S/N-clipped regions (see Sect. 3.1.3), the 7m array alone missed 5% (NGC 3351), 10% (NGC 3627), and 18% (NGC 4321) of the CO(2–1) flux recovered by the 7m+Total Power observations. These percentages only show small spatial variations. These are upper bounds for the percentage of flux filtered out by our 7m-only observations of HCN(3–2) and HCO+(3–2), since the distribution of the HCN and HCO+ emission in galaxy discs is radially more compact than that of CO (e.g. Gallagher et al. 2018b; Jiménez-Donaire et al. 2019). A related issue is that CLEAN might not recover faint emission that remains below the noise level in individual channels (Leroy et al. 2021a). This could explain why some integrated intensity maps (Fig. 1) show signatures of negative sidelobes (amplified by the primary beam correction), whereas the line cubes do not. The statistics of integrated intensity values points to a mean deficit at 1-level in NGC 4321 and less significant in the other two galaxies. The impact of this on the spatially integrated flux could be important, but, on a pixel-by-pixel basis, it would remain 20% for the S/N¿5 regions that we select for analysis. Finally, we emphasise that, since the spatial distributions and S/N of HCN(3–2) and HCO+(3–2) are similar, any flux loss would affect them in a very similar way.
3.1.2 Archival data
| Lines | Observations | ||||||
| name | telescope | ref. | |||||
| (GHz) | (cm-3) | () | (mK) | ||||
| HCN(3–2) | 265.89 | 6 | 1.8 – 2.2 | ALMA (7m) | 1 | ||
| HCO+(3–2) | 267.56 | 6 | 1.8 – 2.0 | ALMA (7m) | 1 | ||
| HCN(1–0) | 88.63 | 5 | 2.4 – 5.0 | ALMA (12m) + IRAM30m | 2 | ||
| HCO+(1–0) | 89.19 | 5 | 4.2 – 6.6 | ALMA (12m) + IRAM30m | 2 | ||
| CO(1–0) | 115.27 | 8 | — | BIMA+NRAO12m or ALMA (12m+7m+TP) | 3 | ||
| CO(2–1) | 230.54 | 1.5-1.7 | 5.6 – 16.7 | ALMA (12m+7m+TP) | 4 | ||
We complement our new ACA data with previous line observations of our three targets (Table 4). Gallagher et al. (2018b) obtained 5′′ resolution HCN(1–0) and HCO+(1–0) images with the ALMA 12m array. They applied short-spacing corrections using IRAM 30m images from the EMPIRE survey (Jiménez-Donaire et al. 2019) and project 058-16 (PI: A. Usero). Gallagher et al. (2018b) also collected CO(1–0) images and homogenised them to a common angular resolution of . Those for NGC 3351 and NGC 3627 were fetched from the BIMA SONG survey (Helfer et al. 2003). They combined BIMA interferometer observations with short-spacing information from the NRAO 12-m antenna at Kitt Peak. The NGC 4321 image was part of the ALMA Science Verification program555https://almascience.eso.org/alma-data/science-verification and combined observations with the 12m, 7m, and Total Power arrays. We obtained CO(2–1) line cubes from the PHANGS-ALMA survey (public data release – version 4.0, Leroy et al. 2021b). These data have high spatial resolution (1.5′′–1.771–121 pc) comparable to typical giant molecular cloud (GMC) scales, high sensitivity, and broad coverage from the combination of the 12m, 7m and Total Power arrays. Throughout this paper, we derive bulk molecular gas properties from these high-quality CO(2–1) data, rather than from the CO(1–0) images.
All of these line cubes have a wider Field of View (FoV) than our ACA images. We convolved them to our working resolution of km s-1, resampled them on the voxel grids of the ACA data, and scaled them to Kelvin units when necessary. In the case of the -resolution CO(1–0) data, we scaled the CO(2–1) maps at 6′′ by the CO(1–0)/CO(2–1) ratio maps at 8′′ to generate artificial 6′′-resolution CO(1–0) images. From a study of nearby galaxies at similar resolution (Saito et al., in prep.), we expect this approximation to be accurate within 5%. Noise maps were generated as in Sect. 3.1.1.
As a reference, we quote in Table 4 the effective excitation densities defined by Shirley (2015) in terms of detectability (density needed to generate a 1 K km s-1 line). Other definitions exist (e.g. Leroy et al. 2017) but these values already illustrate that the relative strength of the lines could vary across 3 dex in density.
3.1.3 Generation of moment maps
We generated moment maps by integrating the line cubes over a certain velocity window. Rather than fixing the same broad window across an entire galaxy, we adapted the window edges to the line emission within each pixel. This allowed us to recover the emission without lowering the S/N where lines are narrow. Otherwise, of the sightlines detected in HCN(3–2) and/or HCO+(3–2) would have been misclassified as non-detections.
Specifically, we considered pixels where the line peak within the galaxy velocity range is higher than 1.5. We fitted a single Gaussian to the line in each pixel and afterwards: (1) If the fit simultaneously satisfied that its velocity centroid lied within the galaxy-wide velocity range, its FWHM did not exceed this range, and its area had a S/N , then we placed the window limits at the 5% level of the fitted Gaussian. (2) If any of these criteria were not fulfilled, we adopted the limits derived in the same way from the high-S/N CO(2–1) line. (3) If the CO(2–1) fit did not meet these criteria either, we adopted the galaxy velocity range. Once the velocity window was determined, we calculated the velocity-integrated moments of order 0 (integrated intensity, ), 1 (mean velocity), and 2 (velocity dispersion). Moment uncertainties follow the standard formulas of error propagation.
We consider that a molecular line is detected when the S/N of the integrated intensity is . This strict criterion mainly selects pixels with the velocity windows defined by method (1) and where methods (1) and (2) typically differ by %.
3.1.4 Intensity-weighted cloud-scale CO(2–1) intensity
At their – (71-121 pc) resolution, the CO(2–1) lines from PHANGS-ALMA are good proxies for cloud-scale properties (Sun et al. 2018, 2020; Leroy et al. 2021b). This information is partly blurred by beam dilution if the lines are directly convolved to a coarser resolution. To remedy this problem, Leroy et al. (2016) put forward an alternative scheme to construct intensity-weighted averages of cloud-scale properties from high resolution data. Here we follow the modified approach by Gallagher et al. (2018a) (their Equation 1) to construct the intensity-weighted average of the CO(2–1) integrated intensity over 440 pc apertures (hereafter or just ) from the 1.5′′-1.7′′-resolution maps. We correct for galaxy inclination by applying a cosine factor, as in Sun et al. (2022). Barring differences in the CO conversion factor, would be a good proxy for the cloud-scale surface density, but also of the gas volume density when the spatial resolution is fixed (e.g. Leroy et al. 2016; Gallagher et al. 2018a; Utomo et al. 2018).
| NGC 3351 | NGC 3627 | NGC 4321 |
| New HCN(3–2) and HCO+(3–2) Maps | ||
 |
 |
 |
 |
 |
 |
| CO(2–1) Maps from PHANGS-ALMA | ||
 |
 |
 |
3.2 Ancillary environment and SFR data
The stellar surface density () traces the gravitational potential in the inner discs of massive galaxies, since stars dominate their mass budget (Casasola et al. 2017). We derive from the 3.6 m continuum images taken with Spitzer/IRAC as part of the S4G survey (Sheth et al. 2010; Muñoz-Mateos et al. 2013; Querejeta et al. 2015)666https://sha.ipac.caltech.edu/applications/Spitzer/SHA/. We subtracted a flat background equal to the mode value in signal-free regions. There was no need to remove any foreground star over the studied regions. The light-to-mass calibration follows Leroy et al. (2008):
| (1) |
where stands for the disc inclination. This recipe disregards potential variations in the mass-to-light ratio and other contributions to the 3.6m emission (Meidt et al. 2012, 2014).
Our star formation rate surface density () combines unobscured (traced by H) and obscured (traced by the 24m continuum) emission from massive stars, as in Kennicutt et al. (2009). Other SFR tracers yield qualitatively the same results in our targets (Gallagher et al. 2018b). We use the Convolved and OPTimised (COPT) H maps from the PHANGS-MUSE survey (DR 2.2, Emsellem et al. 2022), which have a Gaussian point spread function (PSF) of , and the 24 m MIPS maps from the Spitzer archive, which we processed as the 3.6m data. We combine their flux densities () to derive , with H typically accounting for 20% of the total:
| (2) |
We convolved these data sets to our working resolution. We applied a Gaussian kernel to the H images and the IDL routines by Aniano et al. (2011) to the 3.6 m and 24 m maps.
4 Integrated moments from the ACA band-6 data
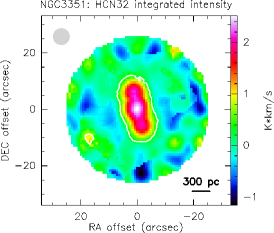
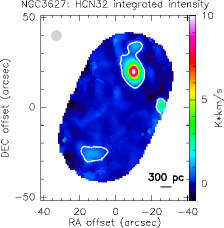
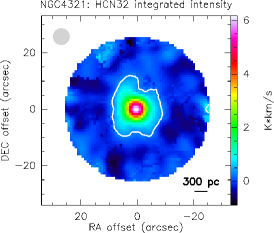
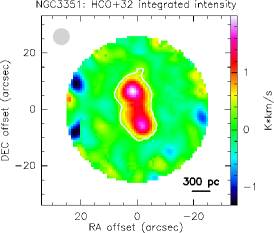
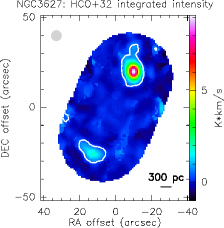
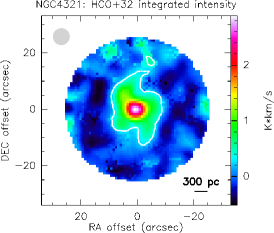
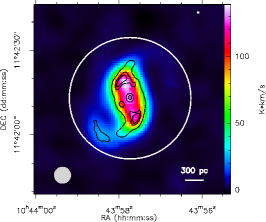
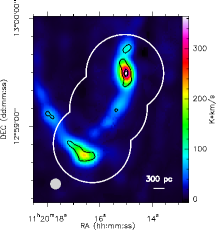
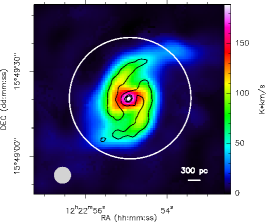
Figure 1 displays in colour scale the integrated intensity maps of the HCN(3–2) and HCO+(3–2) lines. In the bottom row, the CO(2–1) maps and their corresponding high resolution contours () are shown as reference. Their higher S/N and spatial resolution help us identify the morphological features described in Sect. 2. We detect and resolve the HCN(3–2) and HCO+(3–2) emission at S/N (white contours) over: (1) the inner star-forming ring of NGC 3351; (2) the centre and the southern bar end of NGC 3627; and (3) the centre and the base of the spiral arms of NGC 4321. To first order, the spatial distributions of the HCN(3–2) and HCO+(3–2) lines are similar to that of CO(2–1), though restricted to more compact regions. The latter results from a combination of lower S/N and steeper radial gradients in the integrated intensities (Sect. 6). In closer detail, Figure 1 also shows some significant differences between HCN(3–2) and HCO+(3–2) that we discuss in Sects. 5 and 6.
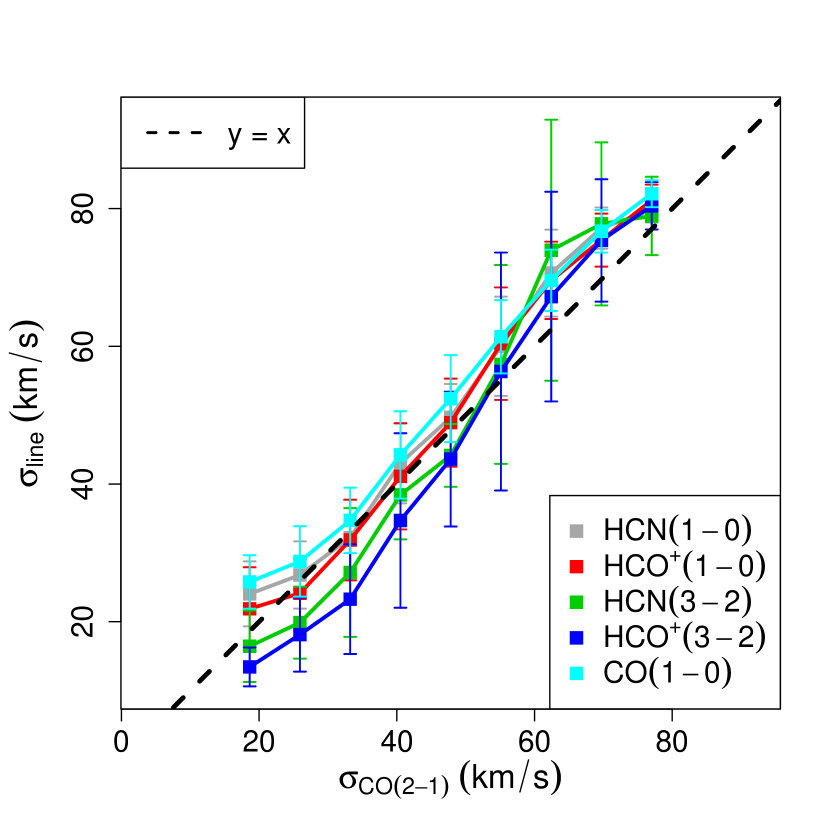
We do not present mean velocity nor velocity dispersion maps. However, we have inspected them to confirm that all lines listed in Table 4 have similar spectral shapes on a pixel-by-pixel basis. The mean velocities of the different lines are in good agreement in the three targets. In the worst case, each line shows a median deviation in absolute value of 16 km s-1 with respect to CO(2–1). This amounts to only 1.6 times the channel width. We check the consistency of the velocity dispersion of the lines in Fig. 2. Specifically, we bin the sightlines of all three galaxies by the velocity dispersion of the high-S/N CO(2–1) line and represent the mean and the standard deviation for each line within each bin. Here, the lowest values (15–20 km s-1) are typical of the discs, while the highest ones 50–100 km s-1) are found towards centres, where the unresolved rotation curve gradients and/or the increased turbulence broaden the linewidths (Shetty et al. 2012; Sun et al. 2020; Miura et al. 2021; Krieger et al. 2021). We find that all trends are mutually consistent within the scatter, since they agree within 25% with the one-to-one relation (with some systematic deviations both at lower and higher values). In summary, we can reasonably consider that all lines have similar shapes, so that line ratios do not strongly depend on velocity. Thus, we can safely study the excitation conditions along each sightline from the integrated intensity maps.
5 Line ratios as a probe of the dense gas excitation
We construct line ratio maps from the integrated intensity maps of the six lines in Table 4. We use them to explore how the excitation conditions vary across our targets. Specifically, we focus on: (1) Same-species ratios (e.g. HCN(3–2)/HCN(1–0), HCO+(3–2)/HCO+(1–0)), which represent our most direct proxies for the excitation of each molecule; (2) Same-transition ratios (e.g. HCN(3–2)/HCO+(3–2), HCN(1–0)/HCO+(1–0)), which help us single out the effects of chemistry; (3) HCN/CO ratios (e.g. HCN(3–2)/CO(2–1), HCN(1–0)/CO(2–1)), which are frequently used to infer dense gas fractions in external galaxies (Sect. 1). Other possible ratios are combinations of these ones or lack an intuitive interpretation.
Line ratios are sensitive to several parameters such as density, chemical abundances, opacity or temperature. Here, we define the line ratios so that the critical density is higher for the numerator than for the denominator (Table 4), which helps us discuss the potential effects of density. Unless otherwise stated, in the following we only take lines of sight (pixels) where all lines are detected at significance into account. This criterion suppresses possible noise-driven artefacts, although it can introduce a selection bias that we discuss whenever appropriate.
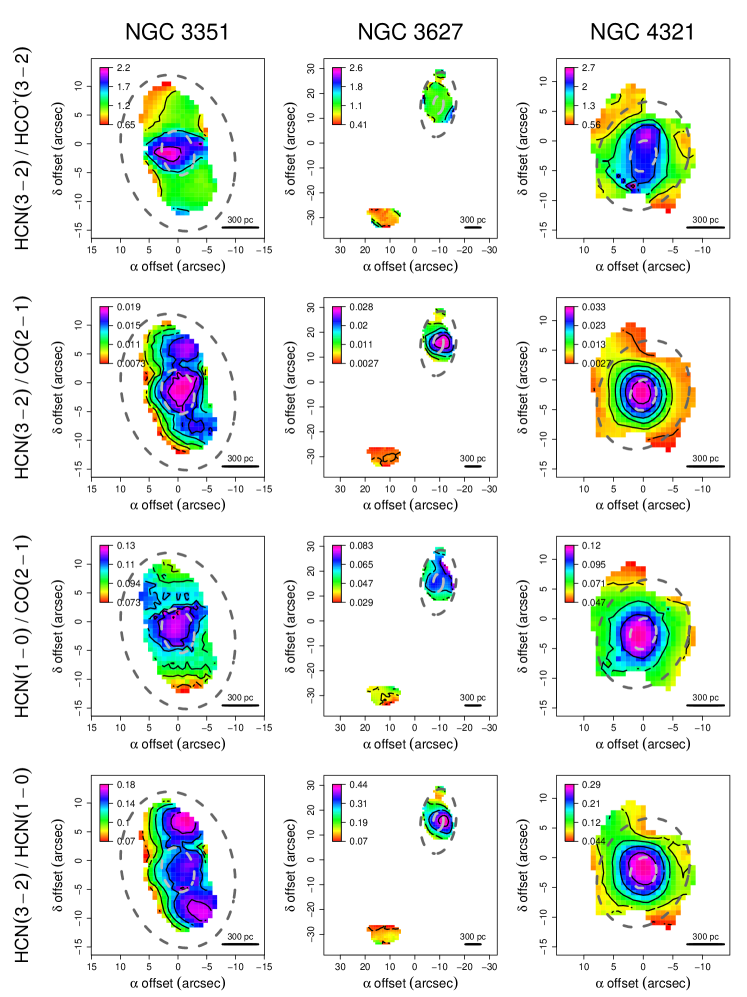
Figure 3 displays the maps of a subset777Here we skip the HCO+(3–2)/HCO+(1–0) and HCN(1–0)/HCO+(1–0) maps. As in Sect. 5.1, they are similar to the HCN(3–2)/HCN(1–0) and HCN(3–2)/HCO+(3–2) ones, respectively. of the line ratios that we discuss in Sects. 5-6. To first order, these ratios peak at the galaxy centres and tend to decrease outwards, although we recognise in most panels the morphological features that were apparent in Fig. 1. The only exception to this radial behaviour is the HCN(3–2)/HCN(1–0) ratio in NGC 3351, which actually peaks on the two contact points of the star-forming ring.
5.1 HCN and HCO+ line ratio statistics
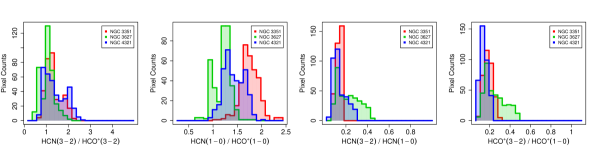
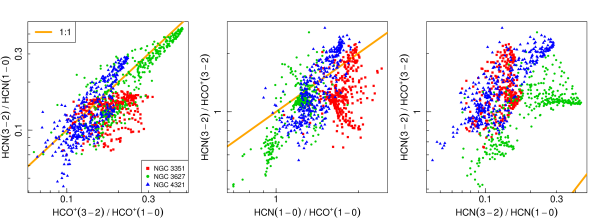
Figure 4 presents the histograms per galaxy of line ratios HCN(3–2)/HCO+(3–2), HCN(1–0)/HCO+(1–0), HCN(3–2)/HCN(1–0), and HCO+(3–2)/HCO+(1–0) (the statistics of these and other ratios is also summarised in Appendix A as a reference for future studies). The plots show that the maximum span of each ratio over our sample is 0.6-1 dex. Part of the broad scatter comes from variations within each galaxy, since the multiple peaks or wings of the histograms are associated with different morphological features (Fig. 3). In addition, some ratios exhibit significant galaxy-to-galaxy differences. Clear examples are the almost disjoint histograms of HCN(1–0)/HCO+(1–0) in NGC 3627 and NGC 3351. Figure 5 presents a complementary view, where the ratios are plotted against each other. The leftmost panel shows that, to first order, the two 3–2/1–0 ratios tend to align with the same 1-1 relation. This implies that the excitation of HCN and HCO+ is covariant to a significant degree, although we still see a non-negligible scatter in our data. We can infer similar conclusions from the HCN-to-HCO+ ratios shown in the middle panel. In contrast, the rightmost panel shows a weaker correlation between HCN(3–2)/HCO+(3–2) and HCN(3–2)/HCN(1–0), which actually might be induced by HCN(3–2) being present in the two axes.
Our ranges of fixed-transition HCN/HCO+ ratios are comparable to those reported in the literature, dominated by the active galactic nuclei (AGN) and starburst galaxies, whereas our fixed-species 3–2/1–0 ratios tend to be lower. However, these comparisons could be biased by differences in resolution and the lack of complete studies (Sect. 1). Larger and more homogeneous samples are needed to robustly assess any differences in excitation. Figure 8 is an expanded version of Fig. 4 that includes data from a comprehensive set of studies.
5.2 Comparison with non-local thermodynamic equilibrium models
We run basic non-local thermodynamic equilibrium (non-LTE) calculations to explore the excitation regime of HCN and HCO+ in our targets. We use RADEX (van der Tak et al. 2007) for radiative-transfer calculations, supplied with radiative and collisional coefficients from the Leiden Atomic Molecular DAtabase (LAMDA; Schöier et al. 2005). Escape probabilities assume an homogeneous sphere geometry. We disregard the hyperfine splitting of the HCN rotational lines and only consider collisions with H2 molecules. For HCN, we build a grid of single-phase RADEX models that spans a broad range of each of the three free parameters: the kinetic temperature (; 10–100 K), the H2 volume density (; 10–108 cm-3), and the HCN abundance per velocity gradient ([HCN]/; 10-10–10-6 pc (km s-1)-1). We build a parallel HCO+ grid on the same assumptions.
Out of the grid of HCN models, we select those consistent with the observations in our targets. Specifically, we choose models that predict: (1) HCN(3–2)/HCN(1–0) ratios consistent with the 5th–95th percentile range of the observations (0.08–0.35); (2) HCN(3–2) brightness temperatures mK (our 3 level)888Dilution in area and velocity could make the observed brightness temperature lower than the intrinsic one, but not higher.. The selected models invariably predict HCN(3–2) lines that are subthermally excited and, in a clear majority of cases, optically thick. The predicted HCN(1–0) lines tend to be optically thicker and closer to thermalisation999i.e. the factor is closer to its thermal value (=) for HCN(1–0) than for HCN(3–2). and are the radiative transfer equation and the excitation temperature of each transition, respectively.. We filtered the HCO+ grid in a similar manner and found similar conclusions.
This simple comparison provides us with some indications of the dependence of the lines on the excitation parameters. For example, in the regime of subthermal optically thick emission, HCN brightness temperatures are sensitive to , but also to the number of photons generated by collisions, which tends to enhance the excitation temperature and is proportional to (Scoville & Solomon 1974). The dependence on the latter parameter weakens as the lines approach thermalisation, so it tends to be stronger for HCN(3–2) than for HCN(1–0).
6 Empirical line ratio relations
Observations of HCN(1–0) and HCO+(1–0) in nearby galaxies at (sub-)kiloparsec scales have revealed systematic variations in the line/CO and /line ratios as a function of environment parameters such as (e.g. Usero et al. 2015; Bigiel et al. 2016; Gallagher et al. 2018b; Jiménez-Donaire et al. 2019; Querejeta et al. 2019; Sánchez-García et al. 2022), or cloud-scale properties such as (Gallagher et al. 2018a; Neumann et al. 2022). These relations have important implications for the internal and SF properties of the clouds, on the assumption that the HCN(1–0) and HCO+(1–0) lines are reliable proxies for the dense gas mass (Sect. 1). In this section, we compare these relations with those inferred from our HCN(3–2) and HCO+(3–2) observations. Only for these purposes, we have homogenised the data of the three galaxies to their best common physical resolution (440 pc 6′′–9′′).
Empirical gas-environment relations at Fixed 440 pc Resolution
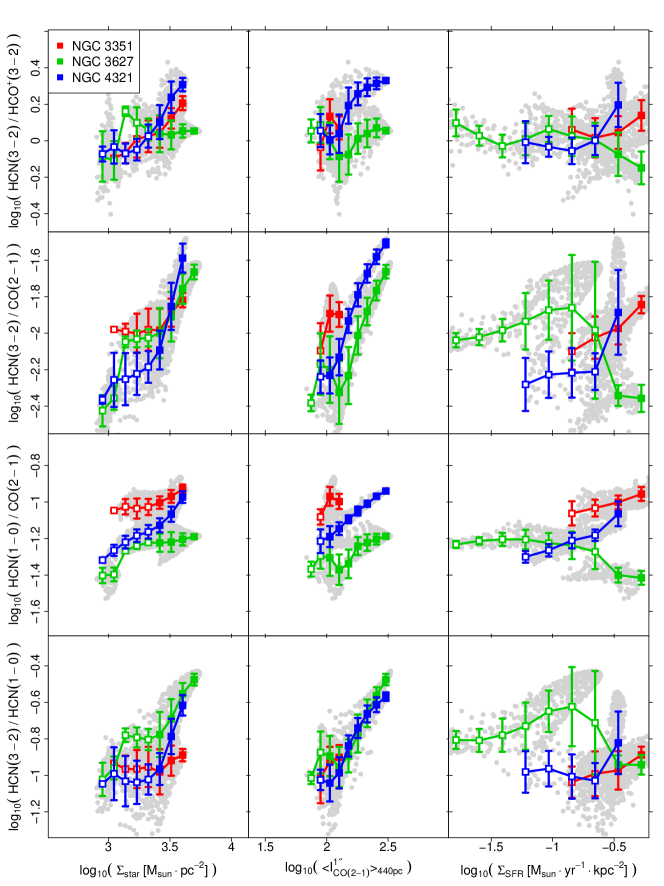
Figure 6 shows the systematic variations over the three targets in: the =3–2 HCN/HCO+ ratio, the two HCN/CO line ratios, and the HCN 3–2/1–0 excitation ratio. We plot them as a function of (left), (middle), and (right). Once differences in calibration or CO transition are taken into account, the HCN(1–0)/CO relations are consistent with Gallagher et al. (2018a, b), where these data were taken from, as well as with other fits derived from larger galaxy samples (e.g. Usero et al. 2015; Jiménez-Donaire et al. 2019).
To discuss how line ratios vary, we focus on the binned trends shown in the figure. They represent the overall behaviour over the S/N-selected pixels inside the ACA FoV, but do not necessarily represent the behaviour over an entire galaxy. To mark where this might happen, we proceed as follows. For each bin (or other x-axis quantity) we sum the total CO(2–1) flux from all the pixels that belong in the bin and lie: either (1) anywhere in the galaxy, or (2) only in the region that we selected for analysis. When the (2)-to-(1) ratio is less than 0.8, we consider that the bin value is not necessarily representative, which we indicate with a white-filled square. In some panels the trends bend where white-filled squares set in, suggesting that these values suffer from a selection bias.
Within the limited dynamic range covered by the data, most panels of Figure 6 (left and middle) show that the line ratios are enhanced when and/or increase. The overall agreement between and trends mostly reflects that the stars and CO emission are similarly distributed over galaxy discs (e.g. Leroy et al. 2008). The main differences between rows are the steepness of the trends in individual galaxies and the importance of galaxy-to-galaxy offsets. On the one hand, there is a range of 2 in the overall slopes, with the sense that HCN(3–2)/CO(2–1) ¿ HCN(3–2)/HCN(1–0) ¿ HCN(3–2)/HCO+(3–2) HCN(1–0)/CO(2–1). On the other hand, galaxy-to-galaxy offsets up to 0.3 dex are apparent in some panels and can contribute significantly to the overall scatter. The clearest exception is the HCN(3–2)/HCN(1–0)– relation shown in the bottom-middle panel, where the three galaxies are well aligned. This tight correlation is an example that line ratios can track the average properties of the molecular gas measured at higher spatial resolution (Gallagher et al. 2018a).
Unlike in the and panels, there are no robust trends in the panels, which also show a higher scatter per bin. This suggests that the energy input provided by star formation does not have a net impact on the excitation of the lines (Sect. 7). We cannot discard that mechanisms other than SF might operate or even dominate gas heating in our regions of study (e.g. turbulence dissipation, cosmic rays; Mills 2017, for examples in the Galactic CMZ).
7 Discussion: Drivers of line ratio relations
We briefly discuss some implications of Fig. 6 for the excitation of HCN (they apply to HCO+ as well). We focus on the trends against , which are barely affected by the potential selection biases mentioned in Sect. 6 and are easier to interpret in terms of cloud properties. is a good proxy for density (Sect. 3.1.4) and, since CO(2–1) is optically thick and easy to thermalise under normal conditions, it is also sensitive to . For the sake of the argument, let us assume that all trends in each galaxy were driven by density, with other excitation parameters kept fixed. Based on Sect. 5.2, the different thermalisation degree of CO(2–1) (highest), HCN(1–0), and HCN(3–2) (lowest) would qualitatively explain why HCN(3–2)/CO(2–1), HCN(1–0)/CO(2–1), and HCN(3–2)/HCN(1–0) tend to increase with , and why the HCN(3–2)/CO(2–1) trends are steeper than the HCN(1–0)/CO(2–1) ones. Within this picture, differences in between galaxies could shift , thus generating galaxy-to-galaxy offsets. However, those offsets should then be similar for all ratios, which is not the case (e.g. HCN(3–2)/HCN(1–0) versus HCN(3–2)/CO(2–1)). Therefore, line ratios should also be sensitive to the parameter driving the offsets ( in this example).
This particular example illustrates that, at a more general level, the line ratios in Fig. 6 must be regulated by at least two parameters. Density and temperature are two appealing candidates, since both directly can affect the x- and y-axis quantities. To quantify their relative importance we must model the line ratios on a pixel-by-pixel basis, which motivates our Paper II.
8 Summary
We present new ACA observations of the HCN(3–2) and HCO+(3–2) line emission in the nearby SFGs NGC 3351, NGC 3627, and NGC 4321. At a spatial resolution of 290–440 pc, we detected and resolved the two lines in the inner 1 kpc of the three targets, as well as in the southern bar end of NGC 3627. We complemented these data with available interferometer images of the CO(1–0), CO(2–1), HCN(1–0), and HCO+(1–0) lines. This data set enabled an analysis of the empirical relations of HCN and HCO+ in SFGs at sub-kiloparsec scales. This kind of analysis has been typically focussed on brighter AGN and starburst galaxies; in spite of that, SFGs host most of the SF in the local Universe. We focus on the behaviour of the set of line ratios (HCN(3–2)/HCO+(3–2), HCN(3–2)/CO(2–1), HCN(1–0)/CO(2–1), and HCN(3–2)/HCN(1–0)). We find the following main results:
-
•
The chosen line ratios peak at the galaxy centres and tend to decrease mildly as we move outwards. The only exception is HCN(3–2)/HCN(1–0) in NGC 3351, which rather peaks at two off-centre contact points between the inner ring and the dust lanes of the bar (400 pc).
-
•
For analysis, we selected pixels where all lines are detected at a 5 significance. Over them, the ratios vary by 0.6–1 dex (total range), with median values of 0.14 for HCN(3–2)/HCN(1–0), 0.17 for HCO+(3–2)/HCO+(1–0), 1.17 for HCN(3–2)/HCO+(3–2), and 1.40 for HCN(1–0)/HCO+(1–0).
-
•
We compared our observations with a grid of one-zone non-LTE radiative transfer models from RADEX. We varied the kinetic temperature (10–100 K), the H2 volume density (10–108 cm-3), and the HCN abundance per velocity gradient (10-10–10-6 pc (km s-1)-1). The models compatible with our HCN observations predict that HCN(1–0) and HCN(3–2) are subthermally excited and likely optically thick, with the former being somewhat closer to thermalisation.
-
•
We explored the mean trends of our reference line ratios as a function of (representing the environment), (cloud-scale properties) and (SF) in each galaxy. No line ratio correlates with , which implies that either they are not significantly affected by temperature or that SF does not dominate the gas heating in our target galaxies. In contrast, most ratios increase as a function of both and in each galaxy, with the former being less affected by selection biases and, thus, more robust.
-
•
Within each galaxy, the slopes of the trends (in the log-log space) vary by a factor of 2, with the HCN(3–2)/CO(2–1)- relations being two times steeper than HCN(1–0)/CO(2–1)-. The trends also show 0.3 dex galaxy-to-galaxy offsets that can dominate the total scatter in some cases (e.g. HCN(1–0)/CO(2–1)-). An exception is HCN(3–2)/CO(2–1)-, for which the offsets are negligible.
We finally discuss the implications of the different slopes and galaxy-to-galaxy offsets of these empirical relations. We conclude that the systematic variations in the HCN/CO and HCN(3–2)/HCN(1–0) line ratios are not strictly ruled by a single excitation parameter. However, a detailed modelling is needed to separate the effects of parameters such as density and temperature in each case.
Acknowledgements.
We are very thankful to the anonymous referee for a detailed and in-depth report that helped simplify and improve this paper. AGR acknowledges support from the Spanish grants AYA2016-79006-P and PID2019-108765GB-I00, funded by MCIN/AEI/10.13039/501100011033 and by ”ERDF A way of making Europe”. AU acknowledges support from the Spanish grants PGC2018-094671-B-I00, funded by MCIN/AEI/10.13039/501100011033 and by “ERDF A way of making Europe”, and PID2019-108765GB-I00, funded by MCIN/AEI/10.13039/501100011033. FB, JP, AB, IB, and JdB acknowledge funding from the European Research Council (ERC) under the European Union’s Horizon 2020 research and innovation programme (grant agreement No.726384/Empire). The work of AKL is partially supported by the National Science Foundation under Grants No. 1615105, 1615109, and 1653300. TS acknowledges funding from the European Research Council (ERC) under the European Union’s Horizon 2020 research and innovation programme (grant agreement No. 694343). MC gratefully acknowledges funding from the Deutsche Forschungsgemeinschaft (DFG) through an Emmy Noether Research Group, grant number CH2137/1-1 and the DFG Sachbeihilfe, grant number KR4801/2-1. COOL Research DAO is a Decentralized Autonomous Organization supporting research in astrophysics aimed at uncovering our cosmic origins. CE acknowledges funding from the Deutsche Forschungsgemeinschaft (DFG) Sachbeihilfe, grant No. BI1546/3-1. SGB acknowledges support from the Spanish MINECO and FEDER funding grant AYA2016-76682-C3-2-P. SCOG acknowledges support from the DFG via SFB 881 “The Milky Way System” (sub-projects B1, B2 and B8) and from the Heidelberg cluster of excellence EXC 2181-390900948 “STRUCTURES: A unifying approach to emergent phenomena in the physical world, mathematics, and complex data”, funded by the German Excellence Strategy. RSK acknowledges financial support from the German Research Foundation (DFG) via the collaborative research centre (SFB 881, Project-ID 138713538) “The Milky Way System” (subprojects A1, B1, B2, and B8). He also thanks for funding from the Heidelberg Cluster of Excellence “STRUCTURES” in the framework of Germany’s Excellence Strategy (grant EXC-2181/1, Project-ID 390900948) and for funding from the European Research Council via the ERC Synergy Grant “ECOGAL” (grant 855130). JP acknowledges support from the Programme National “Physique et Chimie du Milieu Interstellaire” (PCMI) of CNRS/INSU with INC/INP co-funded by CEA and CNES. MQ and SGB acknowledges support from the Spanish grant PID2019-106027GA-C44, funded by MCIN/AEI/10.13039/501100011033. ER acknowledges the support of the Natural Sciences and Engineering Research Council of Canada (NSERC), funding reference number RGPIN-2022-03499. ES and TGW acknowledge funding from the European Research Council (ERC) under the European Union’s Horizon 2020 research and innovation programme (grant agreement No. 694343). MCS acknowledges financial support from the German Research Foundation (DFG) via the collaborative research centre (SFB 881, Project-ID 138713538) ”The Milky Way System” (subprojects A1, B1, B2, and B8). Y-HT acknowledges funding support from NRAO Student Observing Support Grant SOSPADA-012 and from the National Science Foundation (NSF) under grant No. 2108081. This paper makes use of the following ALMA data: ADS/JAO.ALMA#2018.1.01530.S. ALMA is a partnership of ESO (representing its member states), NSF (USA) and NINS (Japan), together with NRC (Canada), MOST and ASIAA (Taiwan), and KASI (Republic of Korea), in cooperation with the Republic of Chile. The Joint ALMA Observatory is operated by ESO, AUI/NRAO and NAOJ. We also thank the staff of the IRAM ARC node at IRAM Grenoble for their support with data reduction.References
- Aalto et al. (2007) Aalto, S., Monje, R., & Martín, S. 2007, A&A, 475, 479
- Anand et al. (2021) Anand, G. S., Lee, J. C., Van Dyk, S. D., et al. 2021, MNRAS, 501, 3621
- Aniano et al. (2011) Aniano, G., Draine, B. T., Gordon, K. D., & Sandstrom, K. 2011, PASP, 123, 1218
- Barnes et al. (2020) Barnes, A. T., Kauffmann, J., Bigiel, F., et al. 2020, MNRAS, 497, 1972
- Bigiel et al. (2016) Bigiel, F., Leroy, A. K., Jiménez-Donaire, M. J., et al. 2016, ApJ, 822, L26
- Casasola et al. (2017) Casasola, V., Cassarà, L. P., Bianchi, S., et al. 2017, A&A, 605, A18
- de Vaucouleurs et al. (1991) de Vaucouleurs, G., de Vaucouleurs, A., Corwin, Herold G., J., et al. 1991, Third Reference Catalogue of Bright Galaxies
- Emsellem et al. (2022) Emsellem, E., Schinnerer, E., Santoro, F., et al. 2022, A&A, 659, A191
- Erwin (2004) Erwin, P. 2004, A&A, 415, 941
- Freedman et al. (2001) Freedman, W. L., Madore, B. F., Gibson, B. K., et al. 2001, ApJ, 553, 47
- Gadotti et al. (2019) Gadotti, D. A., Sánchez-Blázquez, P., Falcón-Barroso, J., et al. 2019, MNRAS, 482, 506
- Gallagher et al. (2018a) Gallagher, M. J., Leroy, A. K., Bigiel, F., et al. 2018a, ApJ, 868, L38
- Gallagher et al. (2018b) Gallagher, M. J., Leroy, A. K., Bigiel, F., et al. 2018b, ApJ, 858, 90
- Gao & Solomon (2004) Gao, Y. & Solomon, P. M. 2004, ApJ, 606, 271
- Garcia-Burillo et al. (1998) Garcia-Burillo, S., Sempere, M. J., Combes, F., & Neri, R. 1998, A&A, 333, 864
- García-Burillo et al. (2012) García-Burillo, S., Usero, A., Alonso-Herrero, A., et al. 2012, A&A, 539, A8
- Graciá-Carpio et al. (2008) Graciá-Carpio, J., García-Burillo, S., Planesas, P., Fuente, A., & Usero, A. 2008, A&A, 479, 703
- Helfer & Blitz (1997) Helfer, T. T. & Blitz, L. 1997, ApJ, 478, 162
- Helfer et al. (2003) Helfer, T. T., Thornley, M. D., Regan, M. W., et al. 2003, ApJS, 145, 259
- Ho et al. (1997) Ho, L. C., Filippenko, A. V., & Sargent, W. L. W. 1997, ApJS, 112, 315
- Iles et al. (2022) Iles, E. J., Pettitt, A. R., & Okamoto, T. 2022, MNRAS, 510, 3899
- Imanishi et al. (2019) Imanishi, M., Nakanishi, K., & Izumi, T. 2019, ApJS, 241, 19
- Izumi et al. (2013) Izumi, T., Kohno, K., Martín, S., et al. 2013, PASJ, 65, 100
- Jacobs et al. (2009) Jacobs, B. A., Rizzi, L., Tully, R. B., et al. 2009, AJ, 138, 332
- Jiménez-Donaire et al. (2019) Jiménez-Donaire, M. J., Bigiel, F., Leroy, A. K., et al. 2019, ApJ, 880, 127
- Jones et al. (2021) Jones, G. H., Clark, P. C., Glover, S. C. O., & Hacar, A. 2021, arXiv e-prints, arXiv:2112.05543
- Juneau et al. (2009) Juneau, S., Narayanan, D. T., Moustakas, J., et al. 2009, ApJ, 707, 1217
- Kauffmann et al. (2017) Kauffmann, J., Pillai, T., Zhang, Q., et al. 2017, A&A, 603, A90
- Kennicutt et al. (2009) Kennicutt, Robert C., J., Hao, C.-N., Calzetti, D., et al. 2009, ApJ, 703, 1672
- Klessen & Glover (2016) Klessen, R. S. & Glover, S. C. O. 2016, Saas-Fee Advanced Course, 43, 85
- Krieger et al. (2021) Krieger, N., Walter, F., Bolatto, A. D., et al. 2021, ApJ, 915, L3
- Krips et al. (2008) Krips, M., Neri, R., García-Burillo, S., et al. 2008, ApJ, 677, 262
- Lang et al. (2020) Lang, P., Meidt, S. E., Rosolowsky, E., et al. 2020, ApJ, 897, 122
- Leaman et al. (2019) Leaman, R., Fragkoudi, F., Querejeta, M., et al. 2019, MNRAS, 488, 3904
- Ledger et al. (2021) Ledger, B., Wilson, C. D., Michiyama, T., et al. 2021, MNRAS, 504, 5863
- Leroy et al. (2021a) Leroy, A. K., Hughes, A., Liu, D., et al. 2021a, ApJS, 255, 19
- Leroy et al. (2016) Leroy, A. K., Hughes, A., Schruba, A., et al. 2016, ApJ, 831, 16
- Leroy et al. (2021b) Leroy, A. K., Schinnerer, E., Hughes, A., et al. 2021b, ApJS, 257, 43
- Leroy et al. (2017) Leroy, A. K., Usero, A., Schruba, A., et al. 2017, ApJ, 835, 217
- Leroy et al. (2008) Leroy, A. K., Walter, F., Brinks, E., et al. 2008, AJ, 136, 2782
- Linden et al. (2020) Linden, S. T., Murphy, E. J., Dong, D., et al. 2020, ApJS, 248, 25
- McKee & Ostriker (2007) McKee, C. F. & Ostriker, E. C. 2007, ARA&A, 45, 565
- McMullin et al. (2007) McMullin, J. P., Waters, B., Schiebel, D., Young, W., & Golap, K. 2007, in Astronomical Society of the Pacific Conference Series, Vol. 376, Astronomical Data Analysis Software and Systems XVI, ed. R. A. Shaw, F. Hill, & D. J. Bell, 127
- Meidt et al. (2012) Meidt, S. E., Schinnerer, E., Knapen, J. H., et al. 2012, ApJ, 744, 17
- Meidt et al. (2014) Meidt, S. E., Schinnerer, E., van de Ven, G., et al. 2014, ApJ, 788, 144
- Mills (2017) Mills, E. A. C. 2017, arXiv e-prints, arXiv:1705.05332
- Miura et al. (2021) Miura, R. E., Espada, D., Hirota, A., et al. 2021, MNRAS, 504, 6198
- Muñoz-Mateos et al. (2013) Muñoz-Mateos, J. C., Sheth, K., Gil de Paz, A., et al. 2013, ApJ, 771, 59
- Murphy et al. (2015) Murphy, E. J., Dong, D., Leroy, A. K., et al. 2015, ApJ, 813, 118
- Neumann et al. (2022) Neumann, L., Gallagher, M., & Frank, B. 2022, MNRAS, submitted
- Pérez-Beaupuits et al. (2007) Pérez-Beaupuits, J. P., Aalto, S., & Gerebro, H. 2007, A&A, 476, 177
- Pety et al. (2017) Pety, J., Guzmán, V. V., Orkisz, J. H., et al. 2017, A&A, 599, A98
- Querejeta et al. (2015) Querejeta, M., Meidt, S. E., Schinnerer, E., et al. 2015, ApJS, 219, 5
- Querejeta et al. (2019) Querejeta, M., Schinnerer, E., Schruba, A., et al. 2019, A&A, 625, A19
- Saito et al. (2018) Saito, T., Iono, D., Espada, D., et al. 2018, ApJ, 863, 129
- Sánchez-García et al. (2022) Sánchez-García, M., García-Burillo, S., Pereira-Santaella, M., et al. 2022, A&A, 660, A83
- Schöier et al. (2005) Schöier, F. L., van der Tak, F. F. S., van Dishoeck, E. F., & Black, J. H. 2005, A&A, 432, 369
- Scoville & Solomon (1974) Scoville, N. Z. & Solomon, P. M. 1974, ApJ, 187, L67
- Sheth et al. (2010) Sheth, K., Regan, M., Hinz, J. L., et al. 2010, PASP, 122, 1397
- Shetty et al. (2012) Shetty, R., Beaumont, C. N., Burton, M. G., Kelly, B. C., & Klessen, R. S. 2012, MNRAS, 425, 720
- Shirley (2015) Shirley, Y. L. 2015, PASP, 127, 299
- Sun et al. (2022) Sun, J., Leroy, A. K., Rosolowsky, E., et al. 2022, AJ, 164, 43
- Sun et al. (2020) Sun, J., Leroy, A. K., Schinnerer, E., et al. 2020, ApJ, 901, L8
- Sun et al. (2018) Sun, J., Leroy, A. K., Schruba, A., et al. 2018, ApJ, 860, 172
- Tafalla et al. (2021) Tafalla, M., Usero, A., & Hacar, A. 2021, A&A, 646, A97
- Tan et al. (2018) Tan, Q.-H., Gao, Y., Zhang, Z.-Y., et al. 2018, ApJ, 860, 165
- Usero et al. (2015) Usero, A., Leroy, A. K., Walter, F., et al. 2015, AJ, 150, 115
- Utomo et al. (2018) Utomo, D., Sun, J., Leroy, A. K., et al. 2018, ApJ, 861, L18
- van der Tak et al. (2007) van der Tak, F. F. S., Black, J. H., Schöier, F. L., Jansen, D. J., & van Dishoeck, E. F. 2007, A&A, 468, 627
- Watanabe et al. (2019) Watanabe, Y., Nishimura, Y., Sorai, K., et al. 2019, ApJS, 242, 26
- Williams et al. (2021) Williams, T. G., Schinnerer, E., Emsellem, E., et al. 2021, AJ, 161, 185
Appendix A Summary of line ratios
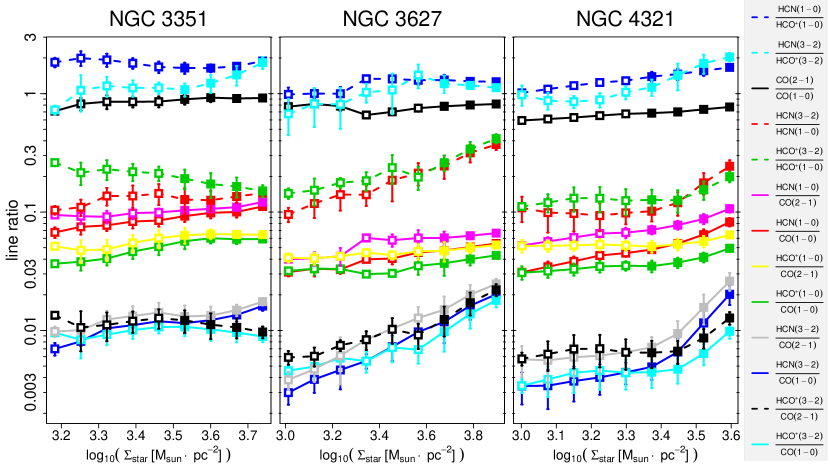
As a potential reference for future studies, we present here the typical values of a set of key line ratios derived from the six line maps per galaxy. Table 4 summarises the percentiles of ratios measured in the S/N-selected regions in NGC 3351, NGC 3627, and NGC 4321. For a comprehensive view of their systematic variations across galaxy discs, we plot their binned trends as a function of in Fig. 7. Most line ratios tend to increase along with , with varying slopes.
| Line ratio | Whole sample | NGC 3351 | NGC 3627 | NGC 4321 | ||||||||
|---|---|---|---|---|---|---|---|---|---|---|---|---|
| 16% | 50% | 84% | 16% | 50% | 84% | 16% | 50% | 84% | 16% | 50% | 84% | |
| CO(2–1)/CO(1–0) | 0.682 | 0.781 | 0.912 | 0.802 | 0.912 | 0.976 | 0.723 | 0.789 | 0.838 | 0.636 | 0.701 | 0.766 |
| HCN(1–0)/CO(2–1) | 0.055 | 0.074 | 0.108 | 0.095 | 0.106 | 0.119 | 0.040 | 0.057 | 0.067 | 0.064 | 0.075 | 0.098 |
| HCO+(1–0)/CO(2–1) | 0.044 | 0.054 | 0.064 | 0.054 | 0.063 | 0.067 | 0.041 | 0.045 | 0.053 | 0.047 | 0.055 | 0.063 |
| HCN(3–2)/CO(2–1) | 0.006 | 0.012 | 0.019 | 0.011 | 0.015 | 0.017 | 0.005 | 0.012 | 0.023 | 0.006 | 0.009 | 0.022 |
| HCO+(3–2)/CO(2–1) | 0.006 | 0.009 | 0.014 | 0.009 | 0.011 | 0.014 | 0.007 | 0.010 | 0.020 | 0.005 | 0.007 | 0.011 |
| HCN(3–2)/HCN(1–0) | 0.099 | 0.143 | 0.250 | 0.105 | 0.141 | 0.156 | 0.115 | 0.205 | 0.340 | 0.089 | 0.121 | 0.214 |
| HCO+(3–2)/HCO+(1–0) | 0.122 | 0.175 | 0.258 | 0.140 | 0.180 | 0.233 | 0.156 | 0.222 | 0.371 | 0.105 | 0.137 | 0.186 |
| HCN(1–0)/HCO+(1–0) | 1.186 | 1.401 | 1.761 | 1.587 | 1.746 | 1.936 | 0.971 | 1.234 | 1.337 | 1.234 | 1.406 | 1.681 |
| HCN(3–2)/HCO+(3–2) | 0.872 | 1.164 | 1.746 | 0.993 | 1.218 | 1.789 | 0.677 | 1.109 | 1.293 | 0.909 | 1.249 | 2.040 |
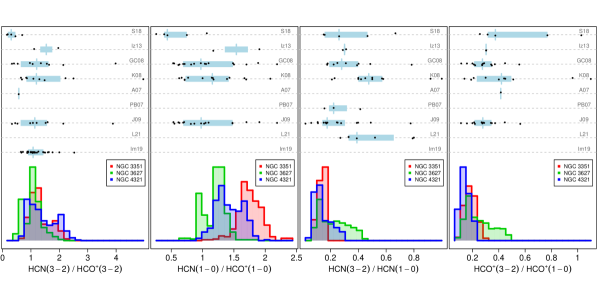
To put our spatially resolved measurements of HCN(3–2) and HCO+(3–2) into context, we compare them in Fig. 8 with observations from the literature, dominated by AGN and starburst galaxies. The histograms representing our three target galaxies are the same as in Fig. 4. Here we add black dots that correspond to measurements from a heterogeneous (in terms of samples and spatial resolution) but comprehensive set of studies. Single-dish, spatially unresolved ratios are taken from Graciá-Carpio et al. (2008, labelled GC08), Krips et al. (2008, K08), Aalto et al. (2007, A07), Pérez-Beaupuits et al. (2007, PB07), and Juneau et al. (2009, J09). Spatially resolved ratios are taken from Izumi et al. (2013, Iz13; AGN and starburst peaks of NGC 1097 from their Table 8), Saito et al. (2018, S18; five 3-apertures in the LIRG VV 114 from their Table 2), Imanishi et al. (2019, Im19; 25 (U)LIRG centres at 500-pc resolution), and Ledger et al. (2021, L21; seven regions of three (U)LIRGs from their Table 4). There is a clear contrast between the fixed-transition HCN-to-HCO+ ratios (two leftmost panels) and the fixed-species 3–2/1–0 ratios (two rightmost panels). In the former two, the overlap between our data and the literature values is significant. In the latter two, our 3–2/1–0 data clearly cluster at the lower range of the literature.