Observational connection of non-thermal X-ray emission from pulsars with their timing properties and thermal emission
Abstract
The origin and radiation mechanisms of high energy emissions from pulsars have remained mysterious since their discovery. Here we report, based on a sample of 68 pulsars, observational connection of non-thermal X-ray emissions from pulsars with their timing properties and thermal emissions, which may provide some constraints on theoretical modeling. Besides strong correlations with the spin-down power and the magnetic field strength at the light cylinder , the non-thermal X-ray luminosity in 0.5 – 8 keV, , represented by the power-law component in the spectral model, is found to be strongly correlated with the highest possible electric field strength in the polar gap, , of the pulsar. The spectral power index of that power-law component is also found, for the first time in the literature, to strongly correlate with , and , thanks to the large sample. In addition, we found that can be well described by , where and are the surface temperature and the emitting-region radius of the surface thermal emission, represented by the black-body component in the spectral model. , on the other hand, can be well described only when timing variables are included, and the relation is plus a constant. These relations strongly suggest the existence of connections between surface thermal emission and electron-positron pair production in pulsar magnetospheres.
keywords:
radiation mechanisms: non-thermal – star: neutron – pulsars: general – X-ray: stars1 Introduction
Pulsars are fast rotating, strongly magnetized neutron stars. They are detected through their electromagnetic emissions, from radio waves to very high energy gamma rays. These emissions carry rich information about neutron stars, their magnetosphere and likely also their wind zone. After more than half a century since pulsar’s discovery, however, except for the thermal component seen in X-rays, how and from where these emissions come remain in debate. Besides the unsolved issue of pulsar’s coherent radio emission mechanism, theoretical modeling to understand high-energy non-coherent emissions has been evolving. More recent models for high-energy emissions from pulsars include, for example, the striped-wind model (Petri, 2013, 2015), the extended-slot-gap and equatorial-current-sheet model (Harding et al., 2018, 2021; Barnard et al., 2022), the synchro-curvature model (Torres, 2018; Torres et al., 2019; Íñiguez-Pascual D., Viganò D. & Torres, 2022), and the non-stationary outer-gap model (Takata, Ng & Cheng, 2016; Takata & Cheng, 2017).
In all these models, non-thermal X-ray emissions are considered to come from synchrotron radiation of secondary electron-positron pair plasmas. These pairs are created in different location in different models. In the outer-gap model, pairs are created in the outer gap close to the null surface through two-photon () pair production, mainly from the collision of gamma-ray photons emitted by inwardly moving charged particles and X-ray photons from surface thermal emission (Cheng, Ho & Ruderman, 1986; Takata, Ng & Cheng, 2016). The resultant non-thermal X-ray emission from the synchrotron radiation of these pairs apparently depends on the local magnetic fields and the energy distribution of these pairs. Therefore, one can expect that surface thermal emission plays an essential role in determining the properties of non-thermal X-rays. In the slot-gap model, pairs are created close to the stellar surface above the magnetic polar cap through one-photon () pair production cascades, due to the interaction between gamma-ray photons emitted by charged particles accelerated in the gap above the polar cap and the strong magnetic fields there (Harding et al., 2018). The energetics of charged particles accelerated in the polar gap may be affected by surface thermal emission through the inverse Compton scattering between them (Chang, 1995; Sturner, 1995; Harding & Muslimov, 1998, 2002; Timokhin & Harding, 2019). In such a case, one can also expect that surface thermal emission plays some role in determining the energetics and amount of the created pairs. That may have some imprints in their synchrotron radiation in the slot gap or current sheets in the wind zone, that is, the observed non-thermal X-rays. The connection between thermal and non-thermal X-rays is actually expected in different models, although not yet further elaborated in any of them. The exact contents of the connection, when reliably established, can be a new diagnostic tool to constrain theoretical models.
In the past, almost all the efforts were focused on looking for the correlation between pulsars’ X-ray luminosity and timing properties. It was generally found that pulsars’ X-ray luminosity, , is strongly correlated with their spin-down power, . Their relationship, when expressed in a power law, is with ranging from 0.92 to 1.87 (see Hsiang & Chang (2021) for a brief review). In those earlier studies, however, may be a mixture of thermal and non-thermal components and in some of them may also include contribution from associated pulsar wind nebulae. In all the cases the reduced of the power-law fitting for and is always about 3 or larger. Apparently the relationship is not tight. Recently it was pointed out that is also strongly correlated with , the magnetic field strength at the light cylinder, at a significance level similar to that of the case with (Malov & Timirkeeva, 2019; Hsiang & Chang, 2021). The scatter in the best fit of as a power-law function of is also large, again similar to the case with . The comparable importance of and in correlating suggests a scenario that is not the only major factor. All the timing variables, such as , , characteristic age and the magnetic field at stellar surface , are just a function of and , the pulsar spin period and its time derivative. A two-variable fitting of seems desired. However, efforts to fit directly with and did not yield any improvements. The reduced is similarly large (Possenti et al., 2002; Hsiang & Chang, 2021).
The large scatter, i.e., the large reduced , in the aforementioned relationship fitting may be inevitable. The geometry factors like the inclination angle between directions of the pulsar spin and magnetic moment and the viewing angle between that of the spin and observer are not taken into account when inferring luminosities from measured fluxes. It therefore goes with the assumption of an isotropic emission, which is not expected to be true in general. On the other hand, it may also indicate that there could be other non-negligible factors missing in the study. As discussed above, surface thermal emission is expected to play some role in the radiation of non-thermal X-rays. It is therefore tempting to look for possible relationships between spectral properties of non-thermal and thermal X-ray emissions, besides timing variables. That is to say, there could be a better-defined fundamental plane of non-thermal X-ray properties, such as its luminosity and the photon index of the corresponding power-law component, in a space spanned not only by and but also by thermal X-ray properties, such as the temperature and the emitting region radius.
In this paper we report the results of such an effort with a sample of 68 pulsars, among which 32 have both thermal and non-thermal X-ray emissions. Sample collection is described in Section 2. For the whole sample of 68 pulsars, we first investigate the correlation between non-thermal X-ray spectral properties and timing variables, similar to what have been reported in the literature, but with some new findings. This section also serves as a consistency check between earlier results in the literature and ours. These are described in Section 3. We then present the search for the fundamental plane in a four-dimensional space for the 32 pulsars with thermal emissions in Section 4. Discussions and conclusions are in Section 5.
2 Sample collection
| Pulsar name | (erg/s) | (eV) | (km) | References | |
|---|---|---|---|---|---|
| J0007+7303 | 1 | ||||
| J01081431 | 2 | ||||
| J0205+6449 | 1 | ||||
| J0357+3205 | 3 | ||||
| J0358+5413 | 4 | ||||
| J0534+2200 | 5 | ||||
| J05376910 | 6 | ||||
| J05406919 | 5,7 | ||||
| J06302834 | 8 | ||||
| J0633+0632 | 9 | ||||
| J0633+1746 | 10 | ||||
| J0659+1414 | 11 | ||||
| J0826+2637 | 12 | ||||
| J0835-4510 | 13 | ||||
| J0922+0638 | 14 | ||||
| J0946+0951_B | 15 | ||||
| J0946+0951_Q | 15 | ||||
| J0953+0755 | 16 | ||||
| J10165857 | 17 | ||||
| J10235746 | 1 | ||||
| J10485832 | 18 | ||||
| J10575226 | 19 | ||||
| J11016101 | 20 | ||||
| J11126103 | 1 | ||||
| J11245916 | 1 | ||||
| J1136+1551 | 21 | ||||
| J11546250 | 22 | ||||
| J13576429 | 23 | ||||
| J14186058 | 24 | ||||
| J14206048 | 1 |
| Pulsar name | (erg/s) | (eV) | (km) | References | |
|---|---|---|---|---|---|
| J14566843 | 25 | ||||
| J14596053 | 26 | ||||
| J15095850 | 27 | ||||
| J15135908 | 1 | ||||
| J16175055 | 28 | ||||
| J17094429 | 29 | ||||
| J17183825 | 1 | ||||
| J17323131 | 1 | ||||
| J1740+1000 | 30 | ||||
| J17412054 | 31 | ||||
| J17472958 | 32 | ||||
| J18012451 | 33 | ||||
| J18032137 | 18 | ||||
| J18091917 | 34 | ||||
| J18092332 | 1 | ||||
| J18111925 | 35 | ||||
| J18131246 | 1 | ||||
| J18131749 | 36 | ||||
| J18261256 | 37 | ||||
| J18261334 | 38 | ||||
| J18331034 | 1 | ||||
| J1836+5925 | 3.18 | 39 | |||
| J18380537 | 40 | ||||
| J18380655 | 1 | ||||
| J1856+0113 | 1 | ||||
| J1907+0602 | 1 | ||||
| J1930+1852 | 1 | ||||
| J1932+1059 | 41 | ||||
| J1952+3252 | 42 | ||||
| J1957+5033 | 43 | ||||
| J2021+3651 | 44 | ||||
| J2021+4026 | 45 | ||||
| J2022+3842 | 1 | ||||
| J2043+2740 | 16 | ||||
| J2055+2539 | 46 | ||||
| J2225+6535 | 47 | ||||
| J2229+6114 | 1 | ||||
| J2337+6151 | 48 |
We collected, from the literature, all the pulsars with detected X-ray emissions. In this effort, among many different references, we benefited very much from the compiled tables in Li, Lu & Li (2008), Malov & Timirkeeva (2019), Coti Zelati et al. (2020) and Potekhin et al. (2020). We excluded red-back and black-widow systems as their X-ray emissions are from an intrabinary shock (e.g. Kandel, Romani & An (2019)), the two pulsars with magnetar-like bursts, that is, PSR J1119-6127 (Blumer, Safi-Harb & McLaughlin, 2017; Dai et al., 2018; Archibald et al., 2018) and PSR J1846-0258 (Kuiper, Hermsen & Dekker, 2018; Reynolds, Borkowski & Gwynne, 2018; Temim et al., 2019), and those that are either too dim or with too short an exposure so that the number of source photons available is too small to yield a meaningful spectral analysis. Millisecond pulsars are not included in this study either. Their non-thermal X-ray emissions may come from a way different from normal pulsars, because of their weak magnetic field (e.g. Zhang & Cheng (2003)). We also found 10 pulsars with purely thermal X-ray emissions. Their X-ray spectra can be well described by one or two blackbody components with signatures of lines in some of them. Since there is no non-thermal X-ray emission detected from them, these 10 are excluded from the current study. PSR J0943+0951 switches between two emission modes. In its radio quiet mode (Q-mode) its X-ray emission is brighter and in the radio bright one (B-mode) its X-ray emission is fainter (Rigoselli et al., 2019). The X-ray spectral properties are different in these two modes. We treat it as two distinct pulsars. In total, there are 68 pulsars in the sample.
We scrutinized over these 68 pulsars to see whether a spectral model consisting of a power-law (PL) component and a blackbody (BB) component can well describe the observed X-ray spectrum, either from the literature or, when not available, from the spectral analysis conducted in this work. 32 among the 68 pulsars were found to be well described by such a PL+BB model, based on the criterion that the corresponding -value (that is, the corresponding random probability) of the reduced of the best-fit spectral model is larger than 0.05. A single PL model fits the other 36 pulsars well. Similar to the approach taken in Hsiang & Chang (2021), we mainly used Chandra data in the energy range from 0.5 keV to 8 keV. This energy range is the most common one employed in the spectral analysis we found in the literature, in particular for those based on Chandra data. When fluxes and uncertainties in the literature were reported in a different energy range, we compute the corresponding flux in 0.5 – 8 keV and estimate the uncertainty with the published value scaled by the flux ratio of the two energy ranges. To covert fluxes into luminosities, distances to the sources are needed. We adopt the best-estimate distances provided in the ATNF pulsar catalog111https://www.atnf.csiro.au/research/pulsar/psrcat/ for the conversion. Following Possenti et al. (2002), Li, Lu & Li (2008) and Hsiang & Chang (2021), we also adopt an uncertainty of 40% in distances. Four pulsars, PSR J0633+1746, PSR J0659+1414, PSR J1057-5226 and PSR J1740+1000, actually require a PL+2BB model to yield an acceptable fit. To have a uniform comparison base, a flux-weighted average of the temperature and the emitting-region radius of the two blackbody components is employed to describe their thermal emission. All the spectral properties of these 68 pulsars are listed in Table 1. The distances taken from ATNF pulsar catalog and the pulsar timing properties are in Table 3.

| Source name | Distance | |||||||
|---|---|---|---|---|---|---|---|---|
| (kpc) | (s) | (s/s) | (erg/s) | (yr) | (G) | (G) | (statV/cm) | |
| J0007+7303 | 1.40 | 0.3159 | 35.65 | 4.14 | 13.03 | 3.51 | 7.96 | |
| J01081431 | 0.21 | 0.8076 | 30.76 | 8.22 | 11.40 | 0.65 | 5.72 | |
| J0205+6449 | 3.20 | 0.0657 | 37.43 | 3.73 | 12.56 | 5.08 | 8.51 | |
| J0357+3205 | 0.84 | 0.4441 | 33.77 | 5.73 | 12.39 | 2.42 | 7.10 | |
| J0358+5413 | 1.00 | 0.1564 | 34.65 | 5.75 | 11.92 | 3.31 | 7.31 | |
| J0534+2200 | 2.00 | 0.0330 | 38.65 | 3.10 | 12.58 | 5.98 | 8.98 | |
| J05376910 | 49.70 | 0.0161 | 38.69 | 3.69 | 11.97 | 6.32 | 8.84 | |
| J05406919 | 49.70 | 0.0505 | 38.18 | 3.22 | 12.70 | 5.56 | 8.82 | |
| J06302834 | 0.32 | 1.2444 | 32.18 | 6.44 | 12.48 | 1.17 | 6.52 | |
| J0633+0632 | 1.36 | 0.2974 | 35.08 | 4.77 | 12.69 | 3.24 | 7.66 | |
| J0633+1746 | 0.19 | 0.2371 | 34.51 | 5.53 | 12.21 | 3.06 | 7.33 | |
| J0659+1414 | 0.29 | 0.3849 | 34.58 | 5.05 | 12.67 | 2.88 | 7.47 | |
| J0826+2637 | 0.50 | 0.5307 | 32.65 | 6.69 | 11.98 | 1.78 | 6.58 | |
| J08354510 | 0.28 | 0.0893 | 36.84 | 4.05 | 12.53 | 4.65 | 8.28 | |
| J0922+0638 | 1.10 | 0.4306 | 33.83 | 5.70 | 12.39 | 2.46 | 7.12 | |
| J0946+0951 | 0.89 | 1.0977 | 32.00 | 6.70 | 12.30 | 1.15 | 6.42 | |
| J0953+0755 | 0.26 | 0.2531 | 32.75 | 7.24 | 11.39 | 2.15 | 6.46 | |
| J10165857 | 3.16 | 0.1074 | 36.41 | 4.32 | 12.47 | 4.35 | 8.11 | |
| J10235746 | 2.08 | 0.1115 | 37.04 | 3.66 | 12.82 | 4.65 | 8.43 | |
| J10485832 | 2.90 | 0.1237 | 36.30 | 4.31 | 12.54 | 4.24 | 8.08 | |
| J10575226 | 0.09 | 0.1971 | 34.48 | 5.73 | 12.04 | 3.12 | 7.27 | |
| J11016101 | 7.00 | 0.0630 | 36.15 | 5.06 | 11.87 | 4.45 | 7.85 | |
| J11126103 | 4.50 | 0.0650 | 36.65 | 4.51 | 12.16 | 4.69 | 8.12 | |
| J11245916 | 5.00 | 0.1350 | 37.08 | 3.45 | 13.01 | 4.59 | 8.49 | |
| J1136+1551 | 0.37 | 1.1879 | 31.94 | 6.70 | 12.33 | 1.08 | 6.40 | |
| J11546350 | 1.36 | 0.2820 | 32.99 | 6.90 | 11.60 | 2.23 | 6.61 | |
| J13576429 | 3.10 | 0.1661 | 36.49 | 3.86 | 12.89 | 4.20 | 8.24 | |
| J14186058 | 1.89 | 0.1106 | 36.69 | 4.01 | 12.64 | 4.48 | 8.26 | |
| J14206048 | 5.63 | 0.0682 | 37.00 | 4.11 | 12.38 | 4.86 | 8.31 | |
| J14566843 | 0.43 | 0.2634 | 32.32 | 7.63 | 11.21 | 1.92 | 6.26 | |
| J14596053 | 1.84 | 0.1032 | 35.96 | 4.81 | 12.21 | 4.15 | 7.87 | |
| J15095850 | 3.37 | 0.0889 | 35.71 | 5.19 | 11.96 | 4.62 | 7.72 | |
| J15135908 | 4.40 | 0.1516 | 37.23 | 3.20 | 13.19 | 4.62 | 8.60 | |
| J16175055 | 4.74 | 0.0694 | 37.20 | 3.91 | 12.49 | 4.94 | 8.41 | |
| J17094429 | 2.60 | 0.1020 | 36.53 | 4.24 | 12.49 | 4.43 | 8.16 | |
| J17183825 | 3.49 | 0.0747 | 36.11 | 4.95 | 12.00 | 4.35 | 7.87 | |
| J17323131 | 0.64 | 0.1965 | 35.18 | 5.05 | 12.38 | 3.47 | 7.62 | |
| J1740+1000 | 1.23 | 0.1541 | 35.36 | 5.06 | 12.26 | 3.67 | 7.66 | |
| J17412054 | 0.30 | 0.4137 | 33.98 | 5.59 | 12.43 | 2.55 | 7.18 | |
| J17472958 | 2.52 | 0.0988 | 36.40 | 4.41 | 12.40 | 4.38 | 8.08 | |
| J18012451 | 3.80 | 0.1249 | 36.41 | 4.19 | 12.61 | 4.23 | 8.14 | |
| J18032137 | 4.40 | 0.1337 | 36.34 | 4.20 | 12.63 | 4.23 | 8.12 | |
| J18091917 | 3.27 | 0.0827 | 36.26 | 4.71 | 12.17 | 4.39 | 7.97 | |
| J18092332 | 0.88 | 0.1468 | 35.63 | 4.83 | 12.36 | 3.83 | 7.79 |
| Source name | Distance | |||||||
|---|---|---|---|---|---|---|---|---|
| (kpc) | (s) | (s/s) | (erg/s) | (yr) | (G) | (G) | (statV/cm) | |
| J18111925 | 5.00 | 0.0646 | 4.40 | 36.81 | 4.37 | 12.23 | 4.77 | 8.20 |
| J18131246 | 2.64 | 0.0481 | 1.76 | 36.79 | 4.64 | 11.97 | 4.89 | 8.13 |
| J18131749 | 4.70 | 0.0447 | 1.27 | 37.75 | 3.75 | 12.38 | 5.40 | 8.59 |
| J18261256 | 1.55 | 0.1102 | 1.21 | 36.49 | 4.16 | 12.57 | 4.41 | 8.19 |
| J18261334 | 3.61 | 0.1010 | 7.53 | 36.45 | 4.33 | 12.45 | 4.40 | 8.12 |
| J18331034 | 4.10 | 0.0619 | 2.02 | 37.53 | 3.69 | 12.55 | 5.15 | 8.55 |
| J1836+5925 | 0.30 | 0.1733 | 1.50 | 34.04 | 6.26 | 11.71 | 2.97 | 7.04 |
| J18380537 | 1.30 | 0.1457 | 4.72 | 36.78 | 3.69 | 12.92 | 4.40 | 8.36 |
| J18380655 | 6.60 | 0.0705 | 4.93 | 36.74 | 4.36 | 12.28 | 4.70 | 8.18 |
| J1856+0113 | 3.30 | 0.2674 | 2.08 | 35.63 | 4.31 | 12.88 | 3.57 | 7.92 |
| J1907+0602 | 2.37 | 0.1066 | 8.68 | 36.45 | 4.29 | 12.49 | 4.38 | 8.13 |
| J1930+1852 | 7.00 | 0.1369 | 7.51 | 37.08 | 3.46 | 13.01 | 4.57 | 8.49 |
| J1932+1059 | 0.31 | 0.2265 | 1.16 | 33.59 | 6.49 | 11.71 | 2.62 | 6.86 |
| J1952+3252 | 3.00 | 0.0395 | 5.84 | 36.57 | 5.03 | 11.69 | 4.87 | 7.97 |
| J1957+5033 | 1.37 | 0.3748 | 7.08 | 33.72 | 5.92 | 12.22 | 2.47 | 7.04 |
| J2021+3651 | 1.80 | 0.1037 | 9.57 | 36.53 | 4.24 | 12.50 | 4.43 | 8.16 |
| J2021+4026 | 2.15 | 0.2653 | 5.47 | 35.80 | 4.89 | 12.59 | 3.29 | 7.63 |
| J2022+3842 | 10.00 | 0.0486 | 8.61 | 37.48 | 3.95 | 12.32 | 5.23 | 8.47 |
| J2043+2740 | 1.48 | 0.0961 | 1.27 | 34.75 | 6.08 | 11.55 | 3.57 | 7.25 |
| J2055+2539 | 0.62 | 0.3196 | 4.08 | 33.69 | 6.09 | 12.06 | 2.52 | 6.99 |
| J2225+6535 | 0.90 | 0.6825 | 9.66 | 33.08 | 6.05 | 12.41 | 1.88 | 6.84 |
| J2229+6114 | 3.00 | 0.0516 | 7.83 | 37.34 | 4.02 | 12.31 | 5.14 | 8.42 |
| J2337+6151 | 0.70 | 0.4954 | 1.93 | 34.80 | 4.61 | 13.00 | 2.88 | 7.63 |
3 Correlations between non-thermal spectral properties and timing variables
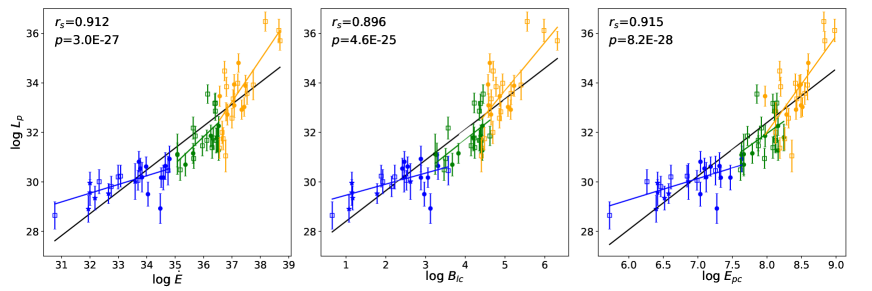
We first examine correlations between non-thermal X-ray spectral properties and pulsar timing variables to check the consistency of this work and earlier literature and to expand such kind of efforts for possible new results. The non-thermal X-ray properties are characterized by the luminosity, , in the energy range from 0.5 keV to 8 keV obtained from the power-law component in the best-fit spectral model, and the photon power index, , of that power law. The timing variables considered in the literature to date include period , period time-derivative , spin-down power , characteristic age , the dipole magnetic field strength at the stellar surface and at the light cylinder . Prompted by the discovery of ’s significant role in these correlations besides (Hsiang & Chang, 2021), in this work we introduce one more variable: , where is the potential difference between the magnetic pole and the rim of the polar cap for a pulsar in vacuum (Goldreich & Julian, 1969) and is the radius of the polar cap. is about the highest potential drop that can be developed in a pulsar’s magnetosphere and therefore is of the order of the highest electric field strength that can occur in the polar gap. is apparently related to acceleration of particles and can be very relevant.
These timing variables are all functions of and . We adopt conventional values of the moment of inertia g cm2 and radius km for the pulsar, and have (all in gaussian units) , , , , and , where , the light cylinder radius , () and the polar cap radius .
and versus all the timing variables are plotted in Figures 1 – 4. The Spearman rank-order correlation coefficient is employed to indicate the significance of possible correlations. Each and its associated random probability are noted in the figures. As found earlier, is very strongly correlated with as well as (Hsiang & Chang, 2021). We found, in addition, ’s correlation with is equally strong. This again suggests that should not be considered as the only major factor determining the non-thermal X-ray emissions from pulsars. We note that ’s correlations with the pulsar spin period and the characteristic age are also considerably strong.

The best fits to the three strongest correlations, using the least-square method to fit a linear function of the logarithms of these variables, are
| (1) |
| (2) |
and
| (3) |
The fitting uncertainties reported here and hereafter are all at a confidence level of 68%. Similar to what were found in earlier literature (e.g. Possenti et al. (2002); Li, Lu & Li (2008); Hsiang & Chang (2021)), the reduced chi-squares, , of these best fits are large and statistically not acceptable. We note that, in this work, best fits and are only suggestive, because the quoted uncertainties contain distance uncertainties and are not derived rigorously with proper statistics. Since timing variables are all functions of and , a two-variable fitting was conducted, that is, to fit the luminosity logarithm as a linear function of and directly. The best fit is
| (4) |
The fitting goodness here is similar to that reported earlier (Possenti et al., 2002; Hsiang & Chang, 2021). One may turn this best fit into functions of any two timing variables, that is, , , or .
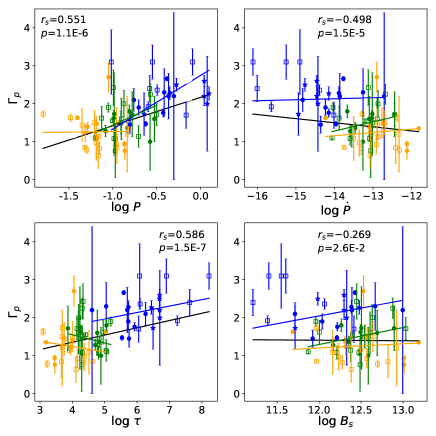
In the past, was not found to correlate with any timing variables. Now with a larger sample, we found that it is in fact correlated with all the timing variables except for in a way similar to that of but with a somewhat weaker significance (Figure 3). The best fits to the three strongest correlations, using the least-square method to fit as a linear function of the logarithms of these variables, are
| (5) |
| (6) |
and
| (7) |
The of these best fits are all much larger than that of , indicating a larger scatter in the correlations. The dependence of on timing variables is also weaker. The best fit for the fitting directly with and is
| (8) |
with . This can also be turned into functions of any two of , and . Although in Eqs(5)-(7) the best fit is large and the dependence of on , and seems weak, their correlations are clearly shown in Figure 3, with a random probability of order of , based on the Spearman’s rank-order correlation coefficient. This is reported in the literature for the first time.
With a large sample of 68 pulsars, we divided them into three groups according to their spin-down power. Members of different groups are color-coded in Figures 1 – 4. The best fits for each groups are also plotted. We note that, in the correlations of versus , and , slopes of the best fits are larger for higher-power groups. There is also a tendency of increasing slopes with higher spin-down-power groups for , from negative to positive values. These slopes (i.e. power indices of , and ) as shown in Figure 1 and Figure 3 are listed in Table 5 for readers’ reference. The power indices in Eqs.(1)–(3) and in Eqs.(5)–(7) are the combined results of these three groups. The stronger dependence of on these three timing variables for higher spin-down-power groups is obvious.
| V | Low power group | Median power group | High power group |
|---|---|---|---|
| (0.91) | (2.80) | (4.41) | |
| (1.03) | (2.81) | (5.50) | |
| (0.88) | (3.41) | (5.21) | |
| plus a constant | |||
| (9.23) | (5.15) | (17.5) | |
| (8.29) | (5.15) | (19.5) | |
| (10.0) | (5.21) | (17.7) |
4 Correlations between non-thermal and thermal emissions
As mentioned in the introduction section, there are good reasons to expect some connection between non-thermal and thermal X-ray emissions from pulsars. In the sample of 68 pulsars that we study in this work, thermal emissions are detected in 32 pulsars together with their non-thermal emissions, described by a PL+BB spectral model. These 32 pulsars do not show any distinct behavior in their timing variable distribution from the others that do not show thermal emissions. This is shown in Figures 1 – 4, in which these 32 are plotted with solid symbols and the other 36 with open ones.
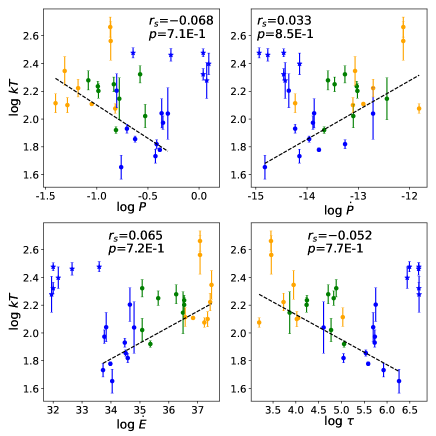
The correlations between the non-thermal properties, and , and the thermal ones, temperature (in units of eV) and the emitting-region radius (in units of km), are shown in Figure 5.
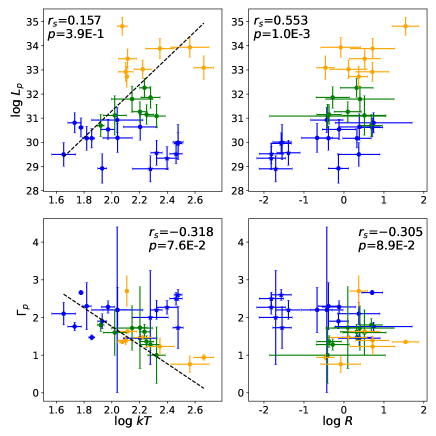
One can see that these correlations are weak. The only stronger correlations appear between and and between and when the six pulsars (in fact five: PSR J0946+0951 is counted twice for its different modes) with the so-called hot spots are excluded. Their Spearman’s rank-order correlation coefficients are 0.71 and , corresponding to a -value of and , respectively. The data point scatter is, however, still very large. The best fit of and as a function of for the sample of 26 pulsars are
| (9) |
and
| (10) |
Since the values in the above are large, we started to look for possible, tighter relationships in a multi-dimensional space, similar to what we did to obtain Eq.(4) and Eq.(8). This is also equivalent to finding a fundamental plane in a multi-dimensional space. Adding and to be independent variables together with , still with the sample of 26 pulsars, the best fit for and yields a value of 2.85 and 6.26, respectively. This fitting improvement apparently is not significant. The relationship reported earlier in Hsiang & Chang (2021) between and , and , obtained from a sample of 12 pulsars, is not confirmed by the current, larger sample.
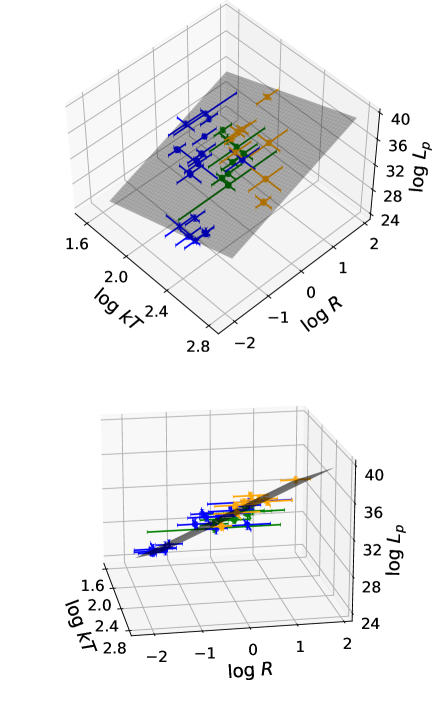
We then considered the space spanned by , and one of and . Much tighter relationships, indicated by a small , were found. They are
| (11) |
and
| (12) | |||||
In fact, we found that, in the space of {, , } and of {, , }, the sample of 32 pulsars (i.e. including those six with hot spots) has similar relations:
| (13) |
and
| (14) | |||||
This may be an indication that properties of non-thermal emissions are linked to thermal emissions, no matter whether there is a hot spot or not. These fundamental planes are plotted in Figures 6 and 7, in which one can see that the six hot-spot pulsars form a separate group but still are located in the same fundamental plane with the other 26.

Although these relations are tight (not quite so for Eq.(12) and Eq.(14)), timing variables might still play some role in determining properties of non-thermal X-ray emissions. We therefore included and in the fitting and found the best fit (for the sample of 32 pulsars) to be
| (15) |
and
| (16) | |||||
The dependence of on and does not change much from the space of {, , } to the space of {, , , , }. As shown in Eq.(15) the dependence on and is quite weak. On the other hand, the dependence of on and changes a lot. Timing variables play a more significant role than for the case of . This fitting has a small value of 0.84. As noted earlier, we are not able to demonstrate in a more statistically rigorous way whether the values in Eq.(15) and Eq.(16) indicate a statistically acceptable fit or not, because the uncertainty to pulsar distances is assigned somewhat arbitrarily at the level of 40%. Nonetheless, the best fits with a smaller do provide intriguing guidances for theoretical modeling.
5 Conclusions and Discussion
We employed a large sample of 68 pulsars to study the connections of their non-thermal X-ray properties, the power-law component luminosity in 0.5-8 keV and the spectral photon power index , with their thermal emission properties, the surface temperature and the emitting-region radius , and their various timing variables. We found the following: (i) is strongly correlated with , and at a similar significance level (Figure 1). The strong correlation with has been reported in Malov & Timirkeeva (2019) and Hsiang & Chang (2021), but the one with is reported here for the first time. It suggests that the spin-down power may not be the only major factor determining . (ii) The dependence of on , and shows a clear trend of being stronger with increasing (Figure 1). (iii) is also strongly correlated with , and at a similar significance level, but somewhat weaker than that of (Figure 3). This is the first time that this correlation is reported in the literature. (iv) Similar to , the dependence of on , and changes with the spin-down power. It turns from a negative correlation for the lower power group to a positive one for the high power group (Figure 3). (v) Relatively tight correlations are found among , and and among , and (Eqs.(13)–(14) and Figures 6 and 7). These are strong indication of the connection between thermal and non-thermal X-ray emissions. A tighter fundamental-plane relation for is found when two more dimensions, and , are included.
Items (i)–(iv) above provide finer constraints to theoretical modeling. In the past, although hampered by the sample size and by mixtures with emissions from pulsar wind nebulae and with thermal emissions, a strong correlation between non-thermal X-ray emission from pulsars and their spin-down power was found and the dependence is roughly linear with in being in the range from 0.9 to 1.4 (see the introduction in Hsiang & Chang (2021) for a brief review). An earlier outer-gap model predicts (Cheng, Taam & Wang, 2004). From the results presented in this paper, however, one sees that and may play an equally important role as in determining the properties of non-thermal X-ray emissions from pulsars. The changing dependence with different spin-down-power groups also indicates that somewhat different mechanisms may be at work for different energetics regimes.
Non-thermal X-rays are believed to originate from pair plasma created in pulsars’ magnetosphere. Pair production are expected to occur either near the polar cap or in the so-called outer-gap regions in different models. They are, however, both related to thermal emissions from the stellar surface. Near the polar cap, charged particles are accelerated in the polar gap to emit high-energy photons, which make pairs in the strong magnetic field. The acceleration of those charged particles does not only depend on the available potential drop in the polar gap but also on the thermal X-ray photon bath, which may decelerate those charged particles through inverse Compton scattering. In the outer gap region, surface thermal X-ray photons collide with seed high-energy photons to make pairs. It is therefore expected that thermal emission is related to non-thermal X-rays. The large scatter showing up in Figure 1 and Figure 3 and in all the earlier studies in the literature may indicate that, beside the geometry factor, and are not enough to describe the properties of non-thermal X-rays. Properties of thermal emissions probably should come into play. Indeed, as mentioned in item (v) in the above, tight relations describing fundamental planes in the space of {, , } and of {, , } are found. Finally, and as a function of , , and are presented in Eqs.(15) and (16).
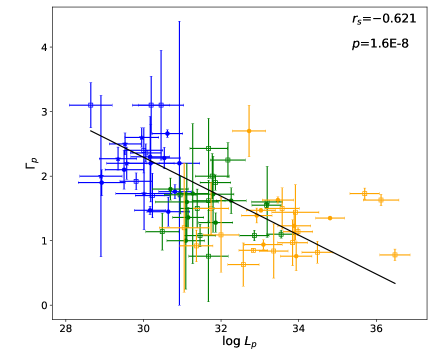
The power index is also correlated with the non-thermal luminosity at a significance level of the random probability being order of (Figure 8). The best fit to their relation is
| (17) |
This relation (the power index -0.30 of ) for the sample of 68 pulsars is consistent with Eq.(13) and Eq.(14), which are for the sample of 32 pulsars with thermal emissions. In the search for a fundamental plane relation, we did not try to do that in a space containing dimensions of both and , because these two quantities are two distinct dependent variables, which depend on independent variables and , and likely also and . Nonetheless, the trend of decreasing with increasing , as described by Eq.(17) and shown in Figure 8, is clear.
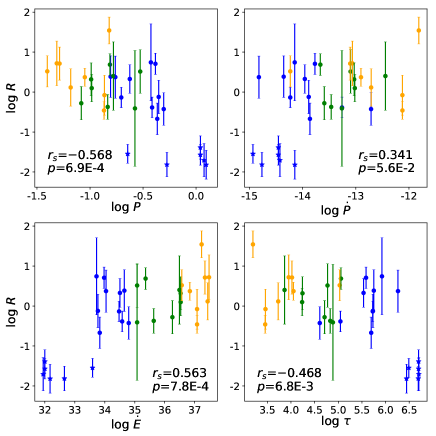
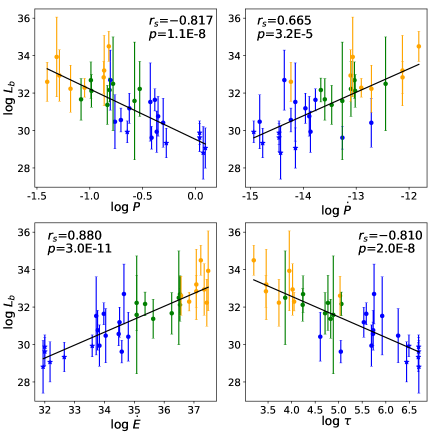
One may also wonder whether and are just functions of and and the non-thermal X-ray properties can therefore be described by the two variables and as in Eq.(4) and Eq.(8), for which the large values can be attributed solely to geometry factors. In Figures 9 and 10, and versus , , and are plotted. Generally speaking, and are not correlated with those timing variables, except that, when the six hot-spot pulsars are excluded, shows modestly strong correlations with them. The scatter, however, is large. On the other hand, if we consider the bolometric thermal luminosity , which is proportional to , relatively strong correlations show up, as shown in Figure 11. The six hot-spot pulsars follow the same correlations with the others, unlike that shown in Figures 9 and 10. It may suggest that is a more relevant parameter to use than . We note that, in Eqs.(13) and (14), the dependence on and cannot be replaced by alone. It is needed and equivalent to use any two among , and .
Although it is not within the scope of this paper, we note that seems to describe neutron star cooling better than the surface temperature (see the lower right panels in Figures 9 and 11). The temperature and the emitting-region radius obtained from spectral fitting with a blackbody component are an averaged description of the surface thermal emission, which comes from a surface with a non-uniform temperature distribution. Neutron cooling, through emission of neutrinos and photons, apparently does not only depend on the age but also on the neutron star mass, composition (at the core and the crust), the state of matter, magnetic configuration (possible presence of higher multipoles) and so on (e.g. Page (2009); Potekhin, Pons & Page (2015); Potekhin et al. (2020)). The scatter in the relation of versus is therefore inevitable. More samples and more precise measurements will not eliminate that scatter, but may yield a more stable, ensemble-averaged relation between and . As far as the non-thermal emission is concerned, when and (can be represented by and ) are determined, those physical factors like mass, composition and the equation of state do not affect the production of non-thermal X-ray emissions. However, the possible presence of magnetic higher multipoles and the geometric factors (magnetic inclination and observer’s viewing angles) will still play significant roles in the search for fundamental planes in the space of {, , , , } and of {, , , , }. We expect that, with more samples and more precise measurements, just like versus , we can only obtain a more stable, ensemble-averaged fundamental-plane relation. The scatter around that relation is inevitable. Nonetheless, such an ensemble-averaged relation is valuable for constraining theoretical models for non-thermal emissions from pulsars.
Acknowledgements
This work is supported by the National Science and Technology Council (NSTC) of the Republic of China (Taiwan) under grants MOST 110-2112-M-007-020 and MOST 111-2112-M-007-019.
Data availability
The data employed by this article are available in the article and in the quoted references.
References
- Abdo et al. (2010) Abdo A. A., Ackermann M., Ajello M., et al., 2010, ApJ, 711, 64
- Archibald et al. (2018) Archibald R. F., Kaspi V. M., Tendulkar S. P., Scholz P., 2018, ApJ, 869, 180
- Barnard et al. (2022) Barnard M., Venter C., Harding A. K., Kalapotharakos C., Johnson T. J., 2022, ApJ, 925, 184
- Becker et al. (2005) Becker W., Jessner A., Kramer M., Testa V., Howaldt C., 2005, ApJ, 633, 367
- Becker et al. (2004) Becker W., Weisskopf M. C., Tennant A. F., et al., 2004, ApJ, 615, 908
- Blumer, Safi-Harb & McLaughlin (2017) Blumer H., Safi-Harb S., McLaughlin M. A., 2017, ApJL, 850, L18
- Chang et al. (2012) Chang C., Pavlov G. G., Kargaltsev O., Shibanov, Y. A., 2012, ApJ, 744, 81
- Chang (1995) Chang H.-K., 1995, A&A, 301, 456
- Chen et al. (2006) Chen Y., Wang Q. D., Gotthelf E. V., et al., 2006, ApJ, 651, 237
- Cheng, Ho & Ruderman (1986) Cheng K. S., Ho C., Ruderman M., 1986, ApJ, 300, 500
- Cheng, Taam & Wang (2004) Cheng K. S., Taam R. E., Wang W., 2004, ApJ, 617, 480
- Coti Zelati et al. (2020) Coti Zelati F., Torres D. F., Li J., Viganò D., 2020, MNRAS, 492, 1025
- Cusumano et al. (2001) Cusumano G., Mineo T., Massaro E., et al., 2001, A&A, 375, 397
- Dai et al. (2018) Dai S., Johnston S., Weltevrede P., Kerr M., Burgay M., Esposito P., Israel G., Possenti A., Rea, N., Sarkissian J., 2018, MNRAS, 480, 358
- Danilenko et al. (2015) Danilenko A., Shternin P., Karpova A., Zyuzin D., Shibanov Y., 2015, PASA, 32, e038
- De Luca et al. (2005) De Luca A., Caraveo P. A., Mereghetti S., Negroni M., Bignami G. F., 2005, ApJ, 623, 1051
- Ge et al. (2019) Ge M. Y., Lu F. J., Yan L. L., et al., 2019, Nature Astronomy, 3, 1122
- Goldreich & Julian (1969) Goldreich P., Julian W. H., 1969, ApJ, 157, 869
- Gotthelf et al. (2008) Gotthelf E. V., Halpern J. P., 2005, ApJ, 681, 515
- Halpern, Gotthelf & Camilo (2012) Halpern J. P., Gotthelf E. V., Camilo F., 2012, ApJL, 753, L14
- Halpern et al. (2002) Halpern J. P., Gotthelf E. V., Camilo F., Collins B., Helfand D. J., 2002, in Neutron Stars in Supernova Remnants, ASP Conference Series, Vol. 271, held in Boston, MA, USA, 14-17 August 2001. Edited by P. O. Slane and B. M. Gaensler. San Francisco: ASP, p.199
- Halpern et al. (2004) Halpern J. P., Gotthelf E. V., Camilo F., Helfand D. J., Ransom S. M., 2004, ApJ, 612, 398
- Harding et al. (2018) Harding A. K., Kalapotharakos C., Barnard M., Venter C., 2018, ApJL, 869, L18
- Harding & Muslimov (1998) Harding A. K., Muslimov A. G., 1998, ApJ, 508, 328
- Harding & Muslimov (2002) Harding A. K., Muslimov A. G., 2002, ApJ, 568, 862
- Harding et al. (2021) Harding A. K., Venter C., Kalapotharakos C., 2021, ApJ, 923, 194
- Hermsen et al. (2018) Hermsen W., Kuiper L., Basu R., et al., 2018, MNRAS, 480, 3655
- Hinton et al. (2007) Hinton J. A., Funk S., Carrigan S., Gallant Y. A., de Jager O. C., Kosack K., Lemière A., Pühlhofer G., 2007, A&A, 476, L25
- Ho et al. (2020) Ho W. C. G, Guillot S., Parkinson P. M. S., et al., 2020, MNRAS, 498, 4396
- Hsiang & Chang (2021) Hsiang J.-Y., Chang H.-K., 2021, MNRAS, 502, 390
- Hu et al. (2017) Hu C.-P., Ng C.-Y., Takata J., Shannon R. M., Johnston S., 2017, ApJ, 838, 156
- Huang et al. (2012) Huang R. H. H., Kong A. K. H., Takata J., et al. 2012, ApJ, 760, 92
- Igoshev et al. (2018) Igoshev A. P., Tsygankov S. S., Rigoselli M, et al. 2018, ApJ, 865, 116
- Íñiguez-Pascual D., Viganò D. & Torres (2022) Íñiguez-Pascual D., Viganò D., Torres D. F., 2022, MNRAS, 516, 2475
- Johnson & Wang (2010) Johnson S. P., Wang Q. D., 2010, MNRAS, 408, 1216
- Kandel, Romani & An (2019) Kandel D., Romani R. W., An H., 2019, ApJ, 879, 73
- Kargaltsev, Pavlov & Garmire (2007) Kargaltsev O., Pavlov G. G., Garmire G. P., 2007, ApJ, 660, 1413
- Kargaltsev, Pavlov & Wang (2009) Kargaltsev O., Pavlov G. G., Wong, J. A., 2009, ApJ, 690, 891
- Karpova et al. (2014) Karpova A. V., Danilenko A., Shibanov Y., Shternin P., Zyuzin, D. 2014, ApJ, 789, 97
- Karpova et al. (2019) Karpova A. V., Zyuzin D., Shibanov Y., 2019, MNRAS, 487, 1964
- Kaspi et al. (2001) Kaspi V. M., Gotthelf E. V., Gaensler B. M., Lyutikov M., 2001, ApJ, 562, L163
- Kim & Hongjun (2020) Kim M., Hongjun A., 2020, ApJ, 892, 5
- Klingler et al. (2018) Klingler N., Kargaltsev O., Pavlov G. G. et al., 2018, ApJ, 861, 5
- Klingler et al. (2022) Klingler N., Kargaltsev O., Pavlov G. G. et al., 2022, ApJ, 932, 89
- Klingler et al. (2016a) Klingler N., Kargaltsev O., Rangelov B. et al., 2016a, ApJ, 828, 70
- Klingler et al. (2016b) Klingler N., Rangelov B., Kargaltsev O. et al., 2016b, ApJ, 833, 253
- Klingler et al. (2020) Klingler N., Yang H., Hare J., Kargaltsev O., Pavlov G. G., Posselt B., 2020, ApJ, 901, 157
- Kuiper, Hermsen & Dekker (2018) Kuiper L., Hermsen W., Dekker, A., 2018, MNRAS, 475, 1238
- Li, Lu & Li (2005) Li X. H., Lu F. J., Li T. P., 2005, ApJ, 628, 931
- Li, Lu & Li (2008) Li X.-H., Lu F.-J., Li Z., 2008, ApJ, 682, 1166
- Lin et al. (2014) Lin L. C.-C., Hui C. Y., Li K. T., Takata J., Hu C.-P., Kong A. K. H., Yen D. C. C., Chou Y., 2014, ApJ, 793, 8
- Lin et al. (2009) Lin L. C.-C., Takata J., Hwang C.-Y., Liang J.-S., 2009, MNRAS, 400, 168
- Malov & Timirkeeva (2019) Malov I. F., Timirkeeva M. A., 2019, MNRAS, 485, 5319
- Marelli et al. (2013) Marelli M., De Luca A., Salvetti D. et al., 2013, ApJ, 765, 36
- Marelli et al. (2014) Marelli M., Harding A., Pizzocaro D. et al., 2014, ApJ, 795, 168
- Marelli et al. (2016) Marelli M., Pizzocaro D., De Luca A. et al., 2016, ApJ, 819, 40
- Matheson & Safi-Harb (2010) Matheson H., Safi-Harb S., 2010, ApJ, 724, 572
- McGowan et al. (2006) McGowan K. E., Zane S., Cropper M., Vestrand W. T., Ho C., 2006, ApJ, 639, 377
- Mignani et al. (2012) Mignani R.P., Razzano M., Esposito P., De Luca A., Marelli M., Oates S. R., Saz-Parkinson P., 2012, A&A, 543, A130
- Misanovic et al. (2008) Misanovic Z., Pavlov G. G., Garmire G. P., 2008, ApJ, 685, 1129
- Ng, Roberts & Romani (2005) Ng C. Y., Roberts M. S. E., Romani R. W., 2005, ApJ, 627, 904
- Page (2009) Page D., 2009, in Becker W., ed., Astrophysics Space Science Library, Vol. 357, Neutron Stars and Pulsars, Springer, Berlin, p. 247
- Pancrazi et al. (2012) Pancrazi B., Webb N. A., Becker W. et al., 2012, A&A, 544, A108
- Park et al. (2007) Park S., Hughes J. P., Slane P. O. et al., 2007, ApJ, 670, L121
- Pavan et al. (2016) Pavan L., Pühlhofer G., Bordas P. et al., 2016, A&A, 591, A91
- Pavlov et al. (2008) Pavlov G. G., Kargaltsev O., Brisken W. F., 2008, ApJ, 675, 683
- Pavlov et al. (2001) Pavlov G. G., Zavlin V. E., Sanwal D., Burwitz V., Garmire G. P., 2001, ApJ, 552, L129
- Petri (2013) Pétri J., 2013, MNRAS, 434, 2636
- Petri (2015) Pétri J., 2015, A&A, 574, A51
- Posselt et al. (2012) Posselt B., Arumugasamy P., Pavlov G. G. et al., 2012, ApJ, 761, 117
- Posselt et al. (2012) Posselt B., Pavlov G. G., Manchester R. N., Kargaltsev O., Garmire G. P., ApJ, 749, 146
- Posselt et al. (2017) Posselt B., Pavlov G. G., Slane P. O. et al., 2017, ApJ, 835, 66
- Posselt, Spence & Pavlov (2015) Posselt B., Spence G., Pavlov G. G., 2015, ApJ, 811, 96
- Possenti et al. (2002) Possenti A., Cerutti R., Colpi M., Mereghetti S., 2002, A&A, 387, 993
- Potekhin, Pons & Page (2015) Potekhin A. Y., Pons J. A., Page D., 2015, Space Sci. Rev., 191, 239
- Potekhin et al. (2020) Potekhin A. Y., Zyuzin D. A., Yakovlev D. G., Beznogov M. V., Shibanov Yu. A., 2020, MNRAS, 496, 5052
- Reynolds, Borkowski & Gwynne (2018) Reynolds S. P., Borkowski K. J., Gwynne P. H., 2018, ApJ, 856, 133
- Rigoselli & Mereghetti (2018) Rigoselli M., Mereghetti S., 2018, A&A, 615, A73
- Rigoselli et al. (2022) Rigoselli M., Mereghetti S., Anzuinelli S. et al., 2022, MNRAS, 513, 3113
- Rigoselli et al. (2019) Rigoselli M., Mereghetti S., Turolla R. et al., 2019, ApJ, 872, 15
- Roberts et al. (2003) Roberts M. S. E., Tam C. R., Kaspi V. M. et al., 2003, ApJ, 588, 992
- Romani et al. (2005) Romani R. W., Ng C. Y., Dodson R., Brisken W., 2005, ApJ, 631, 480
- Sturner (1995) Sturner S. J., 1995, ApJ, 446, 292
- Szary et al. (2017) Szary A., Gil J., Zhang B. et al., 2017, ApJ, 835, 178
- Takata & Cheng (2017) Takata J., Cheng K. S., 2017, ApJ, 834, 4
- Takata, Ng & Cheng (2016) Takata J., Ng C. W., Cheng K. S., 2016, MNRAS, 455, 4249
- Temim et al. (2019) Temim T., Slane P., Sukhbold T., Koo B.-C., Raymond J. C., Gelfand J. D., 2019, ApJL, 878, L19
- Timokhin & Harding (2019) Timokhin A. N., Harding A. K., 2019, ApJ, 871, 12
- Torres (2018) Torres D. F., 2018, Nat. Astron., 2, 247
- Torres et al. (2019) Torres D. F., Viganò D., Coti Zelati F., Li J., 2019, MNRAS, 489, 5494
- Van Etten, Romani & Ng (2008) Van Etten A., Romani R. W., Ng C.-Y., 2008, ApJ, 680, 1417
- Wang et al. (2018) Wang H. H., Takata J., Hu C. -P., Lin L. C. C., Zhao J., 2018, ApJ, 856, 98
- Zhang & Cheng (2003) Zhang L., Cheng K. S., 2003, A&A, 398, 639
- Zyuzin et al. (2021) Zyuzin D. A., Karpova A. V., Shibanov Y. A., et al., 2021, MNRAS, 501, 4998