Wideband Study of the Brightest Black Hole X-ray Binary 4U 154347 in the 2021 Outburst: Signature of Disk-Wind Regulated Accretion
Abstract
A comprehensive wideband spectral analysis of the brightest black hole X-ray binary 4U during its 2021 outburst is carried out for the first time using NICER, NuSTAR, and AstroSat observations by phenomenological and reflection modelling. The source attains a super-Eddington peak luminosity and remains in the soft state, with a small fraction () of the inverse-Comptonized photons. The spectral modelling reveals a steep photon index () and relatively high inner disk temperature (T keV). The line-of-sight column density varies between () cm-2. Reflection modelling using the RELXILL model suggests that 4U is a low-inclination system (). The accretion disk is highly ionized (log > 3) and has super solar abundance (3.610 ) over the entire period of study. We detected a prominent dynamic absorption feature between keV in the spectra throughout the outburst. This detection is the first of its kind for X-ray binaries. We infer that the absorption of the primary X-ray photons by the highly ionized, fast-moving disk-winds can produce the observed absorption feature. The phenomenological spectral modelling also shows the presence of a neutral absorption feature keV, and both ionized and neutral absorption components follow each other with a delay of a typical viscous timescale of days.
keywords:
accretion, accretion disc - black hole physics - X-rays: binaries - stars: individual: 4U1 Introduction
X-ray spectroscopy of black hole X-ray binaries (BH-XRBs) holds the key to unveil the geometry of the system and the dynamics of the accretion process. The spectrum of BH-XRBs mainly consists of a hard powerlaw and a soft thermal component. The soft component, which is a multi-temperature blackbody, is assumed to be originated from an optically thick, geometrically thin accretion disk (Shakura & Sunyaev, 1973). The hard powerlaw component is generally believed to be emitted from an optically thin, hot electron cloud called ‘corona’ by the Comptonization of the soft disk photons (Sunyaev & Titarchuk, 1980, 1985; Zdziarski et al., 1994; Chakrabarti & Titarchuk, 1995; Poutanen & Coppi, 1998; Chakrabarti & Mandal, 2006; Iyer et al., 2015; Poutanen et al., 2018). The relative strength of these components leads to different states in outbursting BH-XRBs. In the Low/Hard State (LHS), the non-thermal component dominates and in the High/Soft State (HSS), the disk emission dominates. There are short-lived intermediate states also, namely, the Hard Intermediate State (HIMS) and Soft Intermediate State (SIMS), lying between LHS and HSS (Homan et al., 2001; Homan & Belloni, 2005; Remillard & McClintock, 2006; Nandi et al., 2012; Sreehari et al., 2019; Aneesha et al., 2019; Bhuvana et al., 2021; Prabhakar et al., 2022). A typical outburst starts with the LHS and proceeds through intermediate states to HSS then back to LHS again and finally reach quiescence. However, it does not always have to go through all the states mentioned above (Debnath et al., 2015; Radhika et al., 2016; García et al., 2019; Baby et al., 2020, 2021; Prabhakar et al., 2022).
The advent of high resolution spectroscopy reveals the presence of reflection features in the spectra of many BH-XRBs. Irrespective of the geometry of the corona, it is believed that the photons upscatterd by the corona, the primary photons interact with the disc material and a part of which produces the reflection features (Basko et al., 1974). The reprocessed X-ray spectrum consists of fluorescent line emission from various elements, a soft thermal continuum and a Compton hump peaked at keV. The most prominent feature among the fluorescent emission lines is the iron K-edge at keV (Ueda et al., 1998) and K line at keV (White et al., 1986; Barret & Olive, 2002; Di Salvo et al., 2005). This is because the fluorescence yield increases with the atomic number (Burhop, 1952). For a distant observer, these reflection features appeared to be diluted/broadened and distorted (asymmetric) due to relativistic effects of the strong gravity region in the close vicinity of the BH (Fabian et al., 1989, 2000). Spectral modelling using relativistic reflection models can address the effect of blurring of the spectral features and helps to probe the physics of the strong gravity region at the inner disk. The accretion disk characteristics, such as the ionization of the disk material, the iron abundance, inclination of the system, spin of the BH etc., can also be obtained from reflection modelling. The line broadening can also be due to Comptonization in a highly ionized, optically thick cloud, and the resultant feature is broad and symmetric. However, this mechanism is important for high inclination systems only (Petrucci et al., 2001).
The FeK band ( keV) is the energy range where most of the emission/absorption features appear. The first observational evidence of the FeK absorption lines was provided by Ueda et al. (1998) with ASCA in the spectra of galactic superluminal BH source GRO J. Kotani et al. (2000) and Lee et al. (2002) also detected similar features in the superluminal jet source GRS with ASCA. Later, it is revealed that the absorption features are very common in the spectra of BH-XRBs (Shidatsu et al., 2013; King et al., 2014; Xu et al., 2018). Photon interaction with neutral and static material produces sharp fluorescent lines at their corresponding transition energy levels. In case of ionized absorbers, there would be an increase in the transition line energy compared to their neutral ones. The absorption lines from highly ionized ions give an insight into the highly ionized plasma around the compact object.
The process of accretion in XRBs is usually accompanied with outflows and/or jets (Fender et al., 1999, 2004, 2010; Miller et al., 2012, 2013; Radhika & Nandi, 2014; Radhika et al., 2016). The persistent jets are present in the LHS of the system, and it gets turned off in HSS. Accretion disk-wind is generally observed in the disk-dominated HSS, though it can exist in other spectral states as well (Lee et al., 2002; Miller et al., 2008; Neilsen & Lee, 2009; Neilsen, 2013). The disk-winds carry a sufficient amount of matter which suppresses the launch of radio jets (Neilsen & Lee, 2009) in HSS. The disk-wind can also be highly ionized and their presence can be inferred by the blue-shifted absorption features in the X-ray spectrum (Ebisawa, 1997; Kotani et al., 1997). In general, it seems that the absorption lines are absent in the LHS, which is still a matter of debate. Neilsen & Lee (2009) suggests that the wind gets photoionized completely in LHS, and the medium becomes transparent; this could be a possible reason for the absence of absorption lines in the spectra. Usually, the disk-winds are observed in high inclination systems (Ponti et al., 2012). Such systems may show intensity ‘dips’ in their X-ray spectra, for e.g., GRS , 4U , H , MAXI J, GRO J (Leahy, 1997; Kuulkers et al., 1998; Shidatsu et al., 2013). The dips are believed to be caused by obscuring material associated with the accretion disk (Frank et al., 1987) and are visible for highly inclined systems with inclination angle (Frank et al., 1987). The disk-winds play a major role in regulating the accretion scenario of BH-XRBs. For example, Muñoz-Darias et al. (2016) showed how winds control the violent outburst of V404 Cygni by diminishing a significant fraction of the outer disk. Disk-wind studies in BH-XRBs can provide great insights into the physical mechanisms involved in the accretion process.
4U is a BH-XRB, discovered by Uhuru satellite in 1971 (Matilsky et al., 1972). Since the discovery, it has undergone five outbursts; the first four are in an interval of 10 years, in 1984 (Kitamoto et al., 1984), 1992 (Harmon et al., 1992) and 2002 (Park et al., 2004). After a gap of 19 years, the fifth outburst happened in 2021 (Negoro et al., 2021a), which marks the source as the brightest BH-XRB with a peak X-ray intensity of 11 Crab in keV with MAXI/GSC (Negoro et al., 2021b). The 2002 outburst was also brighter (4 Crab in keV), while the previous three outbursts have comparable intensities (Park et al., 2004). Its optical counterpart, IL Lupi, was discovered by Pedersen (1983). The central engine is a dynamically confirmed BH with a mass of M⊙, and the companion is an A2V star of mass M⊙ (Russell et al., 2006). It is located at , (J2000) (Park et al., 2004) at a distance of kpc (Jonker & Nelemans, 2004). Orosz (2003) estimated the orbital inclination of the system as . There were multiple attempts to estimate the spin (, dimensionless spin parameter) of the BH in 4U using RXTE observations of the 2002 outburst. Shafee et al. (2006) estimated a spin of using continuum-fitting of RXTE data. Miller et al. (2009) and Morningstar & Miller (2014) estimated the spin value as and respectively using relativistic disk reflection and disk continuum modelling. These three estimations are based on a BH mass of M⊙ and a distance of kpc. Shafee et al. (2006) and Morningstar & Miller (2014) used the binary inclination () of degree, while Miller et al. (2009) used a of degree for the spin estimation. Dong et al. (2020) reported a spin of and of degree by reflection modelling of RXTE data using the model RELXILL.
The Giant Metrewave Radio Telescope (GMRT) detected radio flares from the source in 2002 outburst (Park et al., 2004). Multiple flaring occasions are reported at different phases of the outburst. Russell et al. (2020) reported the presence of a compact jet in the SIMS of the 2002 outburst of 4U using multiwavelength observations (X-ray, optical, IR, and radio). Since the system has a low inclination, the jet angle and axis of rotation may coincide. Russell et al. (2020) tested the chances of jet contribution to the luminosity of the system and renounced that possibility.
Until now, there is no study in literature based on the 2021 outburst of 4U . We aim for a detailed analysis of the wideband spectral characteristics of the 2021 outburst using three different instrument data from NICER (Neutron star Interior Composition ExploreR), NuSTAR (Nuclear Spectroscopic Telescope Array) and AstroSat during outburst decay. The evolution of spectral parameters is investigated using phenomenological and reflection modelling. Even though the reflection modelling of RXTE data of 2002 outburst (Miller et al., 2009; Morningstar & Miller, 2014; Dong et al., 2020) unveil the fundamental quantities of the system like and , data from much better spectral resolution instruments like NuSTAR (Harrison et al., 2013) are highly promising. It can also provide outburst specific quantities like the iron abundance and ionization of the accretion disk. We report the presence of strong and dynamic absorption features in the 2021 outburst spectra, which has not been observed in any previous outbursts of 4U . We examine these features quantitatively using phenomenological modelling of NuSTAR data.
This paper is structured as follows: The observations and the data reduction procedure are discussed in §2. The evolution of the outburst lightcurve and hardness ratio are examined in §3. The spectral modelling and parameter evolution are presented in §4. Phenomenological and reflection modelling of different epochs are discussed in §4.1 and §4.2, respectively. The detailed study of the absorption features in the spectra of 4U is carried out in §4.3. We discussed our overall findings in §5. Finally, we summarise the results in §6 and then conclude.
| Epoch | Obs. ID (MJD) | Remarks | ||
|---|---|---|---|---|
| NuSTAR | NICER | AstroSat | ||
| 1 | 80702317002 (59382.42) | 4655060101 (59382.44) | ||
| 2 | 80702317004 (59389.47) | 4655060201 (59389.47) | ||
| 3 | T04_018T01_9000004494 (59396.04) | Offset | ||
| 4 | 80702317006 (59396.18) | 4655060301 (59396.19) | ||
| 5 | 80702317008 (59403.02) | 4655060401 (59403.04) | ||
| 6 | T04_021T01_9000004526 (59405.36) | Offset | ||
| 7 | T04_030T01_9000004588 (59421.19) | Pointed | ||
| 8 | 90702326002 (59421.67) | |||
| 9 | 90702326004 (59428.18) | 4202230143 (59428.13) | ||
| 10 | T04_035T01_9000004622 (59430.59) | Pointed | ||
| 11 | 90702326006 (59450.19) | |||
| 12 | 90702326008 (59455.55) | |||
| 13 | T04_046T01_9000004680 (59457.06) | Pointed | ||
| 14 | T04_051T01_9000004686 (59461.05) | Pointed | ||
| 15 | 90702326010 (59465.67) | 4202230166 (59466.07) | ||
| 16 | 90702326012 (59471.51) | 4202230171 (59471.43) | ||
2 OBSERVATIONS AND DATA REDUCTION
We perform the present study based on the 2021 outburst of 4U using NuSTAR, NICER and AstroSat observations over a period from 17 June 2021 (MJD 59382) to 14 September 2021 (MJD 59471). We considered all the NuSTAR and AstroSat observations in this period and used the NICER observations which are simultaneous with NuSTAR. The list of observations considered for this study is given in Table 1. There are a total of 16 epochs of observations consisting of ten NuSTAR and six AstroSat observations. Seven NuSTAR epochs have simultaneous NICER coverage also.
2.1 NuSTAR Data Reduction
NuSTAR (Harrison et al., 2013) has observed the source several times in the 2021 outburst. NuSTAR is devoid of pile-up issues and moreover, its good energy resolution in the energy coverage ( keV) makes it suitable for the study of enormously bright sources like 4U . NuSTAR consists two focal plane module telescopes (FPMA and FPMB), both are operating in keV band. The NuSTAR data for the 2021 outburst is reduced using HEASOFT v.6.29, NUSTARDAS pipeline v.2.1.1 and CALDB v.20211115. For extremely bright sources, we set statusexpr="STATUS==b0000xxx00xxxx000"111https://heasarc.gsfc.nasa.gov/docs/nustar/analysis/ and set saamode to strict and tentacle to yes. A circular region of radius 35 pixels centered on the brightest pixel is extracted as the source region and as the background region, we also choose a 35 pixel circular region away from this. These files are used for generating science products such as the spectrum, background, lightcurve, Auxiliary Response File (ARF) and Response Matrix File (RMF), through the NUPRODUCTS task, independently for both FPMA and FPMB. The spectra are grouped with a minimum of 50 counts per bin without any systematics.
2.2 NICER Data Reduction
The X-ray Timing Instrument (XTI) onboard NICER (Gendreau et al., 2016) operates in keV band. NICER has observed the source 4U in almost every day during the 2021 outburst. We analyse NICER data of the source between MJD 59382 and MJD 59471 which is simultaneous with the NuSTAR observations (Table 1). The data is reduced using the tool NICERDAS222https://heasarc.gsfc.nasa.gov/docs/nicer/nicer_analysis.html in HEASOFT v.6.29 with the 20210707 caldb version. There are 56 focal plane modules (FPMs) of NICER/XTI. We excluded FPM-14 and 34 in addition to the non-functional FPMs (FPM-11, 20, 22, and 60) due to increased noise levels. Since 4U is extremely bright at the beginning of the outburst, the initial epochs (till MJD 59425) are affected by telemetry saturation. For such observations, a lower number of FPMs were kept active by the instrument team and we considered only the active detectors in the data reduction. Level-2 standard calibration and filtering are done using nicerl2 task and applied barycenter corrections through barycorr with refframe="ICRS". Spectra is generated using XSELECT (V2.4m). Lightcurve of the NICER observation on MJD 59428.18 shows a flaring in the high energy band; therefore, the corresponding GTIs are excluded from the extraction. The ARF and RMF files are generated for each observation based on the number of active detectors. The task nibackgen3C50333https://heasarc.gsfc.nasa.gov/docs/nicer/tools/nicer_bkg_est_tools.html (Remillard et al., 2021) is used for creating background files. Finally, the source spectra are grouped with 25 photons per bin and a systematic uncertainty of 1 is added to the spectra.
2.3 AstroSat Data Reduction
The Soft X-ray Telescope (SXT) and Large Area X-ray Proportional Counter (LAXPC) on-board AstroSat (Yadav et al., 2016; Agrawal et al., 2017) together observes the astronomical sources in wideband energy range (0.380 keV). AstroSat has observed the 2021 outburst of 4U - during 6 different epochs. The first two of these observations are carried out with an offset of 40′ since the source was too bright to have pointed observation (Garg et al., 2021). We obtain Level-1 LAXPC and Level-2 SXT data of all six observations available at data archive hosted by ISSDC444https://astrobrowse.issdc.gov.in/astro_archive/archive/Home.jsp.
LAXPC consists of three identical proportional counts namely LAXPC10, LAXPC20 and LAXPC30. However, for our analysis, we have used data from LAXPC20 alone because of its steady gain (see also Bhuvana et al. 2021; Baby et al. 2021; Bhuvana et al. 2022; Prabhakar et al. 2022). To extract the Level-2 LAXPC data file i.e., source spectrum, lightcurve, RMF and background spectrum and lightcurve, we make use of latest version of single routine LAXPC software LaxpcSoftversion3.4.3555http://www.tifr.res.in/~astrosat_laxpc/LaxpcSoft.html (Antia et al., 2022). Level-2 files are extracted from a single event and the top layer of LAXPC unit to avoid the instrument effects at high energy. While the software generated LAXPC response files are used for pointed observations, a 40′ offset LAXPC response file provided by the instrument is used for the offset observations (see also Baby et al. 2020; Katoch et al. 2021).
SXT has observed the source in Photon Counting (PC) mode during all the epochs. The orbit-wise SXT cleaned Level-2 event files are merged to get single event file for each observation using event merger python routine666https://www.tifr.res.in/~astrosat_sxt/dataanalysis.html based on Julia v 1.1.1. The merged event file is then loaded into XSELECT, where we select single-pixel events by applying grade 0 filter to avoid optical data leakage (Singh et al., 2021; Prabhakar et al., 2022). From the XSELECT images, we find that the first two offset observations have count rate counts s-1 and hence the corresponding spectra wouldn’t have pileup issues. We select a circular region of radius 10′ in the image to extract the source spectrum and lightcurve files. In all the pointed observations (see Table 1), we find the central region of the image to be very bright which could cause a pile-up effect. Therefore, source files are extracted from an annular region of the outer radius of 15′ and inner radius of 2′ for these observations. The standard SXT background spectrum and instrument response file provided by the instrument team777https://www.tifr.res.in/~astrosat_sxt/dataanalysis.html are used. ARF for the selected region is obtained from python-based tool sxtarfmodule provided by the SXT team. Extracted SXT and LAXPC spectra are grouped to have 30 counts per bin in the first two observations and 20 counts per bin in the rest of the observations based on the source brightness. A systematics of 2% (Sreehari et al., 2019; Athulya et al., 2022) is applied for both SXT and LAXPC spectra.
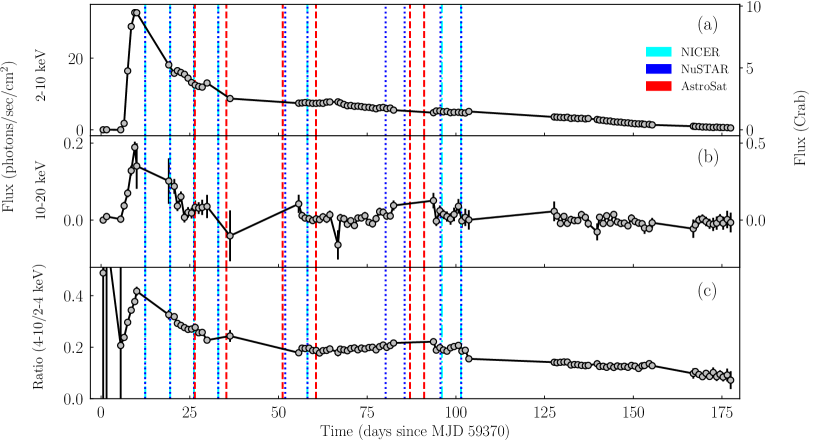
3 Outburst Profile and Hardness ratio
During the 2021 outburst of 4U , the flux reached the peak value within a few days of the commencement of the outburst. The outburst is monitored by multiple X-ray instruments. The MAXI/GSC888http://maxi.riken.jp/mxondem/ daily lightcurve of the source is generated for two different energy bands, keV and keV and are plotted in Fig. 1. The MJD 59370 (05 June 2021) is defined as day 0 throughout the study and according to this, the outburst continues over 175 days. The lightcurve reveals that the source is extremely luminous in low energies with a very high count rate (Fig. 1a), while the contribution to the luminosity in the high energy band (Fig. 1b) is an order of magnitude lower. The highest value of flux in keV band is 32.67 photons/sec/cm2 ( 10 Crab) on day 9, whereas the same in keV is just 0.19 photons/sec/cm2 ( 0.5 Crab). The source flux reached 11.65 Crab in keV, which is the highest value observed among the BH-XRBs. We define hardness ratio (HR) as the ratio of flux in keV to keV since beyond 10 keV the contribution is significantly low. The HR evolution (Fig. 1c) shows that the source mostly remains in the soft state during the outburst. The NICER, NuSTAR and AstroSat observations used in this study are marked by cyan, blue and red dashed lines, respectively. There is no simultaneous broadband observation in the rising phase of the outburst.
4 Spectral Modelling and Results
We studied the spectral properties of the 2021 outburst of 4U from MJD 59382 (17 June 2021) to MJD 59471 (14 September 2021). All the three instruments, NICER, NuSTAR and AstroSat have good coverage over this period. Table 1 summarises the list of observations used in this work. In total, there are 16 epochs, comprising ten NuSTAR and six AstroSat (SXT-LAXPC) observations. In addition, there are seven NICER observations which are simultaneous with that of NuSTAR and we used these pairs for NICER-NuSTAR wideband spectral analysis. We carried out phenomenological and reflection modelling of each NuSTAR observations and extended that to wideband NICER-NuSTAR and AstroSat observations.
4.1 Phenomenological Spectral Modelling
We used HEASOFT v.6.29 and XSPEC V12.12.0 package for the spectral modelling of NICER, NuSTAR and AstroSat data. We have done spectral modelling of NICER-NuSTAR and AstroSat data to see the nature of the broad-band spectrum. The NICER data below 0.8 keV shows large residuals; therefore, we used keV for NICER spectra and keV for NuSTAR spectra. Spectra from both FPMA and FPMB telescopes of NuSTAR give similar results. We present only FPMA spectra throughout the study. We used keV for SXT and keV for LAXPC as significant data is not available beyond this range.
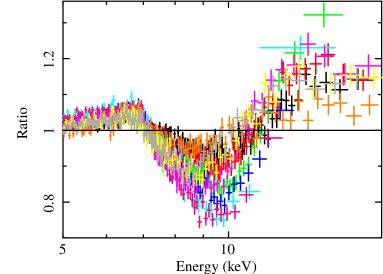
To accommodate the interstellar absorption, we used the tbabs model which uses an equivalent hydrogen column density through the solar abundance table provided by Wilms et al. (2000). We initially modelled the NuSTAR observations with tbabs(diskbb+powerlaw) model. Here, diskbb (Mitsuda et al., 1984) represents the multicolor blackbody spectrum from the accretion disc and powerlaw employs the inverse Comptonization of the soft blackbody photons. We detected a broad absorption feature at keV in all epochs. The ratio of data to model of all the NuSTAR observations are shown in Fig. 2. The different NuSTAR epochs are shown in black, red, green, blue, cyan, pink, magenta, orange, yellow and grey colours in ascending order. It shows that the depth of absorption feature starts with a low value (black in colour) and then keeps on increasing as the outburst progress, reaching the maximum on Epoch 9 (pink in colour). Finally, the absorption depth decreases towards the end (grey in colour) of our study. We found a similar absorption feature in the AstroSat/LAXPC data as well.
| Epoch | Model | |||||||||||||
|---|---|---|---|---|---|---|---|---|---|---|---|---|---|---|
| diskbb | thcomp | edge or gauss∗ | gabs | |||||||||||
| ( | norm | kTe | covfrac | line E | D or | line E | strength | ( | ||||||
| ) | (keV) | () | (keV) | () | (keV) | (keV) | (keV) | (keV) | (keV) | erg cm-2 s-1) | () | |||
| 1 | 0.90 | |||||||||||||
| 2 | 1.00 | |||||||||||||
| 3 | ||||||||||||||
| 4 | 0.95 | |||||||||||||
| 5 | 1.02 | |||||||||||||
| 6 | ||||||||||||||
| 7 | - | - | 1.29 | |||||||||||
| 9 | 1.05 | |||||||||||||
| 10 | - | - | 1.28 | |||||||||||
| 13 | - | - | 1.10 | |||||||||||
| 14 | - | - | 1.31 | |||||||||||
| 15 | 1.27 | |||||||||||||
| 16 | 1.00 | |||||||||||||
-
b
∗ edge is used for NICER-NuSTAR pairs whereas gauss component is used only for Epoch 3 & 6 of AstroSat data.
-
•
f Frozen parameters
We used a partial covering fraction absorption model pcfabs999https://heasarc.gsfc.nasa.gov/xanadu/xspec/manual/XSmodelPcfabs.html in XSPEC to check if this strong absorption feature at keV can be due to an intervening absorber, but it did not improve the fitting and the low energy residuals were high. We also tried several other models, for example, the thermal Comptonization model nthcomp (Zdziarski et al., 1996) or thcomp (Zdziarski et al., 2020) in-place of powerlaw, and diskbb was replaced by kerrbb (Li et al., 2005). Various combinations of these models, fit to the data also showed the presence of the absorption feature at keV. Model combination with kerrbb as the seed photon source did not provide a good fit; moreover, it failed to constrain the BH mass and spin. So, we prefer to use diskbb model in combination with thcomp which is an improved version of nthcomp. The thcomp is a convolution model which allows a variable fraction (parameter ) of seed photon to Comptonize both up-scattering and down-scattering. Other parameters are the photon index () and electron temperature () of the corona.
The observed absorption feature has a symmetrical profile and inclusion of a Gaussian absorption model gabs101010https://heasarc.gsfc.nasa.gov/xanadu/xspec/manual/node246.html fits the absorption feature well. The parameters of gabs component are line energy (line E, Eg), line width () and line depth (strength). However, if we use a smeared absorption edge model, smedge (Ebisawa et al., 1994) in XSPEC to compensate for the absorption feature, it results in an abnormally high value of absorption width due to the asymmetric nature of the model. In addition, the NuSTAR data show a weak presence of a Fe Kα absorption edge. Therefore, we also used an edge component to improve the fit residual for NuSTAR. The model parameters for the edge component are the threshold energy of the absorption edge (edge E, Ee) and the corresponding absorption depth (D). Therefore, the final model for NICER-NuSTAR data is (model M1, hereafter). In contrast, the absorption edge feature was not visible in the AstroSat/LAXPC data, possibly due to the low spectral resolution of LAXPC. Therefore, the model M1 for AstroSat data becomes . However, the AstroSat data of Epoch 3 & 6 show the presence of a weak Fe Kα emission line feature in the residual, and we include a gauss model component for these two epochs of AstroSat data.
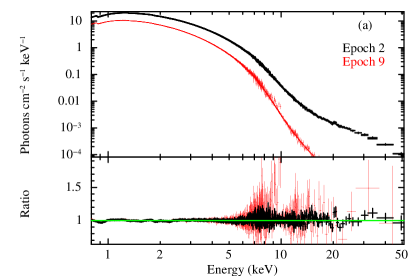
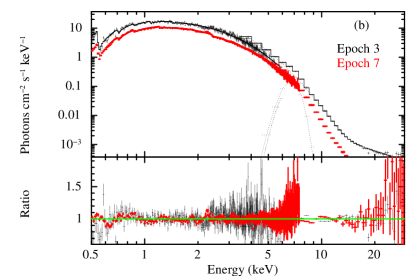
All the seven NICER-NuSTAR simultaneous pairs and six AstroSat observations are fitted with the model M1. The Fig. 3a and Fig. 3b show the wideband spectra of NICER-NuSTAR (Epoch 2 & 9) and AstroSat (Epoch 3 & 7) respectively modelled using M1. In each case, the spectrum in the red colour is relatively softer than that of the black colour; therefore, both figures illustrate moderate spectral changes during the outburst decay.
The goodness of the fit is determined using statistics. The reduced () varies between . All the parameters estimated from the wideband phenomenological modelling are presented in Table 2. The parameter uncertainties are calculated within the confidence range. Note that the NuSTAR observations on Epoch 8, 11 & 12 (Table 1) are not included here as no simultaneous NICER observations available. The is left free and it varies between () 1022 cm-2. We aim to find out the evolution of various parameters with the progress of the outburst. Fig. 4 gives the variation of the inner disk temperature , photon index and optical depth () with time. Here, points in green and red colour represent the parameter value estimated from NICER-NuSTAR and AstroSat spectral modelling respectively.
We find that the inner disk temperature (Fig. 4a and Table 2) monotonically decreases throughout the outburst decay. The evolution of the diskbb norm (Table 2) estimated using NICER-NuSTAR decreases till Epoch 9 and a reverse trend is observed for later epochs. The diskbb norm from the AstroSat data also shows a similar pattern though AstroSat values are higher than that of NICER-NuSTAR. The variation of photon index is presented in Fig. 4b. The value of estimated from AstroSat data (red square) differs from that of NICER-NuSTAR pairs (green square). This can be due to the non-availability of the high energy contribution (beyond 30 keV) in the LAXPC data. From NICER-NuSTAR fitting, varies between , and it shows spectral softening till Epoch 9. We wanted to estimate the electron temperature () of the corona using the thcomp model. But the broadband spectral fitting could not constrain the value of , except for Epoch 2, for which we obtained 11.6 keV (Table 2). For all the remaining epochs, we freeze at 20 keV. Only a tiny fraction, covfrac < 3 % (Table 2), of the soft photons Comptonized in the corona. It gradually decreases till Epoch 10 and increases afterwards. This behaviour is consistent with the spectral softening trend shown in Fig. 4b.
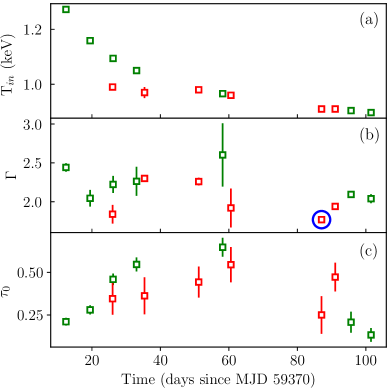
The broad absorption feature at 811 keV in the spectrum is well represented by the gabs model. The strength shows an increasing trend and reaches the maximum in Epoch 9 and declines beyond that. We calculate the optical depth () associated with the gabs component using gabs strength and as strength. The evolution of is shown in Fig. 4c, which shows that the absorption optical depth increases and reaches a maximum on Epoch 9 and then decreases. The dynamic behaviour of the absorption strength seems interesting. We attempt to characterize the strong and dynamic absorption features in §4.3. The evolution of the edge component is listed in Table 2. We discuss a possible connection between edge and gabs components in §5.
We estimate the observed bolometric flux () in keV with uncertainty in confidence interval from the wideband simultaneous spectral data, which is also shown in Table 2. Corresponding bolometric luminosity () of the source is also calculated by assuming the distance to the source as kpc (Jonker & Nelemans, 2004). The Eddington luminosity of the source is ergs s-1 with an assumed BH mass of M⊙ (Russell et al., 2006). It can be seen from Table 2 that the luminosity of the source exceeds the at the peak (Epoch 1 is close to the peak) of the outburst, and the luminosity decreases gradually with the decay of the outburst.
4.2 Spectral Modelling for Reflection Studies
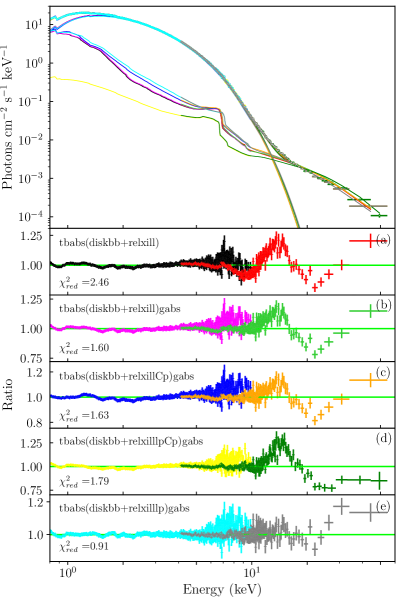
To understand the reflection features in the spectra of 4U , we use the relativistic reflection model RELXILL111111http://www.sternwarte.uni-erlangen.de/~dauser/research/relxill/index.htmlv1.4.3. Different flavours of the RELXILL model are tried. The unfolded NICER-NuSTAR spectra and data-to-model ratios using various reflection models are shown in Fig. 5 for Epoch 2. We started with the model tbabs(diskbb+relxill) which gives a of . The data-to-model ratio (Fig. 5a) shows that the absorption feature at keV in the spectrum cannot be fitted by the reflection model. We added the absorption model gabs with this, and the model tbabs(diskbb+relxill)gabs (Fig. 5b) improves the residual but still the for this combination is . Then, we replaced the model relxill with relxillCp (Fig. 5c) where a thermal Comptonizing continuum is assumed for the illuminating flux. This combination has , which is also unacceptable. Then, we used relxilllpCp (Fig. 5d) as the reflection model, where a lamp-post (lp) geometry is assumed for the corona. In all the ‘lp’ flavours of the RELXILL model, the inner disk is illuminated by a point-like corona situated at a height ‘’ from the disk surface on the axis of rotation. The modelling with relxilllpCp also resulted in a large residual, with . We replaced relxilllpCp with relxilllp (Fig. 5e) where the illuminating flux is modelled as a powerlaw with a high-energy cutoff just like the relxill. For this trial, we got a reasonable fit with , and we decided to proceed with the model combination, tbabs(diskbb+relxilllp)gabs (model M2, hereafter) as the final model to study the reflection features in the spectra. Note that, no additional edge or gauss component is required in the reflection modelling.
Using the model M2, we did the spectral fitting of the simultaneous NICER-NuSTAR pairs and AstroSat observations. Here, is a free parameter. Inner and outer disk radii are frozen at the innermost stable circular orbit and 400 (where , the gravitational radius of the BH), respectively. The powerlaw cutoff energy, , is fixed at 60 keV since it is hitting the upper limit. All other parameters of relxilllp are kept free; the lamp-post height (in units of ), inclination angle of the system (in degree), of the incident radiation, ionization parameter (erg cm s-1), iron abundance () of the accretion disk in terms of the solar abundance , and the reflection fraction . Here, is defined as the ratio of the primary photon flux illuminating the disk to that reach the observer at infinity (Dauser et al., 2016). We wish to estimate the spin parameter, , of the system, but it is found to hit the upper limit for almost all the epochs. Based on previous studies (Morningstar & Miller, 2014; Dong et al., 2020), we freeze for this study.
The estimated reflection model (M2) parameters are listed in Table 3. The errors represent 90 confidence interval. The evolution of follows the same trend as that observed in the phenomenological spectral modelling (Table 2). The value of varies between and appears slightly steeper than that of phenomenological modelling (Table 2). It may be due to the additional low energy contribution from the reflection component over the diskbb component. However, reflection modelling also shows spectral softening till Epoch 9. The NICER-NuSTAR results suggest that 4U is a low inclination system with varies between . We could not constrain the inclination angle from AstroSat data and freeze it to 40∘.
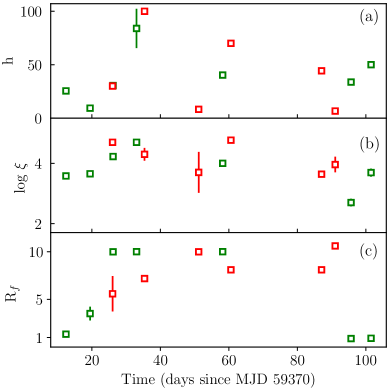
The evolution of few important model parameters (h, log and Rf) are shown in Fig. 6 for better presentation. Simultaneous NICER-NuSTAR pairs and AstroSat observations are marked in green and red colour, respectively. We could not estimate the uncertainty of h in most of the epochs. The evolution of h (Fig. 6a) indicates that the primary source is moving away from the BH till Epoch 6 and then gradually coming closer to the central object. The ionization structure of the disk is established through the parameter log . Its value gradually increases (Fig. 6b) and reaches the maximum around Epoch 10 and then gradually decreases. The high value of log (>3) suggests a highly ionized disc material throughout the outburst. We could estimate iron abundance AFe for Epoch 1, 2, 4 and 5, and it hits the upper limit during the rest of the epochs. Our study reveals an overabundance (3.610 ) of iron in the disk. The reflection fraction Rf is estimated well at the first three and last two epochs only. Fig. 6c suggests that the fraction of primary photons reaching the disk increases till Epoch 9, and it decreases afterwards. The gabs strength shows a similar behaviour found in the phenomenological modelling. We have discussed more on this result in §4.3.
| Epoch | Model | |||||||||||||
| diskbb | relxilllp | gabs | ||||||||||||
| ( | norm | h | norm | line E | strength | |||||||||
| ) | (keV) | () | (deg) | (erg cm s-1) | () | () | (keV) | (keV) | (keV) | |||||
| 1 | 0.80 | |||||||||||||
| 2 | 0.91 | |||||||||||||
| 3 | 1.37 | |||||||||||||
| 4 | 0.83 | |||||||||||||
| 5 | 0.83 | |||||||||||||
| 6 | 1.30 | |||||||||||||
| 7 | 1.44 | |||||||||||||
| 9 | 1.10 | |||||||||||||
| 10 | 1.19 | |||||||||||||
| 13 | 1.11 | |||||||||||||
| 14 | 1.24 | |||||||||||||
| 15 | 1.12 | |||||||||||||
| 16 | 0.87 | |||||||||||||
-
a
a Parameter uncertainty can’t be estimated.
-
b Parameter hits the boundary.
-
f Frozen parameters.
Very recently, the RELXILL model (version v2.2) has undergone some modifications by considering the effect of returning radiation in the calculation of reflected flux. Particularly in relxilllpCp, where the effects of returning radiation, the density profile and ionization gradient of the disk and the velocity of the primary source are also included. However, the velocity of the primary source and the effects of returning radiation are the new parameters added to the relxilllp model. We applied this modified relxilllp model to the broadband NICER-NuSTAR data but could not constrain the source velocity. Also, we tried to estimate the parameters using the v2.2 flavour of relxilllpCp. We fitted all the wideband NICER-NuSTAR observations using the model tbabs(diskbb+relxilllpCp)gabs. But, we could not constrain most of the parameters since the number of free parameters is very large. Therefore, we need to essentially freeze all the new parameters introduced in the updated version, and RELXILL v2.2 does not bring any improvement in the result.
4.3 Absorption Features in the Spectra of 4U 154347
The wideband spectral analysis of 4U reveals the presence of a very strong absorption feature (Fig. 2, Table 2, Table 3) whose strength changes throughout the outburst. We use gabs model to characterize the absorption feature in phenomenological and reflection modelling. The gabs strength estimated from both methods follow the same trend; getting more stronger as the outburst progresses and reaches the maximum value on Epoch 9, then declines gradually.
In general, the absorption features in the spectrum can be due to multiple reasons like the presence of obscuring cloud in the line-of-sight, occultation due to the companion star, strong accretion disk-wind and/or the stellar wind from the companion (Miller et al., 2008; Szostek & Zdziarski, 2008; Koljonen & Tomsick, 2020). We have discarded the chances of absorption due to obscuring cloud in the line-of-sight by fitting the data with the partial covering fraction model pcfabs and found no improvement in the fitting. If the absorption feature is produced by the occultation or stellar wind of the binary companion, the features must show some orbital variations. Precise diagnostic of the orbital variations provide significant insight into the understanding of the nature and origin of the absorption features. Since 4U is a low inclination system (), the expected orbital variation of the absorption feature, if any, will be weak. Therefore, we avoid using multi-instrument data to check the orbital variation of the absorption feature, as the differences in the estimated parameters between instruments may screw up the variation. We use only the NuSTAR observations for this purpose.
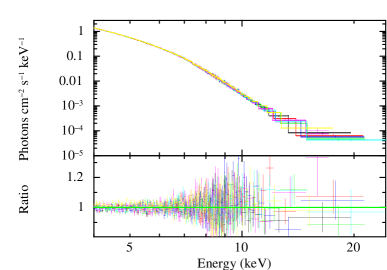
We extracted the spectrum from different patches of GTIs of each NuSTAR observation epoch. Since the GTI-patches have low exposure time, we grouped the spectrum with only 30 counts per bin. Patches with an exposure time less than 500 seconds are merged together before extracting the spectrum. We did a simultaneous joint fitting of all the GTI-patches under each epoch using the model M1. In the joint fitting, all parameters are tied between the patches except gabs strength. The line-of-sight column density, , is frozen at 1022 cm-2 found from broadband NICER-NuSTAR spectral modelling. In Fig. 7, we plot the simultaneous joint fitting of the spectra for Epoch 9, which has 7 patches of GTIs. The black, red, green, blue, cyan, magenta and yellow colours represent them in the ascending order of time.
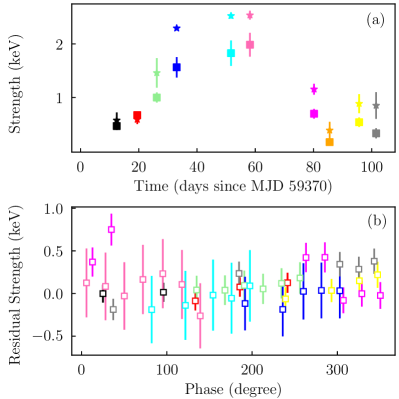
We also fitted all the 10 epochs (Table 1) of NuSTAR observations using the models M1 and M2 discussed before. We calculated the gabs strength (Si) for each NuSTAR epoch using both models. The evolution of Si is shown in Fig. 8a. The colours black, red, green, blue, cyan, pink, magenta, orange, yellow and grey indicate the NuSTAR epochs in chronological order. The gabs strength of NuSTAR data is showing the same trend of wideband spectral data; reaching maximum on Epoch 9 (pink in colour). The absorption strength represented by the square symbol is estimated using the model M1, whereas the same using M2 are denoted by the star symbol. We notice that the value estimated using M2 are marginally higher than the same from M1. This can be the effect of an additional edge component used in the M1 model. Similarly, we estimated the gabs strength (Sp) corresponding to each GTI-patch for a given epoch from the patch-spectra modelling using M1. The residual strength (Sp - Si) is measured for each patches inside an epoch and are plotted against the orbital phase in Fig. 8b. The binary orbital period (P) of 4U is hours (Orosz et al., 1998; Orosz, 2003). The orbital position of each NuSTAR patch has been identified based on the start time (MJD 59382.42) of Epoch 1 as the reference time. For Epoch 12 (data in orange colour in Fig. 8a), the value of Si is unusually low, and the estimated Sp from the patch-spectra modelling of this epoch is not reliable. Therefore, we ignore Epoch 12 from Fig. 8b. The residual varies within keV (except one patch), and we see only a marginal variation (within uncertainties) in strength within an orbit. This implies that the orbital position of the BH and the companion is not responsible for the dynamic nature of the absorption features. In fact, we do not expect such behaviour for a low inclination system.
The X-ray luminosity of the source at the peak (see Epoch 1 in Table 2) of the outburst is extremely high, and it may irradiate (see Lasota (2001) for a review) the outer accretion disk and the companion star. If the irradiation affects the companion star, either a fresh accretion of matter starts at the hot spot or enhances the stellar wind in the companion star. The former may produce multiple triggering in the same outburst event, which has been observed, for example, in GX (Aneesha et al., 2019). If the latter happens, the highly ionized wind material may absorb the X-ray emission from the primary to produce the broad absorption feature. The companion of 4U is an A2V type star with a mass Mc=2.45 M⊙ (Russell et al., 2006) and radius Rc=2.84 R⊙ (Orosz et al., 1998). The escape velocity () of the stellar material from the surface of the companion is calculated as 573 km s-1. The binary separation (a) between the BH and the companion is estimated as 7.18 cm by considering a BH mass, =9.4 M⊙ (Russell et al., 2006) using the relation / 4/ , where is the Gravitational constant. We observe that the stellar wind takes only a few hours to reach the primary. The column density of stellar wind and the ionization state should reduce with the decrease of the X-ray luminosity of the primary. Therefore, we expect that the strength of the broad absorption feature should reduce along with the progress of the outburst. Instead, we observe that the absorption strength enhances and becomes strongest during Epoch 9. Moreover, the estimated stellar wind speed is not sufficient to blue shift the highest ionized lines of Fe XXVI, to produce the observed absorption feature. Therefore, the stellar wind has no role in the dynamic absorption features in the spectra of 4U .
The irradiation of the outer accretion disk enhances the accretion rate; therefore, the outburst source stays in the high luminosity state for a longer duration (King, 1998; Lasota, 2001; Aneesha et al., 2019; Aneesha & Mandal, 2020). This is possibly causing 2021 outburst of 4U to decline very slowly (over 175 days, see Fig. 1). The super Eddington peak luminosity (Epoch 1 in Table 2) of the source can launch strong disk-wind (e.g., King et al. (2015); Muñoz-Darias et al. (2018)). The presence of the accretion disk-wind is more prominent in the soft state of X-ray binaries (Miller et al., 2008; Neilsen & Lee, 2009; Ponti et al., 2012), though disk-winds are not exclusively confined to soft spectral state (Lee et al., 2002). Spectral analysis of 4U (Table 2) suggests that the source was in the HSS during our study. Also, we notice spectral softening happens till Epoch 9 ( day 60) and beyond which spectra gradually become harder (Table 2 Table 3). If the disk-ionized winds are responsible for the absorption features, then the strength of the features would be maximum when the source is softer. Surprisingly the strength of the absorption feature is maximum on day 60 as per our analysis (Fig. 8a), and it is keeps-on decreasing further. The optical depth () evolution (Fig. 4c) also suggests that the absorption column is maximally populated on day 60.
The transition energy of the most ionized line with the highest absorption yield, i.e., Fe XXV and Fe XXVI, are 6.68 keV and 6.97 keV respectively (provided by XSTAR line finding list121212https://heasarc.gsfc.nasa.gov/docs/software/xstar/xstar.html). Assuming the absorption feature (with line E 10 keV) in the NuSTAR spectra is produced due to the absorption of the accretion disk photons by the highly ionized blue shifted disk-wind, the estimated wind speed is reaching 30% of the speed of light to blue shift the Fe XXVI line energy to 10 keV. Such a fast disk-wind has never been observed in X-ray binary systems. In fact, highly ionized wind (say, Fe XXVI) is never detected (Ponti et al., 2012) in BH-XRB systems with low inclination angle; for example, GX , XTE J, 4U , XTE J, GRS etc. Therefore, this detection is the first of its kind for X-ray binaries. However, mildly relativistic disk-wind is not uncommon in quasars and AGNs (Reeves et al., 2009; Tombesi et al., 2015; Hagino et al., 2017). The other difficulty is the width () of the absorption feature, which is as broad as 2 keV on Epoch 9 (Table 2). Known line-broadening processes due to turbulence or scattering will face serious challenges in explaining the line width if it is from a single line. Instead, it is more likely that the broad feature can be produced by combining multiple lines of various ionization states of iron.
The phenomenological spectral fitting of NuSTAR data with model M1 reveals the presence of neutral Fe K absorption edge and the broad ionized absorption features. We calculate the equivalent width (EW), which is a measure of the strength of an absorption line, of both absorption features to find if there exists any connection between these two components. The EW is defined as (Arumugasamy et al., 2018),
| (1) |
The energy dependent function for the gabs component is given by,
| (2) |
where , Eg and are the optical depth, line energy and line width respectively. Similarly, corresponds to the edge component in XSPEC is given by,
| (3) |
where Ee and D are the threshold energy and absorption depth, respectively.
The evolution of EW calculated based on NuSTAR phenomenological modelling is shown in Fig. 9 for both edge (red in colour) and gabs (blue in colour) components. The gabs EW increases till Epoch 9 and then gradually decline, except for Epoch 12 (Fig. 8a) & 13 (Table 2). The implication of this result and the connection between both components (gabs and edge) are discussed in §5.
5 Discussion
The wideband spectral modelling of NICER-NuSTAR and AstroSat data reveals that the inner disc temperature is highest (1.27 keV) on Epoch 1, and it keeps on decreasing during the decay of the outburst (Fig. 4a). The estimated diskbb norm (Table 2, Table 3) suggests a marginal inward movement of the inner disk radius since diskbb norm . However, the decrease in could not prevent the drop in due to the gradual decline in as (Frank et al., 2002). The extreme luminosity in the inner disk may slow down the accretion of matter to the BH. On the other hand, the high accretion disk luminosity (Table 2) can irradiate the outer accretion disk, enhancing the accretion of matter. If most of the accreted matter is released as the disk-wind, the amount of matter actually transfers to the inner disk for falling onto the BH is much less. Therefore, the gradual decline of Tin is due to the reduction of effective infall of matter onto the BH through the inner disk. The source luminosity is completely soft-photons-dominated due to very little fractional Comptonization (covfrac in Table 2), low corona temperature, and steeper photon index (Fig. 4b). Therefore, the source was in the high/soft spectral state during our study, and it was the softest on Epoch 9.
The important parameters for reflection modelling are shown in Table 3 and in Fig. 6. The lamp-post height comes closer to the central object as the source becomes softer. The reflection fraction () increases and hits the boundary when the source is softest. If the value of ionization parameter, log , the fluorescence yield of the highly ionized Fe line (more ionized than Fe XXIII) increases (Matt et al., 1993). The high value of log (Table 3) obtained from reflection modelling suggests a highly ionized accretion disk throughout the outburst. Combining all the factors like extreme luminosity, high log , and an overabundance of Fe (parameter in Table 3) refer to a highly ionized disk-wind having a significant yield of Fe XXV, Fe XXVI etc.
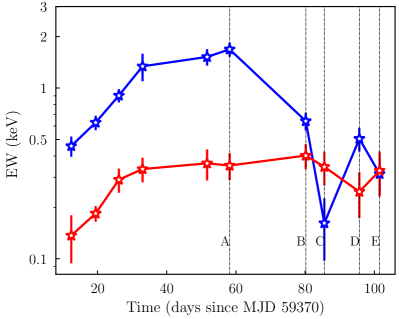
An important characteristic of this source is the presence of a broad, symmetric and dynamic absorption feature in the spectrum keV. We presented various possibilities regarding the origin of this absorption feature in §4.3. Finally, we concluded that the fast moving ionized disk-wind could absorb the primary X-ray photons and produce this broad absorption feature. The phenomenological modelling shows the presence of the neutral Fe K absorption (edge) at keV, originating from the outer part of the accretion disk. The initial steep rise of the EW of the neutral component (red star in Fig. 9) indicates the enhancement of disk matter due to irradiation of the outer disk. Due to the availability of more matter, the radiation pressure of the highly luminous inner part could release more ionized matter. The source enters to the HSS, and the disk-wind gradually becomes very active till Epoch 9 (possibly Epoch 10 also) where the gabs EW is maximum (marked A in Fig. 9) and the disk spectrum is the softest (Fig. 4b). Therefore, the evolution of the ionized EW (blue square in Fig. 9) followed the neutral component till day 60 (Epoch 9). After that, EW of the ionized component declines gradually (AB in Fig. 9) because the disk luminosity has reduced significantly, and a good fraction of inner disk matter has already been lost in the form of wind. The neutral component remains unaffected as it takes a viscous timescale to propagate the same to the outer disk. The NuSTAR data on Epoch 12 reveals a sudden drop of the strength (orange points in Fig. 8a) and EW (marked ‘C’ in Fig. 9) of gabs component. We also notice the same signature in the AstroSat data on Epoch 13, observed after 2 days of the NuSTAR’s Epoch 12 observation; the gabs strength (Table 2) on Epoch 13 is smaller by a few factor compared to the nearby observations. We identify this sudden drop of ionized EW can be due to the evacuation of the inner disk. The huge central luminosity may slow down the accretion onto the central object, and most of the accreted matter is released through disk-wind. Once the disk luminosity reduces, there is a sudden infall of matter onto the BH, leading to an evacuation of the inner disk.
If this interpretation is correct, we expect a relatively harder spectrum due to a significant drop of soft photon flux during Epochs 12 & 13. To characterise this, we calculate the observed flux in keV (soft) and keV (hard) band for NuSTAR and AstroSat data. The AstroSat soft and hard fluxes on Epoch 10 are erg cm-2 s-1 and erg cm-2 s-1 respectively. The drop of AstroSat soft flux on the next observation (Epoch 13) is , whereas the hard flux increases by . This resulted in a relatively harder spectral index (marked by a blue circle in Fig. 4b) on Epoch 13. Similarly, the NuSTAR soft and hard fluxes on Epoch 11 are erg cm-2 s-1 and erg cm-2 s-1 respectively. The drop of NuSTAR soft flux on Epoch 12 is , whereas the hard flux increases by a factor of 2. Therefore, the suddenly enhanced accretion at the inner disk resulted in these dramatic changes in the EW and spectral properties. However, the inner accretion disk recovers over the next 10 days (marked CD) due to the transfer of matter from the outer disk, and the ionized component returns back to a gradual declination. Interestingly, the neutral component (or the outer disk) follows the same trend as the ionized component, namely the decline and refilling signature (red stars between BE), with a delay of the typical viscous timescale of days.
6 Summary and Conclusion
We study the wideband spectral properties of the 2021 outburst of 4U . The MAXI/GSC lightcurve (Fig. 1) shows that the outburst rises over 9 days followed by a slow decay over 175 days. We use multi-instruments data (NICER, NuSTAR and AstroSat) for simultaneous broadband spectral study over a period of 100 days from MJD 59370. We have performed the spectral study using the phenomenological model M1 and reflection model M2. The major findings from our study are summarized below:
-
•
The source generally remains very bright during this outburst with a super Eddington peak luminosity on Epoch 1 (Table 2).
-
•
The source was in the HSS during our study, with a steep photon index (Fig. 4b) due to a very small fraction () of inverse-Comptonized photons and low corona temperature.
-
•
The reflection modelling reveals that the inclination of the system is between 3240∘.
-
•
The extreme luminosity, high ionization (log > 3) and overabundance of iron ( ) indicate the presence of disk-wind with a significant yield of highly ionized iron species.
-
•
Presence of a broad, dynamic absorption feature at keV is observed throughout our study. This detection is the first of its kind for X-ray binaries. We propose that this feature is due to the absorption of the accretion disk photons by the highly ionized, blue shifted disk-wind. The strength of the ionized absorption feature (Table 2 & Table 3) increases between Epoch 1 to Epoch 9 as the disk-wind column density is expected to increase with the spectral softening of the source.
-
•
The observed line energy of the absorption feature suggests an estimated wind speed of nearly 30 of the speed of light to blue shift the most ionized line with the highest absorption yield like Fe XXVI. Hence it would become the first X-ray binary source to show a highly relativistic disk-wind.
-
•
The initial steep rise of the neutral component EW (red star in Fig. 9) is an indication of the enhancement of disk matter due to irradiation of the outer disk. It enhances the accretion rate and hence the source remains in the high luminosity state and decays very slowly.
-
•
The evolution of EW (Fig. 9) of the neutral absorption component (edge) and the same of the ionized component (gabs), follow each other with a delay of the typical viscous timescale of days.
-
•
An evacuation of the inner accretion disk is observed during Epoch . This event leaves a signature of the drop in the soft photon flux and an enhancement of hard flux. Therefore, the spectrum becomes relatively harder (blue circle in Fig. 4b).
Finally, this study suggests that accretion dynamics of 4U during 2021 outburst is regulated by the disk-wind.
Acknowledgements
The authors wish to thank the anonymous reviewer for the insightful suggestions which significantly improved the quality of the publication. This work uses data from the NICER and NuSTAR mission by the National Aeronautics and Space Administration. This work also has used data from the AstroSat mission of the ISRO archived at the Indian Space Science Data Centre (ISSDC). The work has been performed utilizing the calibration databases, and auxiliary analysis tools developed, maintained and distributed by AstroSat-SXT team with members from various institutions in India and abroad. The High Energy Astrophysics Science Archive Research Center (HEASARC), which provides the software and NASA’s Astrophysics Data System Bibliographic Services are also acknowledged. BGR acknowledges the financial support of ISRO under AstroSat archival data utilization program Sanction order No. DS-2B-13013(2)/13/2019-Sec.2. AN thanks GH, SAG, DD, PDMSA, and Director, URSC for the support to carry out this research.
Data Availability
The data from NICER and NuSTAR underlying this article are available in HEASARC, at https://heasarc.gsfc.nasa.gov/docs/archive.html. AstroSat data archive is available at https://astrobrowse.issdc.gov.in/astro_archive/archive/Home.jsp.
References
- Agrawal et al. (2017) Agrawal P. C., et al., 2017, Journal of Astrophysics and Astronomy, 38, 30
- Aneesha & Mandal (2020) Aneesha U., Mandal S., 2020, A&A, 637, A47
- Aneesha et al. (2019) Aneesha U., Mandal S., Sreehari H., 2019, MNRAS, 486, 2705
- Antia et al. (2022) Antia H. M., Agrawal P. C., Katoch T., Manchanda R. K., Mukerjee K., Shah P., 2022, ApJS, 260, 40
- Arumugasamy et al. (2018) Arumugasamy P., Kargaltsev O., Posselt B., Pavlov G. G., Hare J., 2018, ApJ, 869, 97
- Athulya et al. (2022) Athulya M. P., Radhika D., Agrawal V. K., Ravishankar B. T., Naik S., Mandal S., Nandi A., 2022, MNRAS, 510, 3019
- Baby et al. (2020) Baby B. E., Agrawal V. K., Ramadevi M. C., Katoch T., Antia H. M., Mandal S., Nandi A., 2020, MNRAS, 497, 1197
- Baby et al. (2021) Baby B. E., Bhuvana G. R., Radhika D., Katoch T., Mandal S., Nandi A., 2021, MNRAS, 508, 2447
- Barret & Olive (2002) Barret D., Olive J.-F., 2002, ApJ, 576, 391
- Basko et al. (1974) Basko M. M., Sunyaev R. A., Titarchuk L. G., 1974, A&A, 31, 249
- Bhuvana et al. (2021) Bhuvana G. R., Radhika D., Agrawal V. K., Mandal S., Nandi A., 2021, MNRAS, 501, 5457
- Bhuvana et al. (2022) Bhuvana G. R., Radhika D., Nandi A., 2022, Advances in Space Research, 69, 483
- Burhop (1952) Burhop E. H. S., 1952, The Auger effect and other radiationless transition. Cambridge University Press
- Chakrabarti & Mandal (2006) Chakrabarti S. K., Mandal S., 2006, ApJ, 642, L49
- Chakrabarti & Titarchuk (1995) Chakrabarti S., Titarchuk L. G., 1995, ApJ, 455, 623
- Dauser et al. (2016) Dauser T., García J., Walton D. J., Eikmann W., Kallman T., McClintock J., Wilms J., 2016, A&A, 590, A76
- Debnath et al. (2015) Debnath D., Molla A. A., Chakrabarti S. K., Mondal S., 2015, ApJ, 803, 59
- Di Salvo et al. (2005) Di Salvo T., Iaria R., Méndez M., Burderi L., Lavagetto G., Robba N. R., Stella L., van der Klis M., 2005, ApJ, 623, L121
- Dong et al. (2020) Dong Y., García J. A., Steiner J. F., Gou L., 2020, MNRAS, 493, 4409
- Ebisawa (1997) Ebisawa K., 1997, in Makino F., Mitsuda K., eds, X-Ray Imaging and Spectroscopy of Cosmic Hot Plasmas. p. 427
- Ebisawa et al. (1994) Ebisawa K., et al., 1994, PASJ, 46, 375
- Fabian et al. (1989) Fabian A. C., Rees M. J., Stella L., White N. E., 1989, MNRAS, 238, 729
- Fabian et al. (2000) Fabian A. C., Iwasawa K., Reynolds C. S., Young A. J., 2000, PASP, 112, 1145
- Fender et al. (1999) Fender R. P., Garrington S. T., McKay D. J., Muxlow T. W. B., Pooley G. G., Spencer R. E., Stirling A. M., Waltman E. B., 1999, MNRAS, 304, 865
- Fender et al. (2004) Fender R. P., Belloni T. M., Gallo E., 2004, MNRAS, 355, 1105
- Fender et al. (2010) Fender R. P., Gallo E., Russell D., 2010, MNRAS, 406, 1425
- Frank et al. (1987) Frank J., King A. R., Lasota J. P., 1987, A&A, 178, 137
- Frank et al. (2002) Frank J., King A., Raine D., 2002, Accretion Power in Astrophysics, 3 edn. Cambridge University Press, doi:10.1017/CBO9781139164245
- García et al. (2019) García J. A., et al., 2019, ApJ, 885, 48
- Garg et al. (2021) Garg A., et al., 2021, The Astronomer’s Telegram, 14749, 1
- Gendreau et al. (2016) Gendreau K. C., et al., 2016, in den Herder J.-W. A., Takahashi T., Bautz M., eds, Society of Photo-Optical Instrumentation Engineers (SPIE) Conference Series Vol. 9905, Space Telescopes and Instrumentation 2016: Ultraviolet to Gamma Ray. p. 99051H, doi:10.1117/12.2231304
- Hagino et al. (2017) Hagino K., Done C., Odaka H., Watanabe S., Takahashi T., 2017, MNRAS, 468, 1442
- Harmon et al. (1992) Harmon B. A., Wilson R. B., Finger M. H., Paciesas W. S., Rubin B. C., Fishman G. J., 1992, IAU Circ., 5504, 1
- Harrison et al. (2013) Harrison F. A., et al., 2013, ApJ, 770, 103
- Homan & Belloni (2005) Homan J., Belloni T., 2005, Ap&SS, 300, 107
- Homan et al. (2001) Homan J., Wijnands R., van der Klis M., Belloni T., van Paradijs J., Klein-Wolt M., Fender R., Méndez M., 2001, ApJS, 132, 377
- Iyer et al. (2015) Iyer N., Nandi A., Mandal S., 2015, ApJ, 807, 108
- Jonker & Nelemans (2004) Jonker P. G., Nelemans G., 2004, MNRAS, 354, 355
- Katoch et al. (2021) Katoch T., Baby B. E., Nandi A., Agrawal V. K., Antia H. M., Mukerjee K., 2021, MNRAS, 501, 6123
- King (1998) King A. R., 1998, MNRAS, 296, L45
- King et al. (2014) King A. L., et al., 2014, ApJ, 784, L2
- King et al. (2015) King A. L., Miller J. M., Raymond J., Reynolds M. T., Morningstar W., 2015, ApJ, 813, L37
- Kitamoto et al. (1984) Kitamoto S., Miyamoto S., Tsunemi H., Makishima K., Nakagawa M., 1984, PASJ, 36, 799
- Koljonen & Tomsick (2020) Koljonen K. I. I., Tomsick J. A., 2020, A&A, 639, A13
- Kotani et al. (1997) Kotani T., et al., 1997, in Dermer C. D., Strickman M. S., Kurfess J. D., eds, American Institute of Physics Conference Series Vol. 410, Proceedings of the Fourth Compton Symposium. pp 922–926, doi:10.1063/1.53963
- Kotani et al. (2000) Kotani T., Ebisawa K., Dotani T., Inoue H., Nagase F., Tanaka Y., Ueda Y., 2000, ApJ, 539, 413
- Kuulkers et al. (1998) Kuulkers E., Wijnands R., Belloni T., Méndez M., van der Klis M., van Paradijs J., 1998, ApJ, 494, 753
- Lasota (2001) Lasota J.-P., 2001, New Astron. Rev., 45, 449
- Leahy (1997) Leahy D. A., 1997, MNRAS, 287, 622
- Lee et al. (2002) Lee J. C., Reynolds C. S., Remillard R., Schulz N. S., Blackman E. G., Fabian A. C., 2002, ApJ, 567, 1102
- Li et al. (2005) Li L.-X., Zimmerman E. R., Narayan R., McClintock J. E., 2005, ApJS, 157, 335
- Matilsky et al. (1972) Matilsky T. A., Giacconi R., Gursky H., Kellogg E. M., Tananbaum H. D., 1972, ApJ, 174, L53
- Matt et al. (1993) Matt G., Fabian A. C., Ross R. R., 1993, MNRAS, 262, 179
- Miller et al. (2008) Miller J. M., Raymond J., Reynolds C. S., Fabian A. C., Kallman T. R., Homan J., 2008, ApJ, 680, 1359
- Miller et al. (2009) Miller J. M., Reynolds C. S., Fabian A. C., Miniutti G., Gallo L. C., 2009, ApJ, 697, 900
- Miller et al. (2012) Miller J. M., et al., 2012, ApJ, 759, L6
- Miller et al. (2013) Miller J. M., et al., 2013, ApJ, 775, L45
- Mitsuda et al. (1984) Mitsuda K., et al., 1984, PASJ, 36, 741
- Morningstar & Miller (2014) Morningstar W. R., Miller J. M., 2014, ApJ, 793, L33
- Muñoz-Darias et al. (2016) Muñoz-Darias T., et al., 2016, Nature, 534, 75
- Muñoz-Darias et al. (2018) Muñoz-Darias T., Torres M. A. P., Garcia M. R., 2018, MNRAS, 479, 3987
- Nandi et al. (2012) Nandi A., Debnath D., Mandal S., Chakrabarti S. K., 2012, A&A, 542, A56
- Negoro et al. (2021a) Negoro H., et al., 2021a, The Astronomer’s Telegram, 14701, 1
- Negoro et al. (2021b) Negoro H., et al., 2021b, The Astronomer’s Telegram, 14708, 1
- Neilsen (2013) Neilsen J., 2013, Advances in Space Research, 52, 732
- Neilsen & Lee (2009) Neilsen J., Lee J. C., 2009, Nature, 458, 481
- Orosz (2003) Orosz J. A., 2003, in van der Hucht K., Herrero A., Esteban C., eds, Vol. 212, A Massive Star Odyssey: From Main Sequence to Supernova. p. 365 (arXiv:astro-ph/0209041)
- Orosz et al. (1998) Orosz J. A., Jain R. K., Bailyn C. D., McClintock J. E., Remillard R. A., 1998, ApJ, 499, 375
- Park et al. (2004) Park S. Q., et al., 2004, ApJ, 610, 378
- Pedersen (1983) Pedersen H., 1983, The Messenger, 34, 21
- Petrucci et al. (2001) Petrucci P. O., Merloni A., Fabian A., Haardt F., Gallo E., 2001, MNRAS, 328, 501
- Ponti et al. (2012) Ponti G., Fender R. P., Begelman M. C., Dunn R. J. H., Neilsen J., Coriat M., 2012, MNRAS, 422, L11
- Poutanen & Coppi (1998) Poutanen J., Coppi P. S., 1998, Physica Scripta Volume T, 77, 57
- Poutanen et al. (2018) Poutanen J., Veledina A., Zdziarski A. A., 2018, A&A, 614, A79
- Prabhakar et al. (2022) Prabhakar G., Mandal S., Athulya M. P., Nandi A., 2022, MNRAS, 514, 6102
- Radhika & Nandi (2014) Radhika D., Nandi A., 2014, Advances in Space Research, 54, 1678
- Radhika et al. (2016) Radhika D., Nandi A., Agrawal V. K., Seetha S., 2016, MNRAS, 460, 4403
- Reeves et al. (2009) Reeves J. N., et al., 2009, ApJ, 701, 493
- Remillard & McClintock (2006) Remillard R. A., McClintock J. E., 2006, ARA&A, 44, 49
- Remillard et al. (2021) Remillard R. A., et al., 2021, arXiv e-prints, p. arXiv:2105.09901
- Russell et al. (2006) Russell D. M., Fender R. P., Hynes R. I., Brocksopp C., Homan J., Jonker P. G., Buxton M. M., 2006, MNRAS, 371, 1334
- Russell et al. (2020) Russell D. M., Casella P., Kalemci E., Vahdat Motlagh A., Saikia P., Pirbhoy S. F., Maitra D., 2020, MNRAS, 495, 182
- Shafee et al. (2006) Shafee R., McClintock J. E., Narayan R., Davis S. W., Li L.-X., Remillard R. A., 2006, ApJ, 636, L113
- Shakura & Sunyaev (1973) Shakura N. I., Sunyaev R. A., 1973, A&A, 500, 33
- Shidatsu et al. (2013) Shidatsu M., et al., 2013, ApJ, 779, 26
- Singh et al. (2021) Singh K. P., Stewart G., Chandra S., Dewangan G. C., Bhattacharyya S., Kamble N. S., Vishwakarma S., Koyande J. G., 2021, Journal of Astrophysics and Astronomy, 42, 77
- Sreehari et al. (2019) Sreehari H., Ravishankar B. T., Iyer N., Agrawal V. K., Katoch T. B., Mandal S., Nandi A., 2019, MNRAS, 487, 928
- Sunyaev & Titarchuk (1980) Sunyaev R. A., Titarchuk L. G., 1980, A&A, 500, 167
- Sunyaev & Titarchuk (1985) Sunyaev R. A., Titarchuk L. G., 1985, A&A, 143, 374
- Szostek & Zdziarski (2008) Szostek A., Zdziarski A. A., 2008, MNRAS, 386, 593
- Tombesi et al. (2015) Tombesi F., Meléndez M., Veilleux S., Reeves J. N., González-Alfonso E., Reynolds C. S., 2015, Nature, 519, 436
- Ueda et al. (1998) Ueda Y., Inoue H., Tanaka Y., Ebisawa K., Nagase F., Kotani T., Gehrels N., 1998, ApJ, 492, 782
- White et al. (1986) White N. E., Peacock A., Hasinger G., Mason K. O., Manzo G., Taylor B. G., Branduardi-Raymont G., 1986, MNRAS, 218, 129
- Wilms et al. (2000) Wilms J., Allen A., McCray R., 2000, ApJ, 542, 914
- Xu et al. (2018) Xu Y., et al., 2018, ApJ, 865, 18
- Yadav et al. (2016) Yadav J. S., et al., 2016, ApJ, 833, 27
- Zdziarski et al. (1994) Zdziarski A. A., Fabian A. C., Nandra K., Celotti A., Rees M. J., Done C., Coppi P. S., Madejski G. M., 1994, MNRAS, 269, L55
- Zdziarski et al. (1996) Zdziarski A. A., Johnson W. N., Magdziarz P., 1996, MNRAS, 283, 193
- Zdziarski et al. (2020) Zdziarski A. A., Szanecki M., Poutanen J., Gierliński M., Biernacki P., 2020, MNRAS, 492, 5234