2023 \newcitessuppMethods References
1]\orgdivInstitute for Astronomy, School of Physics & Astronomy, \orgnameUniversity of Edinburgh, Royal Observatory, \orgaddress\cityEdinburgh, \postcodeEH9 3HJ, \countryUK
2]\orgdivSchool of Physics & Astronomy, \orgnameUniversity of St Andrews, \orgaddress\streetNorth Haugh, \citySt Andrews, \postcodeKY16 9SS, \countryUK
3]\orgdivDepartment of Astronomy and Astrophysics, \orgnameUCO/Lick Observatory, University of California, \orgaddress\citySanta Cruz, \postcodeCA 95064, \countryUSA
4]\orgdivDepartment of Physics and Astronomy (DIFA), \orgnameUniversity of Bologna, \orgaddress\postcodeVia Gobetti 93/2, I-40129, \cityBologna, \countryItaly
5]\orgdivINAF, \orgnameOsservatorio di Astrofisica e Scienza dello Spazio, \orgaddress\postcodeVia Piero Gobetti 93/3, I-40129, \cityBologna, \countryItaly
A massive quiescent galaxy at redshift 4.658
The extremely rapid assembly of the earliest galaxies during the first billion years of cosmic history is a major challenge for our understanding of galaxy formation physics Dunlop1996 ; Cimatti2004 ; Kriek2016 ; Schreiber2018 ; Girelli2019 . The advent of JWST has exacerbated this issue by confirming the existence of galaxies in significant numbers as early as the first few hundred million years Labbe2022 ; Donnan2022 ; Carnall2023b . Perhaps even more surprisingly, in some galaxies, this initial highly efficient star formation rapidly shuts down, or quenches, giving rise to massive quiescent galaxies as little as 1.5 billion years after the Big Bang Glazebrook2017 ; Valentino2020 , however, due to their faintness and red colour, it has proven extremely challenging to learn about these extreme quiescent galaxies, or to confirm whether any exist at earlier times. Here we report the spectroscopic confirmation of a massive quiescent galaxy, GS-9209, at redshift, , just 1.25 billion years after the Big Bang, using JWST NIRSpec. From these data we infer a stellar mass of , which formed over a Myr period before this galaxy quenched its star formation activity at , when the Universe was million years old. This galaxy is both a likely descendent of the highest-redshift submillimetre galaxies and quasars, and a likely progenitor for the dense, ancient cores of the most massive local galaxies.
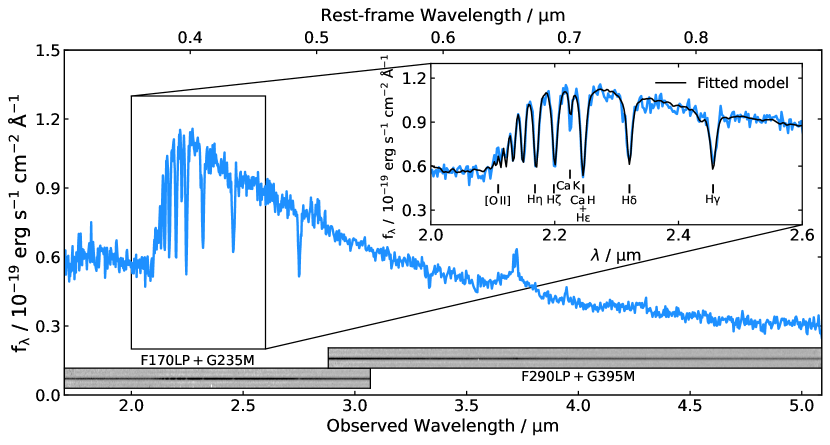
During the past 5 years, several studies have identified GS-9209 as a candidate high-redshift massive quiescent galaxy Merlin2018 ; Carnall2020 , based on its blue colours at wavelengths, m and non-detection at millimetre wavelengths Santini2019 . GS-9209 is also not detected in X-rays Luo2017 , at radio wavelengths Bonzini2013 , or at m Dunlop2007 . The faint, red nature of the source (with magnitudes and ) means that near-infrared spectroscopy with ground-based instrumentation is prohibitively expensive. The JWST NIRSpec data, shown in Figure 1, reveal a full suite of extremely deep Balmer absorption features, with a H equivalent width (EW), as measured by the H Lick index, of Å, comparable to the most extreme values observed in the local Universe Kauffmann2003 . These spectral features strongly indicate this galaxy has undergone a sharp decline in star-formation rate (SFR) during the preceding few hundred Myr.
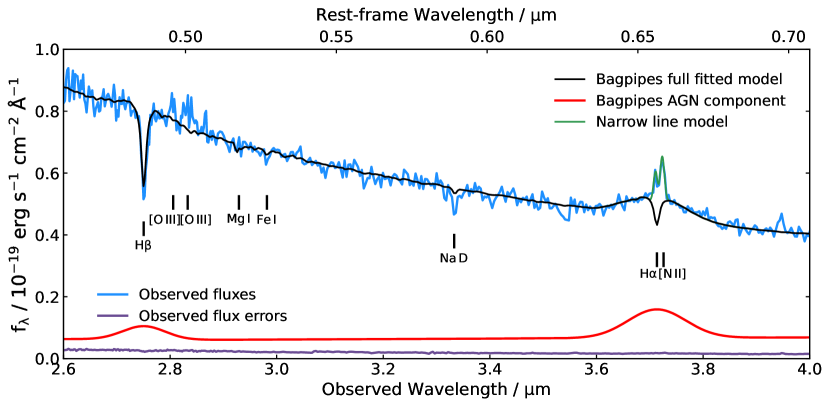
The spectrum exhibits only the merest suspicion of [O ii] 3727 Å and [O iii] 4959Å, 5007 Å emission, and no apparent infilling of H or any of the higher-order Balmer absorption lines. However, as can be seen in Figure 2, both H and [Nii] 6584 Å are clearly albeit weakly detected in emission, with H also exhibiting an obvious broad component. This broad component, along with the relative strength of [N ii] compared with the narrow H line, indicate the presence of an accreting supermassive black hole: an active galactic nucleus (AGN). However, the extreme EWs of the observed Balmer absorption features indicate that the continuum emission must be strongly dominated by the stellar component.
To measure the stellar population properties of GS-9209, we perform full spectrophotometric fitting using the Bagpipes code Carnall2018 (see Methods). Briefly, we first mask the wavelengths corresponding to [O ii], [O iii], narrow H and [N ii], due to likely AGN contributions. We then fit a 22-parameter model for the stellar, dust, nebular and AGN components, as well as spectrophotometric calibration, to the spectroscopic data in combination with multi-wavelength photometry. Throughout the paper we report only statistical uncertainties on fitted parameters. It should be noted however that systematic uncertainties in galaxy spectral energy distribution analyses can be significantly larger Carnall2019a ; Leja2019a ; Pacifici2023 . We investigate the effect of our choice of star-formation history (SFH) model in the Methods section.
The resulting posterior median model is shown in black in Figs 1 and 2. We obtain a stellar mass of log, under the assumption of a Kroupa initial mass function (IMF) Kroupa2001 . We additionally recover a very low level of dust attenuation, with . The SFR we measure averaged over the past 100 Myr is consistent with zero, with a very stringent upper bound, though this is largely a result of our chosen SFH parameterisation Carnall2019a . We provide a detailed discussion of the SFR of GS-9209 in Methods.
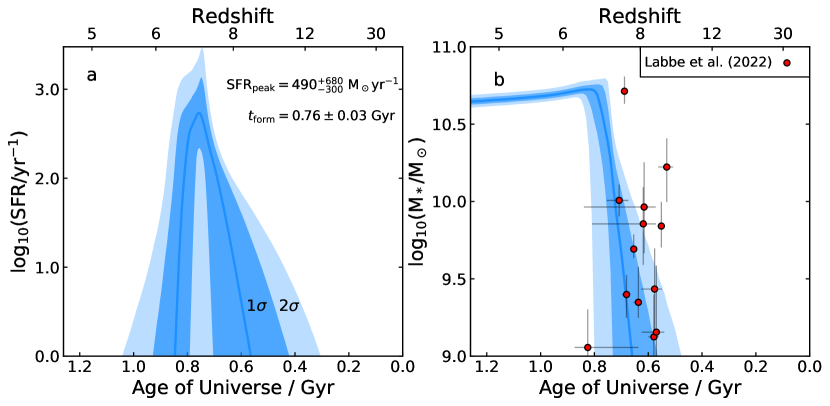
The SFH we recover is shown in Figure 3. We find that GS-9209 formed its stellar population largely during a Myr period, from around Myr after the Big Bang (). We recover a mass-weighted mean formation time, Gyr after the Big Bang, corresponding to a formation redshift, . This is the redshift at which GS-9209 would have had half its current stellar mass, approximately log. We find that GS-9209 quenched (which we define as the time at which its sSFR fell below 0.2 divided by the Hubble time, e.g., Pacifici2016 ) at time Gyr after the Big Bang, corresponding to a quenching redshift, .
Our model predicts that the peak historical SFR for GS-9209 (at approximately ) was within the range SFR M⊙ yr-1. This is similar to the SFRs of bright submillimetre galaxies (SMGs). The number density of SMGs with SFR M⊙ yr-1 at has been estimated to be Mpc-3 Michalowski2017 . Extrapolation then suggests that the SMG number density at is Mpc-3, which equates to SMG at over the square arcmin area from which GS-9209 and one other quiescent galaxy were selected Carnall2020 . This broadly consistent number density suggests it is entirely plausible that GS-9209 went through a SMG phase at , shortly before quenching.
In panel b of Figure 3, we show the positions of the massive, high-redshift galaxy candidates recently reported by Labbe2022 in the first imaging release from the JWST CEERS survey. The positions of these galaxies are broadly consistent with the SFH of GS-9209 at . It should however be noted that, as previously discussed, GS-9209 was selected as one of only two robustly identified massive quiescent galaxies in an area roughly 10 times the size of the initial CEERS imaging area Carnall2020 . It therefore seems unlikely that a large fraction of the candidates reported by Labbe2022 will evolve in a similar way to GS-9209 over the redshift interval from .
From our Bagpipes full spectral fit, we measure an observed broad H flux of erg s-1 cm-2 and full width at half maximum (FWHM) of km s-1 in the rest frame. This line width, whilst very broad, is consistent with rest-frame UV broad line widths measured for some quasars (e.g., Chehade2018 ; Onoue2019 ).
As visualised in Figure 2, we fit Gaussian components to the narrow H and [N ii] lines following subtraction of our best-fitting Bagpipes model (see Methods). We obtain a H narrow-line flux of erg s-1 cm-2 and a [N ii] flux of erg s-1 cm-2, giving a line ratio of log10([N ii]/H. This line ratio is significantly higher than would be expected as a result of ongoing star formation, and is consistent with excitation due to an AGN or shocks resulting from galactic outflows Kewley2013 . Such outflows are commonly observed in post-starburst galaxies at Maltby2019 . We discuss what can be learned about the star-formation rate of GS-9209 from the observed H flux in Methods.
We estimate the black-hole mass for GS-9209, , from our combined H flux and broad-line width, using the relation presented in Equation 6 of Greene2005 , obtaining logM. From our Bagpipes full spectral fit, we infer a stellar velocity dispersion, km s-1 for GS-9209, after correcting for the intrinsic dispersion of our template set, as well as instrumental dispersion. Given this measurement, the relationship between velocity dispersion and black-hole mass presented by Kormendy2013 predicts logM.
Given the broad agreement between these estimators, it seems reasonable to conclude that GS-9209 contains a supermassive black hole with a mass of approximately half a billion to a billion Solar masses. It is interesting to note that this is times the black-hole mass that would be expected given the stellar mass of the galaxy, assuming this is equivalent to the bulge mass. This is consistent with the observed increase in the average black-hole to bulge mass ratio for massive galaxies from McLure2006 . The large amount of historical AGN accretion implied by this significant black hole mass suggests that AGN feedback may have been responsible for quenching this galaxy Maiolino2012 .
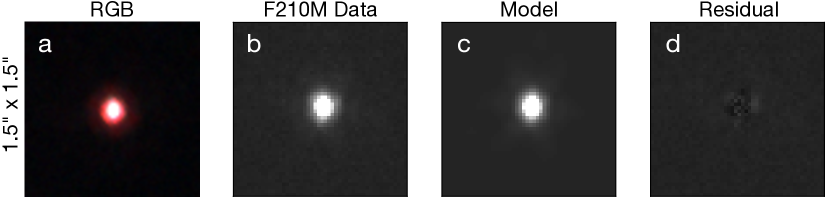
GS-9209 is an extremely compact source, which is only marginally resolved in the highest-resolution available imaging data. We measure the size of GS-9209 using newly available JWST NIRCam F210M-band imaging, which has a FWHM of (see Methods). Accounting for the AGN point-source contribution, we measure an effective radius, for the stellar component of GS-9209, along with a Sérsic index, . At , this corresponds to parsecs. This is consistent with previous measurements by the CANDELS/3DHST team vanderwel2014 , and is dex below the mean relationship between and stellar mass for quiescent galaxies at vanderwel2014 ; Hamadouche2022 . This is interesting given that post-starburst galaxies are known to be more compact than is typical for the wider quiescent population Almaini2017 . We calculate a stellar-mass surface density within of logM⊙ kpc, consistent with the densest stellar systems in the Universe Hopkins2010 . We show the F210M data for GS-9209, along with our posterior-median model in Figure 4.
We estimate the dynamical mass using our size and velocity dispersion measurements (e.g., Maltby2019 ), obtaining a value of logM. This is dex lower than the stellar mass we measure. As GS-9209 is only marginally resolved, even in JWST imaging data, and due to the presence of the AGN component, it is plausible that our measured may be subject to systematic uncertainties. Furthermore, since the pixel scale of NIRSpec is 0.1′′, our velocity dispersion measurement may not accurately represent the central velocity dispersion, leading to an underestimated dynamical mass. It should also be noted that the stellar mass we measure is strongly dependent on our assumed IMF. A final, intriguing possibility would be a high level of rotational support in GS-9209, as has been observed for quiescent galaxies at newman2018 . Unfortunately, the extremely compact nature of the source makes any attempt at resolved studies extremely challenging, even with the JWST NIRSpec integral field unit. Resolved kinematics for this galaxy would be a clear use case for the High Angular Resolution Monolithic Optical and Near-infrared Integral field spectrograph (HARMONI) planned for the Extremely Large Telescope (ELT).
GS-9209 demonstrates unambiguously that massive galaxy formation was already well underway within the first billion years of cosmic history and that the earliest onset of galaxy quenching was no later than Myr after the Big Bang. Based on the properties we measure, GS-9209 seems likely to be associated with the most extreme galaxy populations currently known at , such as the highest-redshift submillimetre galaxies and quasars (e.g., Decarli2017 ; Onoue2019 ; Riechers2021 ). GS-9209 and similar objects (e.g., Carnall2023b ) are also likely progenitors for the dense, ancient cores of the most massive galaxies in the local Universe.
References
- (1) Dunlop, J. et al. A 3.5-Gyr-old galaxy at redshift 1.55. Nature 381, 581–584 (1996).
- (2) Cimatti, A. et al. Old galaxies in the young Universe. Nature 430, 184–187 (2004).
- (3) Kriek, M. et al. A massive, quiescent, population II galaxy at a redshift of 2.1. Nature 540, 248–251 (2016).
- (4) Schreiber, C. et al. Near infrared spectroscopy and star-formation histories of quiescent galaxies. A&A 618, A85 (2018).
- (5) Girelli, G., Bolzonella, M. & Cimatti, A. Massive and old quiescent galaxies at high redshift. A&A 632, A80 (2019).
- (6) Labbe, I. et al. A very early onset of massive galaxy formation. arXiv e-prints arXiv:2207.12446 (2022).
- (7) Donnan, C. T. et al. The evolution of the galaxy UV luminosity function at redshifts from deep JWST and ground-based near-infrared imaging. MNRAS 518, 6011–6040 (2023).
- (8) Carnall, A. C. et al. A surprising abundance of massive quiescent galaxies at in the first data from JWST CEERS. MNRAS 520, 3974–3985 (2023).
- (9) Glazebrook, K. et al. A massive, quiescent galaxy at a redshift of 3.717. Nature 544, 71–74 (2017).
- (10) Valentino, F. et al. Quiescent Galaxies 1.5 Billion Years after the Big Bang and Their Progenitors. ApJ 889, 93 (2020).
- (11) Merlin, E. et al. Chasing passive galaxies in the early Universe: a critical analysis in CANDELS GOODS-South. MNRAS 473, 2098–2123 (2018).
- (12) Carnall, A. C. et al. Timing the earliest quenching events with a robust sample of massive quiescent galaxies at 2 z 5. MNRAS 496, 695–707 (2020).
- (13) Santini, P. et al. Passive galaxies in the early Universe: ALMA confirmation of candidates in the CANDELS GOODS-South field. MNRAS 486, 560–569 (2019).
- (14) Luo, B. et al. The Chandra Deep Field-South Survey: 7 Ms Source Catalogs. Astrophys. J. Suppl. Ser. 228, 2 (2017).
- (15) Bonzini, M. et al. The sub-mJy radio sky in the Extended Chandra Deep Field-South: source population. MNRAS 436, 3759–3771 (2013).
- (16) Dunlop, J. et al. A Spitzer Public Legacy survey of the UKIDSS Ultra Deep Survey. Spitzer Proposal (2007).
- (17) Kauffmann, G. et al. Stellar masses and star formation histories for 105 galaxies from the Sloan Digital Sky Survey. MNRAS 341, 33–53 (2003).
- (18) Carnall, A. C., McLure, R. J., Dunlop, J. S. & Davé, R. Inferring the star formation histories of massive quiescent galaxies with BAGPIPES: evidence for multiple quenching mechanisms. MNRAS 480, 4379–4401 (2018).
- (19) Carnall, A. C. et al. How to Measure Galaxy Star Formation Histories. I. Parametric Models. ApJ 873, 44 (2019).
- (20) Leja, J., Carnall, A. C., Johnson, B. D., Conroy, C. & Speagle, J. S. How to Measure Galaxy Star Formation Histories. II. Nonparametric Models. ApJ 876, 3 (2019).
- (21) Pacifici, C. et al. The Art of Measuring Physical Parameters in Galaxies: A Critical Assessment of Spectral Energy Distribution Fitting Techniques. ApJ 944, 141 (2023).
- (22) Kroupa, P. On the variation of the initial mass function. MNRAS 322, 231–246 (2001).
- (23) Pacifici, C. et al. The Evolution of Star Formation Histories of Quiescent Galaxies. ApJ 832, 79 (2016).
- (24) Michałowski, M. J. et al. The SCUBA-2 Cosmology Legacy Survey: the nature of bright submm galaxies from 2 deg2 of 850-m imaging. MNRAS 469, 492–515 (2017).
- (25) Chehade, B. et al. Two more, bright, quasars from VST ATLAS and WISE. MNRAS 478, 1649–1659 (2018).
- (26) Onoue, M. et al. Subaru High-z Exploration of Low-luminosity Quasars (SHELLQs). VI. Black Hole Mass Measurements of Six Quasars at . ApJ 880, 77 (2019).
- (27) Kewley, L. J. et al. Theoretical Evolution of Optical Strong Lines across Cosmic Time. ApJ 774, 100 (2013).
- (28) Maltby, D. T. et al. High-velocity outflows in massive post-starburst galaxies at . MNRAS 2140 (2019).
- (29) Greene, J. E. & Ho, L. C. Estimating Black Hole Masses in Active Galaxies Using the H Emission Line. ApJ 630, 122–129 (2005).
- (30) Kormendy, J. & Ho, L. C. Coevolution (Or Not) of Supermassive Black Holes and Host Galaxies. ARA&A 51, 511–653 (2013).
- (31) McLure, R. J., Jarvis, M. J., Targett, T. A., Dunlop, J. S. & Best, P. N. On the evolution of the black hole: spheroid mass ratio. MNRAS 368, 1395–1403 (2006).
- (32) Maiolino, R. et al. Evidence of strong quasar feedback in the early Universe. MNRAS 425, L66–L70 (2012).
- (33) van der Wel, A. et al. 3D-HST+CANDELS: The Evolution of the Galaxy Size-Mass Distribution since z = 3. ApJ 788, 28 (2014).
- (34) Hamadouche, M. L. et al. A combined VANDELS and LEGA-C study: the evolution of quiescent galaxy size, stellar mass, and age from z = 0.6 to z = 1.3. MNRAS 512, 1262–1274 (2022).
- (35) Almaini, O. et al. Massive post-starburst galaxies at z 1 are compact proto-spheroids. MNRAS 472, 1401–1412 (2017).
- (36) Hopkins, P. F., Murray, N., Quataert, E. & Thompson, T. A. A maximum stellar surface density in dense stellar systems. MNRAS 401, L19–L23 (2010).
- (37) Newman, A. B., Belli, S., Ellis, R. S. & Patel, S. G. Resolving Quiescent Galaxies at z 2. II. Direct Measures of Rotational Support. ApJ 862, 126 (2018).
- (38) Decarli, R. et al. Rapidly star-forming galaxies adjacent to quasars at redshifts exceeding 6. Nature 545, 457–461 (2017).
- (39) Riechers, D. A. et al. Rise of the Titans: Gas Excitation and Feedback in a Binary Hyperluminous Dusty Starburst Galaxy at z 6. ApJ 907, 62 (2021).
- (40) Goto, T. A catalogue of local E+A (post-starburst) galaxies selected from the Sloan Digital Sky Survey Data Release 5. MNRAS 381, 187–193 (2007).
- (41) Wild, V. et al. Post-starburst galaxies: more than just an interesting curiosity. MNRAS 395, 144–159 (2009).
- (42) Wild, V. et al. The star formation histories of z 1 post-starburst galaxies. MNRAS 494, 529–548 (2020).
Methods
Spectroscopic data and reduction
The spectroscopic data shown in Figure 1 were taken on 16th November 2022. The target was acquired directly via Wide Aperture Target Acquisition (WATA), meaning the object is extremely well centred. Spectroscopic observations were taken through the NIRSpec fixed slit (S200A1), which has a width of 0.2′′. Data were taken using the G235M and G395M gratings, providing an average spectral resolution of . With each grating, a total of 5 integrations were taken at different dither positions along the slit. The readout pattern used was NRSIRS2, with 30 and 20 groups per integration for the two gratings respectively, providing total integration times of 3 hours and 2 hours respectively.
We reduce our NIRSpec data with the JWST Science Calibration Pipeline v1.8.4, using version 1017 of the JWST calibration reference data. To improve the spectrophotometric calibration of our data, we also reduce observations of the A-type standard star 2MASS J18083474+6927286 \citesuppGordon2022, taken as part of JWST commissioning programme 1128 (PI: Lützgendorf) \citesuppLuetzgendorf2022 using the same instrument modes. We compare the resulting stellar spectrum against a spectral model for this star from the CALSPEC library \citesuppBohlin2014 to construct a calibration function, which we then apply to our observations of GS-9209. The resulting spectrophotometry is well matched with the available near-infrared photometric data, and the calibration polynomial we fit along with our Bagpipes model only results in further calibration changes at the per cent level. We additionally find that the uncertainties output by the pipeline are only moderately underestimated, with the errorbar expansion term in our Bagpipes model resulting in an increase of 50 per cent to the pipeline-produced uncertainties, in agreement with other recent analyses111e.g., https://github.com/spacetelescope/jwst/issues/7362.
Photometric data reduction
The majority of our photometric data are taken directly from the CANDELS GOODS South catalogue \citesuppGuo2013. We supplement this with new JWST NIRCam photometric data taken as part of the Ultra Deep Field Medium-Band Survey \citesuppWilliams2023 (Programme ID: 1963; PI: Williams). Data are available in the F182M, F210M, F430M, F460M and F480M bands. We reduce these data using the PRIMER Enhanced NIRCam Image-processing Library (PENCIL, e.g., Donnan2022 ), a custom version of the JWST Science Calibration Pipeline (v1.8.0), and using version 1011 of the JWST calibration reference data. We measure photometric fluxes for GS-9209 in large, 1′′-diameter apertures to ensure we measure the total flux in each band (the object is isolated, with no other sources within this radius, see Figure 4). We measure uncertainties as the standard deviation of flux values in the nearest 100 blank-sky apertures, masking out nearby objects (e.g., \citesuppMcLeod2016).
Bagpipes full spectral fitting
We fit the available photometry in parallel with our new spectroscopic data using the Bagpipes code Carnall2018 . Our model has a total of 22 free parameters, describing the stellar, dust, nebular and AGN components of the spectrum. A full list of these parameters, along with their associated priors, is given in Extended Data Table LABEL:table:params. We fit our model to the data using the MultiNest nested sampling algorithm \citesuppSkilling2006, Buchner2014, Feroz2019. The full Bagpipes fit to our combined dataset, along with residuals, is shown in Extended Data Figure LABEL:fig:spectrum3. Posterior percentiles for our fit to the data are given in Extended Data Table LABEL:table:params_values.
We use the 2016 updated version of the BC03 \citesuppBruzual2003, Chevallard2016 stellar population models, using the MILES stellar spectral library \citesuppSanchez-Blazquez2006 and updated stellar evolutionary tracks \citesuppBressan2012, Marigo2013. We assume a double-power-law star-formation-history model (e.g., Carnall2018 ; Carnall2019a ). We allow the logarithm of the stellar metallicity, to vary freely from log to 0.55. These are the limits of the range spanned by the BC03 model grid relative to our adopted Solar metallicity value ( \citesuppAsplund2009).
We mask out the narrow emission lines in our spectrum during our Bagpipes fitting due to likely AGN contributions, whereas Bagpipes is only capable of modelling emission lines from star-forming regions. We do however still include a nebular model in our Bagpipes fit to allow for the possibility of nebular continuum emission from star-forming regions. We assume a stellar-birth-cloud lifetime of 10 Myr, and vary the logarithm of the ionization parameter, U, from log to . We also allow the logarithm of the gas-phase metallicity, , to vary freely from log to 0.55. Because our eventual fitted model only includes an extremely small amount of star formation within the last 10 Myr for GS-9209, this nebular component makes a negligible contribution to the fitted model spectrum.
We model attenuation of the above components by dust using the model of \citesuppNoll2009, Salim2018, which is parameterised as a power-law deviation from the Calzetti dust attenuation law \citesuppCalzetti2000, and also includes a Drude profile to model the 2175Å bump. We allow the band attenuation, to vary from magnitudes. We further assume that attenuation is multiplied by an additional factor for all stars with ages below 10 Myr, and resulting nebular emission. This factor is commonly assumed to be 2, however we allow this to vary from 1 to 5.
We allow redshift to vary, using a narrow Gaussian prior with a mean of 4.66 and standard deviation of 0.01. We additionally convolve the spectral model with a Gaussian kernel in velocity space, to account for velocity dispersion in our target galaxy. The width of this kernel is allowed to vary with a logarithmic prior across a range from km s-1. The resolution of our spectroscopic data is high enough that the total dispersion is dominated by stellar velocity dispersion within the target galaxy, which has a standard deviation of km s-1, compared with the average instrumental dispersion of km s-1.
Separately from the above components, we also include a model for AGN continuum, broad H and H emission. Following \citesuppvandenberk2001, we model AGN continuum emission with a broken power law, with two spectral indices and a break at Å in the rest frame. We vary the spectral index at Å using a Gaussian prior with a mean value of ( and standard deviation of 0.5. We also vary the spectral index at Å using a Gaussian prior with a mean value of ( and standard deviation of 0.5. We parameterise the normalisation of the AGN continuum component using , the flux at rest-frame 5100 Å, which we allow to vary with a linear prior from 0 to erg s-1 cm-2 Å-1.
We model broad H with a Gaussian component, varying the normalisation from 0 to erg s-1 cm-2 using a linear prior, and the velocity dispersion from km s-1 in the rest frame using a logarithmic prior. We also include a broad H component in the model, which has the same parameters as the broad H line, but with normalisation divided by the standard 2.86 ratio from Case B recombination theory. However, as shown in Figure 2, this H model peaks at around the noise level in our spectrum, and the line is therefore plausible in not being obviously detected in the observed spectrum.
We include intergalactic medium (IGM) absorption using the model of \citesuppInoue2014. To allow for imperfect spectrophotometric calibration of our spectroscopic data, we also include a second-order Chebyshev polynomial (e.g., \citesuppCarnall2019b, Johnson2021, Carnall2022), which the above components of our combined model are all divided by before being compared with our spectroscopic data. We finally fit an additional white noise term, which multiplies the spectroscopic uncertainties from the JWST pipeline by a factor, , which we vary with a logarithmic prior from .
Investigation of alternative star-formation history models
The functional forms used to model galaxy star-formation histories are well known to significantly affect physical parameter inferences Carnall2019a ; Leja2019a ; Pacifici2023 , with the degree of systematic uncertainty highly dependent on the physical parameter of interest, the type of data, and the galaxy being studied. In this section, we test the dependence of our inferred formation and quenching times for GS-9209 on the SFH model used. We re-run our Bagpipes full-spectral-fitting analysis, substituting the double-power-law SFH model described above, firstly for the continuity non-parametric model Leja2019a , and secondly for a simple top-hat (constant) SFH model. For the continuity model, we use 8 time bins, with bin edges at 0, 10, 100, 200, 400, 600, 800, 1000 and 1260 Myr before observation. For the top-hat model, we vary the time at which star-formation turned on with a uniform prior between the Big Bang and time of observation. We vary the time at which star formation then stopped with a uniform prior from the time at which star formation turned on to the time of observation.
The results of these alternative fitting runs are shown in Extended Data Figure LABEL:fig:alt_sfhs. This figure shows two alternative versions of Figure 3, with the continuity non-parametric model results shown in panels a and b, and the top-hat model results shown in panels c and d. The SFH posteriors shown, whilst varying in their detailed shapes, are in good overall agreement with our original double-power-law model. For the double-power-law model, we recover Gyr and Gyr after the Big Bang. The values returned under the assumption of these other two models are consistent to within 1. For the continuity non-parametric model we recover Gyr and Gyr. For the top-hat model we recover Gyr and Gyr. Both of these models also produce stronger constraints on the peak historical SFR of GS-9209 at a lower level than the double-power-law model, though still consistent within 1. We conclude that our key results are not strongly dependent on our choice of star-formation history model.
AGN contribution and fitting of narrow emission lines
From our Bagpipes full spectral fit, we recover an observed AGN continuum flux at rest-frame wavelength, Å of erg s-1 cm-2 Å-1. This is approximately 7.5 per cent of the total observed flux from GS-9209 at m. We measure a power-law index for the AGN continuum emission of at Å, and at Å. The AGN contribution to the continuum flux from GS-9209 rises to per cent at the blue end of our spectrum (m), and per cent at the red end (m). Just above the Lyman break at Å, the AGN contribution is per cent of the observed flux.
Given our measured , which is more direct than our AGN continuum measurement, the average relation for local AGN presented by Greene2005 predicts to be dex brighter than we measure. However, given the intrinsic scatter of 0.2 dex they report, our measured is only 1 below the mean relation. The extreme equivalent widths of the observed Balmer absorption features firmly disfavour stronger AGN continuum emission.
We fit the narrow H and [N ii] lines in our spectrum as follows. We first subtract from our observed spectrum the posterior median Bagpipes model from our full spectral fitting. We then simultaneously fit Gaussian components to both lines, assuming the same velocity width for both, which is allowed to vary. This process is visualised in Figure 2. We also show the broad H line in our AGN model, for which we assume the same width as broad H, as well as Case B recombination. It can be seen that the broad H line peaks at around the noise level in our spectrum, and is hence too weak to be clearly observed in our data.
The star-formation rate of GS-9209
In this section we discuss the available observational indicators for the SFR of GS-9209. The commonly applied sSFR threshold for defining quiescent galaxies is sSFR, where is the age of the Universe Pacifici2016 . For GS-9209 at and logM, this corresponds to logsSFRyr, or SFR M⊙ yr-1.
In \citesuppSantini2021, the authors report that GS-9209 is undetected in ALMA band 6 data, with a flux of mJy/beam, from which they derive a upper limit on SFR of 41 M⊙ yr-1. They also perform a stacking experiment, with stacked ALMA band 6 data for a sample of 20 objects selected as quiescent galaxies (including GS-9209) still yielding no detection, implying the average SFR for this sample is significantly below the individual-object detection limit. The extremely blue spectral shape of this object in the rest-frame red-optical to near-infrared (observed-frame m, see Extended Data Figure LABEL:fig:spectrum3) is also consistent with no significant obscured star-forming or AGN component. Deeper ALMA data for this object would be of value for setting a more stringent direct upper bound on obscured star formation.
As discussed in the main text, the high [N ii]/H ratio in our observed spectrum strongly suggests that this line emission is powered by AGN activity or shocks. However, if we assume all the narrow H emission is driven by ongoing star formation, neglecting dust attenuation we obtain SFR = M⊙ yr-1 \citesuppKennicutt2012, corresponding to logsSFR/yr. Measurements of the average dust attenuation on H emission, , are not yet available at , however, from , stellar mass is found to be the most important factor in predicting the level of dust attenuation (e.g., \citesuppGarn2010, Shapley2022), with little evolution observed across this redshift interval. At , the average for galaxies with logM is 1.25 magnitudes \citesuppShapley2022, which would suggest that the SFR of GS-9209 is roughly 6 M⊙ yr-1. However, given the multiple lines of evidence we uncover for a significant non-stellar component to the H line, combined with the fact that the extremely low stellar continuum implies the gas-phase attenuation is also low \citesuppSanders2021, it is likely that the sSFR of GS-9209 is considerably lower than the threshold normally applied for selecting quiescent galaxies.
Size measurement from F210M-band imaging
The CANDELS/3DHST team vanderwel2014 measured an effective radius, for GS-9209 in the HST F125W filter via Sérsic fitting, along with a Sérsic index, . At , this corresponds to parsecs. We update this measurement using the newly acquired JWST NIRCam F210M imaging data discussed above. We model the light distribution of GS-9209 using PetroFit \citesuppGeda2022. We fit these PetroFit models to our data using the MultiNest nested sampling algorithm \citesuppSkilling2006, Buchner2014, Feroz2019. We use F210M in preference to the F182M band due to the smaller AGN contribution in F210M and the fact that it sits above the Balmer break, therefore being more representative of the stellar mass present rather than any ongoing star formation.
As our spectroscopic data contains strong evidence for an AGN, we fit both Sérsic and delta-function components simultaneously, convolved by an empirically estimated PSF, derived by stacking bright stars. In preliminary fitting, we find that the relative fluxes of these two components are entirely degenerate with the Sérsic parameters. We therefore predict the AGN contribution to the flux in this band based on our full-spectral-fitting result, obtaining a value of per cent. We then impose this as a Gaussian prior on the relative contributions from the Sérsic and delta function components. The 11 free parameters of our model are the overall flux normalisation, which we fit with a logarithmic prior, the effective radius, , Sérsic index, , ellipticity and position angle of the Sérsic component, the x and y centroids of both components, the position angle of the point spread function, and the fraction of light in the delta-function component, which we fit with a Gaussian prior with a mean of 8 per cent and standard deviation of 1 per cent, based on our full spectral fitting result.
Deeper imaging data in the F200W or F277W bands (e.g., from the JWST Advanced Deep Extragalactic Survey; JADES) will provide a useful check on our size measurement for GS-9209, particularly given the lower AGN fraction in the F277W band.
Data Availability
The datasets analysed during the current study are available from the Mikulski Archive for Space Telescopes (MAST) repository at https://mast.stsci.edu. The spectrum for GS-9209 was observed under JWST Programme ID 2285 (PI: Carnall). This programme has a 12-month proprietary period, and data will automatically become publicly available via MAST on 16th November 2023. Reduced data products are available from the corresponding author upon request.
Code Availability
The Bagpipes code is publicly available at https://github.com/ACCarnall/bagpipes. The PetroFit code is publicly available at https://github.com/PetroFit/petrofit. The JWST data reduction pipeline is publicly available at https://github.com/spacetelescope/jwst.
References
- (1)
- (2) Gordon, K. D. et al. The James Webb Space Telescope Absolute Flux Calibration. I. Program Design and Calibrator Stars. AJ 163, 267 (2022).
- (3) Lützgendorf, N. et al. Astrometric and wavelength calibration of the NIRSpec instrument during commissioning using a model-based approach. In Coyle, L. E., Matsuura, S. & Perrin, M. D. (eds.) Space Telescopes and Instrumentation 2022: Optical, Infrared, and Millimeter Wave, vol. 12180 of Society of Photo-Optical Instrumentation Engineers (SPIE) Conference Series, 121800Y (2022).
- (4) Bohlin, R. C., Gordon, K. D. & Tremblay, P. E. Techniques and Review of Absolute Flux Calibration from the Ultraviolet to the Mid-Infrared. PASP 126, 711 (2014).
- (5) Guo, Y. et al. CANDELS Multi-wavelength Catalogs: Source Detection and Photometry in the GOODS-South Field. ApJS 207, 24 (2013).
- (6) Williams, C. C. et al. JEMS: A deep medium-band imaging survey in the Hubble Ultra-Deep Field with JWST NIRCam & NIRISS. arXiv e-prints arXiv:2301.09780 (2023).
- (7) McLeod, D. J., McLure, R. J. & Dunlop, J. S. The z = 9-10 galaxy population in the Hubble Frontier Fields and CLASH surveys: the z = 9 luminosity function and further evidence for a smooth decline in ultraviolet luminosity density at z 8. MNRAS 459, 3812–3824 (2016).
- (8) Skilling, J. Nested sampling for general bayesian computation. Bayesian Anal. 1, 833–859 (2006).
- (9) Buchner, J. et al. X-ray spectral modelling of the AGN obscuring region in the CDFS: Bayesian model selection and catalogue. A&A 564, A125 (2014).
- (10) Feroz, F., Hobson, M. P., Cameron, E. & Pettitt, A. N. Importance Nested Sampling and the MultiNest Algorithm. The Open Journal of Astrophysics 2, 10 (2019).
- (11) Bruzual, G. & Charlot, S. Stellar population synthesis at the resolution of 2003. MNRAS 344, 1000–1028 (2003).
- (12) Chevallard, J. & Charlot, S. Modelling and interpreting spectral energy distributions of galaxies with BEAGLE. MNRAS 462, 1415–1443 (2016).
- (13) Sánchez-Blázquez, P. et al. Medium-resolution Isaac Newton Telescope library of empirical spectra. MNRAS 371, 703–718 (2006).
- (14) Bressan, A. et al. PARSEC: stellar tracks and isochrones with the PAdova and TRieste Stellar Evolution Code. MNRAS 427, 127–145 (2012).
- (15) Marigo, P., Bressan, A., Nanni, A., Girardi, L. & Pumo, M. L. Evolution of thermally pulsing asymptotic giant branch stars - I. The COLIBRI code. MNRAS 434, 488–526 (2013).
- (16) Asplund, M., Grevesse, N., Sauval, A. J. & Scott, P. The Chemical Composition of the Sun. ARA&A 47, 481–522 (2009).
- (17) Noll, S. et al. GMASS ultradeep spectroscopy of galaxies at . IV. The variety of dust populations. A&A 499, 69–85 (2009).
- (18) Salim, S., Boquien, M. & Lee, J. C. Dust Attenuation Curves in the Local Universe: Demographics and New Laws for Star-forming Galaxies and High-redshift Analogs. ApJ 859, 11 (2018).
- (19) Calzetti, D. et al. The Dust Content and Opacity of Actively Star-forming Galaxies. ApJ 533, 682–695 (2000).
- (20) Vanden Berk, D. E. et al. Composite Quasar Spectra from the Sloan Digital Sky Survey. AJ 122, 549–564 (2001).
- (21) Inoue, A. K., Shimizu, I., Iwata, I. & Tanaka, M. An updated analytic model for attenuation by the intergalactic medium. MNRAS 442, 1805–1820 (2014).
- (22) Carnall, A. C. et al. The VANDELS survey: the star-formation histories of massive quiescent galaxies at . MNRAS 490, 417–439 (2019).
- (23) Johnson, B. D., Leja, J., Conroy, C. & Speagle, J. S. Stellar Population Inference with Prospector. ApJS 254, 22 (2021).
- (24) Carnall, A. C. et al. The Stellar Metallicities of Massive Quiescent Galaxies at 1.0 z 1.3 from KMOS + VANDELS. ApJ 929, 131 (2022).
- (25) Santini, P. et al. The emergence of passive galaxies in the early Universe. A&A 652, A30 (2021).
- (26) Kennicutt, R. C. & Evans, N. J. Star Formation in the Milky Way and Nearby Galaxies. ARA&A 50, 531–608 (2012).
- (27) Garn, T. & Best, P. N. Predicting dust extinction from the stellar mass of a galaxy. MNRAS 409, 421–432 (2010).
- (28) Shapley, A. E. et al. The MOSFIRE Deep Evolution Field Survey: Implications of the Lack of Evolution in the Dust Attenuation-Mass Relation to z 2. ApJ 926, 145 (2022).
- (29) Sanders, R. L. et al. The MOSDEF Survey: The Evolution of the Mass-Metallicity Relation from z = 0 to z 3.3. ApJ 914, 19 (2021).
- (30) Geda, R. et al. PetroFit: A python package for computing petrosian radii and fitting galaxy light profiles. AJ 163, 202 (2022).
Acknowledgements
The authors would like to thank James Aird for helpful discussions. A. C. Carnall thanks the Leverhulme Trust for their support via a Leverhulme Early Career Fellowship. R. J. McLure, J. S. Dunlop, D. J. McLeod, V. Wild, R. Begley, C. T. Donnan and M. L. Hamadouche acknowledge the support of the Science and Technology Facilities Council. F. Cullen acknowledges support from a UKRI Frontier Research Guarantee Grant (grant reference EP/X021025/1). A. Cimatti acknowledges support from the grant PRIN MIUR 2017 - 20173ML3WW_001.
Author Contributions
ACC led the preparation of the observing proposal, reduction and analysis of the data, and preparation of the manuscript. RJM, JSD, VW, FC and AC provided advice and assistance with data reduction, analysis and interpretation, as well as consulting on the preparation of the observing proposal. DJM, DM, RB and CTD reduced the JWST imaging data and prepared the empirical PSF. DJM, MLH and SMJ assisted with measurement of the size and morphology of GS-9209. SW assisted with selection of GS-9209 from the CANDELS catalogues prior to the observing proposal being submitted. All authors assisted with preparation of the final published manuscript.
Author Information
The authors declare that they have no competing financial interests. Correspondence and requests for materials should be addressed to ACC (email: adam.carnall@ed.ac.uk).