A Quantum Monte Carlo study of the structural, energetic, and magnetic properties of two-dimensional (2D) H and T phase VSe2
Abstract
Previous works have controversially claimed near-room temperature ferromagnetism in two-dimensional (2D) VSe2, with conflicting results throughout the literature. These discrepancies in magnetic properties between both phases (T and H phase) of 2D VSe2 are most likely due to the structural parameters being coupled to the magnetic properties. Specifically, both phases have a close lattice match and similar total energies, which makes it difficult to determine which phase is being observed experimentally. In this study, we used a combination of density functional theory (DFT), highly accurate diffusion Monte Carlo (DMC) and a surrogate Hessian line-search optimization technique to resolve the previously reported discrepancy in structural parameters and relative phase stability. With DMC accuracy, we determined the freestanding geometry of both phases and constructed a phase diagram. Our findings demonstrate the successes of the DMC method coupled with the surrogate Hessian structural optimization technique when applied to a 2D magnetic system.
I Introduction
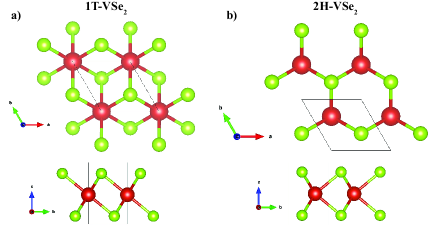
One of the most promising two-dimensional (2D) magnetic materials that has been extensively studied experimentally and theoretically is 2D VSe2. Similar to other 2D transition metal dichalcogenides (such as MoS2) Ataca, Şahin, and Ciraci (2012), VSe2 exists in two phases, the T (octahedral phase (1T)-centered honeycombs) phase which is metallic and the H (the trigonal prismatic phase (2H)-hexagonal honeycombs, see Fig. 1) phase which is semiconducting. Several experimental and theoretical studies have controversially claimed near-room temperature ferromagnetism in VSe2, with conflicting results throughout the literature. Density functional theory (DFT) along with classical Monte Carlo simulations have been used to obtain an estimate of the Curie temperature of H-VSe2 (291 K) Fuh et al. (2016), but the model Ising Hamiltonian used did not take into account the magnetic anisotropy energies, which are essential for an accurate estimation of the Curie temperature of a 2D lattice. The Curie temperature of multilayered 2D H-VSe2 has been experimentally measured to be 425 K, with the ferromagnetism softening as the thickness of the sample increases Wang et al. (2021). Additionally, the experimental Curie temperature for monolayer T-VSe2 has ranged from 300 K to 470 K Bonilla et al. (2018); Yu et al. (2019) depending on which substrate is used (MoS2, graphite, SiO2-coated silicon). The experimental magnetization of T-VSe2 has also been met with controversy, with values of 15 and 5 (per formula unit) being reported from two separate studies Bonilla et al. (2018); Duvjir et al. (2018). Insight has also been reported with regards to how the ferromagnetism is enhanced with defects, molecular adsorption and the choice of substrate for VSe2 Boukhvalov and Politano (2020); Yu et al. (2019); Bonilla et al. (2018). A wide range of values have also been reported for the charge density wave (CDW) transition temperature for T-VSe2, ranging from 120 K to 350 K Sahoo et al. (2020); Feng et al. (2018); Chen et al. (2018); Wang et al. (2021); Duvjir et al. (2018).
These discrepancies in the electronic and magnetic properties of either phase of 2D VSe2 arise from the structural parameters of each phase being coupled closely to the magnetic and electronic properties and the external factors (substrates, defects) of the individual samples. One example of this has been a reported discrepancy on which phase (T or H) is energetically more favorable. Both the T and H phases have a close lattice match and similar total energies, which makes it difficult to determine which phase is being observed experimentally. Recently, it has been reported experimentally that the T phase is favored for bulk VSe2, but with dimensionality decrease, the H phase is favored Li et al. (2020); Wang et al. (2021). It has also been reported that a T-to-H phase transition can be realized by thermal annealing Li et al. (2020). This same structural phase transition has even been reported by applying a biaxial strain of 3 (from calculated results) Li et al. (2020); Boukhvalov and Politano (2020); Pushkarev et al. (2019). Researchers have proposed that this lattice strain can be induced by the mismatch that occurs from putting 2D VSe2 on a substrate Boukhvalov and Politano (2020); Pushkarev et al. (2019).
From a computational perspective, results for VSe2 depend heavily on which methodology is employed. In most cases, DFT with an empirical Hubbard correction (+) for correlated electrons is used Dudarev et al. (1998). For example, if the correction is applied for T and H-VSe2, the T phase is more energetically favorable, while if no correction is applied, the H phase is more favorable Popov et al. (2016). In addition to the discrepancies in results calculated with DFT+, results between van der Waals (vdW) corrected functionals and hybrid functionals are also inconclusive Popov et al. (2016) in terms of predicting the relative phase stability. In order to alleviate the uncertainty in DFT methods, more sophisticated methods can be used such as Diffusion Monte Carlo (DMC) Foulkes et al. (2001). DMC is a correlated, many-body electronic structure method that has demonstrated success for the electronic and magnetic properties of a variety of bulk and 2D systems Foyevtsova et al. (2014); Busemeyer et al. (2016); Wines, Saritas, and Ataca (2020, 2021, 2022); Wines, Choudhary, and Tavazza (2022); Tiihonen, Kent, and Krogel (2022); Shin et al. (2021); Staros et al. (2021). This method has a weaker dependence on the starting density functional and parameter and can successfully achieve results with an accuracy beyond the DFT+ Foulkes et al. (2001).
Due to the fact that T and H-VSe2 have structural parameters that are coupled to their electronic and magnetic properties, it makes it difficult to produce conclusive results that rely solely on DFT or DFT+. For this reason, we employed our recently developed energy-based surrogate Hessian method for structural optimization with stochastic electronic structure theories (such as DMC) Tiihonen, Kent, and Krogel (2022) to obtain the geometry of T and H-VSe2 with DMC accuracy, resulting in high-accuracy bond lengths that resolve previous functional dependent structural discrepancies. After obtaining an accurate geometry for both structures, we constructed a phase diagram between T and H-VSe2 using DMC calculated energies and obtained accurate magnetic properties of each structure. The accurate estimates for lattice geometry, relative phase energy and the DMC phase diagram assist in clarifying previously inconclusive theoretical and experimental results regarding T and H phase VSe2. For full details of the computational methods used, see the Supporting Information (SI).
As an initial starting point for our study, we performed benchmarking DFT and DFT+ calculations using a variety of density functionals (local density approximation (LDA)Hohenberg and Kohn (1964), Perdew-Burke-Ernzerhof (PBE)Perdew, Burke, and Ernzerhof (1996), and strongly constrained and appropriately normed (SCAN)Sun, Ruzsinszky, and Perdew (2015) meta-GGA functionals, see SI for more details) and the Vienna Ab initio Simulation Package (VASP) code for monolayer T-VSe2 and H-VSe2. The goal of these simulations were to assess how sensitive the relative energy between the T and H phase is with respect to functional and material geometry. Another goal of these simulations was to benchmark the structural parameters of each material with respect to several density functionals. It is advantageous to perform these reference calculations with VASP and PAW pseudopotentials as a precursor to the more expensive DMC calculations due to the fact that they require a much smaller cutoff energy and are more cost effective for a large number of simulations. It is important to note that for all DFT and DMC simulations, we assumed a ferromagnetic ground state for both T and H-VSe2. Although recent reports have suggested that T-VSe2 could be experimentally paramagnetic Wang et al. (2021), we infer that this paramagnetism can be induced by magnetic anisotropy. In addition, the modeling of paramagnetism with computational methods imposes a great challenge, which is why we focus on the freestanding ferromagnetic ground states of both phases. A more robust treatment of the magnetic structure can be explored in future work, but is beyond the scope of this work which primarily focuses on determining the geometric structure and phase stability of 2D T and H-VSe2.
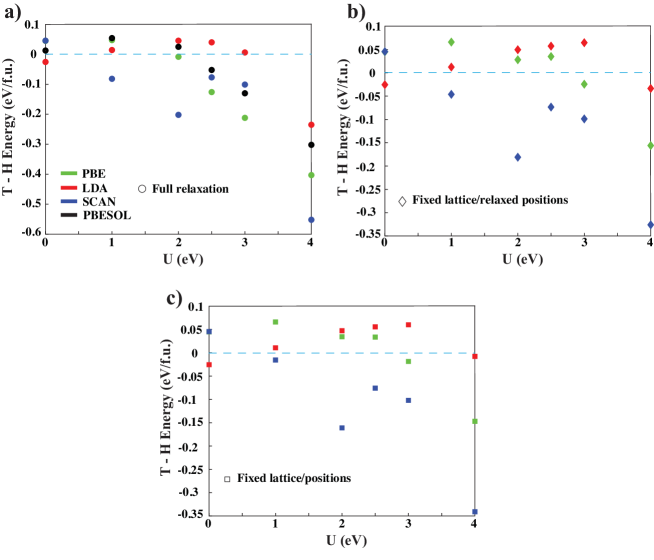
In Fig. 2 we present a comprehensive look at the difference in total energy between T-VSe2 and H-VSe2, using several DFT functionals under different geometric constraints. We performed these calculations for a variety of values in three different ways: fully relaxing the structure at each value of (Fig. 2 a) ), fixing the lattice and atomic positions to the = 0 eV relaxed geometry of that particular functional and calculating the static energy at each value of (Fig 2 b)), fixing the lattice to the = 0 eV relaxed geometry of that particular functional and relaxing just the atomic positions at each value of (Fig. 2 c)). The results in Fig. 2 indicate that there is a significant disagreement between DFT functionals, value used, and material geometries, with all three factors playing a significant role in the energy difference between T and H phase. Specifically, regardless of relaxation method, all bare (no correction) SCAN, PBE, and PBEsol functionals predict H favorable, while bare LDA predicts T favorable. For all functionals, there is a critical value of that reverses the relative phase stability, which is dependent on functional and relaxation method. The SCAN functional with a correction predicts T phase favorable, with larger energy differences. As seen in Fig. 2, the trends in the relative phase stability between Fig. 2 b) and c) are nearly identical, but significantly vary from Fig. a). This implies that the density functional is strongly coupled to material geometry, but the lattice constant change has more of an effect on phase stability than atomic positions and bond distances. This is most prevalent for higher values ( 2 eV), where the relaxed geometry changes more drastically with . The interrelated nature of the material’s geometry, density functional, and value of are reasons to seek out higher levels of theory beyond DFT/DFT+ such as DMC to accurately determine the optimal geometry and relative energy between the phases of 2D VSe2.
| T-VSe2 | H-VSe2 | ||||
|---|---|---|---|---|---|
| Method | (Å) | (Å) | (Å) | (Å) | E (eV/f.u.) |
| PBE | 3.336 | 2.489 | 3.333 | 2.502 | 0.045 |
| PBE+=2 | 3.435 | 2.526 | 3.364 | 2.520 | -0.008 |
| LDA | 3.228 | 2.438 | 3.229 | 2.445 | -0.026 |
| LDA+=2 | 3.277 | 2.455 | 3.266 | 2.464 | 0.045 |
| SCAN | 3.387 | 2.486 | 3.329 | 2.486 | 0.045 |
| SCAN+=2 | 3.462 | 2.524 | 3.353 | 2.502 | -0.202 |
| PBEsol | 3.262 | 2.458 | 3.272 | 2.471 | 0.013 |
| PBEsol+=2 | 3.323 | 2.483 | 3.301 | 2.487 | 0.025 |
| PBE-D2 | 3.323 | 2.484 | 3.318 | 2.496 | 0.010 |
| PBE-D3 | 3.315 | 2.485 | 3.319 | 2.497 | 0.042 |
| SCAN+rvv10 | 3.379 | 2.481 | 3.319 | 2.482 | 0.051 |
| DMC | 3.414(12) | 2.505(7) | 3.335(8) | 2.503(5) | 0.06(2) |
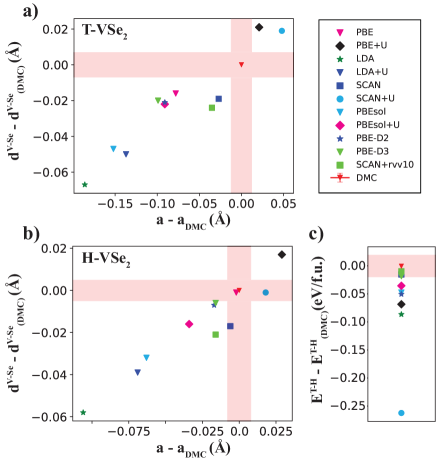
The relaxed lattice constants, V-Se distances, and T - H energies from Fig. 2 a) are presented in Table 1 and Fig. 3, along with additional VASP reference calculations performed with the vdW corrected functionals (PBE-D2 Grimme (2006), PBE-D3 Grimme, Ehrlich, and Goerigk (2011), SCAN+rvv10 Peng et al. (2016)). The DMC computed parameters are also given for comparison in Table 1 and Fig. 3 (more discussion to follow). We observe a 7 variability in lattice constant across the different methods for T-VSe2 and a 4 variability in lattice constant across the different methods for H-VSe2. Between both phases, we observe a 3 variability in V-Se distance (). Most strikingly, the energy difference between the T and H phases (E) drastically varies depending on the material geometry and computational methodology, ranging from -0.2 eV/f.u. to 0.06 eV/f.u.. Due to the fact that a strain-induced phase transition has been reported between T- and H-VSe2 Li et al. (2020); Boukhvalov and Politano (2020); Pushkarev et al. (2019), we decided to perform additional VASP benchmarking calculations that involved the application of tensile and compressive strain for each monolayer. We performed these calculations for PBE, SCAN, and LDA (with = 0 eV and = 2 eV), starting from the = 0 eV geometry for each functional. The resulting equations of state are depicted in Fig. S3. As seen in the figure, the equation of state and resulting strain-induced phase transition is entirely dependent on the functional and value, with no consistent trend.
The strong sensitivity of each monolayer with respect to geometry and functional are grounds for using a higher-order method such as DMC to obtain a statistically accurate estimate of the lattice parameters and relative energy between phases. Prior to performing the DMC/line-search calculations, we optimized our nodal surface (orbitals selected for DFT wavefunction generation). Since DMC has the zero-variance property, it means that as the trial wave function approaches the exact ground state, the statistical fluctuations in the energy reduce to zero Foulkes et al. (2001). Although there have been instances where various sophisticated methods have been used to optimize the nodal surface Kwon, Ceperley, and Martin (1993, 1998); López Ríos et al. (2006); Bajdich et al. (2010), we employed the PBE+ approach, where the Hubbard () value was used as a variational parameter to optimize the nodal surface using DMC (similar to other successful DMC studies of magnetic materials Foyevtsova et al. (2014); Ichibha et al. (2021); Saritas et al. (2019, 2018); Staros et al. (2021); Wines, Saritas, and Ataca (2022); Wines, Choudhary, and Tavazza (2022)). We performed these calculations for both T and H-VSe2 (24 atom supercells), where we tuned the value from (1 to 4) eV while creating the trial wavefunction and computed the DMC energy. The results of these calculations are depicted in Fig. S4, where we observe that = 2 eV yields the lowest energy for both phases. It is important to note that for the H phase, the DMC energies for = 1 and = 2 eV are statistically identical. Based on this, we created the trial wavefunction using PBE+ ( = 2 eV) for all subsequent DMC calculations within the surrogate Hessian line-search for both phases (all 52 DMC energy evaluations). Since we obtained an optimal value of 2 eV for both materials, we focused our DFT+U benchmarking efforts more on = 2 eV (Fig. 3, Fig 5, Table 1, Fig. 2, Fig. S3).
Based on the DMC line-search results, we determined accurate bounds on the lattice parameter () and off-plane displacement of Se (), within an error tolerance of Å or lower for both parameters. This translates to within accuracy in a parameter set of and with 95% confidence. Convergence (absence of significant displacements outside of the error tolerance) was achieved after two parallel line-search iterations for both phases. This convergence is illustrated in Fig. S5, where the convergence of the parameter offsets of and and the convergence of the total energy per f.u. are depicted for both T and H phase 2D VSe2 for the initial DFT relaxed structure (1) and both subsequent iterations of DMC (2 - 3). In addition, the final energy of both of the fitted structures (square points) are given.
The final geometric parameters and relative phase energies determined with DMC are given in Table 1 and Fig. 3. For T-VSe2, we determined a lattice constant of 3.414(12) Å and a V-Se distance of 2.505(7) Å . For H-VSe2, we determined a lattice constant of 3.335(8) Å and a V-Se distance of 2.503(5) Å . The DMC finite-size extrapolated energy difference (T - H) between the two phases was determined to be 0.06(2) eV/f.u., indicating that in freestanding form at the equilibrium geometry, H-VSe2 is favored over T-VSe2. When comparing these DMC results to the other DFT functionals in Table 1 and Fig. 3, it is clear that very few DFT functionals can reproduce the DMC results for lattice constant, V-Se distance and relative energy difference. The SCAN functional comes the closest to reproducing all three simultaneous DMC values, but still falls slightly short for the V-Se distances of both phases and the lattice constant of T-VSe2. The fact that SCAN+U successfully predicts the structural properties (for H-VSe2) and the fact that SCAN+rvv10 produces an energy difference closest to the average DMC energy difference for both phases loosely implies that a simultaneous description of correlated magnetism and vdW interactions are both needed to correctly represent the physics of VSe2. Experimental measurements of the lattice constant and V-Se distance of freestanding monolayer VSe2 are scarce and often times dependent on external factors such as the substrate (more discussion to follow) and sample preparation technique Yu et al. (2019); Bonilla et al. (2018); Chen et al. (2020); Liu et al. (2018). However, Chen et al. Chen et al. (2020) have recently reported a lattice constant of 3.4 Å for thin films of T-VSe2 and Liu et al. Liu et al. (2018) have recently reported a lattice constant of 3.3 Å for epitaxially grown monolayer H-VSe2. Both of these measured values are in excellent agreement with our DMC computed lattice constants. Additionally, we determined the near-equilibrium PES of both T and H 2D VSe2 with DMC accuracy, which are both depicted in Fig. S6.
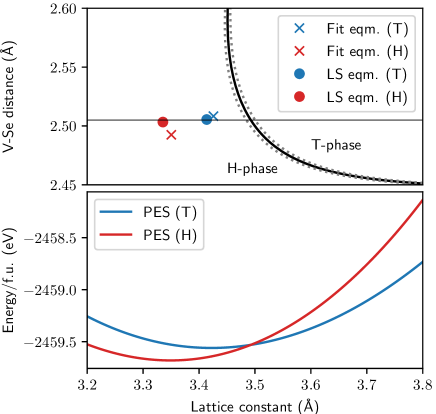
The phase diagram presented in Fig. 4 is based on similar fits to data, where the displacement has been remapped to . This DMC phase diagram can directly be compared to the energy vs. strain DFT benchmarking calculations in Fig. S3, which emphasizes the need for an accurate representation of the phase boundary between the two phases. The freestanding geometries of both T and H lie in the energetic H phase, but a slice of the phase diagram along Å indicates that the T phase becomes favorable over H at biaxial strain of Å. This implies that in freestanding form, once T-VSe2 is positively strained at least 2.5 , T phase is favored over H. Alternatively, if freestanding H-VSe2 is positively strained at least 5 , T phase is also favored over H This strain can easily be accomplished by placing monolayer VSe2 on a substrate with significant lattice mismatch. In fact, this type of mismatch has been reported to alter the material properties Yu et al. (2019); Bonilla et al. (2018); Karn et al. (2022); Song et al. (2021), significantly contributing to the controversies of T and H-VSe2 (for energetic favorability, magnetic properties). Whether or not the changes in energetic favorability or magnetic properties with respect to the substrate are due to lattice mismatch or more complicated interactions between the substrate and the monolayer remains to be answered and is beyond the scope of this work, which has focused solely on the freestanding forms of T and H-VSe2. However, such calculations can be employed for future work using higher order methods such as DMC. The proximity of the phase boundary between T and H phase (Fig. 4) is emphasized by the small energy difference between the two phases (0.06(2) eV/f.u., at the equilibrium geometry) between the two curves. Since this energy difference is so close to room temperature ( 0.024 eV), this implies that a process such as thermal annealing can easily induce a phase transition. In fact, recently it was demonstrated that a structural phase transition of multilayer VSe2 from T to H occurs through annealing at 650 K, along with a metal-insulator transition Li et al. (2020).
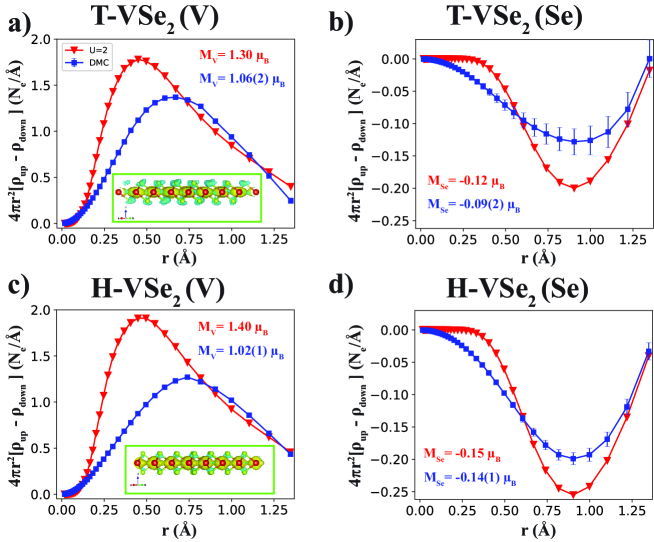
To gain a deeper understanding of the magnetic properties of 2D T and H-VSe2, we extracted the spin densities (using a trial wavefunction at = 2 eV and 24 atom supercell at the final equilibrium geometry predicted by DMC/line-search). The spin density isosurfaces of each phase ( - ) are depicted in the insets of Fig. 5 a) and c) for T-VSe2 and H-VSe2 respectively. For both phases, we observe the V atoms are highly spin-polarized, while the Se atoms are slightly antiparallel with respect to the V atoms. For more calculation details regarding spin density, see SI.
We went on to plot the radial averaged spin densities as a function of distance, separately for V and Se for T and H-VSe2 (depicted in Fig. 5 a) - d)). This allows us to view the spatial variations in spin density. Additionally, we benchmarked these V and Se radially averaged densities with PBE+ ( = 2 eV) using NC pseudopotentials at the equilibrium geometry (the calculation required to create the trial WF for the subsequent DMC runs). As seen in Fig. 5 a) and c), there is a substantial difference in the V spin density between DMC and PBE+ ( = 2 eV) for both T and H phase. This same substantial difference between DMC and PBE+ also occurs for the total charge density. This discrepancy is most prevalent near the radial density peak (peak of orbital) and can be attributed to the fact that DFT functionals (even with the added Hubbard correction) tend to delocalize and unsuccessfully capture 3 orbitals. This large discrepancy in the spin densities highlights the need for more accurate, many-body computational methodologies for correlated materials such as VSe2, where DFT fails. In contrast, there is closer agreement between the DMC and PBE+ spin densities for Se in T and H-VSe2 (see Fig. 5 b) and d).
Finally, we estimated the site-averaged atomic magnetic moments per V and Se for both T and H phase by integrating the DMC and PBE+ spin densities depicted in Fig. 5. At the DMC level, we estimated a magnetic moment of 1.06(2) for V and -0.09(2) for Se in T-VSe2 and a magnetic moment of 1.02(1) for V and -0.14(1) for Se in H-VSe2. At the PBE+ ( = 2 eV) level, we estimated a magnetic moment of 1.30 for V and -0.12 for Se in T-VSe2 and a magnetic moment of 1.40 for V and -0.15 for Se in H-VSe2. Consistent with the radial spin density results in Fig. 5, we find that the DMC and PBE+ magnetic moments for Se are in much closer agreement than for V (for both T and H phase). By analyzing the spin densities and obtaining the on-site magnetic moments, we obtain a clear picture of how the magnetization of each ion depends on the computational method used, serving as a benchmark for the magnetic properties of 2D VSe2.
In this work, we used a combination of DFT, DMC and a recently developed surrogate Hessian line-search optimization technique to resolve the previously reported discrepancy in structural parameters and relative phase stability of monolayer T-VSe2 and H-VSe2. Using these methods, we determined the lattice constant and V-Se distance (with DMC accuracy) to be 3.414(12) Å and 2.505(7) Å respectively for T-VSe2 and 3.335(8) Å and 2.503(5) respectively for H-VSe2. In addition, we find the relative energy between the phases (T - H) to be 0.06(2) eV/f.u. at the DMC level, indicating that in freestanding form, H-VSe2 is more energetically favorable than T-VSe2. We went on to obtain a phase diagram between T and H phase from the PES and determined that a phase transition can be induced by strain or mechanisms such as thermal annealing. Additionally, we benchmarked the magnetic properties such as spin density and on-site magnetic moment for both phases and find substantial differences between DMC and DFT. The results of this study demonstrate the successes of the DMC method coupled with the surrogate Hessian line-search structural optimization technique when applied to a 2D magnetic system. The estimates for lattice constant, bond distance, relative phase energy and the extracted structural-dependent phase diagram assist in clarifying previously inconclusive theoretical and experimental results regarding T and H phase VSe2.
II Code Availability Statement
Software packages mentioned in the article can be found at https://github.com/usnistgov/jarvis. Please note that the use of commercial software (VASP) does not imply recommendation by the National Institute of Standards and Technology.
III Competing interests
The authors declare no competing interests.
IV acknowledgments
The authors thank the National Institute of Standards and Technology for funding, computational, and data-management resources. The authors thank Dr. Kamal Choudhary and Dr. Francesca Tavazza for fruitful discussions. We acknowledge grants of computer capacity from the Finnish Grid and Cloud Infrastructure (persistent identifier urn:nbn:fi:research-infras-2016072533).
References
References
- Ataca, Şahin, and Ciraci (2012) C. Ataca, H. Şahin, and S. Ciraci, “Stable, single-layer MX2 transition-metal oxides and dichalcogenides in a honeycomb-like structure,” The Journal of Physical Chemistry C 116, 8983–8999 (2012).
- Fuh et al. (2016) H.-R. Fuh, C.-R. Chang, Y.-K. Wang, R. F. L. Evans, R. W. Chantrell, and H.-T. Jeng, “Newtype single-layer magnetic semiconductor in transition-metal dichalcogenides vx2 (x = s, se and te),” Scientific Reports 6, 32625 (2016).
- Wang et al. (2021) X. Wang, D. Li, Z. Li, C. Wu, C.-M. Che, G. Chen, and X. Cui, “Ferromagnetism in 2d vanadium diselenide,” ACS Nano, ACS Nano 15, 16236–16241 (2021).
- Bonilla et al. (2018) M. Bonilla, S. Kolekar, Y. Ma, H. C. Diaz, V. Kalappattil, R. Das, T. Eggers, H. R. Gutierrez, M.-H. Phan, and M. Batzill, “Strong room-temperature ferromagnetism in VSe2 monolayers on van der Waals substrates,” Nature Nanotechnology 13, 289–293 (2018).
- Yu et al. (2019) W. Yu, J. Li, T. S. Herng, Z. Wang, X. Zhao, X. Chi, W. Fu, I. Abdelwahab, J. Zhou, J. Dan, Z. Chen, Z. Chen, Z. Li, J. Lu, S. J. Pennycook, Y. P. Feng, J. Ding, and K. P. Loh, “Chemically exfoliated vse2 monolayers with room-temperature ferromagnetism,” Advanced Materials 31, 1903779 (2019), https://onlinelibrary.wiley.com/doi/pdf/10.1002/adma.201903779 .
- Duvjir et al. (2018) G. Duvjir, B. K. Choi, I. Jang, S. Ulstrup, S. Kang, T. Thi Ly, S. Kim, Y. H. Choi, C. Jozwiak, A. Bostwick, E. Rotenberg, J.-G. Park, R. Sankar, K.-S. Kim, J. Kim, and Y. J. Chang, “Emergence of a metal–insulator transition and high-temperature charge-density waves in vse2 at the monolayer limit,” Nano Letters, Nano Letters 18, 5432–5438 (2018).
- Boukhvalov and Politano (2020) D. W. Boukhvalov and A. Politano, “Unveiling the origin of room-temperature ferromagnetism in monolayer vse2: the role of extrinsic effects,” Nanoscale 12, 20875–20882 (2020).
- Sahoo et al. (2020) S. Sahoo, U. Dutta, L. Harnagea, A. K. Sood, and S. Karmakar, “Pressure-induced suppression of charge density wave and emergence of superconductivity in ,” Phys. Rev. B 101, 014514 (2020).
- Feng et al. (2018) J. Feng, D. Biswas, A. Rajan, M. D. Watson, F. Mazzola, O. J. Clark, K. Underwood, I. Marković, M. McLaren, A. Hunter, D. M. Burn, L. B. Duffy, S. Barua, G. Balakrishnan, F. Bertran, P. Le Fèvre, T. K. Kim, G. van der Laan, T. Hesjedal, P. Wahl, and P. D. C. King, “Electronic structure and enhanced charge-density wave order of monolayer vse2,” Nano Letters 18, 4493–4499 (2018).
- Chen et al. (2018) P. Chen, W. W. Pai, Y.-H. Chan, V. Madhavan, M. Y. Chou, S.-K. Mo, A.-V. Fedorov, and T.-C. Chiang, “Unique gap structure and symmetry of the charge density wave in single-layer ,” Phys. Rev. Lett. 121, 196402 (2018).
- Li et al. (2020) D. Li, X. Wang, C.-m. Kan, D. He, Z. Li, Q. Hao, H. Zhao, C. Wu, C. Jin, and X. Cui, “Structural phase transition of multilayer vse2,” ACS Applied Materials & Interfaces 12, 25143–25149 (2020).
- Pushkarev et al. (2019) G. V. Pushkarev, V. G. Mazurenko, V. V. Mazurenko, and D. W. Boukhvalov, “Structural phase transitions in vse2: energetics, electronic structure and magnetism,” Phys. Chem. Chem. Phys. 21, 22647–22653 (2019).
- Dudarev et al. (1998) S. L. Dudarev, G. A. Botton, S. Y. Savrasov, C. J. Humphreys, and A. P. Sutton, “Electron-energy-loss spectra and the structural stability of nickel oxide: An LSDA+U study,” Phys. Rev. B 57, 1505–1509 (1998).
- Popov et al. (2016) Z. I. Popov, N. S. Mikhaleva, M. A. Visotin, A. A. Kuzubov, S. Entani, H. Naramoto, S. Sakai, P. B. Sorokin, and P. V. Avramov, “The electronic structure and spin states of 2d graphene/vx2 (x = s, se) heterostructures,” Phys. Chem. Chem. Phys. 18, 33047–33052 (2016).
- Foulkes et al. (2001) W. M. C. Foulkes, L. Mitas, R. J. Needs, and G. Rajagopal, “Quantum Monte Carlo simulations of solids,” Rev. Mod. Phys. 73, 33–83 (2001).
- Foyevtsova et al. (2014) K. Foyevtsova, J. T. Krogel, J. Kim, P. R. C. Kent, E. Dagotto, and F. A. Reboredo, “Ab initio Quantum Monte Carlo calculations of spin superexchange in cuprates: The benchmarking case of ,” Phys. Rev. X 4, 031003 (2014).
- Busemeyer et al. (2016) B. Busemeyer, M. Dagrada, S. Sorella, M. Casula, and L. K. Wagner, “Competing collinear magnetic structures in superconducting FeSe by first-principles quantum Monte Carlo calculations,” Phys. Rev. B 94, 035108 (2016).
- Wines, Saritas, and Ataca (2020) D. Wines, K. Saritas, and C. Ataca, “A first-principles Quantum Monte Carlo study of two-dimensional (2D) GaSe,” The Journal of Chemical Physics 153, 154704 (2020).
- Wines, Saritas, and Ataca (2021) D. Wines, K. Saritas, and C. Ataca, “A pathway toward high-throughput quantum Monte Carlo simulations for alloys: A case study of two-dimensional (2d) GaSxSe1-x,” The Journal of Chemical Physics 155, 194112 (2021).
- Wines, Saritas, and Ataca (2022) D. Wines, K. Saritas, and C. Ataca, “Intrinsic ferromagnetism of two-dimensional (2d) mno2 revisited: A many-body quantum monte carlo and dft+u study,” The Journal of Physical Chemistry C 126, 5813–5821 (2022).
- Wines, Choudhary, and Tavazza (2022) D. Wines, K. Choudhary, and F. Tavazza, “A systematic dft+u and quantum monte carlo benchmark of magnetic two-dimensional (2d) crx3 (x = i, br, cl, f),” (2022).
- Tiihonen, Kent, and Krogel (2022) J. Tiihonen, P. R. C. Kent, and J. T. Krogel, “Surrogate hessian accelerated structural optimization for stochastic electronic structure theories,” The Journal of Chemical Physics 156, 054104 (2022), https://doi.org/10.1063/5.0079046 .
- Shin et al. (2021) H. Shin, J. T. Krogel, K. Gasperich, P. R. C. Kent, A. Benali, and O. Heinonen, “Optimized structure and electronic band gap of monolayer GeSe from Quantum Monte Carlo methods,” Phys. Rev. Materials 5, 024002 (2021).
- Staros et al. (2021) D. Staros, G. Hu, J. Tiihonen, R. Nanguneri, J. Krogel, M. C. Bennett, O. Heinonen, P. Ganesh, and B. Rubenstein, “A combined first principles study of the structural, magnetic, and phonon properties of monolayer cri3,” The Journal of Chemical Physics, The Journal of Chemical Physics 156, 014707 (2021).
- Hohenberg and Kohn (1964) P. Hohenberg and W. Kohn, “Inhomogeneous electron gas,” Phys. Rev. 136, B864–B871 (1964).
- Perdew, Burke, and Ernzerhof (1996) J. P. Perdew, K. Burke, and M. Ernzerhof, “Generalized gradient approximation made simple,” Phys. Rev. Lett. 77, 3865–3868 (1996).
- Sun, Ruzsinszky, and Perdew (2015) J. Sun, A. Ruzsinszky, and J. P. Perdew, “Strongly constrained and appropriately normed semilocal density functional,” Phys. Rev. Lett. 115, 036402 (2015).
- Grimme (2006) S. Grimme, “Semiempirical GGA-type density functional constructed with a long-range dispersion correction,” Journal of Computational Chemistry 27, 1787–1799 (2006).
- Grimme, Ehrlich, and Goerigk (2011) S. Grimme, S. Ehrlich, and L. Goerigk, “Effect of the damping function in dispersion corrected density functional theory,” Journal of Computational Chemistry 32, 1456–1465 (2011), https://onlinelibrary.wiley.com/doi/pdf/10.1002/jcc.21759 .
- Peng et al. (2016) H. Peng, Z.-H. Yang, J. P. Perdew, and J. Sun, “Versatile van der Waals density functional based on a meta-generalized gradient approximation,” Phys. Rev. X 6, 041005 (2016).
- Kwon, Ceperley, and Martin (1993) Y. Kwon, D. M. Ceperley, and R. M. Martin, “Effects of three-body and backflow correlations in the two-dimensional electron gas,” Phys. Rev. B 48, 12037–12046 (1993).
- Kwon, Ceperley, and Martin (1998) Y. Kwon, D. M. Ceperley, and R. M. Martin, “Effects of backflow correlation in the three-dimensional electron gas: Quantum monte carlo study,” Phys. Rev. B 58, 6800–6806 (1998).
- López Ríos et al. (2006) P. López Ríos, A. Ma, N. D. Drummond, M. D. Towler, and R. J. Needs, “Inhomogeneous backflow transformations in quantum monte carlo calculations,” Phys. Rev. E 74, 066701 (2006).
- Bajdich et al. (2010) M. Bajdich, M. L. Tiago, R. Q. Hood, P. R. C. Kent, and F. A. Reboredo, “Systematic reduction of sign errors in many-body calculations of atoms and molecules,” Phys. Rev. Lett. 104, 193001 (2010).
- Ichibha et al. (2021) T. Ichibha, A. L. Dzubak, J. T. Krogel, V. R. Cooper, and F. A. Reboredo, “ revisited with a many-body ab initio theoretical approach,” Phys. Rev. Materials 5, 064006 (2021).
- Saritas et al. (2019) K. Saritas, J. T. Krogel, S. Okamoto, H. N. Lee, and F. A. Reboredo, “Structural, electronic, and magnetic properties of bulk and epitaxial through Diffusion Monte Carlo,” Phys. Rev. Materials 3, 124414 (2019).
- Saritas et al. (2018) K. Saritas, J. T. Krogel, P. R. C. Kent, and F. A. Reboredo, “Diffusion monte carlo: A pathway towards an accurate theoretical description of manganese oxides,” Phys. Rev. Materials 2, 085801 (2018).
- Chen et al. (2020) G. Chen, S. T. Howard, A. B. Maghirang, K. Nguyen Cong, R. A. B. Villaos, L.-Y. Feng, K. Cai, S. C. Ganguli, W. Swiech, E. Morosan, I. I. Oleynik, F.-C. Chuang, H. Lin, and V. Madhavan, “Correlating structural, electronic, and magnetic properties of epitaxial thin films,” Phys. Rev. B 102, 115149 (2020).
- Liu et al. (2018) Z.-L. Liu, X. Wu, Y. Shao, J. Qi, Y. Cao, L. Huang, C. Liu, J.-O. Wang, Q. Zheng, Z.-L. Zhu, K. Ibrahim, Y.-L. Wang, and H.-J. Gao, “Epitaxially grown monolayer vse2: an air-stable magnetic two-dimensional material with low work function at edges,” Science Bulletin 63, 419–425 (2018).
- Karn et al. (2022) A. Karn, Y. H. Chan, U. Chazarin, P. Chen, and W. W. Pai, “Modification of monolayer 1t-vse2 by selective deposition of vanadium and tellurium,” AIP Advances 12, 035240 (2022), https://doi.org/10.1063/6.0001402 .
- Song et al. (2021) D. Song, Y. Zhou, M. Zhang, X. He, and X. Li, “Structural and transport properties of 1t-vse2 single crystal under high pressures,” Frontiers in Materials 8 (2021), 10.3389/fmats.2021.710849.