Detecting Pump&Dump Stock Market Manipulation from Online Forums
Abstract
The intersection of social media, low-cost trading platforms, and naive investors has created an ideal situation for information-based market manipulations, especially pump&dumps. Manipulators accumulate small-cap stocks, disseminate false information on social media to inflate their price, and sell at the peak. We collect a dataset of stocks whose price and volume profiles have the characteristic shape of a pump&dump, and social media posts for those same stocks that match the timing of the initial price rises. From these we build predictive models for pump&dump events based on the language used in the social media posts.
There are multiple difficulties: not every post will cause the intended market reaction, some pump&dump events may be triggered by posts in other forums, and there may be accidental confluences of post timing and market movements. Nevertheless, our best model achieves a prediction accuracy of 85% and an F1-score of 62%. Such a tool can provide early warning to investors and regulators that a pump&dump may be underway.
1 Introduction
New financial products and technologies have allowed naive investors to easily enter financial markets. This has increased the risk of manipulation, and detecting and investigating fraudulent activities has become much more difficult. Many go undetected [8].
Social media has created new methods for manipulating markets. A scheme known as Pump and Dump (P&D) is one popular mechanism. Fraudsters buy quantities of a stock, disseminate false information about it to artificially raise its price, and then sell their purchased shares at the higher price. Social media provides a channel for rapid dissemination and a pool of investors with little knowledge or experience who may not detect that the information is false.
Conventional approaches to detecting manipulation look for known patterns, and for anomalous activity such as exceeded thresholds for prices and trading volumes. Suspicious activities can be detected using sets of rules and triggers that cause notifications of potential manipulation. However, those methods struggle in the presence of behaviours that deviate from historical patterns [16]. Previous work has also focused on detecting manipulations so that regulators can penalise those who carry them out. This does little to help investors, either to prevent their being deceived or recovering their investments.
Data-analytic techniques have the potential to detect false information as it being disseminated [11, 25]. Natural language analytics can detect the posts in social media that are intended to pump particular stocks, providing a real-time warning to potential investors. We investigate how well P&D schemes can be detected in posts on social media, by matching the language patterns in the posts to the pattern of stock price corresponding to a P&D manipulation.
A penny stock is a stock that is traded by a small public company for less than $5 per share [24]. Many of these companies are known for their volatility due to their limited coverage by analysts and interest from institutional buyers. Because of their low price, retail investors can buy large quantities of these stocks without having to invest much money. This, however, makes their prices volatile and so creates the potential for large returns on investments; but also leaves them vulnerable to manipulation by malicious actors. One study found that 50% of manipulated stocks are those with a small market capitalization [1].
It might be supposed that the connection between a social media post and a P&D event is too tenuous to be detected – after all, not every post will have the desired effect, and a P&D might be triggered by some less visible social media activity. We show that, at least for penny stocks, the connection is reasonably detectable, and we achieve prediction accuracies (that a post is intended to cause a P&D event) of 85%, with an F1 score of 67% ( 12 percentage points) from posts alone, and 62% ( 3 percentage points) from posts and comments.
2 Tools
Stance detection is a technique to determine the attitude or viewpoint of a text towards a target. It aims to detect whether the author of the text is in support of or against a given entity [21]. Some applications of stance detection have been in political debates, fake news, and social media [15, 26, 30].
Empath is a tool that was developed by Fast et al. [13] for researchers to generate and validate new lexical categories on demand. It uses deep learning to establish connections between words and phrases used in modern fiction. Given a small set of seed words that represents a category, Empath can provide new related terms using its neural embeddings. It also employs the use of crowd-sourcing to validate the terms that it considers are related. Along with the ability to create new categories, Empath comes with 200 built-in, pre-validated categories for common topics (e.g., neglect, government, social media).
SHAP (SHapley Additive exPlanation) is a tool that was developed by Lundberg and Lee [22] to determine the impact of each attribute on the output of a predictive model. It is based on Shapley values, a concept from game theory that determines a fair way to distribute the payoff for players that have worked in coalition towards an outcome [33].
Extreme Gradient Boosting is a decision-tree based ensemble algorithm that has become known for its speed and performance [5]. Decision trees are built sequentially so that each one reduces the errors of the previous one [35]. Random Forests is a decision-tree based ensemble algorithm with each tree built from a subset of the rows and columns of the dataset [34]. This allows for variation among the trees and results in lower correlation among their predictions [37]. Support Vector Machines are a supervised learning algorithm that finds a hyperplane that best separates the data points from two classes [14].
Artificial Neural Networks are computational networks that are inspired by the biological nervous system [10]. ANNs excel at prediction for data where the amount of information in each attribute is small and there are non-linear interactions among them. Deep learning models are a class of extensions to ANNs that have solved long standing prediction problems in image recognition and natural language [20]. Convolutional Neural Networks (CNNs) are a class of deep learning networks that were designed initially to work with images but work surprisingly well with sequence data such as texts as well. Long Short-Term Memory (LSTM) deep learning networks are a type of recurrent neural network designed to handle the long-term dependencies present in sequence prediction problems [4]. Understanding text often requires looking ahead (think of verbs in German) and so processing text in both directions, using a biLSTM, provides better results for language [6].
3 Experiments
Within a typical online forum, there are two different categories of texts. The first is a post, which initiates a discussion. The second is a set of comments responding to the post. For example, an individual may post saying that, in their opinion, a stock’s price is about to rise, with others respond by sharing their opinions in the same thread. Responders may agree with the original post, or disagree.
P&D is an information-based manipulation, artificially raising the price of a stock through the dissemination of false information. As shown in Figure 1, this manipulation strategy involves three different stages [19]. The operators of the scheme first purchase the stock that they are planning to manipulate (Accumulation). Once they have acquired enough shares, they will disseminate false information to make it appear more desirable, driving up the price (Pump). Once the price has risen to the desired level of profit, the operators sell off their shares before anyone uncovers that the information has no basis or the hype dies down (Dump).
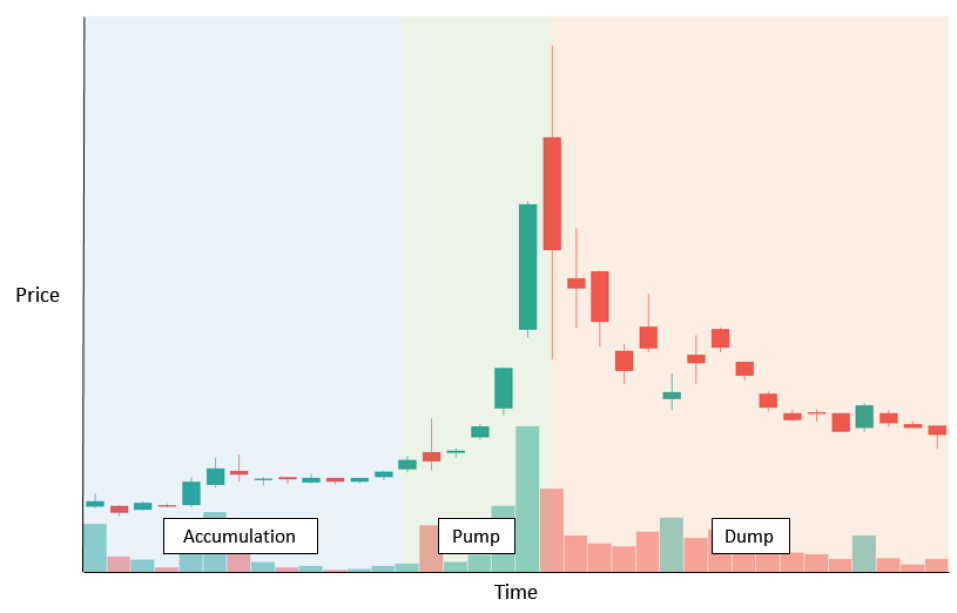
To identify P&Ds within the market, patterns associated with the scheme must be established. While the method of conducting a P&D may vary, two indicators that can identify them are sharp changes in price and volume [19]. A P&D will cause a significant price increase within a short amount of time, larger than the fluctuations that the stock typically experiences; followed by a decrease once the dump phase has begun. The volume also increases as the stock gains interest among investors during and after the dissemination phase. However, the volume will typically not immediately experience as sharp a decline as the price when the operators begin to dump their shares because of the reluctance of investors to believe that the price is illusory.
If the profile of a P&D manipulation can be detected in the market, then the post that putatively caused it can be straightforwardly labelled and its language patterns investigated. (Of course, it is possible that some of the apparent connections are spurious, but it is relatively unlikely that a post touting a particular stock will be disseminated exactly when the stock’s price and volume begin a sharp rise).
Labelling comments is more complex, since the comments may agree with the original post, or disagree. Only the language of those that agree can contribute to predicting a P&D event.
3.1 Data Sources
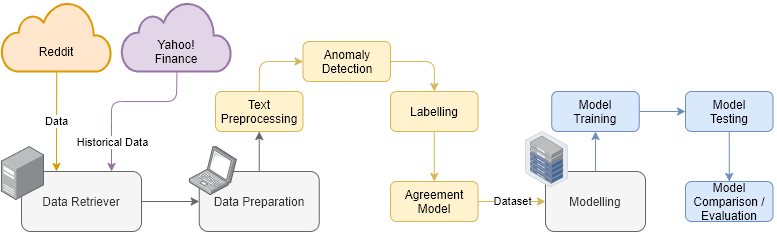
Two different data sources were utilized. The first is the popular online website Reddit, where users discuss the stock market. The second is Yahoo Finance, a financial market website that provides historical data about companies.
Reddit contains forums referred to as subreddits, each dedicated to the discussion of a specific topic. Popular forums for the discussions of stocks are r/pennystocks, r/wallstreetbets, r/stocks, r/RobinHoodPennyStocks, r/TheWallStreet. We use r/pennystocks and r/RobinHoodPennyStocks,
Yahoo Finance is a website provided by Yahoo for investors to access financial news, market data, and basic financial tools. Given a stock symbol or company name, it provides the relevant market data.
Classification techniques such as Extreme Gradient Boosting (XGBoost), Random Forests, Support Vector Machine (SVM), and Artificial Neural Networks (ANNs) were used to learn predictive models, and then to identify which attributes (i.e. words) are most predictive. Figure 2 shows the experimental workflow.
Data from Reddit and Yahoo Finance were collected daily for the period October 1, 2019, to June 28, 2020. A breakdown of the data is shown in Table 1. The majority of the data is retrieved from r/pennystocks, with about a third from r/RobinHoodPennyStocks. The number of comments is much larger than the number of posts, with posts making up only about 5% of the texts.
| Subreddit | Number of Posts | Number of Comments | Total |
|---|---|---|---|
| r/pennystocks | 12,049 | 234,149 | 246,198 |
| r/RobinHoodPennyStocks | 6,506 | 78,429 | 84,935 |
| Total | 18,555 | 312,578 | 331,133 |
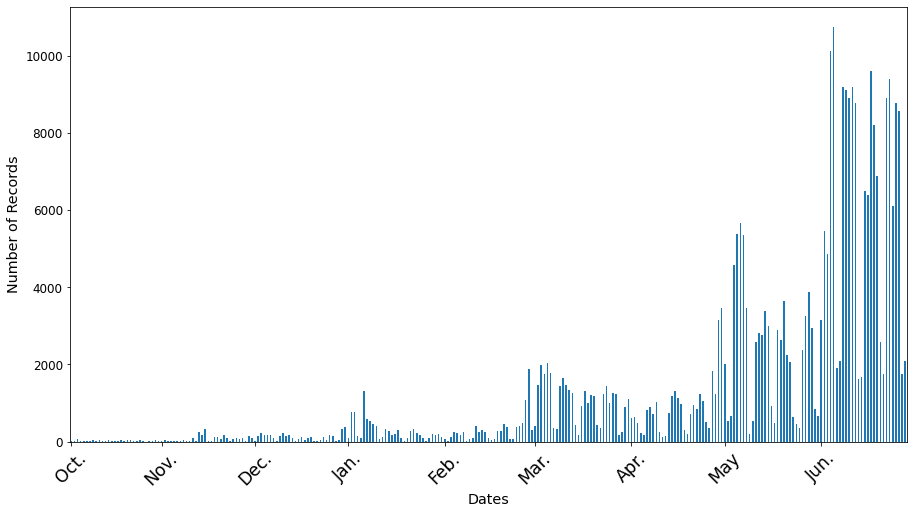
As shown in Figure 3, there was a sharp increase in the number of submissions over the period of data collection:
-
•
r/pennystocks - 139,000 Members 257,000 Members
-
•
r/RobinHoodPennyStocks - 52,000 Members 133,0000 Members
This seems to reflect an increase in amateur stock market investing because of the covid-19 pandemic, and a corresponding increase in manipulation. i.e, as manipulators look to take advantage of new, naive investors during the pandemic. Alerts and press releases by the SEC and the Canadian Securities Administrators warned new investors to be vigilant about the increasing number of P&D schemes that have occurred around that time [9, 28, 29].
The median number of words per post or comment was 22, and the total number of distinct words was 4,862.
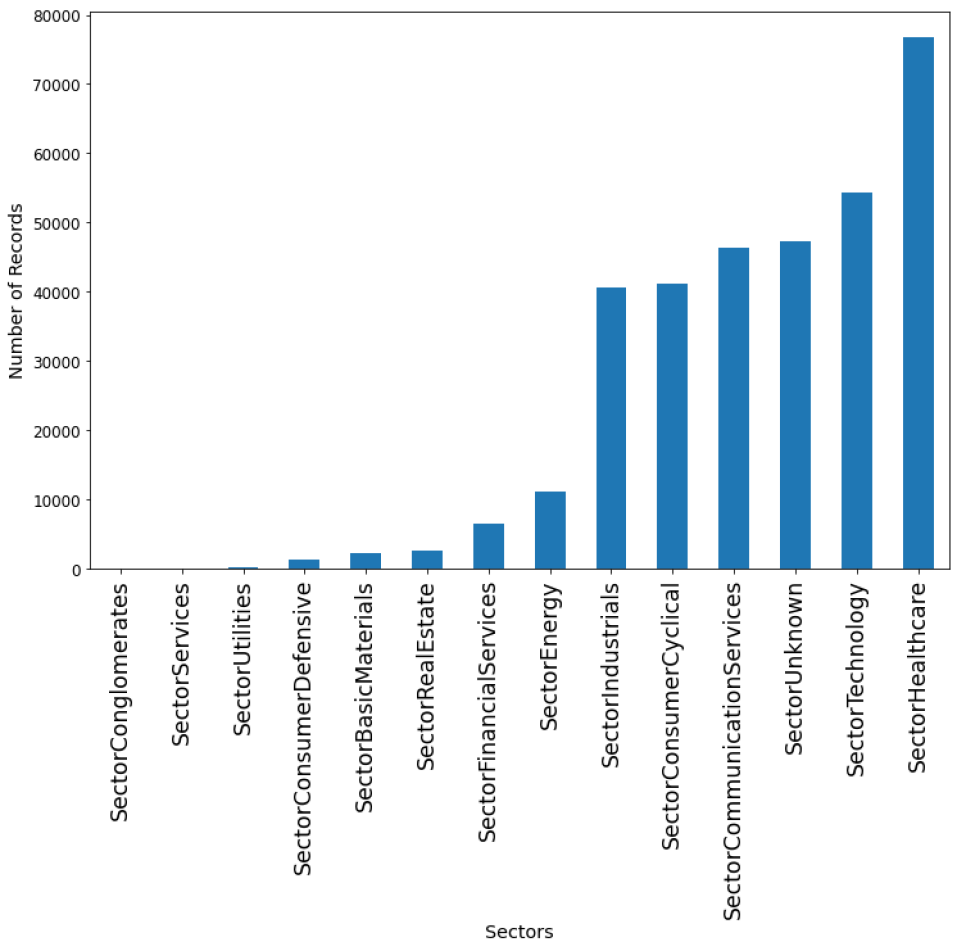
Replacing stock symbols by the market sector to which each business belongs allows us to see which sectors are discussed the most, and which are the targets of P&D. Figure 4 shows that healthcare stocks are the most mentioned, followed by technology stocks. The pandemic clearly had an effect on both attention to markets and manipulations. Temporal trends in the healthcare sector, Figure 5 , show an increase in online activity at the beginning of the pandemic, and then a further increase in the middle of 2020. Figure 6 shows that P&D manipulations also increased in 2020.
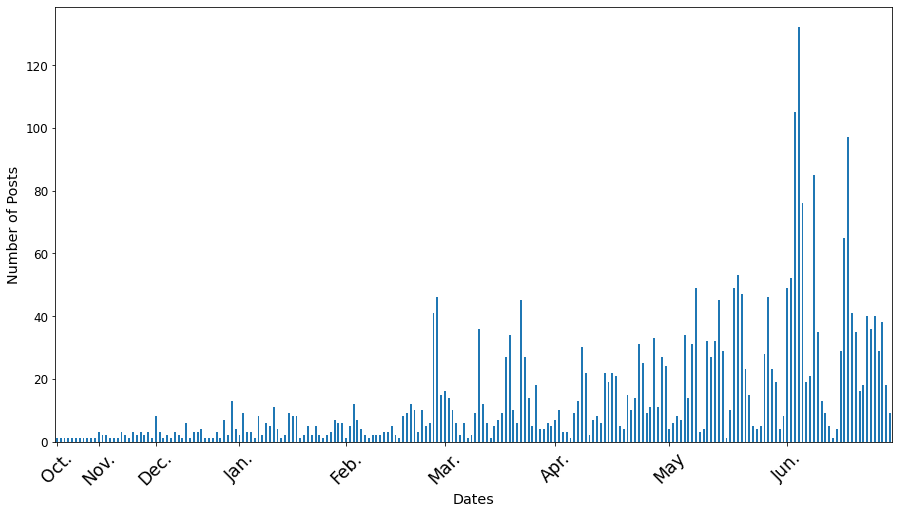
Table 2 shows the information collected for each post and comment.
| Feature | Description |
|---|---|
| Post Title | Title of the post. |
| Post ID | Unique identification code for post. |
| Post Author | Author of the post. |
| Post Created | Unix Timestamp of when post was submitted. |
| Post Body | Text of the post. |
| Comment ID | Unique identification code for comment. |
| Comment Author | Author of the comment. |
| Comment Created | Unix Timestamp of when comment was submitted. |
| Comment Body | Text of the comment. |
Data from Yahoo Finance was scraped using the yfinance tool [2]. Stock symbols were extracted from Reddit posts. This step is non-trivial and required regular expression extraction, and look ups against the publicly traded exchanges. Posts which mentioned more than one stock were discarded, partly because of the complexity of deciding which stock may be being touted, and partly because P&D posts typically focus on one particular stock they are pumping. If a stock symbol was found, yfinance was used to collect the financial information described in Table 3.
| Feature | Description |
|---|---|
| Open | Opening price of the stock for the given period. |
| High | Highest price for the stock within the given period. |
| Low | Lowest price for the stock within the given period. |
| Close | Closing price of the stock for the given period. |
| Volume | Total number of shares traded within the given period. |
| Market Sector | Associated industry that the company is in. |
| Market Capitalization | Total market value of the company’s outstanding shares. |
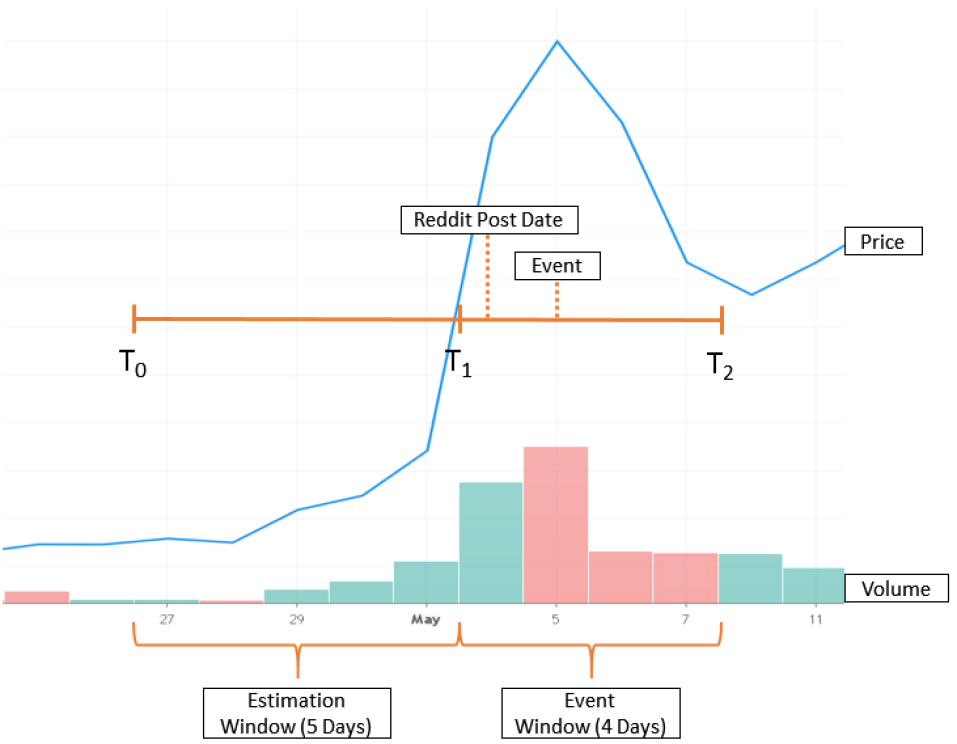
As shown in Figure 7, the daily Open, High, Low, Close, and Volume (OHLCV) data was collected over nine business days surrounding an event. Data was collected over five days before each post event to establish a baseline for price and volume. Penny stocks almost always shows minor variation in price and volume so this baseline is typically quite flat. The remaining four days contain the pump event (sharp increase) followed by a decrease in price and a slower decrease in volume. Sabherwal et al. [27] studied the effects of online message boards on market manipulation and found that dumps typically occur within four days and this is plausible because the manipulators want to sell as soon as the price reaches a peak.
Texts from subreddits were preprocessed using the following steps: remove URLs, expand contractions, remove HTML Tags, remove punctuation, remove extra whitespaces, remove numbers, lemmatization, and remove stopwords.
Stock symbols within the text were replaced by dummy stock names representing the market sector associated with each business. This is required because the name of the particular stock being pumped and dumped in one case has nothing to do with the name of the stock being used in another case – but there might be correspondences within sectors. Here is an example:
-
•
“AYTU perfect time to buy” “SectorHealthcare perfect time to buy”
3.2 Data Labelling
To label each post, stock data surrounding the day in which the post was submitted to Reddit were analyzed. If the market data exhibited that pattern associated with P&D (a notable rise from the time of the post, followed by a sharp drop) then the post was labelled accordingly. A rise was detected by calculating the average price and volume in the five-day window before the post. The daily average price (DAP) of the values was first calculated for each of the five days.
| (1) |
and then the baseline average price (BAP) was calculated by
| (2) |
The baseline average volume (BAV) was calculated by taking the average of the volume values over the estimation window.
| (3) |
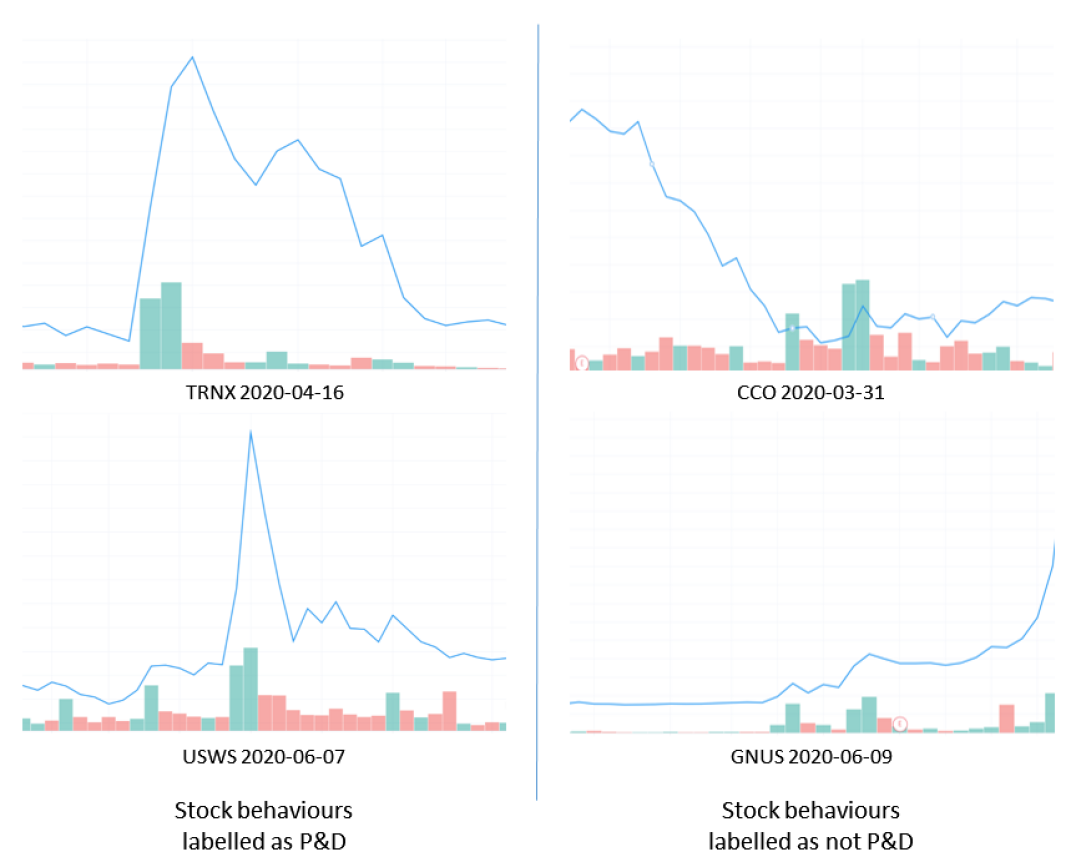
A threshold was set at two standard deviations above the average price within the five-day estimation window. Price increases above this threshold were considered to be pump events. A similar threshold was used to define a volume anomaly. Events were considered to be the result of P&D if they exceeded the threshold for both price and volume. Figure 8 shows a comparison of the stock behaviours labelled using this approach.
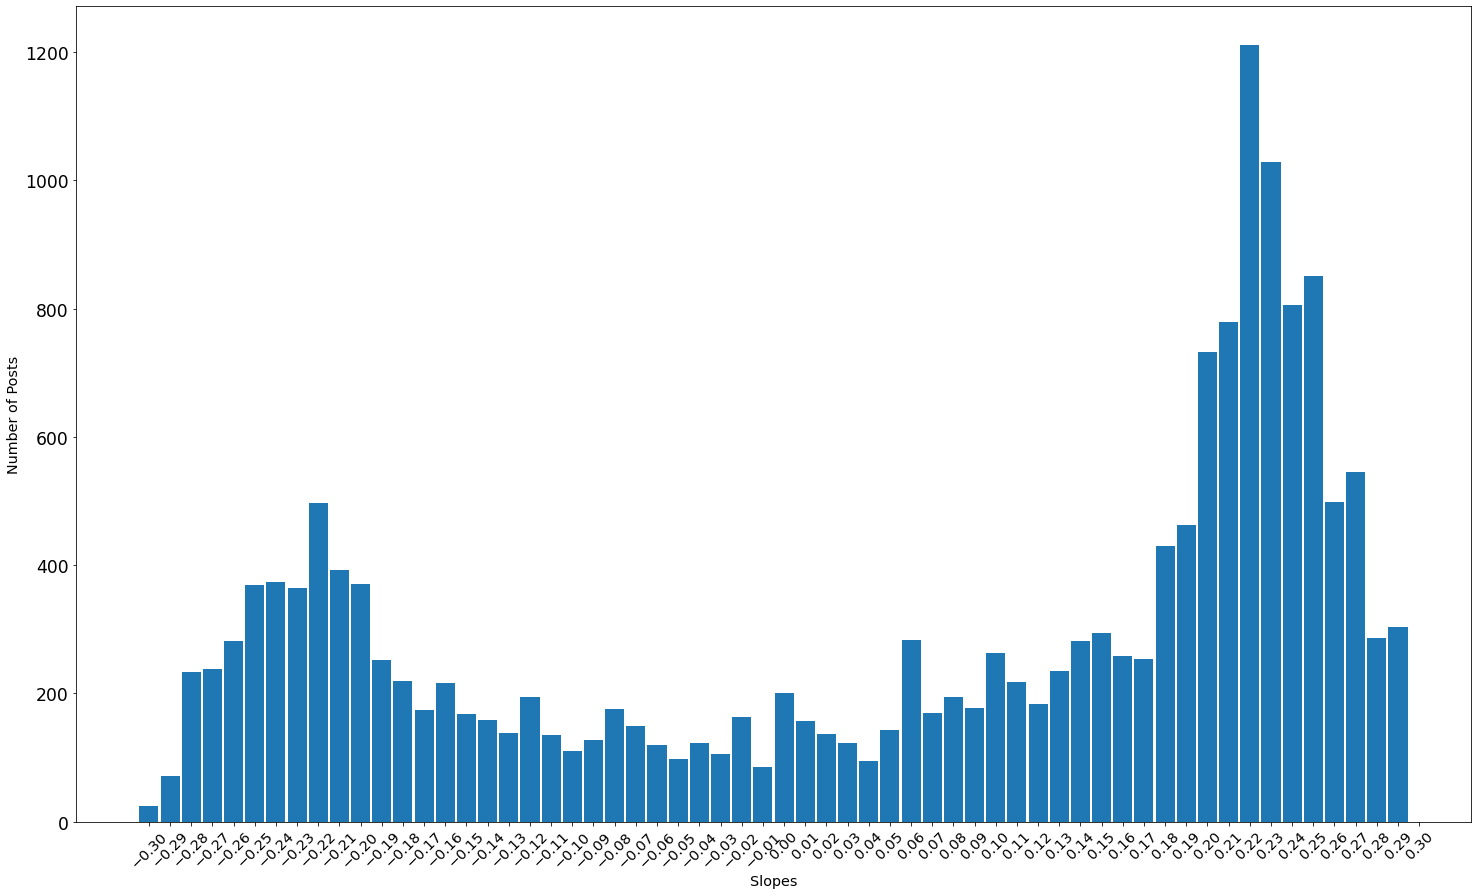
A sudden price rise or volume increase might coincide with a post, but is not necessarily caused by it. The rising region of each stock trend of a potential P&D event was min-max normalised, and its slope calculated. Steep price increases are more likely to arise from genuine information and less likely to have resulted from a single manipulation post, so the median slope across the entire dataset was calculated, and only slopes below the median were considered as potential P&D events. Figure 9 shows the distribution of stock price trend slopes from the entire the dataset. The median value is 0.18.
3.3 Agreement Model
The comments associated with the P&D post cannot all be labelled as examples of P&D language, since not all of them will be supportive of the post they are responding to. Manipulators, of course, will post comments in support of the post, either from the same identity or from others.
We developed an agreement model, using ideas from stance detection. This was done using Empath to generate a lexicon of agreement, seeding it with the words: bought, agree, positive, increasing, good, and now. Empath returned the words listed in Table 4.
| only | done | better | true | knew |
| besides | like | maybe | wanted | liked |
| also | important | buying | understand | good |
| understood | needed | work | because | successful |
| knowing | grateful | plus | much | reasonable |
| should | give | happy | course | glad |
| well | considering | anyway | agree | meaning |
| great | probably | sure | thought | guaranteed |
| more | honestly | positive | thankful | actually |
| agreed | special | doubt | guess | though |
| bet | buy | surpass | worth | |
| suppose | although | especially | definitely | |
| certain | figured | given | means |
Posts touting stocks also use a specialised vocabulary, shown in these examples.
-
•
“probably go to shoot up tomorrow”
-
•
“this bad boy just rocket”
-
•
“i will see you on the moon”
An extended lexicon was determined manually by inspecting posts associated with manipulation. Table 5 contains the list of words that were chosen using this approach.
| moon | fast | massive | rich | surprise |
| rocket | profit | top | easy | move |
| pump | rally | peak | early | load |
| soar | climb | worth | shoot | quick |
| jump | rise | sale | money | burst |
| pop | high | gain | breakout | drive |
| hype | spike | run | cash | nice |
| fly | go | up | hit | bank |
| awesome | confident | surpass | more | zoom |
| big | great | potential | advantage |
Comments were labelled as associated with pumping if they contained two or more of the agreement words, or if they were (visibly) authored by the original poster. The following are some examples of comments that were labelled as not P&D related based on the agreement model:
-
•
“it be the american dream to fall for snake oil salesman and then lose everything it be a story as old as humanity”
-
•
“clearly a pump and dump scheme”
-
•
“do not touch it if the chart look like a hockey stick”
This labelling of comments is limited by the completeness of the agreement lexicon, and also does not account for negations.
3.4 Modelling
The following predictors were used:
-
•
Extreme Gradient Boosting (XGBoost)
-
•
Random Forest (RF)
-
•
Support Vector Machine (SVM)
-
•
Artificial Neural Networks
-
–
Multilayer Perceptron (MLP)
-
–
Convolutional Neural Network (CNN)
-
–
Bidirectional Long Short Term Memory (BiLSTM)
-
–
In each case the standard performance measures (accuracy, precision, recall, F1-Score, confusion matrix) were calculated, as well as the Shapley values which rank words by their importance to the predictions.
4 Results
Table 6 shows the class distribution for the dataset. Less than 9% of the records are labelled as being P&D. This is typical of datasets where fraud is present; indeed it is striking that the rate of fraud is this high.
| Record Type | P&D | Not P&D | Total |
|---|---|---|---|
| Posts | 3,006 | 15,549 | 18,555 |
| Comment | 26,727 | 285,851 | 312,578 |
| Total | 29,733 | 312,142 | 331,133 |
The results of each of the predictive model are reported in Table 7 using 5-fold cross validation and upweighting the fraud class when the model permits it.
| Model | TP | FP | TN | FN | Accuracy | Precision | Recall | F1-Score |
|---|---|---|---|---|---|---|---|---|
| XGBoost Posts | 1728 | 6615 | 8934 | 1278 | 57.46 (3.73) | 20.71 (0.48) | 57.49 (0.68) | 30.45 (2.25) |
| XGBoost Posts and Comments | 2007 | 7646 | 7903 | 999 | 53.41 (1.42) | 20.79 (0.85) | 66.77 (1.58) | 31.71 (0.96) |
| RF Posts | 271 | 646 | 14903 | 2735 | 81.78 (0.51) | 29.55 (1.40) | 9.01 (0.52) | 13.81 (0.78) |
| RF Posts and Comments | 414 | 211 | 15338 | 2592 | 84.89 (0.69) | 66.24 (1.69) | 13.77 (0.47) | 22.80 (0.75) |
| SVM Posts | 1752 | 5263 | 10286 | 1254 | 64.88 (1.14) | 24.98 (0.76) | 58.28 (1.05) | 34.97 (1.16) |
| SVM Posts and Comments | 2125 | 4559 | 10990 | 881 | 70.6 (0.49) | 31.79 (0.43) | 70.69 (0.56) | 43.86 (0.57) |
| MLP Posts | 2382 | 1718 | 13831 | 624 | 87.38 (6.66) | 58.10 (11.65) | 79.24 (12.76) | 67.04 (12.12) |
| MLP Posts and Comments | 2103 | 2602 | 12947 | 903 | 81.11 (3.71) | 44.70 (4.28) | 69.96 (3.80) | 54.55 (4.36) |
| CNN Posts | 2373 | 1709 | 13840 | 633 | 87.38 (7.04) | 58.13 (12.02) | 78.94 (12.76) | 66.96 (12.37) |
| CNN Posts and Comments | 2304 | 2068 | 13481 | 702 | 85.07 (1.25) | 52.70 (2.33) | 76.65 (3.45) | 62.46 (2.64) |
| biLSTM Posts | 2297 | 2495 | 13054 | 709 | 82.73 (8.11) | 47.93 (9.92) | 76.41 (10.94) | 58.91 (10.82) |
| biLSTM Posts and Comments | 2288 | 2370 | 13179 | 718 | 83.36 (2.27) | 49.12 (3.25) | 76.11 (3.86) | 59.71 (3.54) |
The neural network models perform well as expected. Models such as XGBoost, Random Forests, and SVM had disappointing performance, and a heterogeneous stacked classifier combining their predictions did not improve on the performance of the individual predictors, suggesting that they make their errors on the same records.
At first glance, the ANN models using posts perform better than those using posts and comments. However, the standard deviations of the performance numbers show that the inclusion of comments provides stability for correctly identifying P&D posts. The best performing model overall is CNN, especially with comments included. Its precision is relatively low; of all the records that the model predicts to be P&D, only 52.7% are actually correct. If we look at the rate at which each class is predicted to be positive, a better outlook of the model is provided. Given a positive P&D text, the model has a 76.65% chance of classifying it correctly, whereas, if it is given a negative text, it has a 13.3% chance of classifying it incorrectly as positive. It is perhaps a little surprising that biLSTM did not perform best since they are typically strong predictors for natural language problems.
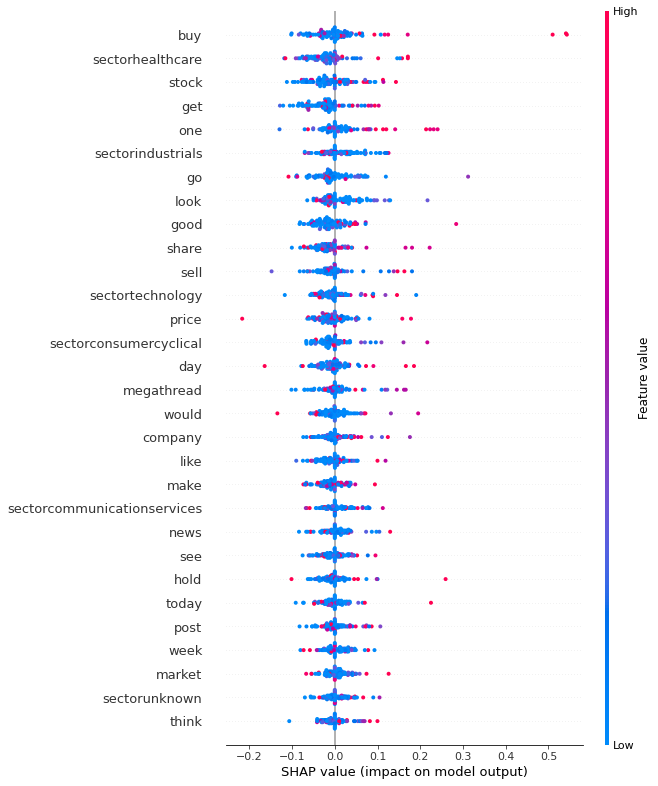
The SHAP Explainers produce diagrams that rank the attributes by their impact on outcomes. Figure 10 shows the diagram for the CNN predictor for posts and comments and the 30 most impactful words. Although the influence of any single word is inevitably weak, there are visible red dots to the right for many of these words, indicating that higher frequencies of these words are associated with P&D events. The names of the popular sectors are indicator of P&Ds, as are words from the agreement model such as “buy” and “go”. Across the best performing models, the same set of words emerge as the most impactful features (not shown).
Misclassifications by the model have different impacts depending on how and where it is used. For an ordinary investor, a false positive (a post predicted to be a P&D when it isn’t) means a missed opportunity for profit, but a false negative means a financial loss. For a regulatory body, a false positive is problematic, but a false negative less so. Table 8 shows some of the examples of misclassifications by the CNN model.
| Predicted Label | Actual Label | Misclassified Post |
|---|---|---|
| P&D | Not P&D | sectorunknown about to soar |
| P&D | Not P&D | sectorunknown fitness equipment maker owner of bow flex completely sell out of most retail store how be this look just buy in share |
| P&D | Not P&D | quick all in sectorcommunicationservices pump my first time actually do something right the lambos go to be green for gain |
| P&D | Not P&D | blast off look like gold and oil will be big player this i also suggest look at sectortechnology |
| P&D | Not P&D | sectorenergy drop time to buy it be drop below which be its day low be it a good time to buy |
| Not P&D | P&D | sectortechnology release patent news on thermal tech could be a mark sympathy play bust out over |
| Not P&D | P&D | sectorhealthcare do anyone understand why sectorhealthcare shoot up soo much i be not able to find any real catalyst |
| Not P&D | P&D | sectorhealthcare on the move this have potential reach today |
| Not P&D | P&D | sectorhealthcare to the moon |
| Not P&D | P&D | any thought on when to sell sectorenergy bought in late i be up after hour should i wait til tomorrow or sell as soon as possible in the am |
Some false positives, predicted to be P&D from the text, but without a corresponding market movement may be instances where the post failed to attract enough attention to cause a measurable market movement, or was so blatant that it was not credible to typical investors. Some false negatives may be because the posts were too short to contain the required two words, because the pumping took place on another platform or because a market movement happened to match the timing of the post.
5 Related work
The application of data analytics for detecting market manipulation is a relatively new in the field of finance. Most research has focused on detecting trade-based manipulation because it is most common [32]. Huang and Chang found that of the manipulation cases prosecuted in Taiwan from 1991 to 2010, 96.61% were trade-based, and only 3.39% were information-based [18]. Some examples detecting trade-based manipulation are: Ogut et al. [38] in the emerging Istanbul Stock Exchange, Wang et al. [32] for prosecuted manipulation cases reported by the China Securities Regulatory Commission, Cao et al. [7] using real trading data from four popular NASDAQ stocks with synthetic cases of manipulation (spoofing and quote stuffing), Cao et al. [36] using seven popular NASDAQ and LSE stocks data injecting ten simulated stock price manipulations, Diaz et al. [12] using manipulation cases pursued by the U.S. Securities and Exchange Commission (SEC) in 2003, and Golomohammadi et al. [16] trying to detect three groups of manipulation schemes: marking the close, wash trades, and cornering the market.
For information-based manipulation, Victor and Hagemann [31] looked at 149 confirmed P&D schemes coordinated through Telegram chats and pumped via Twitter. Using XGBoost, they built a model that achieved a sensitivity of 85% and specificity of 99%. They concluded that P&Ds were frequent among cryptocurrencies that had a market capitalization of $50 million or below and often involved trading volumes of several hundred thousand dollars within a short time-frame.
Mirtaheri et al. [23] looked specifically at forecasting P&Ds by combining the information from Twitter and Telegram. They manually labelled known P&D operation messages on Telegram, and then used SVMs with a stochastic gradient descent optimizer to label the remaining messages as P&D or not. They used Random Forests to detect whether a manipulation event was going to take place within the market. Their results showed that they were able to detect, with reasonable accuracy, whether there is an unfolding manipulation scheme occurring on Telegram. Their proposed model was able to achieve an accuracy of 87% and an F1-Score of 90%.
Some partially automated tools have also been developed. These flag suspicious activities that can then by investigated by regulators. Delort et al. [11] used Naive Bayes classifiers to examine collected messages from HotCopper, an Australian stock message board. They successfully identified messages of concern, but the number of false positives was too high to use the model in an automated way. Owda et al. [25] compared messages to lexicon templates of known illegal financial activities (e.g. Pump and Dump, Insider Information). They found that, of the 3000 comments that were collected on a daily basis, 0.2% were deemed suspicious.
6 Conclusion
The intersection of social media with low-cost trading platforms and naive investors has made market manipulation an attractive strategy. Pump&dump is particularly simple to implement since it requires only the dissemination of fictional information about the future prospects for a stock. This is particular easy for penny stocks where validating information is difficult for ordinary investors, and where relatively small purchase volumes can cause large price movements.
We investigate protecting investors, and assisting regulators, by building predictive models that label social media posts (and the responses they elicit) as potential drivers of P&D events. We do this by collecting posts and comments, developing a model for a P&D event based on patterns of price and volume changes, using the match between posts and P&D events to label posts, and extending this labelling to comments using an agreement model. Natural language predictors then learn the language patterns associated with P&D manipulations, so that new manipulations can be detected before they affect the market.
Data is imbalanced, since manipulations are rare, but our best predictive model achieves an F1-score of 62% and an accuracy of 85%. Improvements in performance are limited by potential coincidences between a post and a price and volume change that mimics a P&D, posts that fail to reach a sufficient audience to cause the desired buying behaviour, and natural language issues that arise from informal and short texts, and a specialised vocabulary used in stock discussion forums.
References
- [1] R.K. Aggarwal and Guojun Wu. Stock Market Manipulations. The Journal of Business, 79(4):1915–1953, July 2006.
- [2] Ran Aroussi. yfinance. https://aroussi.com/post/python-yahoo-finance, Accessed: 2021-09-02.
- [3] Kevin W. Bowyer, Nitesh V. Chawla, Lawrence O. Hall, and W. Philip Kegelmeyer. SMOTE: Synthetic Minority Over-sampling Technique. CoRR, abs/1106.1813, 2011.
- [4] Jason Brownlee. A Gentle Introduction to Long Short-Term Memory Networks by the Experts, Feb 2020. https://machinelearningmastery.com/gentle-introduction-long-short-term-memory-networks-experts/, Accessed: 2021-09-17.
- [5] Jason Brownlee. A Gentle Introduction to XGBoost for Applied Machine Learning, Apr 2020. https://machinelearningmastery.com/gentle-introduction-xgboost-applied-machine-learning/, Accessed: 2021-09-15.
- [6] Jason Brownlee. How to Develop a Bidirectional LSTM For Sequence Classification in Python with Keras, Aug 2020. https://machinelearningmastery.com/develop-bidirectional-lstm-sequence-classification-python-keras/, Accessed: 2021-09-18.
- [7] Yi Cao, Yuhua Li, Sonya Coleman, Ammar Belatreche, and T M McGinnity. Detecting Price Manipulation in the Financial Market. In Proceedings of the IEEE/IAFE Computational Intelligence for Financial Engineering (CIFEr), page 8, March 2014.
- [8] Carole Comerton-Forde and Tālis J. Putniņš. Stock Price Manipulation: Prevalence and Determinants. Review of Finance, 18(1):23–66, 03 2013.
- [9] Canadian securities regulators warn public of coronavirus-related investment scams, Mar 2020. https://www.securities-administrators.ca/aboutcsa.aspx?id=1878, Accessed: 2021-09-06.
- [10] James Dacombe. An introduction to Artificial Neural Networks (with example), Oct 2017. https://medium.com/@jamesdacombe/an-introduction-to-artificial-neural-networks-with-example-ad459bb6941b, Accessed: 2021-09-16.
- [11] Jean-Yves Delort, Bavani Arunasalam, and Cecile Paris. Automatic moderation of online discussion sites. International Journal of Electronic Commerce, 15(3):9–30, 2011.
- [12] David Diaz, Babis Theodoulidis, and Pedro Sampaio. Analysis of stock market manipulations using knowledge discovery techniques applied to intraday trade prices. Expert Systems with Applications, 38(10):12757–12771, September 2011.
- [13] Ethan Fast, Binbin Chen, and Michael S. Bernstein. Empath: Understanding Topic Signals in Large-Scale Text. In Proceedings of the 2016 CHI Conference on Human Factors in Computing Systems, pages 4647–4657, San Jose California USA, May 2016. ACM.
- [14] Rohith Gandhi. Support Vector Machine - Introduction to Machine Learning Algorithms, Jul 2018. https://towardsdatascience.com/support-vector-machine-introduction-to-machine-learning-algorithms-934a444fca47, Accessed: 2021-09-15.
- [15] Bilal Ghanem, Paolo Rosso, and Francisco Rangel. Stance detection in fake news a combined feature representation. In Proceedings of the First Workshop on Fact Extraction and VERification (FEVER), pages 66–71, Brussels, Belgium, November 2018. Association for Computational Linguistics.
- [16] Koosha Golmohammadi, Osmar R. Zaiane, and David Diaz. Detecting stock market manipulation using supervised learning algorithms. In 2014 International Conference on Data Science and Advanced Analytics (DSAA), pages 435–441, Shanghai, China, October 2014. IEEE.
- [17] Haibo He, Yang Bai, E. A. Garcia, and Shutao Li. ADASYN: Adaptive synthetic sampling approach for imbalanced learning. In 2008 IEEE International Joint Conference on Neural Networks (IEEE World Congress on Computational Intelligence), pages 1322–1328, 2008.
- [18] Yu Chuan Huang and Yao Jen Cheng. Stock manipulation and its effects: pump and dump versus stabilization. Review of Quantitative Finance and Accounting, 44(4):791–815, May 2015.
- [19] Josh Kamps and Bennett Kleinberg. To the moon: defining and detecting cryptocurrency pump and dumps. Crime Science, 7(1):18, December 2018.
- [20] Yann LeCun, Yoshua Bengio, and Geoffrey Hinton. Deep learning. Nature, 521(7553):436–444, May 2015.
- [21] Yingjie Li and Cornelia Caragea. Multi-task stance detection with sentiment and stance lexicons. In Proceedings of the 2019 Conference on Empirical Methods in Natural Language Processing and the 9th International Joint Conference on Natural Language Processing (EMNLP-IJCNLP), pages 6299–6305, Hong Kong, China, November 2019. Association for Computational Linguistics.
- [22] Scott M Lundberg and Su-In Lee. A Unified Approach to Interpreting Model Predictions. In I. Guyon, U. V. Luxburg, S. Bengio, H. Wallach, R. Fergus, S. Vishwanathan, and R. Garnett, editors, Advances in Neural Information Processing Systems 30, pages 4765–4774. Curran Associates, Inc., 2017.
- [23] Mehrnoosh Mirtaheri, Sami Abu-El-Haija, Fred Morstatter, Greg Ver Steeg, and Aram Galstyan. Identifying and Analyzing Cryptocurrency Manipulations in Social Media. preprint, Open Science Framework, February 2019.
- [24] Chris B. Murphy. Penny Stock, Aug 2020. https://www.investopedia.com/terms/p/pennystock.asp, Accessed: 2021-09-02.
- [25] Majdi Owda, Pei Shyuan Lee, and Keeley Crockett. Financial Discussion Boards Irregularities Detection System (FDBs-IDS) using information extraction. In 2017 Intelligent Systems Conference (IntelliSys), pages 1078–1082, London, September 2017. IEEE.
- [26] Ashwin Rajadesingan and Huan Liu. Identifying users with opposing opinions in Twitter debates. In William G. Kennedy, Nitin Agarwal, and Shanchieh Jay Yang, editors, Social Computing, Behavioral-Cultural Modeling and Prediction, pages 153–160, Cham, 2014. Springer International Publishing.
- [27] Sanjiv Sabherwal, Salil K. Sarkar, and Ying Zhang. Do Internet Stock Message Boards Influence Trading? Evidence from Heavily Discussed Stocks with No Fundamental News: Do Internet Stock Message Boards Influence Trading? Journal of Business Finance & Accounting, 38(9-10):1209–1237, November 2011.
- [28] Investor Alerts and Bulletins: Frauds Targeting Main Street Investors – Investor Alert, Apr 2020. https://www.sec.gov/oiea/investor-alerts-and-bulletins/ia_frauds, Accessed: 2020-09-06.
- [29] Press Release: SEC Charges Microcap Fraud Scheme Participants Attempting to Capitalize on the COVID-19 Pandemic, Jun 2020. https://www.sec.gov/news/press-release/2020-131, Accessed: 2020-09-06.
- [30] Matt Thomas, Bo Pang, and Lillian Lee. Get out the vote: Determining support or opposition from congressional floor-debate transcripts. In Proceedings of the 2006 Conference on Empirical Methods in Natural Language Processing, pages 327–335, Sydney, Australia, July 2006. Association for Computational Linguistics.
- [31] Friedhelm Victor and Tanja Hagemann. Cryptocurrency Pump and Dump Schemes: Quantification and Detection. In 2019 International Conference on Data Mining Workshops (ICDMW), pages 244–251, Beijing, China, November 2019. IEEE.
- [32] Qili Wang, Wei Xu, Xinting Huang, and Kunlin Yang. Enhancing intraday stock price manipulation detection by leveraging recurrent neural networks with ensemble learning. Neurocomputing, 347:46–58, June 2019.
- [33] Cody Marie Wild. One Feature Attribution Method to (Supposedly) Rule Them All: Shapley Values, Jan 2018.
- [34] Thomas Wood. Random Forests, Sep 2020. https://deepai.org/machine-learning-glossary-and-terms/random-forest, Accessed: 2021-09-16.
- [35] XGBoost Algorithm: XGBoost In Machine Learning, May 2020. https://www.analyticsvidhya.com/blog/2018/09/an-end-to-end-guide-to-understand-the-math-behind-xgboost/, Accessed: 2021-09-15.
- [36] Yi Cao, Yuhua Li, Sonya Coleman, Ammar Belatreche, and Thomas Martin McGinnity. Adaptive Hidden Markov Model With Anomaly States for Price Manipulation Detection. IEEE Transactions on Neural Networks and Learning Systems, 26(2):318–330, February 2015.
- [37] Tony Yiu. Understanding Random Forest, Aug 2019. https://towardsdatascience.com/understanding-random-forest-58381e0602d2, Accessed: 2021-09-16.
- [38] Hulisi Öğüt, M. Mete Doğanay, and Ramazan Aktaş. Detecting stock-price manipulation in an emerging market: The case of Turkey. Expert Systems with Applications, 36(9):11944–11949, November 2009.