Noise and Thermal Depinning of Wigner Crystals
Abstract
We examine changes in the depinning threshold and conduction noise fluctuations for driven Wigner crystals in the presence of quenched disorder. At low temperatures there is a well defined depinning threshold and a strong peak in the noise power with noise characteristics. At higher temperatures, the depinning threshold shifts to lower drives and the noise, which is also reduced in power, becomes more white in character. At lower temperatures, a washboard frequency appears when the system depins elastically or forms a moving smectic state; however, this washboard signal is strongly reduced for higher temperatures and completely disappears above the melting temperature of a system without quenched disorder. Our results are in good agreement with recent transport and noise studies for systems where electron crystal depinning is believed to arise, and also show how noise can be used to distinguish between crystal, glass, and liquid phases.
1 Introduction
When a collection of interacting particles is driven over quenched disorder, the system can exhibit a pinned phase, a depinning threshold, and a sliding phase [1, 2]. The existence of these phases can be deduced from changes in transport measures such as the velocity-force and differential resistance curves [1, 2, 3, 4, 5, 6, 7, 8]. If the particles maintain the same neighbors during the depinning and sliding process, the depinning is considered elastic and is associated with specific scaling features in the velocity-force curves [1, 2, 9, 10], while if there is tearing or mixing of the particles, the behavior is plastic and can produce multiple steps or jumps in the transport curves [1, 2, 9, 11]. In the sliding phase, there can also be dynamical transitions between different types of plastic flow or fluidlike flow, as well as dynamical ordering transitions where the driven particles move so rapidly over the substrate that the effectiveness of the pinning is reduced and a disordered system can organize into a moving crystal or smectic state [2, 12, 13, 14, 15, 16, 17, 18, 19, 20]. When thermal effects are included, additional behaviors can occur both during depinning and in the sliding states. In general, sharp depinning thresholds become rounded due to thermal creep; however, a peak in the differential velocity can still arise near the depinning threshold due to a transition from creep to sliding dynamics [1, 2, 13]. If the temperature is higher than the melting temperature of the quenched disorder-free system, a system containing quenched disorder will always be in a disordered state, and can form a glass phase with thermal creep or a fluctuating liquid state at high drives [2, 13, 21, 22].
Another method to examine the driven dynamics is to measure changes in the noise for systems in which time series of the velocity or density fluctuations can be obtained as a function of drive [2, 4, 17, 23, 24, 25, 26, 27, 28, 29, 30, 31, 32, 33]. One of the most common characterization techniques is to determine the power spectrum of the fluctuations and to measure the noise power over some frequency range. For elastic depinning or ordered moving states where the particles maintain a fixed set of neighbors and travel at speed , there is typically a narrow band noise signature containing peaks at specific frequencies that are associated with the average spacing between the particles [2, 4]. Additional peaks appear at higher harmonics of these characteristic frequencies. Narrow band noise signatures have been observed for sliding charge density waves [4], superconducting vortex lattices [17, 26, 27, 28, 34], moving charge crystals [33], and skyrmion systems [30, 35]. In some cases it is possible to observe multiple frequencies when the system is broken up into several large sections that locally behave elastically but globally provide multiple degrees of freedom, permitting switching behavior to occur [33, 36]. If the depinning is strongly plastic, the narrow band noise signal is lost and is typically replaced by noise with [2, 17, 25, 27, 28], while for a fluid the noise power is often low and the fluctuations have white noise characteristics with . In other cases, the fluctuations are Lorentizan and the noise has a shape at low frequencies but becomes white above a characteristic frequency that is associated with the average time between collisions of particles with pinning sites [2]. Broad band noise has been observed near the depinning transition for superconducting vortices [2, 17, 25, 28], magnetic skyrmions [30, 32], and charge crystals [33, 37]. The noise measurements can also be used to identify a transition between different dynamical states such as plastic flow to dynamically ordered flow. In this case, noise occurs in the plastic flow phase just above depinning, but at higher drives there is a crossover to narrow band noise as dynamical ordering emerges [2, 17, 28, 30]. These different noise features can be modified significantly when thermal effects become important [2].
Another example of an assembly of particle-like objects that can be coupled to quenched disorder and driven is electron crystals or Wigner crystals [38, 39, 40, 41, 42], where transport measures provide evidence for a conduction threshold that is consistent with the existence of a depinning transition [39, 40, 43, 44, 45, 46, 36, 47, 48]. Recently, a growing number of materials have been identified that can support Wigner crystals, such as moirè superlattices [49, 50], transition metal dichalcogenide monolayers [51, 52, 53], and systems where Wigner crystals are stable at zero magnetic field [54]. It would be interesting to examine conduction and noise measures as a function of drive and temperature in these new systems. Previous experiments that showed evidence of a conduction threshold also revealed a large increase in the conduction noise just above depinning [46], and previous numerical studies of driven Wigner crystals also showed both a conduction threshold and noise features near depinning followed by a crossover to narrow band noise at higher drives [55]. Brussarski et al. [56] examined the transport and noise of Wigner crystals near depinning as function of temperature, and found that at low temperature, there is a sharp depinning threshold that is correlated with a large peak in the noise power. Additionally, the noise near depinning is of form. As the temperature is increased, the depinning threshold shifts to lower values and the peak noise power is also reduced. This suggests that at higher temperature, the system forms a Wigner liquid in which the correlated motion associated with glassy or plastic flow phases and large noise power is lost. Noise studies have also been performed near the metal-insulator transition, which could be associated with a change from a Wigner glass to a Wigner liquid, and a drop in the noise power is observed at higher temperatures where a fluid phase may be present [57, 58]. Particle-based simulations across a Wigner glass to Wigner fluid crossover show high power noise in the Wigner glass state and lower noise power with a white spectrum at higher temperatures in the fluid state [59]. Thermal effects and thermal melting in Wigner crystals have also been extensively studied [60, 61, 62, 63, 64], so it should be feasible to perform experimental noise and transport measures across a thermal melting transition while the system is being driven.
In this work, we consider thermally induced transport and noise measurements for a two-dimensional (2D) electron system driven over quenched disorder. Previous work on this system focused on the case, and showed that for plastic depinning, there is strong noise with a peak in the noise power near the depinning transition, followed by a drop in the noise power and a transition to white or narrow band noise at high driving where a moving smectic or moving crystal phase emerges [55, 65]. Here we find that as we increase the temperature, the depinning threshold decreases and the noise power drops, in agreement with experiments. Additionally, we find that the narrow band noise visible for at high drives is strongly reduced at higher temperatures and vanishes above the temperature at which the system melts in the absence of quenched disorder. This suggests that narrow band noise signals may only be accessible at temperatures well below melting. We map out the dynamic phase diagram as a function of drive versus temperature and show that at there is a divergence in the drive at which a transition to ordered or partially ordered flow occurs, similar to the dynamic phase diagram proposed by Koshelev and Vinokur for driven superconducting vortex systems [13, 22]. For the case of elastic depinning, we find a thermally induced creep regime in which the lattice moves by one lattice constant at a time, and show that a narrow band signal can still arise even in the creep regime. The spectral peaks become sharper and shift to higher frequencies with increasing drive, but the narrow band signature is lost with increasing temperature even before the system reaches the clean melting temperature .
2 Simulation and System
We model a 2D classical Wigner crystal with charge density , where is the number of electrons and is the system size. We employ periodic boundary conditions in the and directions, and the sample contains randomly placed pinning sites modeled as short range attractive wells with a density of . Throughout this work we fix and . At and in the absence of quenched disorder, the charges form a triangular lattice that has a well defined melting transition temperature [66]. Additionally, when there is a well defined quenched disorder strength above which the system disorders [66]. We represent the charges using a previously studied model [55, 67, 65, 66, 68, 69, 70, 71], where the equation of motion for charge is
| (1) |
Here is a damping term and is the long range Coulomb repulsion between charges of magnitude . As in previous work [55, 71], we employ a Lekner summation to evaluate the long range interactions. The second term on the right hand side represents pinning sites modeled as finite range parabolic traps that impart a maximum pinning force of at radius . The thermal fluctuations are applied with the term , which has the following properties: and . The initial positions of the charges are obtained through simulated annealing at zero drive. Once the system has been initialized, we apply a driving force representing an applied voltage. The drive can be set to a constant value, in which case we wait for the system to reach a steady state before measuring the average velocity per charge or obtaining a time series of the velocity to examine the temporal fluctuations. By considering a range of drives and measuring the average velocity at each drive, we can create a current-voltage curve. If there is a magnetic field present, the changes experience an additional force that can create a Hall angle for the electron motion. This effect is generally small and we neglect it in the present work, but we have studied it in detail elsewhere [71].
3 Elastic and Plastic Regimes
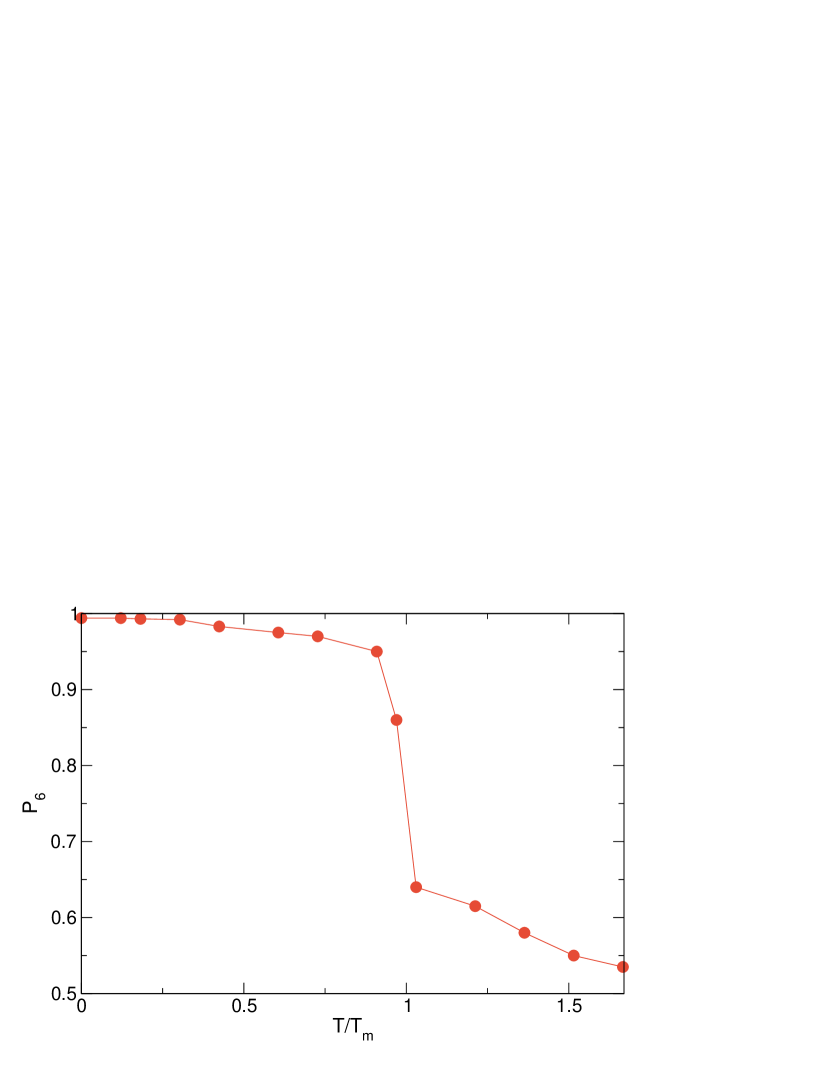
In Fig. 1 we plot the fraction of six-fold coordinated charges versus temperature for a system with no quenched disorder. The melting temperature is defined to be the temperature at which a proliferation of topological defects or non-sixfold coordinated charges occurs. For , is close to , as expected for a triangular lattice, while for , a large number of fivefold and sevenfold coordinated charges appear, causing to drop.
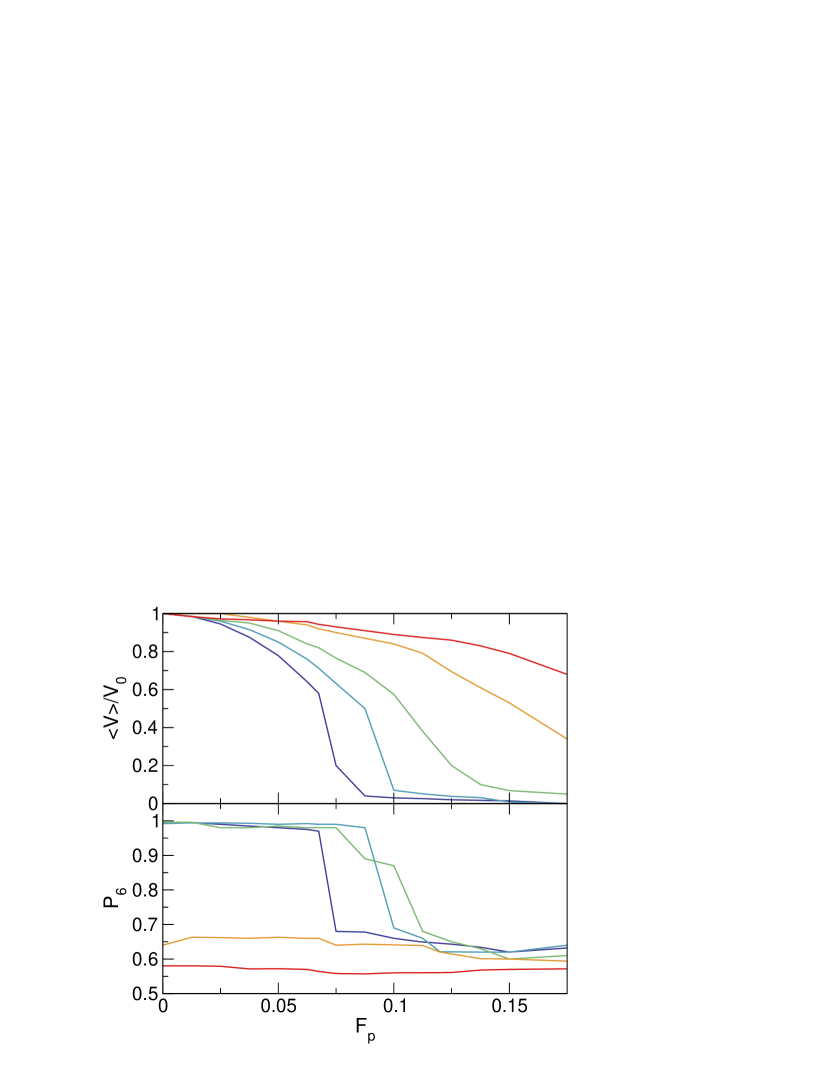
Once we have defined by measuring a clean system, we introduce quenched disorder in order to study the conduction noise and transport response above and below for varied disorder strengths . We apply a constant drive with to samples with different and measure the time average velocity per charge over simulation time steps. When , the charge velocity is identical to the driving force, , so a measurement of indicates that the flow of the charges has reached the pin-free limit. In Fig. 2(a), where we plot versus , at there is a large drop in near . Figure 2(b) shows the corresponding values of versus , where for there is a well defined transition from an ordered Wigner crystal to a disordered Wigner glass, and the proliferation of defects correlates with the velocity drop in Fig. 2(a). At , the overall velocity is higher than for the sample due to the lowering of the effectiveness of the pinning by the thermal fluctuations. Additionally, the pinning strength required to disorder the system is shifted upward to a value close to , which is again due to the partial reduction of the pinning effectiveness by the thermal fluctuations. A similar trend occurs for , where the velocity is higher. For , the system is disordered for all values of and the velocity is even higher but has a gradual drop with increasing , and the same trend occurs for . A more detailed study of the general phase diagram for the disordered and ordered phases as a function of pinning strength versus temperature appears in Ref. [66]. The results in Fig. 1 and Fig. 2 indicate that the system exhibits three distinct regimes. These are an ordered or crystal regime containing sixfold-coordinated charges, which occurs at low temperatures or low pinning strengths; a disordered or plastic regime where the system has low mobility and is strongly affected by the pinning; and a high temperature fluid phase where the effectiveness of the pinning is reduced and the system is in a strongly fluctuating state. In terms of transport, in the presence of pinning the ordered state exhibits elastic depinning in which the charges maintain their same neighbors. The glass state undergoes plastic depinning, and the fluid state does not have a pinned phase but can still have a regime in which the charges are trapped for a time before thermally hopping out of the pinning sites.
4 Transport and Noise in the Plastic Regime
We next examine the noise and transport in the three regimes identified above. We consider samples with , a pinning strength at which the charges are disordered for , so the system is in a strongly disordered glass phase. The plastic depinning that occurs in this regime was studied in detail in [66], where a pinned phase, a filamentary flow phase, a disordered flow phase, and a dynamically ordered moving smectic phase appear in sequence as a function of increasing drive.
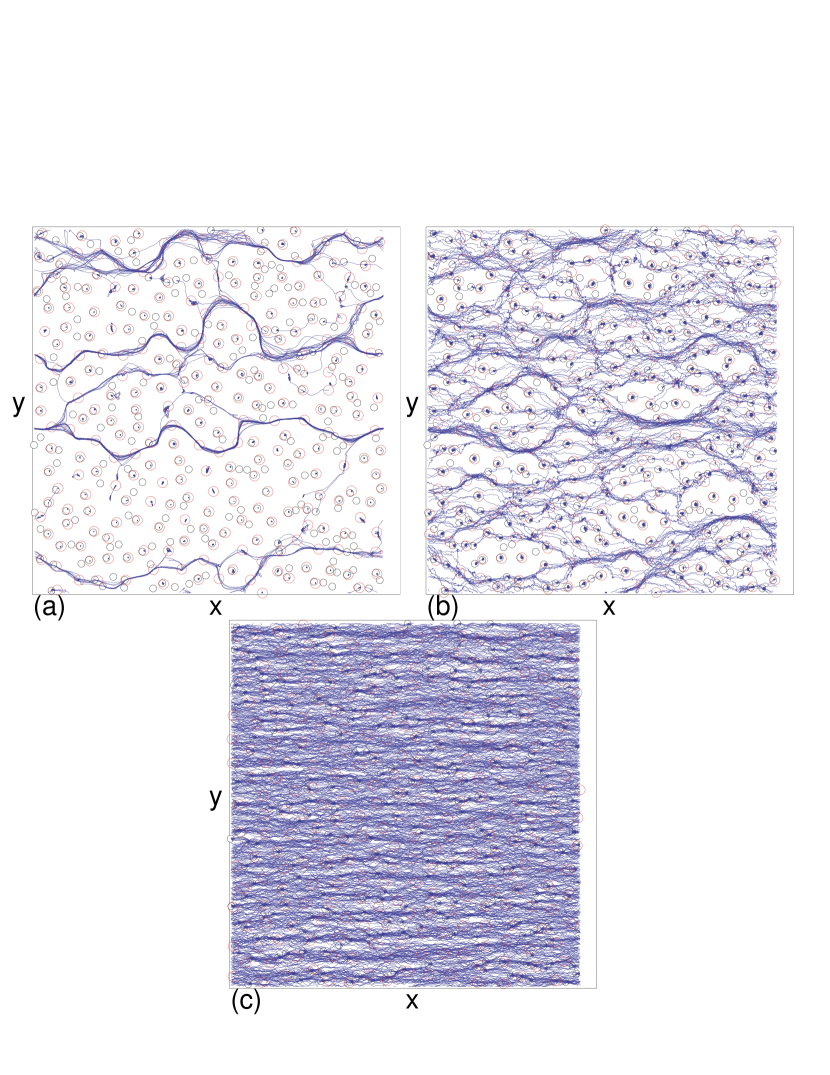
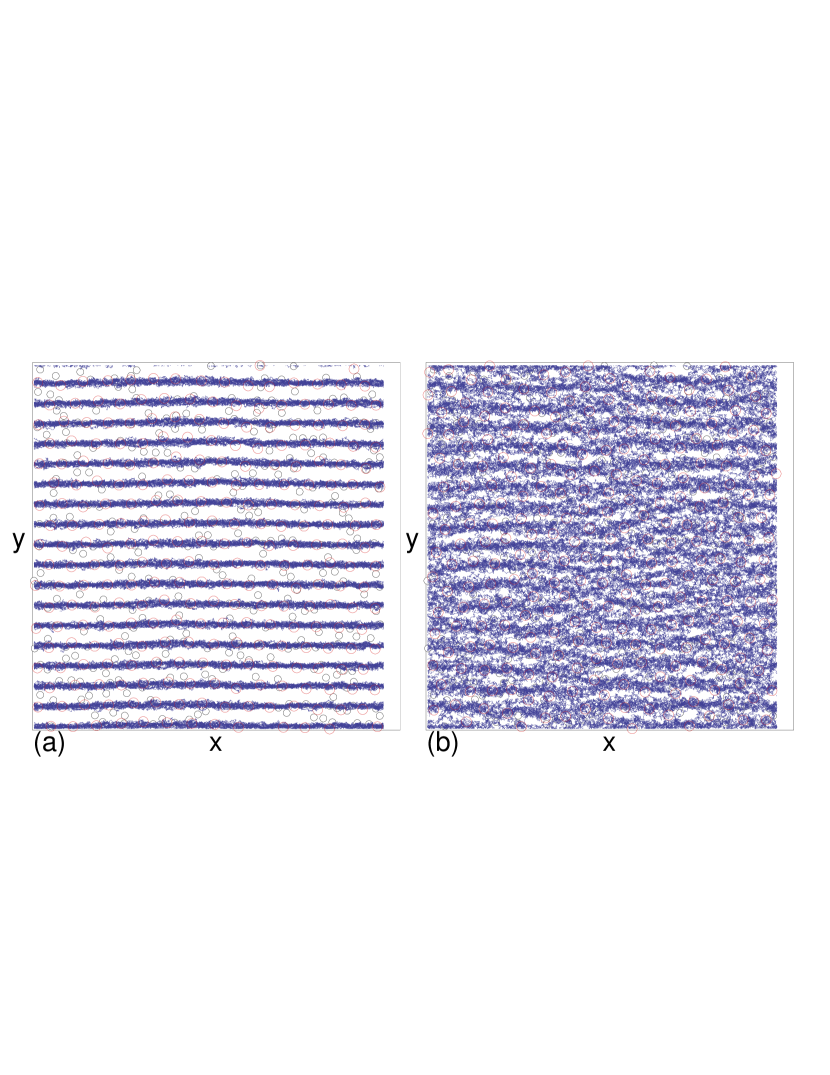
In Fig. 3(a) we show a snapshot of the charge locations, pinning site locations, and trajectories in the plastic flow regime for at , where a portion of the charges are moving in a series of well defined channels, with occasional jumps between the channels when certain channels open or close again. In general, for strong pinning, at low temperature the system exhibits channel flow just above depinning, similar to that studied in other systems at zero temperature. Figure 3(b) shows the same system at where there is a combination of channel flow and random thermal hopping, indicating that as the temperature increases, there is a transition from one-dimensional (1D) channels to two-dimensional (2D) flow. In Fig. 3(c), at the motion is 2D and fluidlike. For higher temperatures, the images look similar to what is shown in Fig. 3(c).
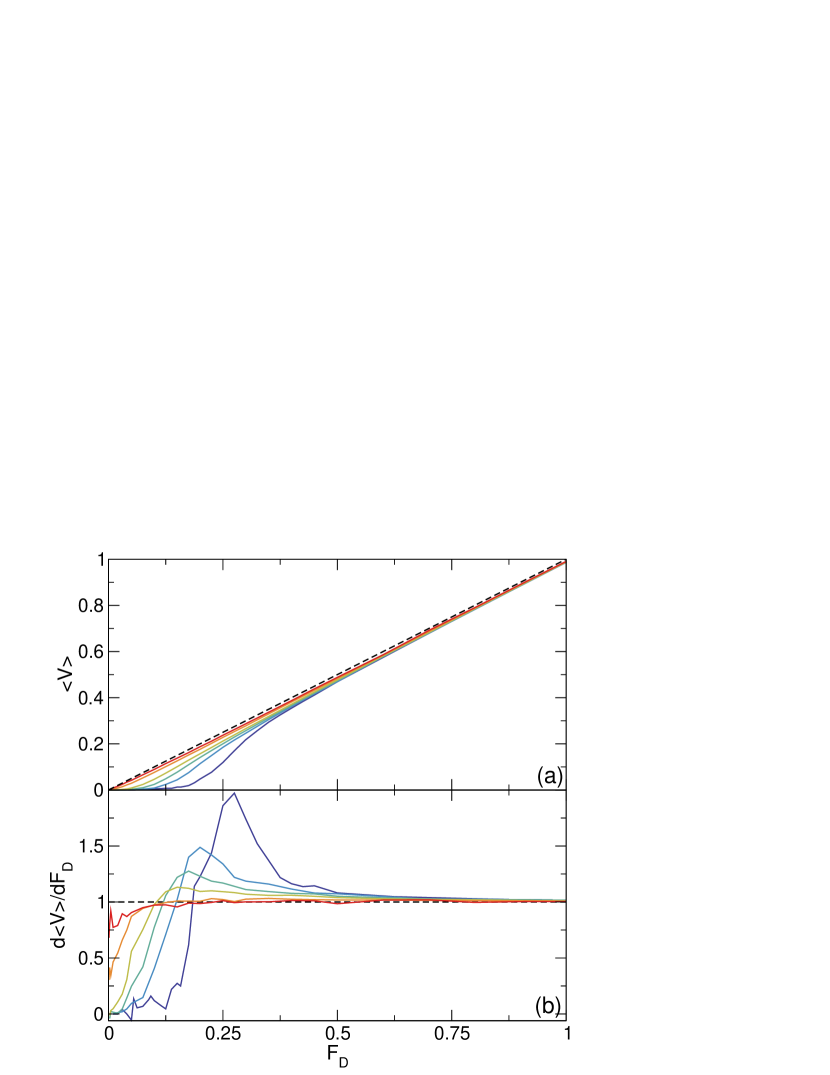
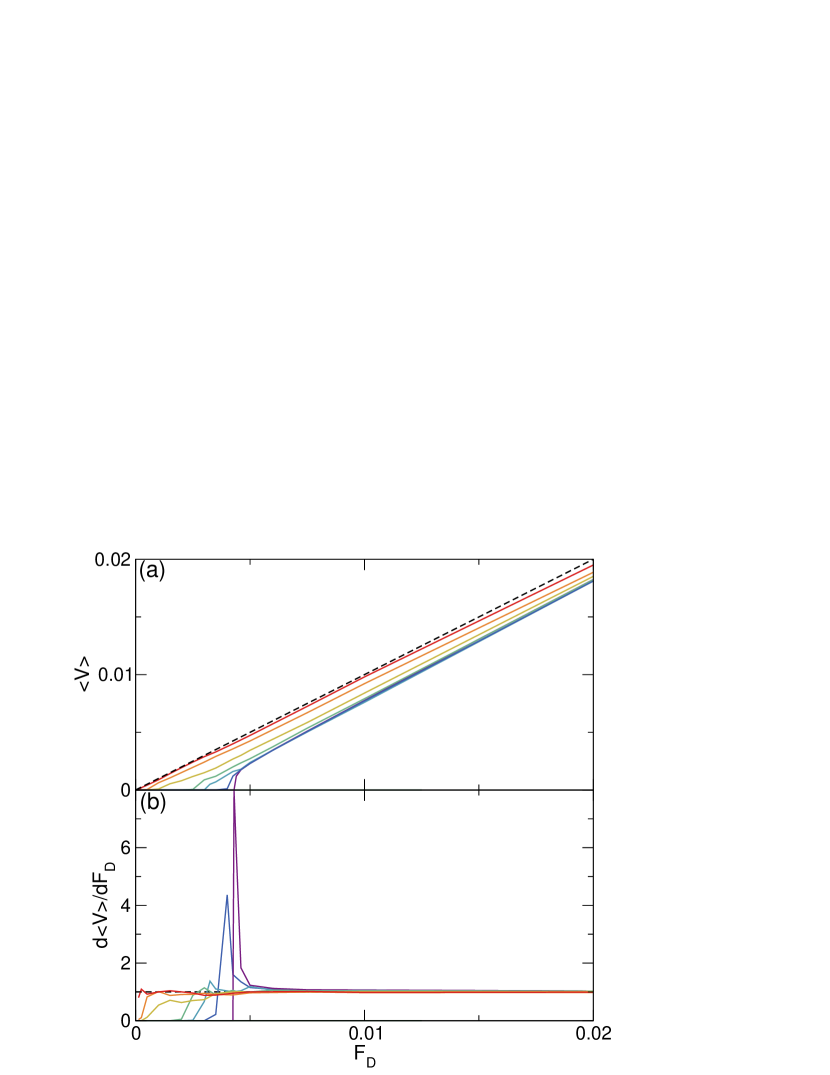
In Fig. 4(a) we plot versus for the system in Fig. 3 at , , , , , and . For the lower temperatures, there is a well-defined depinning threshold followed by a nonlinear regime, while when , the threshold is replaced by a creep regime and the nonlinear regime at higher drives persists. At the highest drives, all of the curves approach the pin-free limit. In Fig. 4(b) we show the corresponding versus curves, where for there is a peak in due to the S shape of the velocity-force curves. Similar peaks in the differential conductivity were observed for driven superconducting vortices in the plastic flow regime [12, 17, 21, 22]. For , the peaks are lost and a creep regime appears. The dashed line is the differential conductivity for the pin free system, and all of the curves approach this value at high drives. We note that for , at low drives there are a number of jumps in the conduction as well as a few regimes of negative differential conduction. This arises due to a filamentary flow channel effect that is described in more detail in [65]. For , the jumps associated with the filamentary flow phase are lost and a single large peak in appears in the plastic flow regime where there is a combination of moving and pinned charges.
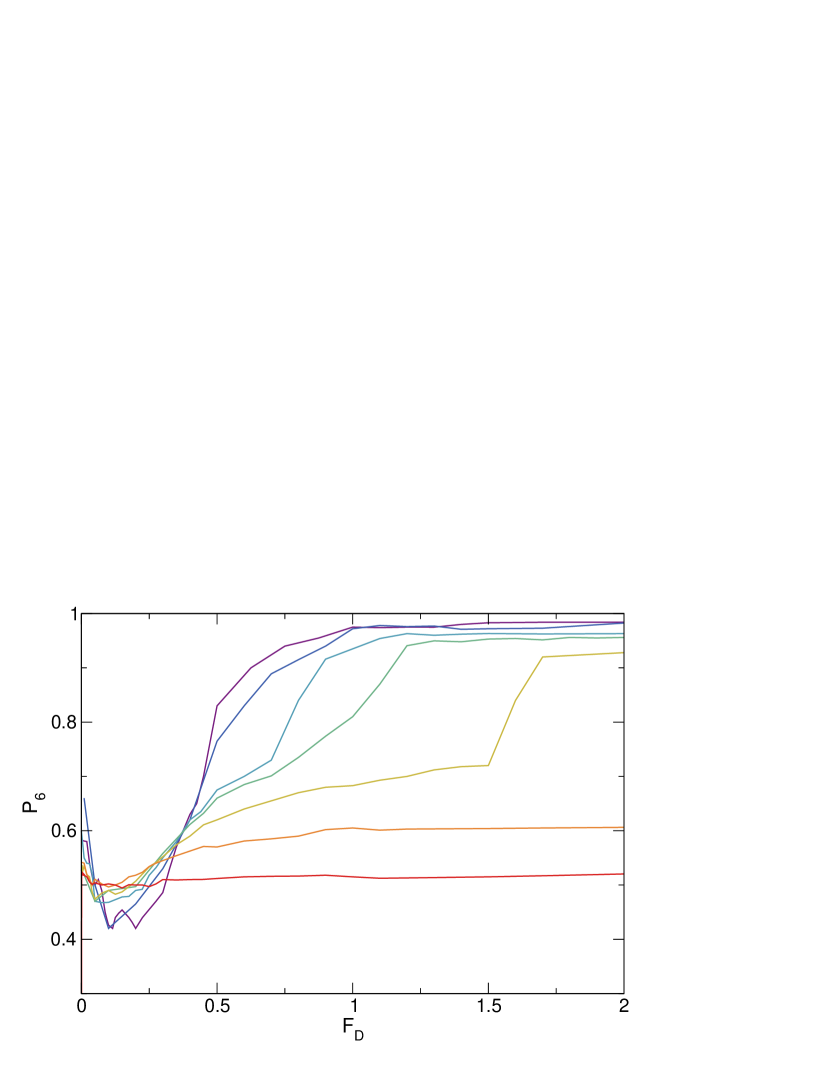
In Fig. 5 we plot versus for the system in Fig. 4 for , , , , , , and . For there is an initial dip in at the onset of plastic flow, and at high drives where starts to flatten, approaches values of or higher as the system forms a moving smectic phase. In the moving smectic state, the charges move in well defined channels and a small number of dislocations are present that have their Burgers vectors aligned with the driving direction [2, 55, 65]. As increases further, the drive at which the smectic state emerges shifts to higher values of , and for , the system no longer forms a moving smectic but instead becomes a moving fluid.
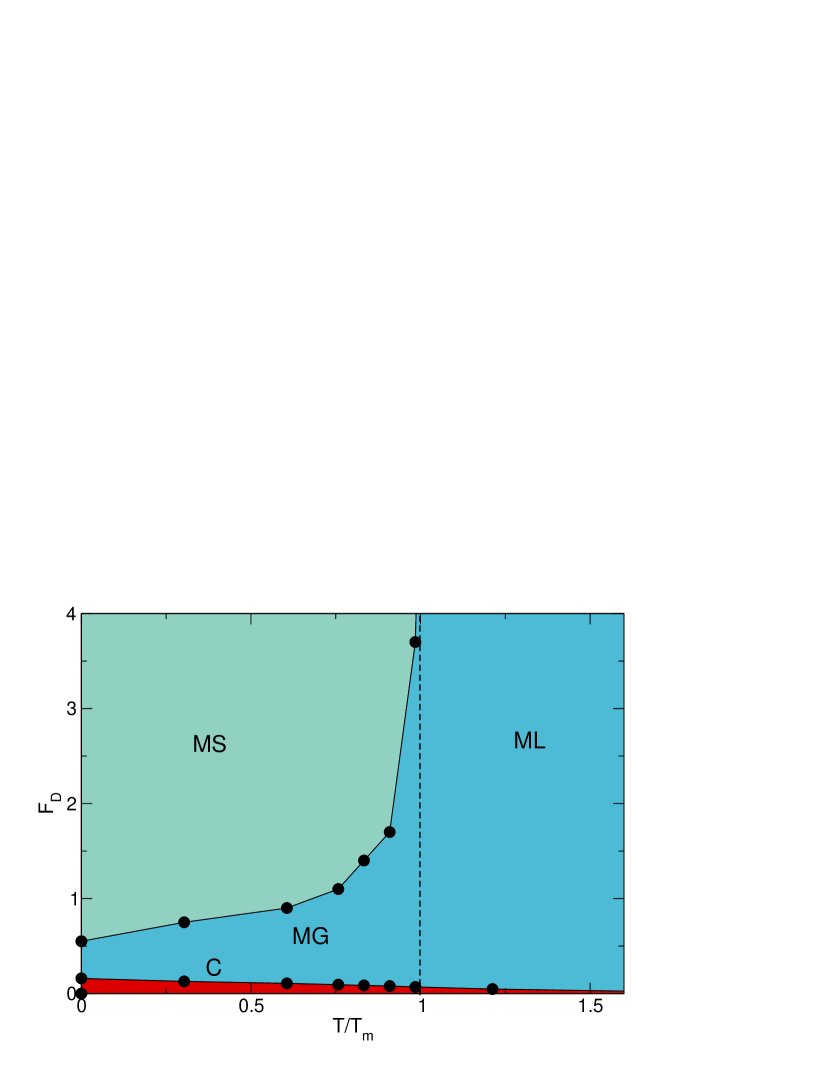
From the features in the transport curves and plotted in Figs. 4 and 5, we construct a dynamic phase diagram of the evolution of the different phases as a function of versus in Fig. 6. At low drives we find a pinned or creep regime denoted C, where . The dynamically ordered moving smectic phase MS appears when . The disordered regime is where the system is structurally disordered but moving, and it can be either a moving glass MG for , or a moving liquid ML for . The overall features of the phase diagram are similar to those observed in driven superconducting vortex systems with quenched disorder, as first proposed by Koshelev and Vinokur [13], where the transition between the MG and MS states shifts to higher drives as is approached. In Ref. [13], the transition line from the disordered to moving ordered phase was argued to be proportional to , where is some prefactor and the moving ordered phase can be described in terms of having an effective temperature that is decreasing toward zero. This picture assumes the formation of a moving crystal at high drive, and is somewhat modified in our system since the moving state we observe is a smectic in which the dynamic fluctuations are anisotropic [16]. We find that a better fit to the transition line in our case is , which is likely due to the anisotropic nature of the moving smectic.
Now that we have established the dynamic phase diagram as a function of drive versus temperature, we can ask how the velocity fluctuation power spectra change as a function of and . The power spectrum as a function of can be calculated using the time series of the velocity fluctuations,
| (2) |
At the noise has a signature with , in agreement with recent experiments [56]. The noise power is reduced at high drives and shows a crossover to a narrow band signature when the system forms a moving smectic phase; however, the experiments do not detect a narrow band noise signature at higher drives, suggesting that thermal effects could be coming into play.
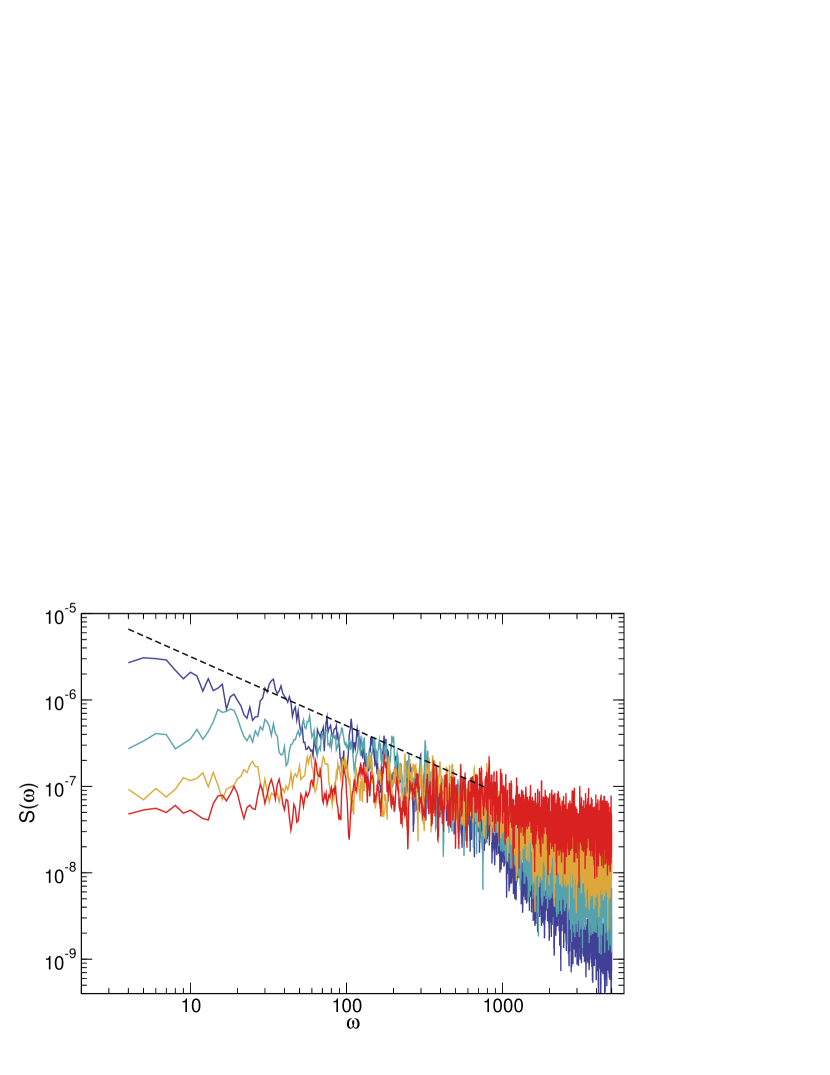
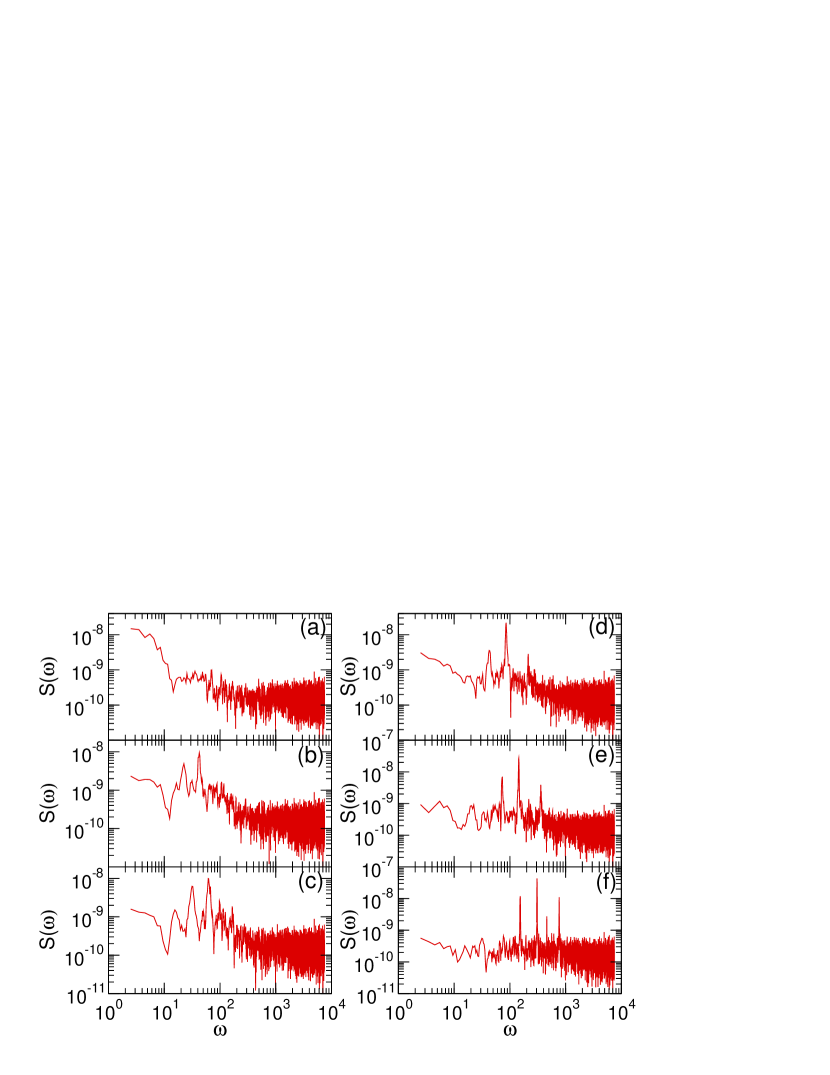
In Fig. 7 we plot power spectra of the velocity time series for the system in Fig. 6 at a drive of for , , , and . For , the low frequency noise has a form, where the dashed line is a fit with , while at higher frequencies the noise tail has . At , the lower frequency noise power is reduced and drops closer to , the value expected for white noise; however, the high frequency noise still has a form. For higher , the low frequency noise power is further reduced while the higher frequency noise power is enhanced, and the spectrum becomes much whiter overall.
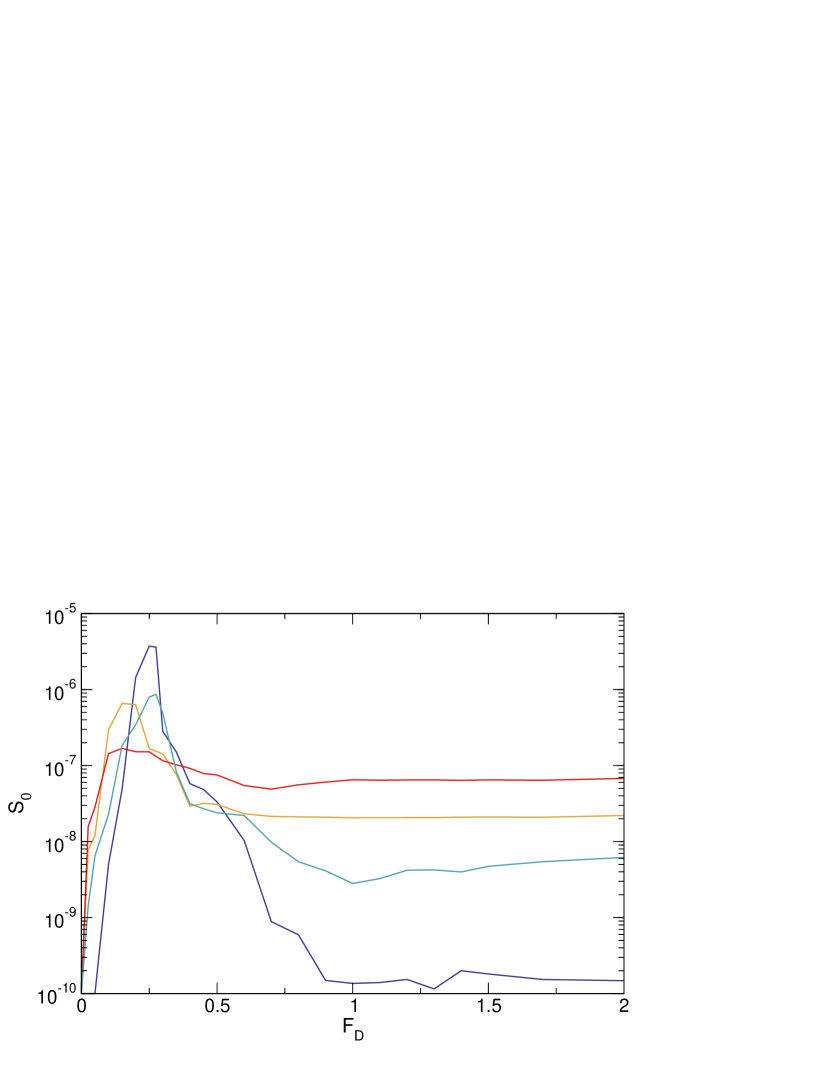
To better characterize the system, we measure the noise power , which is the value of the spectral power integrated in a small window around a specific frequency . In Fig. 8 we show versus for , , , and on a log-linear plot. For there is a large peak in over the range , which corresponds to the appearance of noise. The noise is white for , and for a narrow band noise signal appears. For and , there is still a peak in the noise near , but as the temperature increases, the peak power diminishes and the peak location shifts to lower drives. This is correlated with a whitening of the low frequency noise, as shown in Fig. 7. For , the sharp noise power peak is lost. At large , we find that the noise power increases with increasing temperature due to the transition from flow through narrow 1D channels in the smectic state to a 2D Brownian like motion in the liquid state. The overall behavior of the noise power that we find is in agreement with experimental observations [56], where there is a large peak in the noise power near the depinning threshold at low temperatures, while for higher temperatures the noise power peak is reduced and shifts to lower drives before disappearing at sufficiently high temperature. Another feature that is also observed in the experiments is that the noise power increases with temperature at large drives.
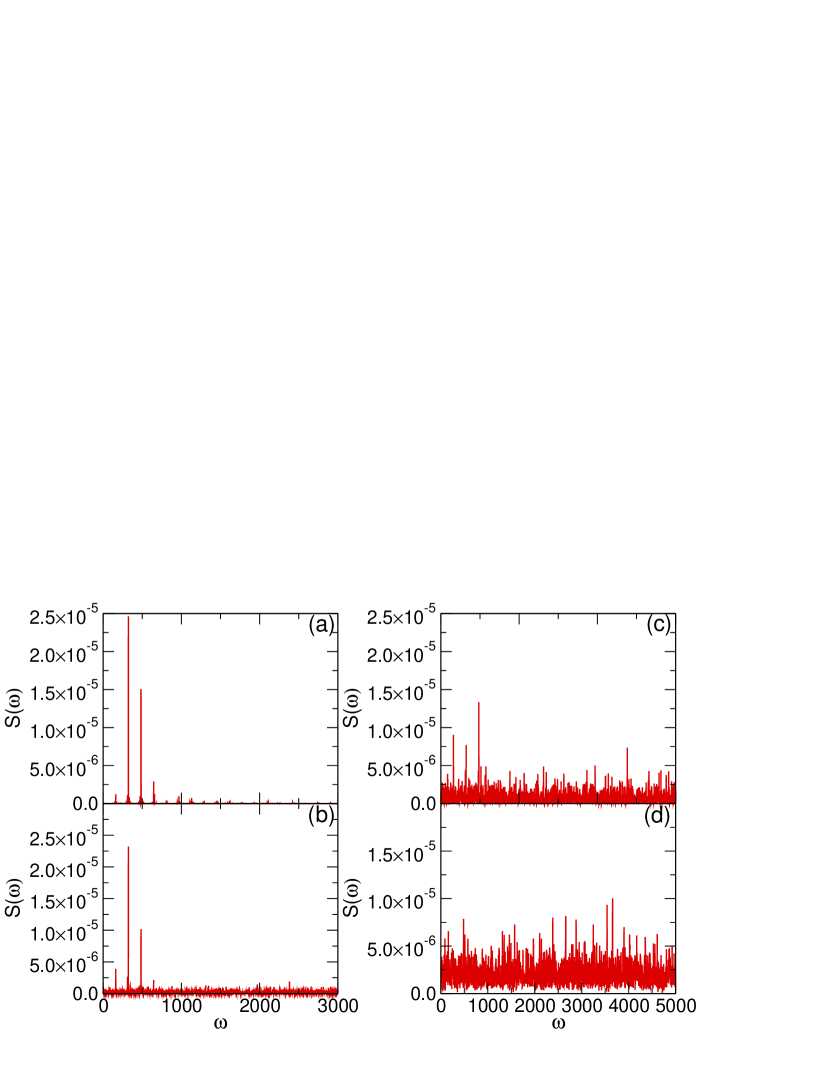
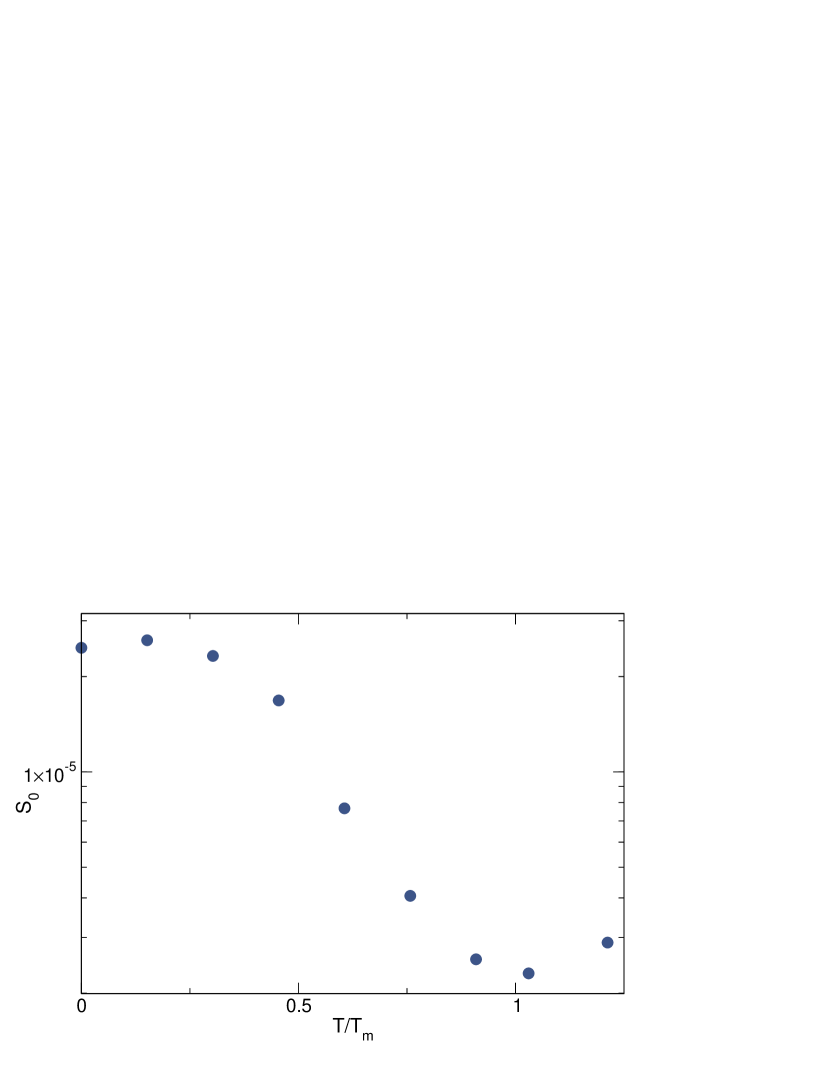
We next consider thermal effects in the high drive limit where the system forms a moving smectic at . In Fig. 9(a) we show vs for the system from Fig. 6 at and , where there are a series of peaks associated with a narrow band noise signature. At in Fig. 9(b), there are still strong peaks associated with the narrow band noise but the higher harmonic peaks are strongly reduced in power. In Fig. 9(c) at , the level of background noise has increased and the narrow band peaks are diminished in size, while at in Fig. 9(d), the moving smectic phase is lost and the narrow band peaks disappear into the background noise. To better characterize the change in the narrow band noise signature, in Fig. 10 we plot the noise power at , which is the location of the most pronounced narrow band noise peak in Fig. 9(a). For there is a strong narrow band noise signal; however, at the narrow band noise level is close to the value of the background noise. This suggests that thermal effects can strongly reduce the narrow band noise signal even at temperatures well below , which could explain why the narrow band noise signals are difficult to see in experiment. To better understand the origins of the changes in the noise signals, in Fig. 11(a) we plot the trajectories of the charges at where narrow band noise is present. The system is still in a moving smectic state but the channels have been broadened by the thermal fluctuations, and there are several regions in which the channel structures are starting to break down. Figure 11(b) shows the trajectories for , where the 1D channel structure is lost, there is a significant amount of transverse diffusion, and the narrow band noise peaks disappear. This result indicates that the narrow band noise occurs only when the motion of the charges is mostly 1D in character.
5 Thermal Depinning Noise in the Elastic Regime
We next consider the thermal depinning and noise in the elastic regime where the charges maintain their same neighbors. From Fig. 2 we select a value of , well below the disordering threshold of . In Fig. 12(a) we show versus at for , 0.0378, 0.0756, 0.17, 0.303, 0.606, and , and we plot the corresponding curves in Fig. 12(b). As increases, the depinning threshold shifts to lower , and in Fig. 12(b), the peak in that appears for is lost for . We note that the system remains in an ordered state up to for all values of . The curves also show a multiple peak feature at high temperatures, with one peak at the finite temperature threshold and a second peak near the depinning threshold. In between these two peaks, the flow is creep-like in nature.
In Fig. 13 we plot versus for the system in Fig. 12 at for different values of , 0.03, 0.04, , , and . At , the motion occurs mostly in the form of avalanches, and no clear narrow band signatures are present but the low frequency noise has high power. For , the system starts to develop a narrow band noise signature that sharpens with increasing drive, and for , which is above the zero temperature depinning threshold, the low frequency noise is strongly suppressed and the narrow band noise peaks become much sharper. This result shows that in the elastic flow regime, the narrow band noise signal is more robust than in the plastic phase, and it appears once the system has depinned.
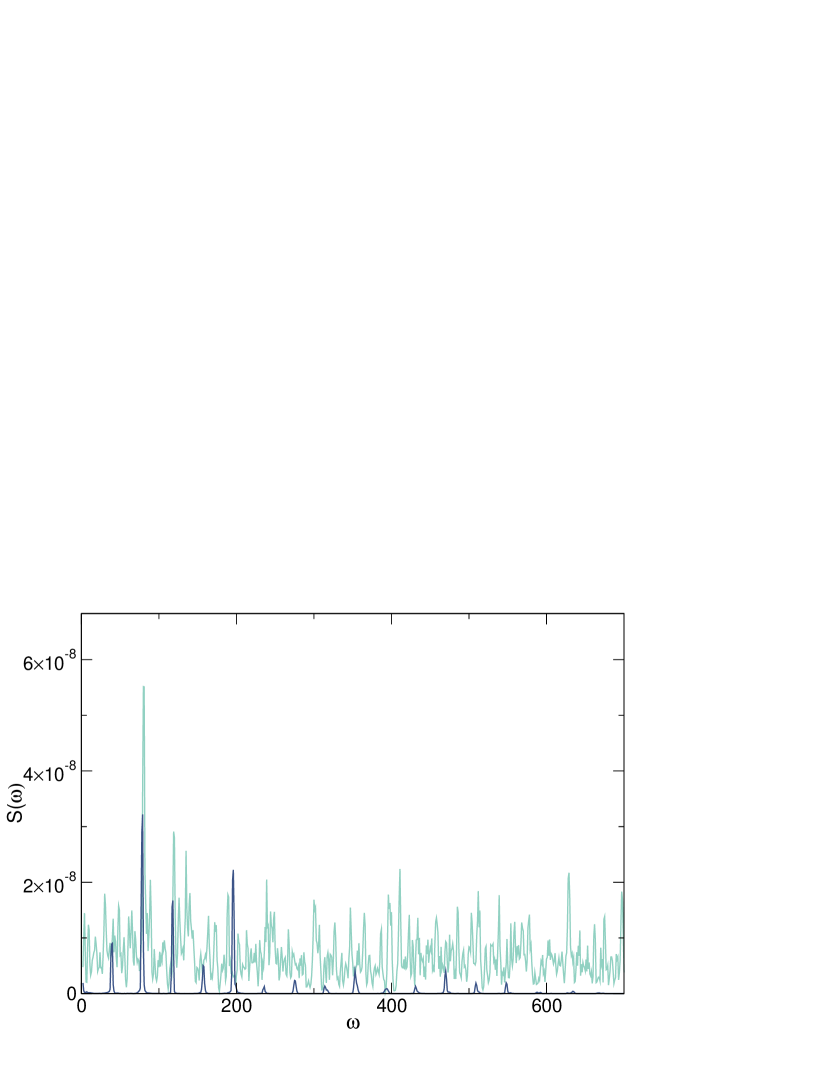
In Fig. 14 we plot vs for the system in Fig. 13 at and at a drive of . At , there is a strong narrow band noise feature. Interestingly, at , although the level of background noise has increased, the primary narrow band noise peak is enhanced in power. The increase in the narrow band peak occurs when thermal effects weaken the effectiveness of the pinning and allow the charges to become better ordered. This effect is diminished in the case of strong pinning.
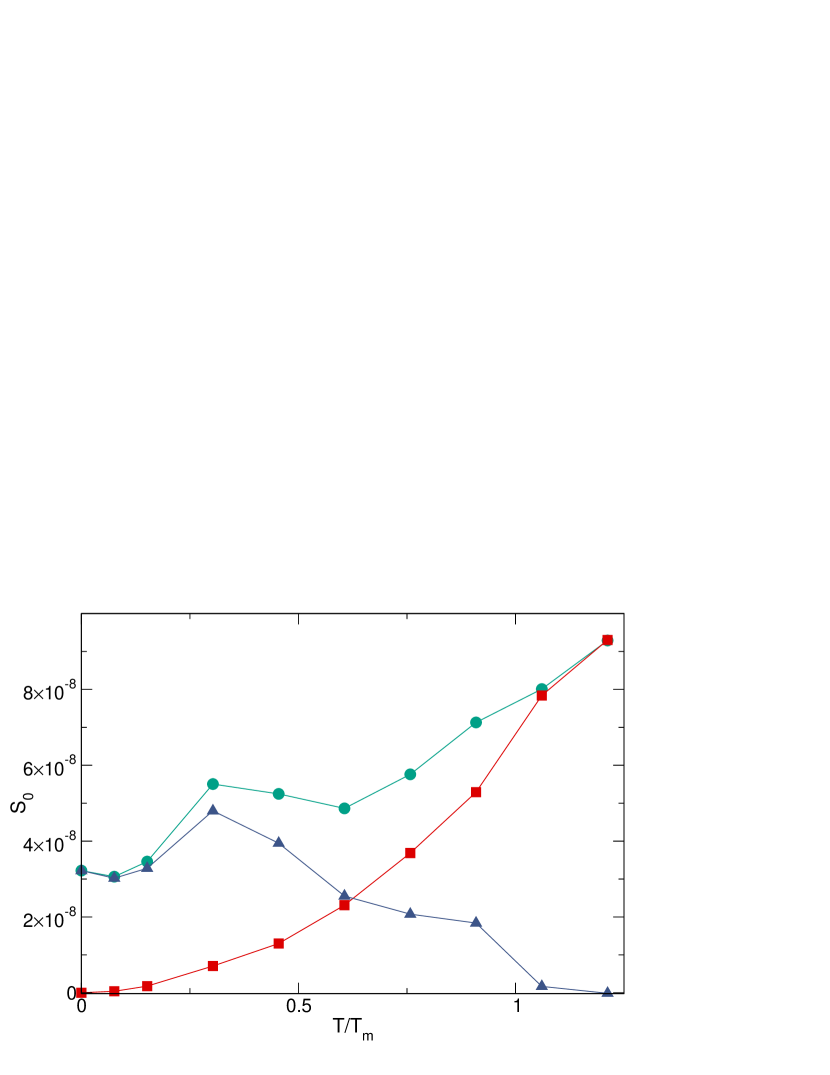
To better characterize the narrow band noise behavior for the system in Figs. 12 and 13, in Fig. 15 we plot the noise power versus for where the system is always in a moving state at the narrow band peak of and the background noise signal at , along with the difference between these two noise powers. Unlike the case for strong pinning, the power of the narrow band noise signal generally increases with increasing ; however, the background noise power also increases, and the amount of power in the two signals becomes equal near . The narrow band noise peak has the greatest amount of additional power compared to the background noise near . This is again due to thermal effects washing out any additional avalanche-like motion and permitting the charge lattice to become better ordered.
6 Discussion
Narrow band noise has been observed experimentally in superconducting vortex [26, 28], magnetic skyrmion [32], and charge density wave [4] systems, but has not been seen for Wigner crystals. There have been reports of periodic noise in charge ordering systems such as stripe or bubble forming states [33, 37]; however, this noise generally appears at low frequencies and is probably not associated with the lattice-scale narrow band noise, but instead arises due to the motion of some other periodically moving macroscopic scale structure. In the experiments of Brussarski et al. [56], the peak noise power decreased with increasing temperature, similar to what we observe, but no narrow band noise signal was observed. This could be the result of several possible factors. If the drive applied to the system is not uniform, there could still be strong plastic flow at low drives; however, at high drives the system may not form a uniformly ordered moving state but could instead break into several locally ordered regions that are moving at different speeds. Related to this, if the quenched disorder has a wide range of strength so that some of the charges are moving while a small number remain pinned, a disordered flow regime would emerge in which narrow band noise is absent. A narrow band noise signal could also be masked by strong background noise. In this case, the signal could be boosted by applying an additional ac drive. If the frequency of this ac drive is swept, phase locking or Shapiro steps would appear when the frequency comes into resonance with the narrow band signal [26]. Another possible issue is that the narrow band frequency could be too high to detect with the available experimental setup; however, for a system in the elastic depinning limit, fairly low frequency periodic signals could be generated in the creep regime. The lack of experimentally observed narrow band noise may suggest that elastic depinning of the Wigner crystal is not occurring and that the systems are generally in the disordered or plastic flow regimes where the only available narrow band noise signals are of the moving smectic type. In principle, we think that the best place to look for a narrow band noise signature is in a sample with relatively weak pinning just above the depinning threshold. In our work, we focused on samples that were entirely within the elastic or plastic regimes; however, close to the transition between the elastic and plastic regimes, the plastic flow noise may be enhanced.
7 Summary
We have investigated the thermally induced depinning and noise fluctuations for driven Wigner crystal systems with quenched disorder. We identify an elastic regime in which the charges maintain the same neighbors at depinning as well as a plastic regime in which the system is broken up into moving and non-moving regions. In the plastic depinning regime, the velocity noise has a shape and there is a peak in the noise power above the depinning threshold at lower temperatures, while for large temperatures, the noise power peak is reduced and the spectrum becomes white, in agreement with experiments. For high drives at low temperatures in the plastic regime, the system forms a moving smectic with a narrow band noise signal. We find that this narrow band signal persists up to , where is the temperature at which the charge lattice melts in the absence of quenched disorder. In the elastic regime, the system remains ordered up to temperatures approaching , although thermal effects reduce the depinning threshold. In the elastic regime, noise appears only in the creep regime where there are avalanches or jumps of motion, while in the sliding regime, pronounced narrow band noise appears that reaches its lowest power at the disorder-free melting temperature. Our results show that measurements of the velocity noise spectra and noise power can be used in connection with transport curves to distinguish different phases of driven Wigner crystals.
References
- [1] D. S. Fisher. Collective transport in random media: from superconductors to earthquakes. Phys. Rep., 301:113–150, 1998.
- [2] C. Reichhardt and C. J. Olson Reichhardt. Depinning and nonequilibrium dynamic phases of particle assemblies driven over random and ordered substrates: a review. Rep. Prog. Phys., 80(2):026501, 2017.
- [3] G. Grüner, A. Zawadowski, and P. M. Chaikin. Nonlinear conductivity and noise due to charge-density-wave depinning in NbSe3. Phys. Rev. Lett., 46:511–515, 1981.
- [4] G. Grüner. The dynamics of charge-density waves. Rev. Mod. Phys., 60:1129–1181, 1988.
- [5] A. Pertsinidis and X. S. Ling. Statics and dynamics of 2D colloidal crystals in a random pinning potential. Phys. Rev. Lett., 100:028303, 2008.
- [6] T. Bohlein, J. Mikhael, and C. Bechinger. Observation of kinks and antikinks in colloidal monolayers driven across ordered surfaces. Nature Mater., 11(2):126–130, 2012.
- [7] T. Schulz, R. Ritz, A. Bauer, M. Halder, M. Wagner, C. Franz, C. Pfleiderer, K. Everschor, M. Garst, and A. Rosch. Emergent electrodynamics of skyrmions in a chiral magnet. Nature Phys., 8(4):301–304, 2012.
- [8] A. Vanossi, N. Manini, M. Urbakh, S. Zapperi, and E. Tosatti. Colloquium: Modeling friction: From nanoscale to mesoscale. Rev. Mod. Phys., 85:529–552, 2013.
- [9] C. Reichhardt and C. J. Olson. Colloidal dynamics on disordered substrates. Phys. Rev. Lett., 89:078301, 2002.
- [10] N. Di Scala, E. Olive, Y. Lansac, Y. Fily, and J. C. Soret. The elastic depinning transition of vortex lattices in two dimensions. New J. Phys., 14:123027, 2012.
- [11] Y. Fily, E. Olive, N. Di Scala, and J. C. Soret. Critical behavior of plastic depinning of vortex lattices in two dimensions: Molecular dynamics simulations. Phys. Rev. B, 82:134519, 2010.
- [12] S. Bhattacharya and M. J. Higgins. Dynamics of a disordered flux line lattice. Phys. Rev. Lett., 70:2617–2620, 1993.
- [13] A. E. Koshelev and V. M. Vinokur. Dynamic melting of the vortex lattice. Phys. Rev. Lett., 73:3580–3583, 1994.
- [14] K. Moon, R. T. Scalettar, and G. T. Zimányi. Dynamical phases of driven vortex systems. Phys. Rev. Lett., 77:2778–2781, 1996.
- [15] T. Giamarchi and P. Le Doussal. Moving glass phase of driven lattices. Phys. Rev. Lett., 76:3408–3411, 1996.
- [16] L. Balents, M. C. Marchetti, and L. Radzihovsky. Nonequilibrium steady states of driven periodic media. Phys. Rev. B, 57:7705–7739, 1998.
- [17] C. J. Olson, C. Reichhardt, and F. Nori. Nonequilibrium dynamic phase diagram for vortex lattices. Phys. Rev. Lett., 81:3757–3760, 1998.
- [18] F. Pardo, F. de la Cruz, P. L. Gammel, E. Bucher, and D. J. Bishop. Observation of smectic and moving-Bragg-glass phases in flowing vortex lattices. Nature, 396(6709):348–350, 1998.
- [19] A. B. Kolton, D. Domínguez, and N. Grønbech-Jensen. Hall noise and transverse freezing in driven vortex lattices. Phys. Rev. Lett., 83:3061–3064, 1999.
- [20] C. Reichhardt, D. Ray, and C. J. Olson Reichhardt. Collective transport properties of driven skyrmions with random disorder. Phys. Rev. Lett., 114:217202, 2015.
- [21] M. C. Hellerqvist, D. Ephron, W. R. White, M. R. Beasley, and A. Kapitulnik. Vortex dynamics in two-dimensional amorphous Mo77Ge23 films. Phys. Rev. Lett., 76:4022–4025, 1996.
- [22] S. Ryu, M. Hellerqvist, S. Doniach, A. Kapitulnik, and D. Stroud. Dynamical phase transition in a driven disordered vortex lattice. Phys. Rev. Lett., 77:5114–5117, 1996.
- [23] M. B. Weissman. noise and other slow, nonexponential kinetics in condensed matter. Rev. Mod. Phys., 60:537–571, 1988.
- [24] I. Bloom, A. C. Marley, and M. B. Weissman. Nonequilibrium dynamics of discrete fluctuators in charge-density waves in NbSe3. Phys. Rev. Lett., 71:4385–4388, 1993.
- [25] A. C. Marley, M. J. Higgins, and S. Bhattacharya. Flux flow noise and dynamical transitions in a flux line lattice. Phys. Rev. Lett., 74:3029–3032, 1995.
- [26] S. Okuma, J. Inoue, and N. Kokubo. Suppression of broadband noise at mode locking in driven vortex matter. Phys. Rev. B, 76:172503, 2007.
- [27] T. J. Bullard, J. Das, G. L. Daquila, and U. C. Tauber. Vortex washboard voltage noise in type-II superconductors. Eur. Phys. J. B, 65(4):469–484, 2008.
- [28] S. Okuma, K. Kashiro, Y. Suzuki, and N. Kokubo. Order-disorder transition of vortex matter in a-MoxGe1-x films probed by noise. Phys. Rev. B, 77:212505, 2008.
- [29] G. Liu, S. Rumyantsev, M. A. Bloodgood, T. T. Salguero, and A. A. Balandin. Low-frequency current fluctuations and sliding of the charge density waves in two-dimensional materials. Nano Lett., 18:3630–3636, 2018.
- [30] S. A. Díaz, C. J. O. Reichhardt, D. P. Arovas, A. Saxena, and C. Reichhardt. Fluctuations and noise signatures of driven magnetic skyrmions. Phys. Rev. B, 96:085106, 2017.
- [31] K. Bennaceur, C. Lupien, B. Reulet, G. Gervais, L. N. Pfeiffer, and K. W. West. Competing charge density waves probed by nonlinear transport and noise in the second and third Landau levels. Phys. Rev. Lett., 120:136801, 2018.
- [32] T. Sato, W. Koshibae, A. Kikkawa, T. Yokouchi, H. Oike, Y. Taguchi, N. Nagaosa, Y. Tokura, and F. Kagawa. Slow steady flow of a skyrmion lattice in a confined geometry probed by narrow-band resistance noise. Phys. Rev. B, 100:094410, 2019.
- [33] J. Sun, J. Niu, Y. Li, Y. Liu, L. N. Pfeiffer, K. W. West, P. Wang, and X. Lin. Dynamic ordering transitions in charged solid. Fund. Res., 2:178–183, 2022.
- [34] S. Maegochi, K. Ienaga, and S. Okuma. Moving smectic phase and transverse mode locking in driven vortex matter. Phys. Rev. Res., 4:033085, 2022.
- [35] T. Sato, A. Kikkawa, Y. Taguchi, Y. Tokura, and F. Kagawa. Mode locking phenomena of the current-induced skyrmion-lattice motion in microfabricated MnSi. Phys. Rev. B, 102:180411, 2020.
- [36] G. A. Csáthy, D. C. Tsui, L. N. Pfeiffer, and K. W. West. Astability and negative differential resistance of the Wigner solid. Phys. Rev. Lett., 98:066805, 2007.
- [37] K. B. Cooper, J. P. Eisenstein, L. N. Pfeiffer, and K. W. West. Observation of narrow-band noise accompanying the breakdown of insulating states in high Landau levels. Phys. Rev. Lett., 90:226803, 2003.
- [38] E. Wigner. On the interaction of electrons in metals. Phys. Rev., 46:1002–1011, 1934.
- [39] P. Monceau. Electronic crystals: an experimental overview. Adv. Phys., 61(4):325–581, 2012.
- [40] M. Shayegan. Wigner crystals in flat band 2D electron systems. Nature Rev. Phys., 4:212–213, 2022.
- [41] E. Y. Andrei, G. Deville, D. C. Glattli, F. I. B. Williams, E. Paris, and B. Etienne. Observation of a magnetically induced Wigner solid. Phys. Rev. Lett., 60:2765–2768, 1988.
- [42] C. J. DaSilva, J. P. Rino, P. F. Damasceno, and E. Ya. Sherman. Two-dimensional Coulomb solid with interaction anisotropy. Phys. Rev. B, 81:153307, 2010.
- [43] V. J. Goldman, M Santos, M Shayegan, and J. E. Cunningham. Evidence for two-dimentional quantum Wigner crystal. Phys. Rev. Lett., 65:2189–2192, 1990.
- [44] F. I. B. Williams, P. A. Wright, R. G. Clark, E. Y. Andrei, G. Deville, D. C. Glattli, O. Probst, B. Etienne, C. Dorin, C. T. Foxon, and J. J. Harris. Conduction threshold and pinning frequency of magnetically induced Wigner solid. Phys. Rev. Lett., 66:3285–3288, 1991.
- [45] H. W. Jiang, H. L. Stormer, D. C. Tsui, L. N. Pfeiffer, and K. W. West. Magnetotransport studies of the insulating phase around =1/5 Landau-level filling. Phys. Rev. B, 44:8107–8114, 1991.
- [46] Y. P. Li, T. Sajoto, L. W. Engel, D. C. Tsui, and M. Shayegan. Low-frequency noise in the reentrant insulating phase around the 1/5 fractional quantum Hall liquid. Phys. Rev. Lett., 67:1630–1633, 1991.
- [47] Y. Kopelevich, R. R. da Silva, A. Rougier, and I. A. Luk’yanchuk. Charge ordering in amorphous WOx films. Phys. Lett. A, 368:419–422, 2007.
- [48] Md. S. Hossain, M. K. Ma, K. A. Villegas-Rosales, Y. J. Chung, L. N. Pfeiffer, K. W. West, K. W. Baldwin, and M. Shayegan. Anisotropic two-dimensional disordered Wigner solid. Phys. Rev. Lett., 129:036601, 2022.
- [49] Y. Xu, S. Liu, D. A. Rhodes, K. Watanabe, T. Taniguchi, J. Hone, V. Elser, K. F. Mak, and J. Shan. Correlated insulating states at fractional fillings of moirè superlattices. Nature (London), 587:214–218, 2020.
- [50] H. Li, S. Li, E. C. Regan, D. Wang, W. Zhao, S. Kahn, K. Yumigeta, M. Blei, T. Taniguchi, K. Watanabe, S. Tongay, A. Zettl, M. F. Crommie, and F. Wang. Imaging two-dimensional generalized Wigner crystals. Nature (London), 597:650–654, 2021.
- [51] T. Smoleński, P. E. Dolgirev, C. Kuhlenkamp, A. Popert, Y. Shimazaki, P. Back, X. Lu, M. Kroner, K. Watanabe, T. Taniguchi, I. Esterlis, E. Demler, and A. Imamoglu. Signatures of Wigner crystal of electrons in a monolayer semiconductor. Nature (London), 595:53–57, 2021.
- [52] Y. Zhou, J. Sung, E. Brutschea, I. Esterlis, Y. Wang, G. Scuri, R. J. Gelly, H. Heo, T. Taniguchi, K. Watanabe, G. Zaránd, M. D. Lukin, P. Kim, E. Demler, and H. Park. Bilayer Wigner crystals in a transition metal dichalcogenide heterostructure. Nature (London), 595:48–52, 2021.
- [53] M. Matty and E.-A. Kim. Melting of generalized Wigner crystals in transition metal dichalcogenide heterobilayer Moiré systems. Nature Commun., 13:7098, 2022.
- [54] J. Falson, I. Sodemann, B. Skinner, D. Tabrea, Y. Kozuka, A. Tsukazaki, M. Kawasaki, K. von Klitzing, and J. H. Smet. Competing correlated states around the zero-field Wigner crystallization transition of electrons in two dimensions. Nature Mater., 21:311–316, 2022.
- [55] C. Reichhardt, C. J. Olson, N. Grønbech-Jensen, and F. Nori. Moving Wigner glasses and smectics: Dynamics of disordered Wigner crystals. Phys. Rev. Lett., 86:4354–4357, 2001.
- [56] P. Brussarski, S. Li, S. V. Kravchenko, A. A. Shashkin, and M. P. Sarachik. Transport evidence for a sliding two-dimensional quantum electron solid. Nature Commun., 9:3803, 2018.
- [57] S. Bogdanovich and D. Popović. Onset of glassy dynamics in a two-dimensional electron system in silicon. Phys. Rev. Lett., 88:236401, 2002.
- [58] J. Jaroszyński, D. Popović, and T. M. Klapwijk. Universal behavior of the resistance noise across the metal-insulator transition in silicon inversion layers. Phys. Rev. Lett., 89:276401, 2002.
- [59] C. Reichhardt and C. J. Olson Reichhardt. Noise at the crossover from Wigner liquid to Wigner glass. Phys. Rev. Lett., 93:176405, 2004.
- [60] Y. P. Chen, G. Sambandamurthy, Z. H. Wang, R. M. Lewis, L. W. Engel, D. C. Tsui, P. D. Ye, L. N. Pfeiffer, and K. W. West. Melting of a 2D quantum electron solid in high magnetic field. Nat. Phys., 2(7):452–455, 2006.
- [61] T. Knighton, Z. Wu, J. Huang, A. Serafin, J. S. Xia, L. N. Pfeiffer, and K. W. West. Evidence of two-stage melting of Wigner solids. Phys. Rev. B, 97:085135, 2018.
- [62] H. Deng, L. N. Pfeiffer, K. W. West, K. W. Baldwin, L. W. Engel, and M. Shayegan. Probing the melting of a two-dimensional quantum Wigner crystal via its screening efficiency. Phys. Rev. Lett., 122:116601, 2019.
- [63] M. K. Ma, K. A. Villegas Rosales, H. Deng, Y. J. Chung, L. N. Pfeiffer, K. W. West, K. W. Baldwin, R. Winkler, and M. Shayegan. Thermal and quantum melting phase diagrams for a magnetic-field-induced Wigner solid. Phys. Rev. Lett., 125:036601, 2020.
- [64] S. Kim, J. Bang, C. Lim, S. Y. Lee, J. Hyun, G. Lee, Y. Lee, J. D. Denlinger, S. Huh, C. Kim, S. Y. Song, J. Seo, D. Thapa, S.-G. Kim, Y. H. Lee, Y. Kim, and S. W. Kim. Quantum electron liquid and its possible phase transition. Nature Mater., 21:1269–1274, 2022.
- [65] C. Reichhardt and C. J. O. Reichhardt. Nonlinear dynamics, avalanches, and noise for driven Wigner crystals. Phys. Rev. B, 106:235417, 2022.
- [66] C. Reichhardt and C. J. O. Reichhardt. Melting, reentrant ordering and peak effect for Wigner crystals with quenched and thermal disorder. 2022, arXiv:2211.11911.
- [67] Q. Qian, J. Nakamura, S. Fallahi, G. C. Gardner, and M. J. Manfra. Possible nematic to smectic phase transition in a two-dimensional electron gas at half-filling. Nature Commun., 8:1536, 2017.
- [68] M.-C. Cha and H. A. Fertig. Topological defects, orientational order, and depinning of the electron solid in a random potential. Phys. Rev. B, 50:14368–14380, 1994.
- [69] M.-C. Cha and H. A. Fertig. Disorder-induced phase transitions in two-dimensional crystals. Phys. Rev. Lett., 74:4867–4870, 1995.
- [70] G. Piacente and F. M. Peeters. Pinning and depinning of a classic quasi-one-dimensional Wigner crystal in the presence of a constriction. Phys. Rev. B, 72:205208, 2005.
- [71] C. Reichhardt and C. J. O. Reichhardt. Drive dependence of the Hall angle for a sliding Wigner crystal in a magnetic field. Phys. Rev. B, 103:125107, 2021.