ß
Very early warning of a moderate-to-strong El Niño in 2023
Abstract
The El Niño Southern Oscillation (ENSO) is the strongest driver of year-to-year variations of the global climate and can lead to extreme weather conditions and disasters in various regions around the world. Here, we review two different approaches for the early forecast of El Niño that we have developed recently: the climate network-based approach [1] allows forecasting the onset of an El Niño event about 1 year ahead, while the complexity-based approach [2] allows additionally to estimate the magnitude of an upcoming El Niño event in the calendar year before. For 2023, both approaches predict the onset of an El Niño event, with a combined onset probability of about 89%. The complexity-based approach predicts a moderate-to-strong El Niño with a magnitude of °C. Since El Niño events temporarily increase the global temperature, we expect that the coming El Niño will increase the global temperature by about +0.2°C, likely making 2024 the hottest year since the beginning of instrumental observations. It is possible that as a consequence of this El Niño, the +1.5°C target (compared to pre-industrial levels) will be temporarily breached already in 2024.
1 The El Niño Southern Oscillation
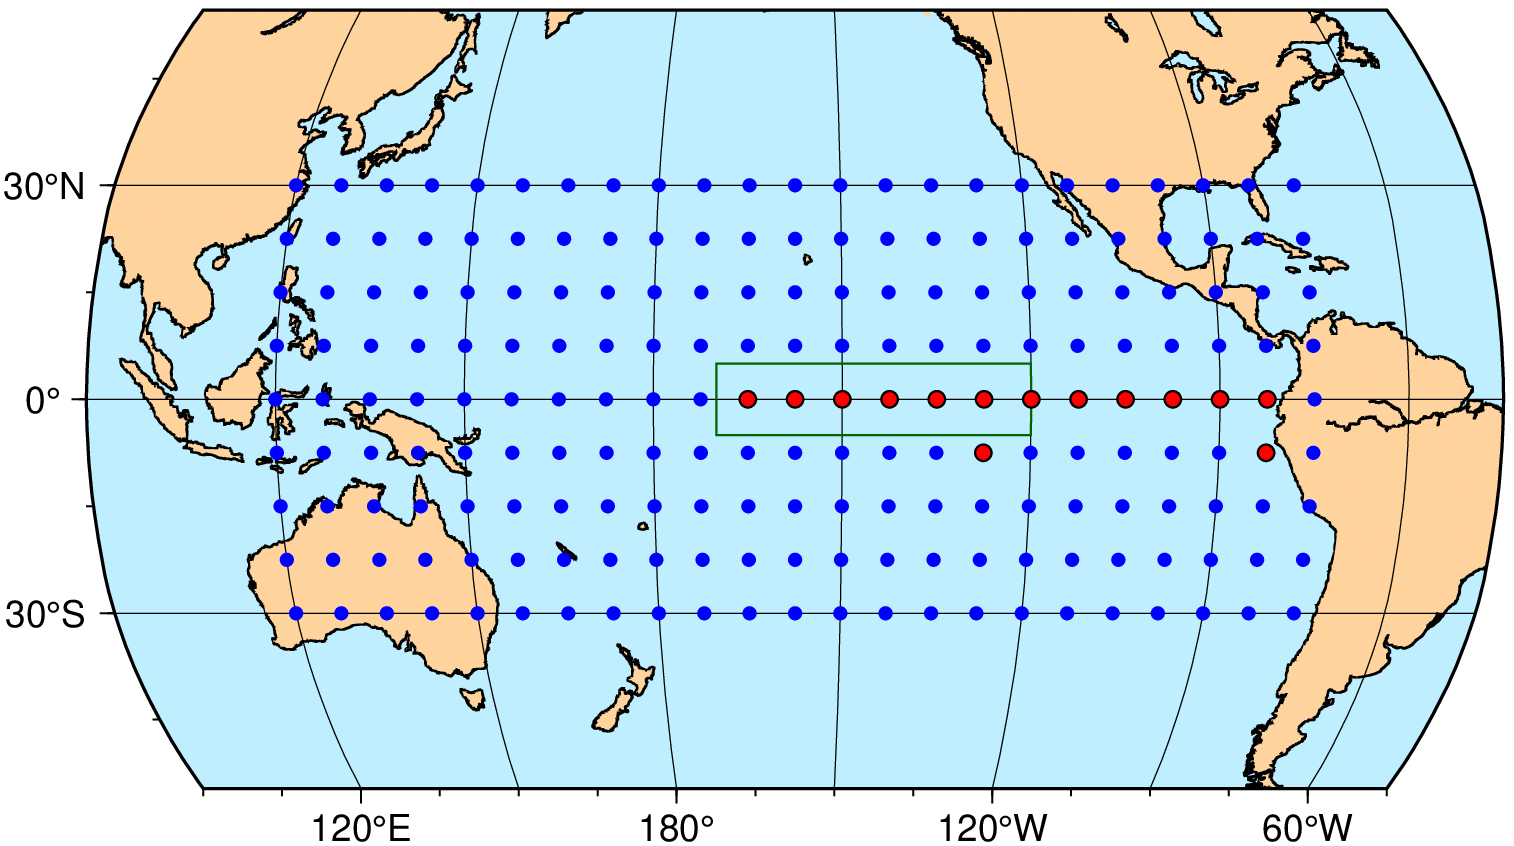
The El Niño-Southern Oscillation (ENSO) [4, 5, 3, 6, 7, 8] is a naturally occurring quasi-periodic oscillation of the Pacific ocean-atmosphere system that alternates between warm (El Niño), cold (La Niña) and neutral phases. ENSO is quantified by the Oceanic Niño Index (ONI), which is defined as the three-month running-mean sea surface temperature (SST) anomaly in the Niño3.4 region (see Fig. 1). An El Niño episode is defined to occur when the ONI is greater or equal 0.5°C for at least 5 months. A regularly updated table of the ONI can be found at [9].
Since El Niño episodes can alter weather conditions in various parts of the world and even lead to extreme weather conditions, like extreme precipitation or droughts [11, 14, 13, 12, 10, 8], early-warning methods are highly desirable. The two main types of prediction tools are dynamical and statistical models. The dynamical models are initialized by observations and directly simulate the further development of physical quantities like the SSTA. In contrast, the statistical models, which also include machine learning-based methods, exploit significant statistical relationships in current and past observations to obtain predictions. Numerous models of both types have been proposed to forecast the pertinent index with lead times between 1 and 24 months [15, 16, 17, 20, 18, 19, 21, 22, 24, 23, 25, 30, 26, 32, 31, 33, 28, 27, 29, 34, 35, 36].
Unfortunately, the current operational forecasts have quite limited anticipation power. In particular, they generally fail to overcome the so-called “spring barrier” (see, e.g., [37, 38]), which usually shortens their reliable warning time to around 6 months [39, 8].
To resolve this problem, we have recently introduced two alternative forecasting approaches [1, 2], which considerably extend the probabilistic prediction horizon. The first approach [1] (see also [40, 41]) is based on complex-networks analysis [42, 43, 44, 45, 46, 47, 48, 49] and provides forecasts for the onset of an El Niño event, but not for its magnitude, in the year before the event starts. The second approach [2] relies on the System Sample Entropy (SysSampEn), an information entropy, which measures the complexity (disorder) in the Niño3.4 area. The method provides forecasts for both the onset and magnitude of an El Niño event at the end of the previous year.
Here we present the forecasts of both methods for 2023. Both methods forecast the onset of an El Niño in 2023. There were 7 such concurring onset forecasts in the past, and all 7 turned out to be correct (see Figs. 2 and 5). Applying a conservative Bayesian-type estimate using Laplace’s rule of succession [50], we arrive at an El Niño onset probability of .
Depending on the location of maximal warming, El Niño events can be divided into Central Pacific (CP) and Eastern Pacific (EP) events. The largest EP El Niño events are larger than the largest CP events. Indeed, between 1950 and present, the six largest El Niños events were EP events. The type of an event itself also has a major influence on the event’s impacts, see, e.g., [51, 53, 52, 8]. For instance, large EP events typically lead to strongly increased precipitation along the coast of Ecuador and Northern Peru, resulting in massive floodings and landslides, while CP events only lead to dry conditions in these already dry areas (see, e.g., [54, 55]). Based on [56], there is an 87.5% probability that an El Niño event starting in 2023 will be an EP El Niño. The corresponding Bayesian estimate is 80%.
2 Climate network-based forecasting
2.1 The network-based forecasting algorithm
The climate network-based approach is based on the observation that a large-scale cooperative mode, linking the central and eastern equatorial Pacific with the rest of the tropical Pacific (see Fig. 1), builds up in the calendar year before an El Niño event. According to [45, 1, 40], a measure for the emerging cooperativity can be derived from the time evolution of the teleconnections (“links“) between the surface air temperature anomalies (SATA) at the grid points (”nodes“) between the two areas. The strengths of these links are derived from the respective cross-correlations (for details, see, e.g., [1, 40]).
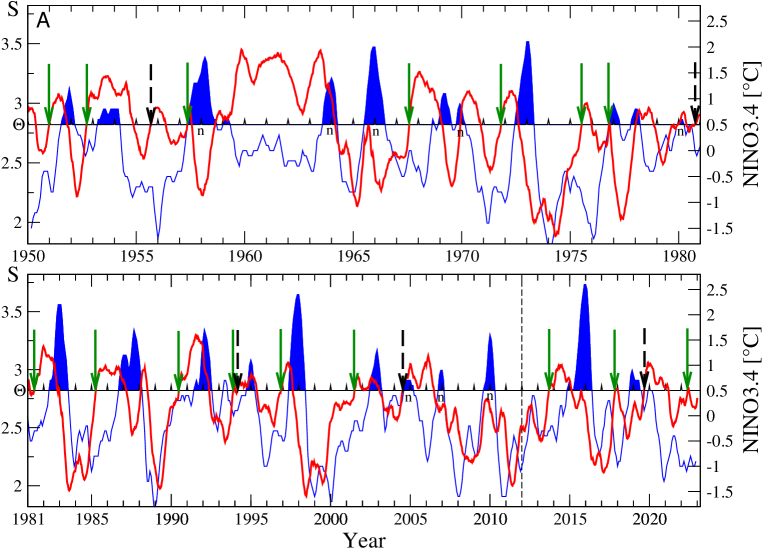
The main predictive quantity for the onset of an El Niño is the mean link strength in the considered network, which is obtained by averaging over all individual links at a given time [1, 40]. The mean link strength typically rises in the calendar year before an El Niño event starts and drops with the onset of the event (see Fig. 2). This property serves as a precursor for the event. The forecasting algorithm involves as only fit parameter a decision threshold , which has been fixed in a learning phase (1950-1980) [1]. Optimal forecasts in the learning phase are obtained for between 2.815 and 2.834 [1, 40].
The algorithm gives an alarm and predicts the onset of an El Niño event in the following year when crosses from below while the most recent ONI value is below C. In a more restrictive version (ii) [56], the algorithm considers only those alarms where the ONI remains below 0.5°C for the rest of the year.
For the calculation of , we use daily surface air temperature data from the National Centers for Environmental Prediction/National Center for Atmospheric Research (NCEP/NCAR) Reanalysis I project [57, 58]. We would like to note that for the calculations in the prediction phase (1981-present), e.g., of the climatological average, only data from the past up to the prediction date have been considered.
2.2 El Niño forecasts since 2011
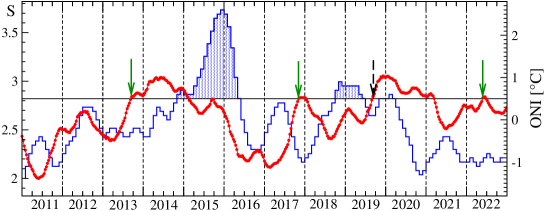
The climate network-based algorithm has been quite successful in providing real-time forecasts, i.e., forecasts into the future. In its original version, it provided 11 forecasts for the period 2012-2022, 10 of these forecasts turned out to be correct, see Fig. 3. The only incorrect forecast is a false alarm given in September 2019. The p-value, obtained from random guessing with the climatological El Niño onset probability, for the skill in the forecasting period alone is . When considering the hindcasting and forecasting periods (1981-2022) together, the p-value is . When version (ii) is applied, and only those alarms are considered, where the ONI remains below 0.5°C for the rest of the year, the false alarm in 2019 is not activated.
Between May 24th and June 7th, 2022, the mean link strength crossed all critical thresholds, while the last available ONI value was below °C (°C for March-April-May), thus predicting the onset of an El Niño in 2023. In the hindcasting and forecasting period (1981 and December 2022), there were 11 El Niño events. The algorithm generated 11 alarms and 8 of these were correct. The more restrictive version (ii) of the algorithm [56] gave 8 alarms, all of which were correct. Since the ONI remained negative throughout 2022, also the conditions for the more restrictive version of the network-based algorithm were met. Based on the climate network approach alone, a likely onset of an El Niño is thus predicted for 2023.
3 System Sample Entropy-based forecast
3.1 SysSampEn
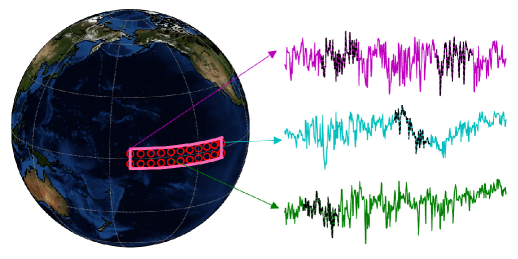
The SysSampEn was introduced in [2] as an analysis tool to quantify the complexity (disorder) in a complex system, in particular, in the temperature anomaly time series in the Niño3.4 region. It is approximately equal to the negative natural logarithm of the conditional probability that 2 subsequences similar (within a certain tolerance range) for consecutive data points remain similar for the next points, where the subsequences can originate from either the same or different time series (e.g., black curves in Fig. 4), that is,
| (1) |
where A is the number of pairs of similar subsequences of length , is the number of pairs of similar subsequences of length , is the number of data points used in the calculation for each time series of length , and is a constant which determines the tolerance range. The detailed definition of the SysSampEn for a general complex system composed of time series and how to objectively choose the parameter values is described in detail in [2].
In [2], it was found the previous year’s () SysSampEn exhibits a strong positive correlation ( on average) with the magnitude of an El Niño in year when parameter combinations are used that are able to quantify a system’s complexity with high accuracy. This linear relationship between SysSampEn and El Niño magnitude enables thus to predict the magnitude of an upcoming El Niño when the current () SysSampEn is inserted into the linear regression equation between the two quantities.
If the forecasted El Niño magnitude is below C then the absence of an El Niño onset is predicted for the following year . Thus SysSampEn values below a certain threshold indicate the absence of an El Niño onset. In contrast, if the SysSampEn is above this threshold and the ONI in December of the current year is below C then the method predicts the onset of an El Niño event in the following year.
3.2 Forecast for 2023
Here we use as input data the daily near-surface (1000 hPa) air temperatures of the ERA5 reanalysis from the European Centre for Medium-Range Weather Forecasts (ECMWF) [60] analysed at a resolution. The last months in 2022 are from the initial data release ERA5T, which in contrast to ERA5, only lags a few days behind real-time.
The daily time series are preprocessed by subtracting the corresponding climatological mean and then dividing by the climatological standard deviation. We start in 1984 and use the previous years to calculate the first anomalies. For the calculation of the climatological mean and standard deviation, only past data up to the year of the prediction are used. For simplicity, leap days are excluded. We use the same parameter values for the SysSampEn as in [2], , , and .
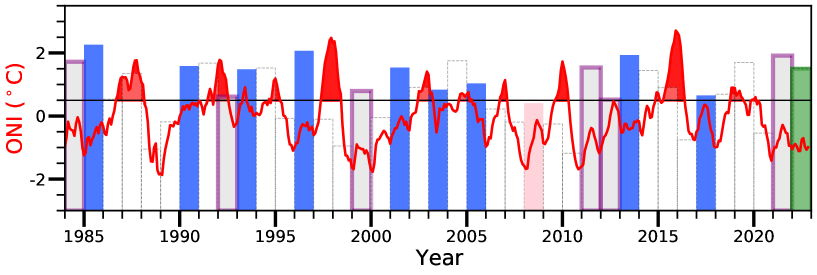
Figure 5 shows the results of the analysis. The magnitude forecast is shown as the height of rectangles in the year when the forecast is made, i.e., 1 year ahead of a potential El Niño onset. The forecast is obtained by inserting the regarded calendar year’s SysSampEn value into the linear regression function between SysSampEn and El Niño magnitude. For the 2023 forecast, the regression is based on all correctly hindcasted El Niño events before 2022. The red curve shows the ONI and the red shades indicate the El Niño periods. The blue rectangles show the correct prediction of an El Niño in the following calendar year and grey rectangles with a violet border show false alarms.
There are 15 occurrences of high SysSampEn accompanied by a lower than C ONI in December. In 9 of these cases, the hindcast was correct. White dashed rectangles show correct forecasts for the absence of an El Niño. 9 of the 10 El Niño events were preceded by a year with a high SysSampEn, the only missed event is the 2009/10 El Niño, where the preceding SysSampEn value was slightly below the threshold.
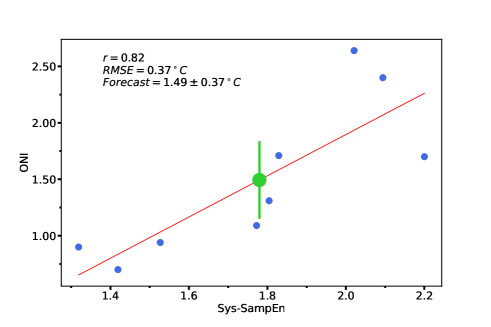
The forecasted El Niño magnitude for 2023 is C, that is, well above C, as shown by the green rectangle. The SysSampEn value for 2022 is , i.e., well above the threshold value of . Figure 6 shows the strong linear relationship (r=0.82) between the SysSampEn in the year before an El Niño onset and the maximal magnitude of the following El Niño, on which the prediction is based. The forecast’s root-mean-square error (RMSE) (C) is obtained by leave-on-out hindcasting applied to the past El Niño events.
4 Implications for global temperature
El Niño episodes lead, besides their local and regional weather impacts, also to a temporary increase of the global temperature with a time lag of about 2-5 months [61, 62]. At the end of 2021, the ONI was at C (OND), and also throughout 2022 it remained around C [9]. An El Niño episode in 2023 with a magnitude of C (RMSE) would thus increase the ONI compared to 2022 by C. If we assume a regression coefficient of C per C change in the Niño3.4 area [61, 62, 63, 64], this corresponds to an increase in the monthly global temperatures of up to C. The World Meteorological Organization (WMO) estimated the global temperature in 2022 compared to pre-industrial levels (1850-1900) at C [1.02 to 1.27](5% to 95% confidence interval) [65, 66]. A list of global temperature estimates for 2022 and their reference periods are shown in Table 1.
A rough estimate of an El Niño, as forecasted here, on the global monthly temperatures in 2024 can thus be obtained by assuming a warming trend of /decade: (RMSE). Assuming a Gaussian distribution for the uncertainty of the WMO estimation, this means that during 2024 the margin before breaching C shrinks to less than 1 standard deviation (0.80*sd). This corresponds to a 21.1% chance that C will have been temporarily breached by the end of 2024.
The onset of the here forecasted El Niño would make a temporary breaching of C in the Berkley Earth monthly data even likely. For this dataset, the 2022 estimate for the global temperature is C. Based on this, an El Niño of the here forecasted magnitude would push the monthly global temperatures in 2024 up to . Since a moderate-to-strong El Niño might last up to the early boreal summer, the Berkeley Earth annual global temperature could also breach C (compared to pre-industrial levels) already in 2024.
| Source | 2022 estimate | baseline |
|---|---|---|
| Berkeley Earth | C | 1850-1900 |
| ERA5 | C | 1850-1900 |
| GISSTEMP | C | 1951-1980 |
| HadCRUT5 | C | 1850-1900 |
| NOAAGlobalTemp | C | 1901-2000 |
| JRA-55 | -* | - |
| WMO | C [1.02 to 1.27] | 1850-1900 |
Acknowledgements
J.L. thanks the “Brazil East Africa Peru India Climate Capacities (B-EPICC)” project, which is part of the International Climate Initiative (IKI) of the German Federal Ministry for Economic Affairs and Climate Action (BMWK) and implemented by the Federal Foreign Office (AA). J.M. and J.F. acknowledge the support by the National Natural Science Foundation of China (Grant No. 12205025, 12275020, 12135003).
References
- [1] Ludescher J, Gozolchiani A, Bogachev MI, Bunde A, Havlin S, Schellnhuber HJ (2013) Improved El Niño forecasting by cooperativity detection. Proc Natl Acad Sci USA 110:11742-11745; ibid. doi:10.1073/pnas.1317354110.
- [2] Meng J, Fan J, Ludescher J, Ankit A, Chen X, Bunde A, Kurths J, Schellnhuber HJ (2019) Complexity based approach for El Niño magnitude forecasting before the spring predictability barrier. Proc Natl Acad Sci USA, 117:177-183; idid. doi:10.1073/pnas.1917007117.
- [3] Dijkstra HA (2005) Nonlinear Physical Oceanography: A Dynamical Systems Approach to the Large-Scale Ocean Circulation and El Niño (Springer, New York).
- [4] Clarke AJ (2008) An Introduction to the Dynamics of El Niño and the Southern Oscillation (Elsevier Academic Press, London).
- [5] Sarachik ES, Cane MA (2010) The El Niño-Southern Oscillation Phenomenon (Cambridge University Press, Cambridge).
- [6] Wang C, et al. (2017) El Niño and Southern Oscillation (ENSO): A review, in: Coral Reefs of the Eastern Tropical Pacific, eds Glymn PW, Manzello D, Enochs IC (Springer, Berlin).
- [7] Timmermann A, et al. (2018) El Niño-Southern Oscillation complexity. Nature 559:535-545.
- [8] McPhaden MJ, Santoso A, Cai W (Eds.) (2020) El Niño Southern Oscillation in a Changing Climate (John Wiley & Sons, Hoboken).
- [9] National Oceanic and Atmospheric Administration, Climate Prediction Center. https://origin.cpc.ncep.noaa.gov/products/analysis_monitoring/ensostuff/ONI_v5.php
- [10] Davis M (2001) Late Victorian Holocaust: El Niño Famines and the Making of the Third World (Verso, London & New York).
- [11] Wen C (2002) Impacts of El Niño and La Niña on the cycle of the East Asian winter and summer monsoon. Chin J Athmos Sci 26:359-376.
- [12] Kovats RS, Bouma MJ, Hajat S, Worrall E, Haines A (2003) El Niño and health. Lancet 362:1481–1489.
- [13] Donnelly JP, Woodruff JD (2007) Intense hurricane activity over the past 5,000 years controlled by El Niño and the West African monsoon. Nature 447:465-468.
- [14] Corral A, Ossó A, Llebot JE (2010) Scaling of tropical-cyclone dissipation. Nature Phys 6:693-696.
- [15] Cane MA, Zebiak SE, Dolan SC (1986) Experimental forecasts of El Niño. Nature 321:827-832.
- [16] Penland C und Sardeshmukh PD (1995) The optimal growth of tropical sea surface temperature anomalies. J Clim 8:1999-2024.
- [17] Tziperman E, Scher H, Zebiak SE, Cane MA (1997) Controlling Spatiotemporal Chaos in a Realistic El Niño Prediction Model. Phys Rev Lett 79:1034-1037.
- [18] Fedorov AV, Harper SL, Philander SG, Winter B, Wittenberg A (2003) How Predictable is El Niño? Bull Amer Meteor Soc 84:911-919.
- [19] Galanti E, Tziperman E, Rosati A, Sirkes Z (2003) A Study of ENSO Prediction Using a Hybrid Coupled Model and the Adjoint Method for Data Assimilation. Mon Weather Rev 131:2748-2764.
- [20] Kirtman BP (2003) The COLA anomaly coupled model: Ensemble ENSO prediction. Monthly Weather Review 131:2324-2341.
- [21] Chen D, Cane MA, Kaplan A, Zebiak SE, Huang D (2004) Predictability of El Niño over the past 148 years. Nature 428:733-736.
- [22] T. N. Palmer et al., Development of a european multimodel ensemble system for seasonal-to-interannual prediction (demeter). Bull. Am. Meteorol. Soc. 85, 853-872 (2004).
- [23] Chen D, Cane MA (2008) El Niño prediction and predictability. J Comput Phys 227:3625–3640.
- [24] Luo JJ, Masson S, Behera SK, Yamagata T (2008) Extended ENSO predictions using a fully coupled ocean-atmosphere model. J Clim 21(1):84-93.
- [25] Chekroun MD, Kondrashov D, Ghil M (2011). Predicting stochastic systems by noise sampling, and application to the El Niño-Southern Oscillation. Proc Nat Acad Sci USA 108(29):11766–11771.
- [26] Chapman D, Cane MA, Henderson N, Lee DE, Chen C (2015) A Vector Autoregressive ENSO Prediction Model. J Clim 28:8511-8520.
- [27] Meng J, Fan J, Ashkenazy Y, Bunde A, Havlin S (2018) Forecasting the magnitude and onset of El Niño based on climate network New J Phys 20:043036.
- [28] Noteboom PD, Feng QY, Lopez C, Hernández-García, Dijkstra HA (2018) Using network theory and machine learning to predict El Niño. Earth Syst Dynam 9:969-983.
- [29] Ham YG, Kim JH,Luo, JJ (2019) Deep learning for multi-year ENSO forecasts. Nature, 573, 568-572.
- [30] S. Saha et al., The NCEP climate forecast system version 2. Journal of climate 27(6), 2185-2208 (2014).
- [31] Q. Y. Feng et al., ClimateLearn : A machine-learning approach for climate prediction using network measures. Geosci. Model Dev. 10.5194/gmd-2015-273 (2016).
- [32] Z. Lu, N. Yuan, Z. Fu, Percolation Phase Transition of Surface Air Temperature Networks under Attacks of El Niño/La Niña. Sci. Rep. 6, 26779 (2016).
- [33] V. Rodriguez-Mendez, V. M. Eguiluz, E. Hernandez-Garcia, J. J. Ramasco, Percolation-based precursors of transitions in extended systems. Sci. Rep. 6, 29552 (2016).
- [34] M. A. De Castro Santos, D. A. Vega-Oliveros, L. Zhao, L. Berton, Classifying El Niño-Southern Oscillation combining network science and machine learning. IEEE Access 8, 55711-55723 (2020).
- [35] P. J. Petersik, H. A. Dijkstra, Probabilistic forecasting of El Niño using neural network models. Geophys. Res. Lett. 47, e2019GL086423 (2020).
- [36] F. Hassanibesheli, J. Kurths, N. Boers, Long-term ENSO prediction with echo-state networks. Environmental Research: Climate 1(1), 011002 (2022).
- [37] Webster PJ (1995) The annual cycle and the predictability of the tropical coupled ocean-athomosphere system. Meteorol Atmos Phys 56:33-55.
- [38] Goddard L et al. (2001) Current approaches to seasonal to interannual climate predictions. Int J Clim 21:1111-1152.
- [39] A. G. Barnston, M. K. Tippett, M. L. L’Heureux, S. Li, D. G. DeWitt, Skill of real-time seasonal ENSO model predictions during 2002-11: Is our capability increasing? Bulletin of the American Meteorological Society 93(5), 631-651 (2012).
- [40] Ludescher J, Gozolchiani A, Bogachev MI, Bunde A, Havlin S, Schellnhuber HJ (2014) Very early warning of next El Niño. Proc Natl Acad Sci USA 111:2064-2066; ibid. doi: 10.1073/pnas.1323058111.
- [41] Ludescher J, Meng J, Fan J (2021) Climate network and complexity based El Niño forecast for 2021. arXiv:2102.02192.
- [42] Tsonis AA, Swanson KL, Roebber PJ (2006) What do networks have to do with climate? Bull Amer Meteor Soc 87:585-595.
- [43] Yamasaki K, Gozolchiani A, Havlin S (2008) Climate networks around the globe are significantly affected by El Niño. Phys Rev Lett 100:228501.
- [44] Donges JF, Zou Y, Marwan N, Kurths, J (2009) The backbone of the climate network. EPL (Europhysics Letters) 87:48007.
- [45] Gozolchiani A, Havlin S, Yamasaki K (2011) Emergence of El Niño as an autonomous component in the climate network. Phys Rev Lett 107:148501.
- [46] Dijkstra HA, Hernández-García E, Masoller C, Barreiro M (2019) Networks in Climate (Cambridge Univ Press, Cambridge, UK).
- [47] Fan J, Meng J, Ludescher J, Chen X, Ashkenazy Y, Kurths J, Havlin S, Schellnhuber HJ (2020) Statistical physics approaches to the complex Earth system. Physics Reports 896:1-84.
- [48] Ludescher J, Martin M, Boers N, Bunde A, Ciemer C, Fan J, Havlin S, Kretschmer M, Kurths J, Runge J, Stolbova V, Surovyatkina E, Schellnhuber HJ (2021) Network-based forecasting of climate phenomena. Proc Natl Acad Sci USA 118(47) e1922872118, doi: 10.1073/pnas.1922872118.
- [49] Fan J, Meng J, Ludescher J, Li Z, Surovyatkina E, Chen X, Kurths J, Schellnhuber HJ (2022) Network-based approach and climate change benefits for forecasting the amount of indian monsoon rainfall. Journal of Climate, 35(3), 1009-1020.
- [50] Jaynes, E. T., Probability theory: The logic of science. Cambridge university press. (2003).
- [51] K. Ashok, S. K. Behera, S. S. Rao, H. Weng, T. Yamagata, El Niño Modoki and its possible teleconnection. Journal of Geophysical Research: Oceans 112(C11) (2007).
- [52] M. Wiedermann, J. F. Siegmund, J. F. Donges, R. V. Donner, Differential imprints of distinct ENSO flavors in global patterns of very low and high seasonal precipitation. Frontiers in Climate 3, 618548 (2021).
- [53] H. Weng, K. Ashok, S. K. Behera, S. A. Rao, T. Yamagata, Impacts of recent El Niño on Modoki dry/wet conditions in the Pacific rim during boreal summer. Clim. Dyn. 29, 113-129 (2007).
- [54] P. Lagos, Y. Silva, E. Nickl, K. Mosquera, El Niño related precipitation variability in Peru. Advances in Geosciences 14, 231-237 (2008).
- [55] J. Bazo, M. D. L. N. Lorenzo, R. Porfirio da Rocha, Relationship between monthly rainfall in NW Peru and tropical sea surface temperature. Advances in Meteorology 2013, 152875 (2013).
- [56] Ludescher, J., Bunde, A., Schellnhuber, H. J., Forecasting the El Niño type well before the spring predictability barrier. arXiv preprint arXiv:2212.14025 (2022).
- [57] Kalnay et al (1996) The NCEP/NCAR 40-year reanalysis project. Bull Am Meteorol Soc 77:437-471.
- [58] National Oceanic and Atmospheric Administration, Earth System Research Laboratory. http.//www.esrl.noaa.gov/psd/data/gridded/data.ncep/reanalyis.html
- [59] Richman JS, Moorman JR (2000) Physiological time-series analysis using approximate entropy and sample entropy. Am J Physiol Heart Circ Physiol 278, H2039–2049.
- [60] ERA5 Climate reanalyis. https://climate.copernicus.eu/climate-reanalysis?q=products/ climate-reanalysis.
- [61] Trenberth, K. E., Caron, J. M., Stepaniak, D. P., Worley, S. (2002). Evolution of El Niño–Southern Oscillation and global atmospheric surface temperatures. Journal of Geophysical Research: Atmospheres, 107(D8), AAC-5.
- [62] Foster, G., Rahmstorf, S. (2011). Global temperature evolution 1979–2010. Environmental research letters, 6(4), 044022.
- [63] Trenberth, K. E., Fasullo, J. T. (2013). An apparent hiatus in global warming?. Earth’s Future, 1(1), 19-32.
- [64] Berkley Earth, Global Temperature Report for 2022. https://berkeleyearth.org/global-temperature-report-for-2022/
- [65] World Meteorological Organization. WMO Provisional State of the Global Climate 2022. https://library.wmo.int/doc_num.php?explnum_id=11359
- [66] World Meteorological Organization, Past eight years confirmed to be the eight warmest on record. https://public.wmo.int/en/media/press-release/past-eight-years-confirmed-be-eight-warmest-record
- [67] Copernicus Climate Change Service, Globe in 2022. https://climate.copernicus.eu/sites/default /files/2023-01/Global_climate_highlights_2022_GLOBE_in_2022_for_press_resources_page _FINAL_0.pdf
- [68] National Aeronautics and Space Administration, https://www.nasa.gov/press-release/nasa-says-2022-fifth-warmest-year-on-record-warming-trend-continues
- [69] Met Office, 2022: sixth warmest year on record globally. https://www.metoffice.gov.uk/about-us/press-office/news/weather-and-climate/2023/2022-hadcrut5-wmo-temperature-statement
- [70] National Oceanic and Atmospheric Administration, 2022 was world’s 6th-warmest year on record. https://www.noaa.gov/news/2022-was-worlds-6th-warmest-year-on-record