Kinematic and thermal signatures of the directly imaged protoplanet candidate around Elias 2-24
Abstract
We report kinematic and thermal signatures associated with the directly imaged protoplanet candidate in the Elias 2-24 disc. Using the DSHARP ALMA observations of the 12CO J=2-1 line, we show that the disc kinematics are perturbed, with a detached CO emission spot at the location of the planet candidate and traces of spiral wakes, and also that the observed CO emission intensities require local heating. While the foreground extinction hides the velocity channels associated with the planet, preventing a planet mass estimate, the level of gas heating implied by the CO emission indicates the presence of a warm, embedded giant planet. Comparison with models show this could either be a MJup, or a lower mass ( MJup) but accreting proto-planet.
keywords:
planets and satellites: detection — planets and satellites: formation — protoplanetary discs — planet-disc interactions1 Introduction
The characterisation of young, still embedded, and potentially forming planets is in its infancy. Detecting them via direct imaging has proven more challenging than first envisaged, with the new generation of adaptive optics systems having yielded only two confirmed exoplanet detections within a protoplanetary disc to date (e.g. Keppler et al., 2018; Müller et al., 2018; Christiaens et al., 2019; Haffert et al., 2019, see reviews by Benisty et al., 2022 and Currie et al., 2022). The high sensitivity of the Atacama Large Millimetre/submillimetre Array (ALMA) enabled the developement of a new planet detection method. By mapping of perturbations to the disc kinematics via high spectral resolution line imaging, ALMA can reveal the presence of otherwise hidden planets (e.g. Perez et al. (2015); Pérez et al. (2018), see review by Pinte et al., 2022). This led to the detection of a growing number of planet candidates (e.g. Pinte et al., 2018, 2019, 2020; Teague et al., 2018, 2021, 2022; Casassus & Pérez, 2019; Casassus et al., 2022; Pérez et al., 2020; Calcino et al., 2022; Izquierdo et al., 2022; Bae et al., 2022; Verrios et al., 2022; Garg et al., 2022).
Despite these promising results, there is not yet any example of a detection with both disc kinematics and direct imaging. Such a detection would constrain both the luminosity (via direct imaging) and the mass (via disc kinematics) of a newborn planet, thus distinguishing whether planets are born in a hot, cold, or warm start scenario (e.g. Marley et al., 2007; Spiegel & Burrows, 2012). In this Letter we report such a detection in the disc of Elias 2-24 where Jorquera et al. (2021, hereafter J21) found evidence for a planet in images from the Nasmyth Adaptive Optics System Near-Infrared Imager and Spectrograph (NaCo) on the VLT.
2 Observations and data reduction
We re-analysed the NaCo Elias2-24 observations in -band from July 15, 2018 (J21), using the same pre-processed Angular Differential Imaging (ADI) cube, stellar point spread function and parallactic angles acquired by J21 and the same platescale and true north calibrations. After bad frame removal, the cube contained 414 frames with total on-source integration time of 82.8 minutes and full-width at half-maximum (FWHM) of 0.116". After subtracting the median background, we post-processed the cube using median ADI, full-frame Principal Component Analysis PCA-ADI and PCA-ADI in concentric annuli using our NaCo data reduction pipeline (Hammond et al., 2022), based on the Vortex Image Processing package (vip, Gomez Gonzalez et al. 2017). For PCA-ADI in concentric annuli, we used a 1-FWHM rotation angle threshold, a 1-FWHM inner mask and 12-pixel (0.326") wide annuli to 50 principal components. We excluded the inner 0.22" of the post-processed images which contained residual speckle noise overlapping the saturated PSF core.
We used the publicly available 12CO data cube and measurement set from the Disc Substructures at High Angular Resolution Project (DSHARP; Andrews et al. 2018). The limited signal-to-noise and coverage of the data — where the main goal was to image continuum at high spatial resolution — can lead to image synthesis artefacts in CO emission potentially mimicking kinematic deviations. Continuum subtraction can also affect the line brightness and morphology of optically thick line emission when continuum and line intensity are comparable (Boehler et al., 2017). To test these effects, we followed Pinte et al. (2020) and imaged the data for a set of imaging parameters (robust parameter and Gaussian taper size), with and without continuum subtraction and the “JvM” correction (Jorsater & van Moorsel, 1995; Czekala et al., 2021). For all imaging attempts, we used the auto-masking function of tclean. The planet signal we report below was detected in all resulting images. Hence, we only show the fiducial DSHARP cube (beam size 0.09"0.06" at PA=90o with a rms of 1.4mJy/beam per channel, no JvM correction).
3 Results
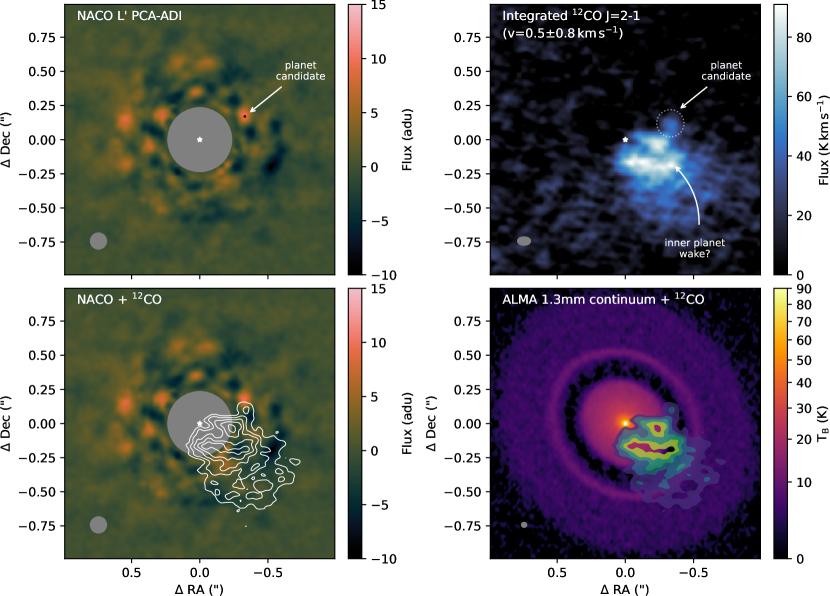
We recover the J21 detection in our re-reduction of their data using classical ADI and PCA-ADI (Fig. 1). We estimated the flux and position of the source by minimizing the residuals after injecting a negative fake companion (NEGFC) using a simplex Nelder-Mead minimization function. We then sampled the parameter space around the minima using a Markov chain Monte Carlo (MCMC) with 4,500 steps and 120 walkers. We used the new log-probability function introduced by Christiaens et al. (2021) to take into account the effect of stellar speckles. We obtained a separation of 0.370.04" (51.8 au) and a PA of 298.44.6∘. Using the flux from the star in one FWHM aperture and flux from the candidate, we derived an contrast of 8.78 mag.
The location is consistent within 1- with J21’s reported separation of 0.4110.008 ", PA=302.101.14 deg, and mag. The differences are due to high-pass filtering applied in J21 but not here, and our uncertainties are larger as we used a MCMC to explore correlations between parameters.
The planet candidate is close to the Airy ring caused by the saturated star in the absence of a coronagraph. Our imaging shows additional compact signals at similar level to the planet candidate, in particular to the South-East of the star. These may be due to imperfect subtraction near the Airy ring and/or to ADI filtering of the brighter disc surface (this corresponds to the near side of the disc, where we expect forward scattering). We created two contrast curves by considering either the entire frame or a wedge spanning a PA range of 270-20° to avoid the bright extended feature in the frame. We injected fake companions in the calibrated cube at varying radii to estimate the flux loss caused by post-processing. The final contrast curve considers Student statistics at small separation as proposed in Mawet et al. (2014), placing our detection at 4 in the wedge, or 2 in the full frame.
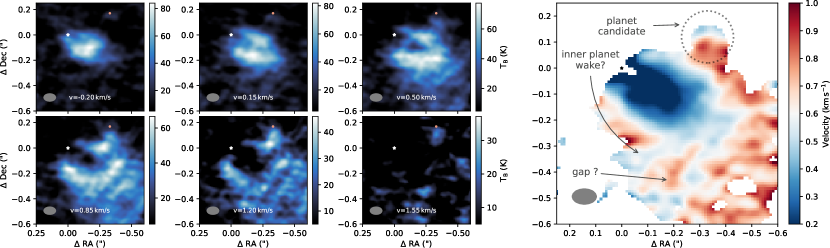
Fig. 1, top right shows a bright 12CO spot detached from the expected location of the emitting region along the isovelocity curve in the ALMA data, and located close to the NaCo planet candidate. The morphology matches that predicted by Perez et al. (2015) for emission from a circumplanetary disc (CPD), and is similar to the CPD candidate detection in 13CO by Bae et al. (2022) in AS 209. The CO spot lies inside the dust gap observed in 1.3mm continuum emission (Fig. 1, bottom right). We detect the CO spot in 6 channels (imaged with a channel width of 350 m s-1) from -0.20 to 1.55 km s-1 (Fig. 2), which corresponds to 3 spectral resolution elements (velocity resolution of 700 m s-1), with a significance of 4 to 10 times the rms. In individual channels, the spot is spatially unresolved, but its position moves slightly from channel to channel, resulting in a velocity gradient across the spot. We measure a separation of 0.360.04" and PA = 2903∘ by fitting a Gaussian to the CO spot. Channels at velocities larger than 1.55 km s-1 are contaminated by the intervening cloud and/or envelope. The missing emission means that the measured position of the CO spot may be shifted from the actual planet location.
At 1.55 km s-1, most of the disc emission has disappeared apart from the CO spot itself, indicating that CO spot is brighter than the surrounding disc. Contamination starts to impact the data at v0.5 km s-1, visible as a decreasing brightness temperature in Fig. 2. In particular, we do not detect any emission in the channel where the isovelocity curve would correspond to the location of the planet candidate. This prevents us from detecting a potential velocity kink as seen in HD 163296 (Pinte et al., 2018), HD 97048 (Pinte et al., 2019) or AS 209 (Bae et al., 2022). Nonetheless, a partial moment 1 map (i.e. integrated over velocities between -0.20 and 1.55 km s-1) shows a significant shift in velocity at the location of the planet candidate, as illustrated by the white level in the right panel of Fig. 2, which traces the isovelocity at 0.6 km s-1. We caution here that this does not allow for a measurement of the actual velocity shift at the location of the planet candidate, as some emission at the same location is missing due to contaminated channels, resulting in a skewed moment map. The partial moment 1 map (right panel of Fig. 2) also confirms the observed velocity gradient across the CO spot. Due to the missing emission in subsequent channels, it is not possible to determine if the velocity gradient is from the global Keplerian rotation of the disc or from additional velocity perturbations near the planet candidate. For the same reason, the extincted channels prevent us from measuring the local line width, but the detection of the CO spot in 6 channels indicates it is larger than in the surrounding disc. This is consistent with the prediction from an embedded planet (Fig. 3 in Perez et al., 2015).
4 Models and disccussion
To check if an embedded planet can explain the observed kinematic structures, we performed a series of 3D multigrain gas+dust simulations with the Smoothed Particle Hydrodynamics (SPH) code phantom (Price et al., 2018), using particles and evolving the dust fraction with 11 grain sizes between 1 m and 1 mm employing the one fluid formalism (Laibe & Price, 2014; Price & Laibe, 2015; Hutchison et al., 2018). Comparison with evolutionary tracks indicates a low stellar mass ( 0.8M⊙, Wilking et al., 2005; Andrews et al., 2010, 2018), but the high extinction (A) makes this estimate uncertain. By matching isovelocity contours to the (few) non-extincted red and blue channels, we find a dynamical stellar mass close to M⊙, which we adopt here, and the systemic velocity is 3.0 km s-1. We set the accretion radius to 1 au. We setup a disc with an initial gas mass of 0.01M⊙ between 5 and 180 au, a tapered surface density profile:
with and au. We adopted a vertically isothermal equation of state with at au and sound speed power-law index of -1/3. The density and temperature profiles impact the planet wake shape, which we cannot constrain here due to contamination, but not the kinematic signature near the planet, so we kept these values fixed. We set the shock viscosity to obtain a mean Shakura-Sunyaev viscosity of . This is above the lower bound of to resolve physical viscosity in phantom (Price et al., 2018).
We embedded a planet at 65 au with an initial mass of either 1,3,5,7 or 10 MJup, with accretion radius set to 0.125 times the Hill radius. We evolved the simulations for 100 planet orbits, by which time the planets reached a mass of 3.1, 5.8, 8.3, 10.5 and 12.5 MJup, and migrated to radii between 56 and 60 au.
We post-processed the models with the radiative transfer code mcfost (Pinte et al., 2006; Pinte et al., 2009) to compute the dust temperature structure and synthetic continuum and CO maps, matching Voronoi cells to SPH particles. We assumed a distance of 140 pc (Gaia Collaboration et al., 2021) and 1Myr isochrones to set the star (Siess et al., 2000) and planet (Allard et al., 2012) luminosities and effective temperature, giving a radius of 3 R⊙, and K for the central star. These values differ slightly from the published photometric estimates (4.5 R⊙, and K), but those estimates suffer from high extinction and the morphology of the emission does not depend on the stellar parameter. For the planets, we obtained radii of 0.19, 0.22, 0.26, 0.29 and 0.32 R⊙ and , 1960, 2150, 2250 and 2350 K. Because the accretion rate on the planet varied during the simulations, we used it as an additional free parameter in the radiative transfer, assuming the accretion luminosity is radiated from the planet surface (see Borchert et al., 2022 for details).
We assumed astrosilicate grains (Weingartner & Draine, 2001) with sizes following between 0.03 to 1000m, a gas-to-dust ratio of 100, and computed the dust optical properties using Mie theory. Following Pinte et al. (2009), we allowed for fluffy grains by assigning a larger Stokes number for a given grain size. We set , and assumed that the CO 2-1 transition is at local thermodynamic equilibrium. We set the CO abundance following the prescription in Appendix B of Pinte et al. (2018) to account for freeze-out where T K, as well as photo-dissociation and photo-desorption. We set the turbulent velocity to zero.
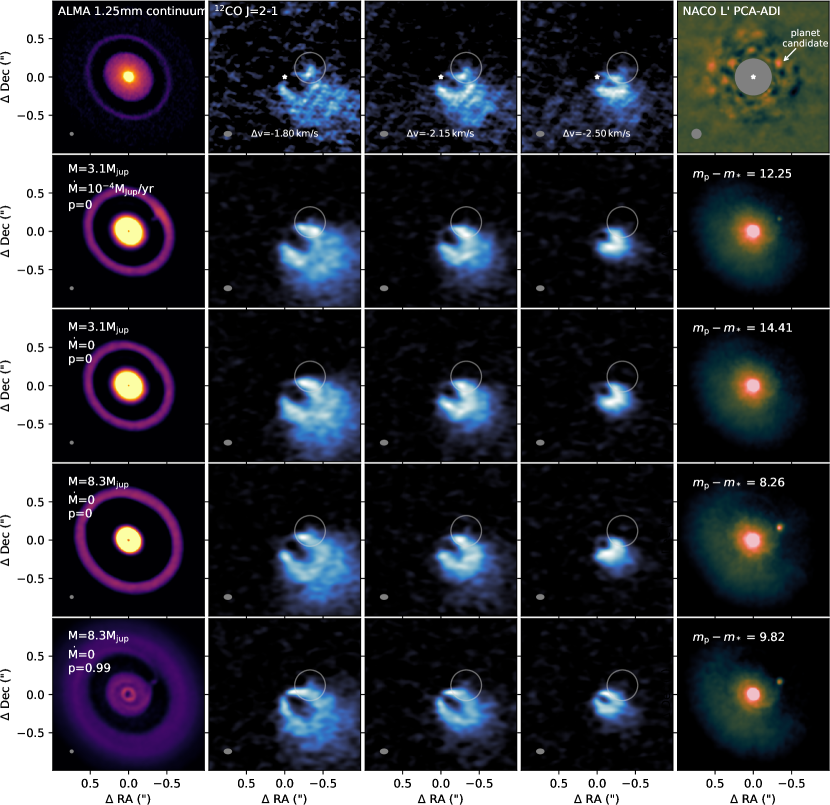
Figure 3 shows the predicted emission for a selection of our model grid. A 3 MJup planet can produce a detached CO spot that resembles the observations but only if the planet is accreting at high rate (MJup/yr; second row). Without accretion on the planet, no CO spot is visible (third row), and the planet is almost completely hidden by the disc in scattered light. The high accretion rate model results in local heating of the outer dust ring in our model, which is not observed in the 1.25mm continuum data. Alternatively, a more massive planet ( 8MJup) can reproduce the observed CO spot without significant accretion (fourth row). With compact dust grains, this results in a wider dust gap in the model than in the 1.25mm observations. To simultaneously reproduce the dust gap and CO spot with such a massive planet, our model requires porous grains (bottom row). In that case a “circumplanetary disc" (CPD) is visible in the continuum emission, contrary to the data (Andrews et al., 2021). We note however that the CO spot does not trace a possible CPD, but kinematic structures high above the midplane: performing the same radiative transfer simulations after removing the Hill sphere results in indistinguishable channel maps.
Rescaling for a central mass of 1.5M⊙, Cieza et al. (2017), Dipierro et al. (2018) and Zhang et al. (2018) estimated from the depth and width of the dust gap a planet mass of 1.5 to 12, 1, and 0.4 to 3.3 MJup respectively. The lower bound of these estimates is about 10 times lower than our minimum mass of 3 MJup. We found a similar discrepancy for HD 97048 (Pinte et al., 2019) and the other DSHARP sources with tentative velocity kinks (Pinte et al., 2020), where we suggested that the dust grains dominating the sub-millimetre emission have Stokes numbers of a few , like in our highly porous model (Fig. 3, bottom row).
J21 found a mass between 0.5 and 5 MJup for the planet by comparing the contrast to predictions of masses and accretion rates from Zhu (2015) for embedded planets with circumplanetary discs. Our models suggest the planet may be more massive. All our models, including the ones with a 8 MJup planet, result in a contrast higher or consistent with the observations, as the intrinsic emission from the planet and its surrounding environment are significantly extincted by the disc. The observed luminosity of the planet depends on properties including its accretion rate, its potential CPD (e.g. Szulágyi et al., 2019), but also crucially on the circumstellar disc optical depth at the planet location. We thus cannot exclude the 3MJup models, as a lower infrared dust opacity would make the planet more visible.
None of our models reproduce all the observations. They should only be seen as a guide to try to understand the emission in the sub-millimetre and infrared continuum, and in CO lines. Our main limitation is the heavy cloud contamination which hides most of the disc — in particular the channel where the disc isovelocity curve overlaps the planet location, where we expect a velocity kink ( 1.8 km/s). Hence it is not possible to estimate a robust planet mass from kinematics. Deeper observations with less contamination, i.e. higher-J 12CO or in less abundant isotopes are required. Similarly, Cleeves et al. (2015) predicted that embedded giant planets should have observable “chemical" signatures, in tracers like HCN or CS. Our model requires the planet to heat its surrounding environment either because it is massive and hot or because it is accreting at a high rate. Elias 2-24 is a prime target to search for such a signature.
5 Conclusions
-
1.
We detect a 12CO counterpart of the planet candidate presented by J21, and we recover the companion with independent reduction of the NaCo data. If confirmed this would be the first simultaneous planet detection via disc kinematics and direct imaging.
-
2.
The CO data shows a velocity shift, broadened linewidth, and increased disc temperature at the location of the planet candidate, all of which are predicted by models of planet-disc interactions.
-
3.
These kinematic structures can be explained by a MJup planet or a 3MJup accreting planet.
-
4.
Cloud contamination prevents an accurate planet mass estimation. Higher-J and/or less abundant isotopologues/molecules can alleviate this, and together with the measured flux, or improved data from e.g. VLT/ERIS, can provide the first simultaneous dynamical and luminosity constraints on a forming planet candidate.
Data and software avaibility
Raw data sets are publicly available on the ALMA and ESO archives. Calibrated ALMA data sets are available at alma-dl.mtk.nao.ac.jp/ftp/alma/lp/DSHARP. Calibrated NACO data and synthetic models are available at 10.6084/m9.figshare.21915000. Our NaCo pipeline is available at: github.com/IainHammond/NaCo_pipeline. phantom and mcfost are publicly available at github.com/danieljprice/phantom and github.com/cpinte/mcfost. The scripts used to make the figures are available at https://github.com/cpinte/elias2-24.
Acknowledgments
We made use of ALMA data ADS/JAO.ALMA#2016.1.00484.L. ALMA is a partnership of ESO (representing its member states), NSF (USA) and NINS (Japan), together with NRC (Canada), MOST and ASIAA (Taiwan), and KASI (Republic of Korea), in cooperation with Chile. The Joint ALMA Observatory is operated by ESO, AUI/NRAO and NAOJ. The National Radio Astronomy Observatory is a facility of the National Science Foundation operated under agreement with Associated Universities, Inc. Simulations were performed on ozSTAR, funded by Swinburne University and the Australian Government. C.P., V.C. and D.J.P. acknowledge Australian Research Council funding via FT170100040, DP18010423 and DP220103767. L.P. and S.J. gratefully acknowledge support from ANID BASAL project FB210003, ANID – Millennium Science Initiative Program – NCN19_171, and ANID FONDECYT 1221442.
References
- Allard et al. (2012) Allard F., Homeier D., Freytag B., 2012, Phil. Trans. Roy. Soc. A, 370, 2765
- Andrews et al. (2010) Andrews S. M., et al., 2010, ApJ, 723, 1241
- Andrews et al. (2018) Andrews S. M., et al., 2018, ApJ, 869, L41
- Andrews et al. (2021) Andrews S. M., et al., 2021, ApJ, 916, 51
- Bae et al. (2022) Bae J., et al., 2022, ApJ, 934, L20
- Benisty et al. (2022) Benisty M., et al., 2022, arXiv e-prints, p. arXiv:2203.09991
- Boehler et al. (2017) Boehler Y., et al., 2017, ApJ, 840, 60
- Borchert et al. (2022) Borchert E. M. A., Price D. J., Pinte C., Cuello N., 2022, MNRAS,
- Calcino et al. (2022) Calcino J., et al., 2022, ApJ, 929, L25
- Casassus & Pérez (2019) Casassus S., Pérez S., 2019, ApJ, 883, L41
- Casassus et al. (2022) Casassus S., Cárcamo M., Hales A., Weber P., Dent B., 2022, ApJ, 933, L4
- Christiaens et al. (2019) Christiaens V., et al., 2019, MNRAS, 486, 5819
- Christiaens et al. (2021) Christiaens V., et al., 2021, MNRAS, 502, 6117
- Cieza et al. (2017) Cieza L. A., et al., 2017, ApJ, 851, L23
- Cleeves et al. (2015) Cleeves L. I., Bergin E. A., Harries T. J., 2015, ApJ, 807, 2
- Currie et al. (2022) Currie T., et al., 2022, arXiv e-prints, p. arXiv:2205.05696
- Czekala et al. (2021) Czekala I., et al., 2021, ApJS, 257, 2
- Dipierro et al. (2018) Dipierro G., et al., 2018, MNRAS, 475, 5296
- Gaia Collaboration et al. (2021) Gaia Collaboration et al., 2021, A&A, 649, A1
- Garg et al. (2022) Garg H., et al., 2022, arXiv e-prints, p. arXiv:2210.10248
- Gomez Gonzalez et al. (2017) Gomez Gonzalez C. A., et al., 2017, AJ, 154, 7
- Haffert et al. (2019) Haffert S. Y., et al., 2019, Nature Astronomy, 3, 749
- Hammond et al. (2022) Hammond I., et al., 2022, MNRAS, 515, 6109
- Hutchison et al. (2018) Hutchison M., Price D. J., Laibe G., 2018, MNRAS, 476, 2186
- Izquierdo et al. (2022) Izquierdo A. F., et al., 2022, ApJ, 928, 2
- Jorquera et al. (2021) Jorquera S., et al., 2021, AJ, 161, 146
- Jorsater & van Moorsel (1995) Jorsater S., van Moorsel G. A., 1995, AJ, 110, 2037
- Keppler et al. (2018) Keppler M., et al., 2018, A&A, 617, A44
- Laibe & Price (2014) Laibe G., Price D. J., 2014, MNRAS, 440, 2136
- Marley et al. (2007) Marley M. S., et al., 2007, ApJ, 655, 541
- Mawet et al. (2014) Mawet D., et al., 2014, ApJ, 792, 97
- Müller et al. (2018) Müller A., et al., 2018, A&A, 617, L2
- Perez et al. (2015) Perez S., et al., 2015, ApJ, 811, L5
- Pérez et al. (2018) Pérez S., Casassus S., Benítez-Llambay P., 2018, MNRAS, 480, L12
- Pérez et al. (2020) Pérez S., et al., 2020, ApJ, 889, L24
- Pinte et al. (2006) Pinte C., Ménard F., Duchêne G., Bastien P., 2006, A&A, 459, 797
- Pinte et al. (2009) Pinte C., et al., 2009, A&A, 498, 967
- Pinte et al. (2018) Pinte C., et al., 2018, ApJ, 860, L13
- Pinte et al. (2019) Pinte C., et al., 2019, Nature Astronomy, 3, 1109
- Pinte et al. (2020) Pinte C., et al., 2020, ApJ, 890, L9
- Pinte et al. (2022) Pinte C., et al., 2022, arXiv e-prints, p. arXiv:2203.09528
- Price & Laibe (2015) Price D. J., Laibe G., 2015, MNRAS, 451, 813
- Price et al. (2018) Price D. J., et al., 2018, Publ. Astron. Soc. Australia, 35, e031
- Siess et al. (2000) Siess L., Dufour E., Forestini M., 2000, A&A, 358, 593
- Spiegel & Burrows (2012) Spiegel D. S., Burrows A., 2012, ApJ, 745, 174
- Szulágyi et al. (2019) Szulágyi J., Dullemond C. P., Pohl A., Quanz S. P., 2019, MNRAS, 487, 1248
- Teague et al. (2018) Teague R., et al., 2018, ApJ, 860, L12
- Teague et al. (2021) Teague R., et al., 2021, ApJS, 257, 18
- Teague et al. (2022) Teague R., et al., 2022, ApJ, 936, 163
- Verrios et al. (2022) Verrios H. J., Price D. J., Pinte C., Hilder T., Calcino J., 2022, ApJ, 934, L11
- Weingartner & Draine (2001) Weingartner J. C., Draine B. T., 2001, ApJ, 548, 296
- Wilking et al. (2005) Wilking B. A., et al., 2005, AJ, 130, 1733
- Zhang et al. (2018) Zhang S., et al., 2018, ApJ, 869, L47
- Zhu (2015) Zhu Z., 2015, ApJ, 799, 16