Resurrection of type IIL supernova 2018ivc: Implications for a binary evolution sequence connecting hydrogen-rich and -poor progenitors
Abstract
Long-term observations of synchrotron emission from supernovae (SNe), covering more than a year after the explosion, provide a unique opportunity to study the poorly-understood evolution of massive stars in the final millennium of their lives via changes in the mass-loss rate. Here, we present a result of our long-term monitoring of a peculiar type IIL SN 2018ivc, using the Atacama Large Millimeter/submillimeter Array (ALMA). Following the initial decay, it showed unprecedented rebrightening starting at a year after the explosion. This is one of the rare examples showing such rebrightening in the synchrotron emission, and the first case at millimeter wavelengths. We find it to be in the optically-thin regime unlike the optically-thick centimeter emission. As such, we can robustly reconstruct the distribution of the circumstellar matter (CSM) and thus the mass-loss history in the final years. We find that the progenitor of SN 2018ivc had experienced a very high mass-loss rate ( yr-1) years before the explosion, which was followed by a moderately high mass-loss rate ( yr-1) up until the explosion. From this behavior, we suggest SN 2018ivc represents an extreme version of a binary evolution toward SNe IIb, which bridges the hydrogen-poor SNe (toward SNe Ib/c, without a hydrogen envelope) and hydrogen-rich SNe (SNe IIP, with a massive envelope).
1 Introduction
| MJD | Phasea | Frequencyb | Array | Resolutiond | ID | PI | |
|---|---|---|---|---|---|---|---|
| (Days) | (GHz) | (mJy) | |||||
| Band 3 | |||||||
| 58449.1e | 4.1 | 100.0 | C43-4 | 2018.1.01193.T | K. Maeda | ||
| 58452.1e | 7.1 | 100.0 | C43-4 | 2018.1.01193.T | K. Maeda | ||
| 58462.1e | 17.1 | 100.0 | C43-4 | 2018.1.01193.T | K. Maeda | ||
| 58466.0 | 21.0 | 93.5 | C43-4 | 114 | 2018.1.01506.S | S. Viti | |
| 58643.6e | 198.6 | 100.0 | C43-9 | 2018.A.00038.S | K. Maeda | ||
| 58658.5 | 213.5 | 92.1 | C43-9 | 005 | 2018.1.01135.S | J. Wang | |
| 58751.2 | 306.2 | 103.0 | C43-6 | 033 | 2018.1.01684.S | T. Tosaki | |
| 59469.4 | 1024.4 | 92.1 | C43-9 | 005 | 2019.1.00026.S | M. Imanishi | |
| 59809.4 | 1364.4 | 100.0 | C-5 | 076 | 2021.A.00026.S | K. Maeda | |
| Band 6 | |||||||
| 58449.1e | 4.1 | 250.0 | C43-4 | 2018.1.01193.T | K. Maeda | ||
| 58451.2e | 6.2 | 250.0 | C43-4 | 2018.1.01193.T | K. Maeda | ||
| 58462.1e | 17.1 | 250.0 | C43-4 | 2018.1.01193.T | K. Maeda | ||
| 58643.6e | 198.6 | 250.0 | C43-9 | 2018.A.00038.S | K. Maeda | ||
| 59809.4 | 1364.4 | 250.0 | C-5 | 030 | 2021.A.00026.S | K. Maeda |
Note. — aThe phase is measured from the putative explosion date (MJD 58445.0). bCentral frequency. cWith error. dAverage of the major and minor axes. eFrom Maeda et al. (2022).
The evolution of massive stars toward core collapse and supernova (SN) explosions has not been fully understood, especially in their post main-sequence (MS) evolution (e.g., Langer, 2012; Maeda, 2022). Studying the pre-SN mass-loss history, through observational data after the SN explosion, sheds light on this issue; it is essentially the one and only method to probe massive star evolution in the final millennium to even less than one year (e.g., Smith, 2017). The radio synchrotron emission, as created at the shock wave formed by the interaction between the SN ejecta and the circumstellar matter (CSM), is a direct probe to the CSM distribution (e.g., Chevalier, 1998; Chevalier & Fransson, 2006; Maeda, 2012; Matsuoka et al., 2019). For the typical SN shock velocity of km s-1 and the CSM velocity of km s-1 (for a case of a supergiant progenitor; Smith, 2017), the nature of the CSM probed by the synchrotron signal at a few years after the explosion translates to the mass-loss rate years before the explosion.
SNe IIb are a particularly interesting type of SNe in this context. They are defined by the initial appearance of hydrogen lines in their optical spectra which eventually disappear (Filippenko, 1997), indicating that they do not have the H-rich envelope as massive as canonical SNe II (red supergiant) while still keeping of the envelope (e.g., Shigeyama et al., 1994; Woosley et al., 1994; Bersten et al., 2012; Hiramatsu et al., 2021), the features which distinguish SNe IIb from the more stripped envelope analogs, i.e., SNe Ib (He star) or SNe Ic (C+O star). As such, SNe IIb bridges SNe II and SNe Ib/c in terms of the pre-SN mass loss mechanism, especially that responsible for ejecting the H-rich envelope (e.g., Fang et al., 2019). The binary evolution channel is a leading scenario for the envelope stripping from SNe II toward SNe IIb/Ib/Ic (e.g., Ouchi & Maeda, 2017; Yoon, 2017), whose progenitors probably share a similar initial mass range (e.g., Fang et al., 2019). Details are, however, yet to be clarified.
SN 2018ivc, as discovered by the Mpc SN survey (DLT40; Tartaglia et al., 2018) on 24 November 2018 (UT) within a day of the explosion (Valenti et al., 2018; Bostroem et al., 2020), is an outlier of the SN IIL subclass, with its faint and rapidly-evolving optical light curve. Maeda et al. (2022) presented and analyzed the data taken by the Atacama Large Millimeter/submillimeter Array (ALMA), covering to days since the (well-determined) explosion date, together with the optical and X-ray light curves. They suggested that SN 2018ivc is indeed an analog of an SN IIb explosion (potentially with a slightly more massive H-rich envelope), with its different observational features from canonical SNe IIb originating in its powering mechanism, the SN-CSM interaction. Such a scenario may also be in line with its optical spectral features showing broad and boxy emission lines (Dessart & Hillier, 2022). Maeda et al. (2022) further proposed that SN 2018ivc and a fraction of SNe IIL may be a direct link between SNe IIb and SNe IIP in the binary evolution where the sequence of SNe Ic/Ib-IIb-(some) IIL-IIP is mainly controlled by the initial orbital separation. This is along the same lines as previously suggested by Nomoto et al. (1995, 1996), but with a substantial difference in the mode of binary interaction (see Section 4 for more details).
The proximity (8”.7 east and 16”.1 north) of SN 2018ivc to the core of the well-studied Seyfert galaxy NGC1068 (M77), for which we assume the distance of Mpc (Tully et al., 2009), requires a high angular resolution to resolve this SN, but at the same time it offers a unique opportunity for long-term monitoring; the SN location may be covered by archival observations targeting the core of NGC1068. Recently, its detection at days after the explosion in the cm emission, at 6.5 GHz by the Karl G. Jansky Very Large Array (VLA) and at 6.3 GHz by the enhanced Multi-Element Radio Linked Interferometer Network (e-MERLIN), was reported (Mutie et al., 2022). In this paper, we report the result of our long-term monitoring of SN 2018ivc with ALMA. The paper is structured as follows. In Section 2, we present the observation and date reduction. Results are presented in Section 3, with the analysis of the nature of the CSM at a large scale around SN 2018ivc. Its implications for the progenitor evolution of SN 2018ivc and its relation to other classes of SNe are discussed in Section 4. The paper is summarized in Section 5 with concluding remarks.
2 Observations and Data Reduction
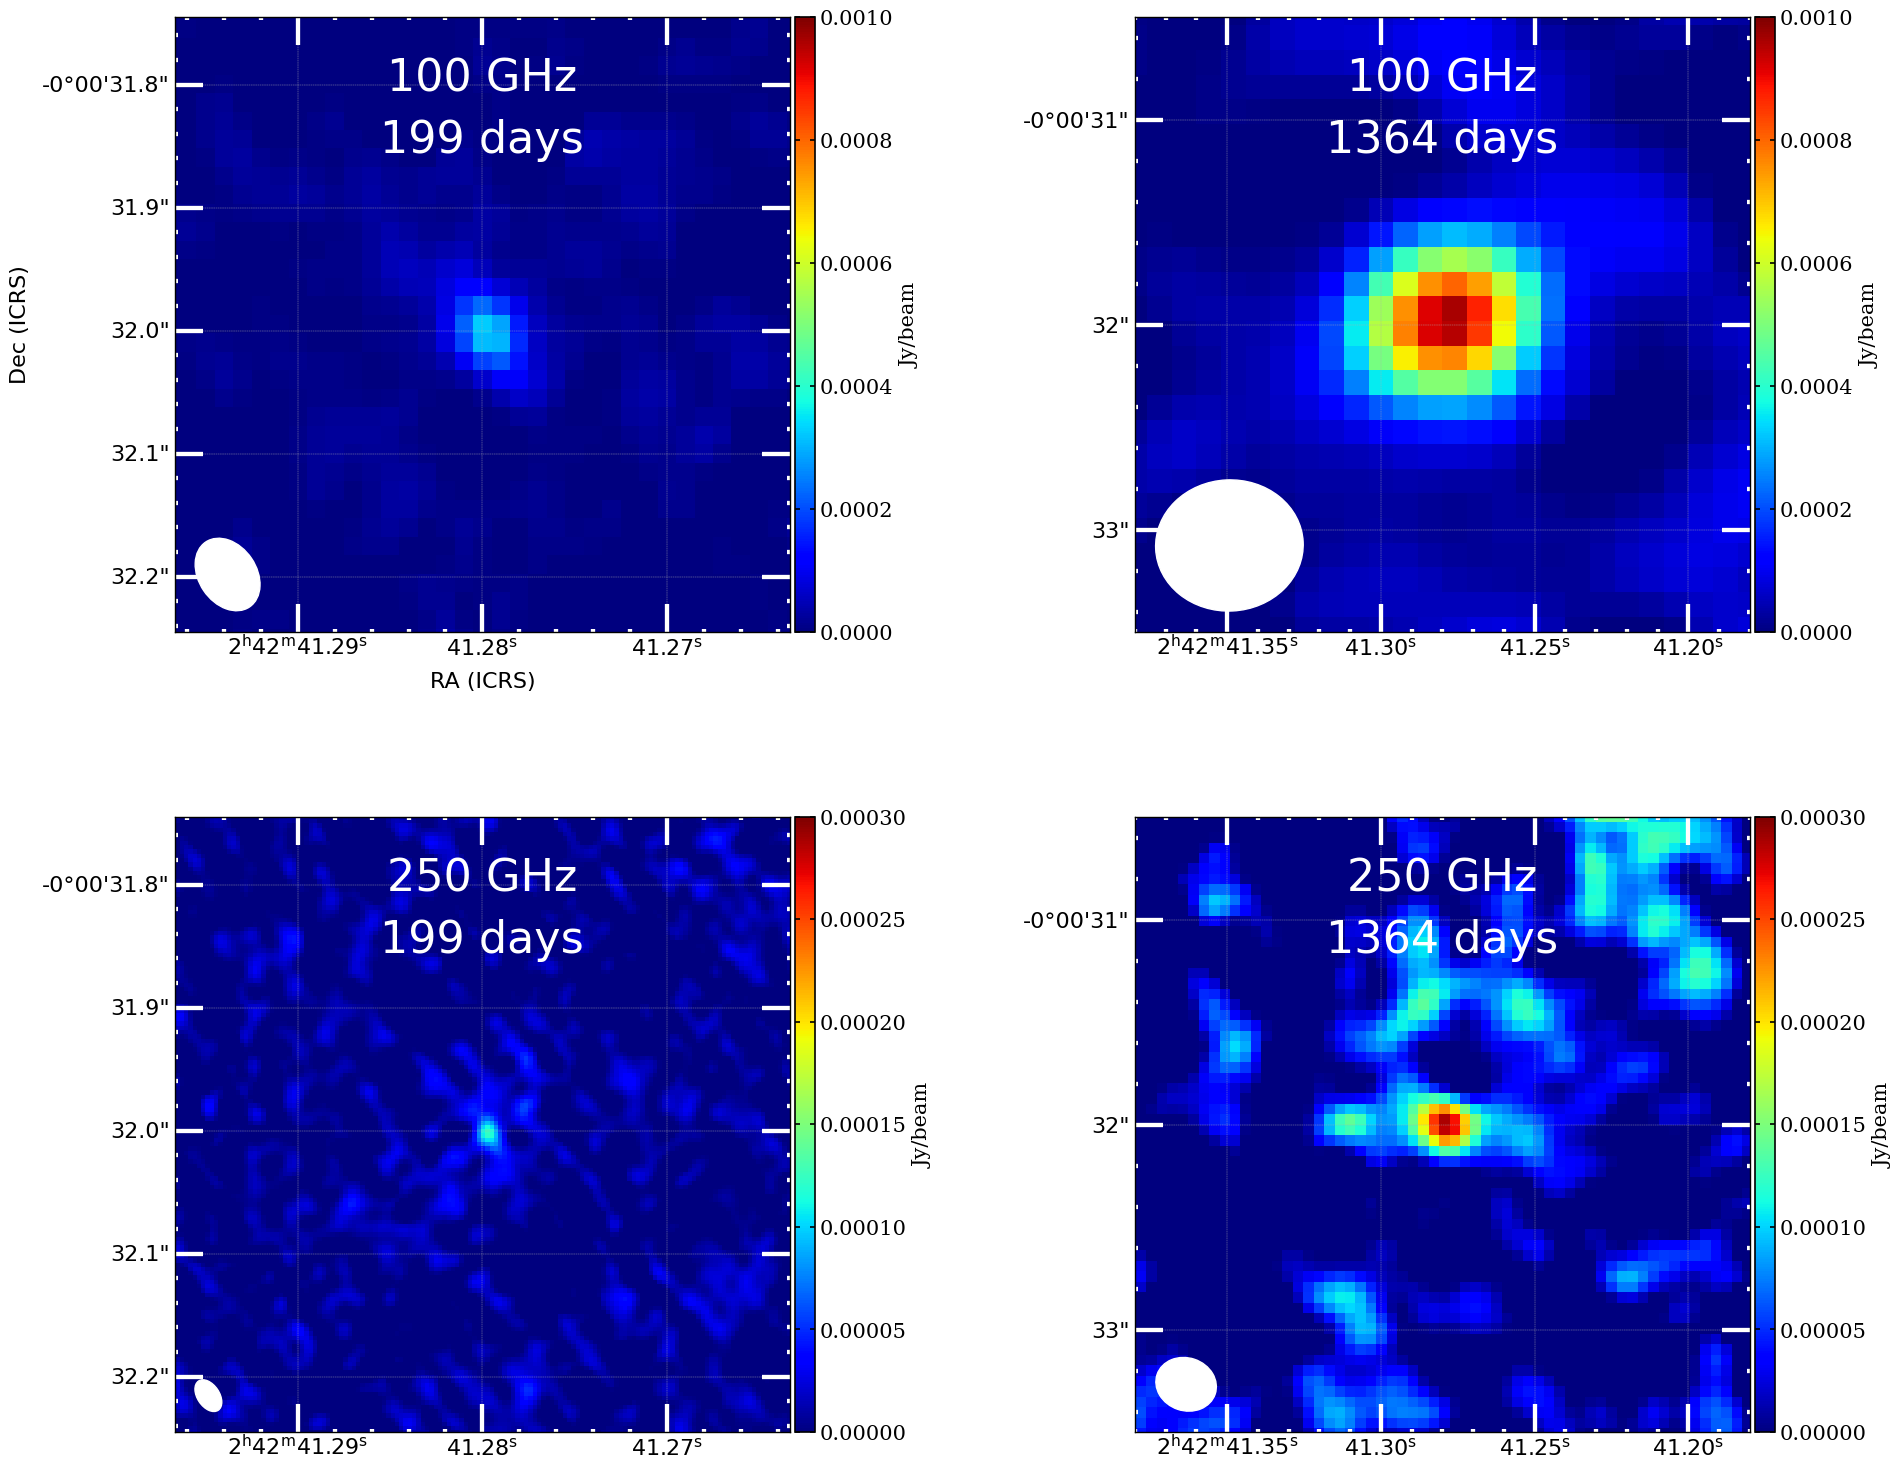
In this paper, we report late-time observations of SN 2018ivc ( days) based on data taken through our ALMA Director’s Discretionary Time (DDT) program 2021.A.00026.S (PI: K. Maeda), complemented by the data at earlier epochs published in Maeda et al. (2022) and archival data newly presented in this work. The log of the data used in the present work, together with the measured fluxes, is shown in Table 1. The DDT program was conducted on 2022 Aug 18 (1,364 days since the explosion), essentially in the same spectral setup with our early-phase observations up to days. On-target exposure time is 5.0 min for band 3 and 9.6 min for band 6. The central frequencies in the continuum bands are 100 and 250 GHz. The angular resolution is in band 3 and in band 6 (Figure 1). Since this observation targeted the SN i.e., point-source, the imaging processes are simple. We use the data calibrated through the standard ALMA pipeline with Common Astronomy Software Applications (CASA; THE CASA TEAM et al., 2022). The continuum flux densities associated with the SN on each image are measured based by imfit task in CASA.
In addition, we use ALMA Band 3 archival data that cover the position of SN 2018ivc. We selected the data in which the SN is detected at the signal-to-noise ratio of . We downloaded the processed fits continuum images by Japanese Virtual Observatory (JVO). In the cases of 2018.1.01135.S and 2019.1.00026.S, we manually performed the imaging processes, i.e., clean task in casa with primary beam correction because the archival fits images do not cover the SN position. For 2018.1.01135.S we conducted standard self-calibration to minimize the effects by sidelobes from the bright nuclear emission. The S/N was improved by self-calibration but the flux value associated with the SN is consistent regardless of self-calibration processes. For 2019.1.00026.S, the data were taken during several visits over the course of two weeks, and we select those that provide the best S/N ratio at the SN position.
3 Results
Fig. 1 shows the reconstructed images of SN 2018ivc on day 199 (Maeda et al., 2022) and day 1364 (this work). After the flux decay in the earlier phase up to days, the SN has begun brightening again. There is a hint of a slow decay between days 1,024 and 1,364, but they are also consistent with the same flux level within (after correcting for the central frequency difference).
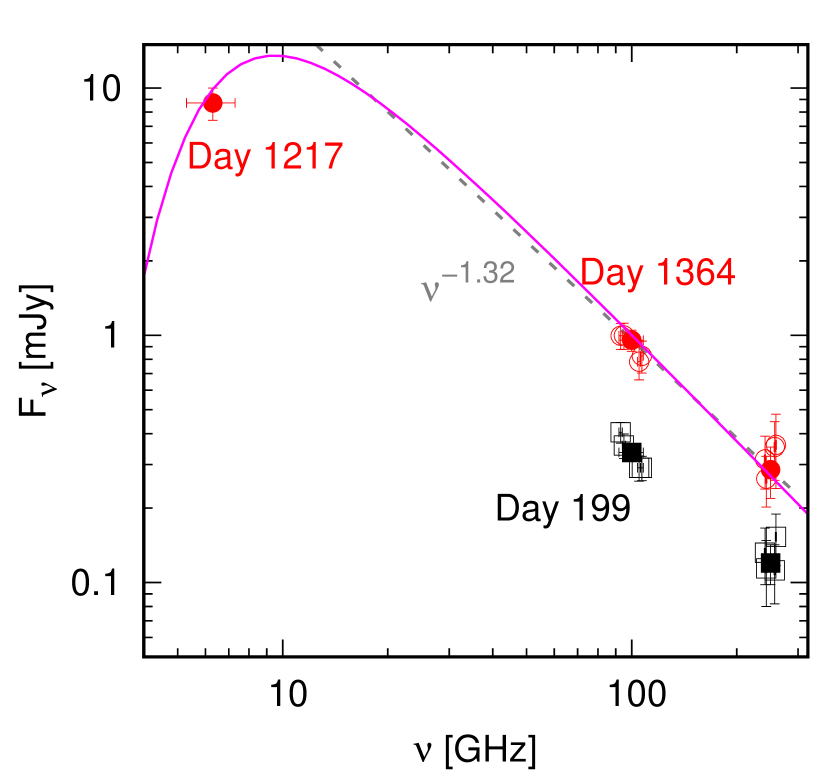
Fig. 2 compares the Spectral Energy Distribution (SED) on days 199 and 1,364 , with the addition of the cm flux on day 1,217 taken from Mutie et al. (2022). It is clear that SN 2018ivc remains optically thin in the high frequency emission in the ALMA bands. Assuming , is measured on day 1,364. Given the SED slope of on day 199 (Maeda et al., 2022), there is a hint of the spectral steepening but it is also consistent with no change within (i.e., for the combined analysis of the data on days 199 and 1,364). The SED as found in our ALMA observations also indicates that the cm emission must be in the optically-thick regime. This highlights the power of the higher-frequency observation despite generally the lower flux level; catching the optically-thin portion of the synchrotron emission is essential to constrain the CSM properties (Maeda et al., 2021, 2022).
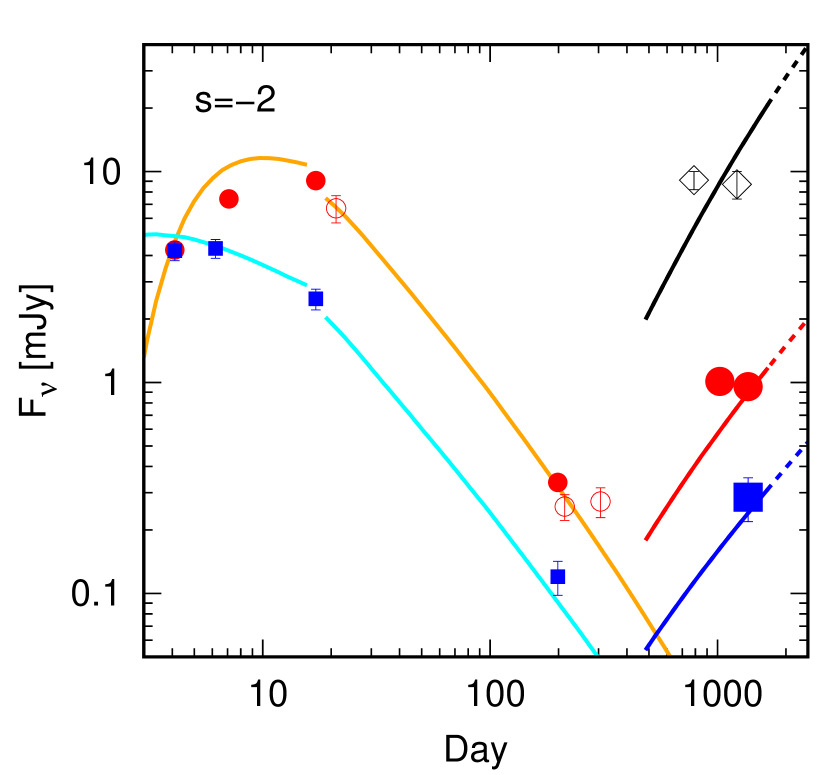
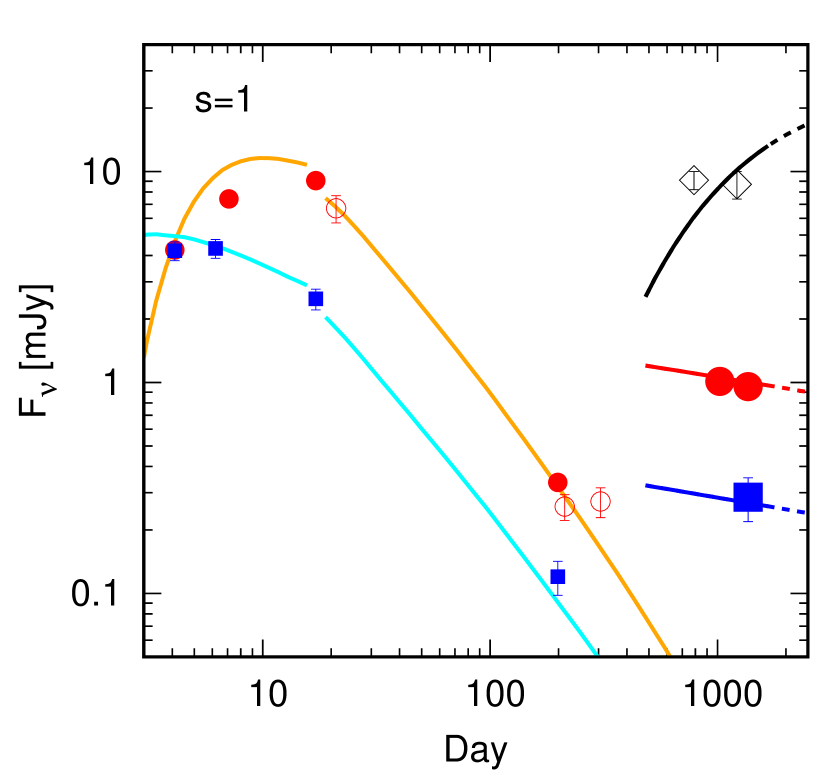
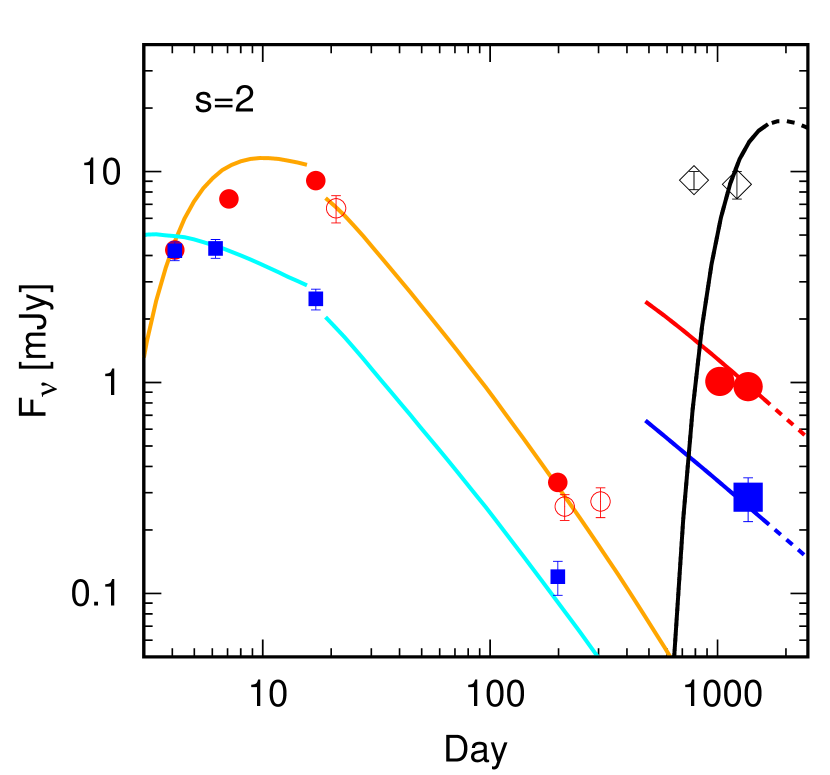
Fig. 3 shows the light curves. Rebrightening at 100 and 250 GHz is clearly seen, which probably started at days. Since it has been optically thin in the ALMA bands both before and after the rebrightening (Fig. 2), the flux increase means that the CSM is not smoothly distributed, and that the CSM density in the outer region must be higher than the extrapolation from the inner region.
We have computed a series of synchrotron emission models (see Maeda et al., 2021, 2022), by considering a CSM extended outward from cm (i.e., with the main interaction taking place at days for the SN ejecta velocity of km s-1). In practice, we simply assume the CSM is distributed with the density structure of without a hole in the computation (where , is the mass-loss rate, and is the mass-loss wind velocity); once the interaction has fully developed at days (at cm), the mass of the swept up CSM is expected to be soon dominated by the outer component, and therefore the evolution of the SN-CSM interaction will quickly lose the memory of the earlier interaction and follow the asymptotic behavior determined by the outer CSM component. We thus apply this model to the epoch after days.
The ejecta structure and the microphysics parameters are the same with those adopted by Maeda et al. (2022) for the early-phase modeling; , erg, and the outer ejeca density slope of . The cm emission is in the optically-thick regime, and we find that the synchrotron self-absorption alone would not explain the cut off at the low frequency. We thus include free-free absorption which is however poorly constrained by theory. We simply vary the optical depth by changing the constant electron temperature in the unshocked CSM. It is just for demonstration, and in most of the subsequent analyses we do not use constraints from the cm observations due to the large uncertainty in the model framework.
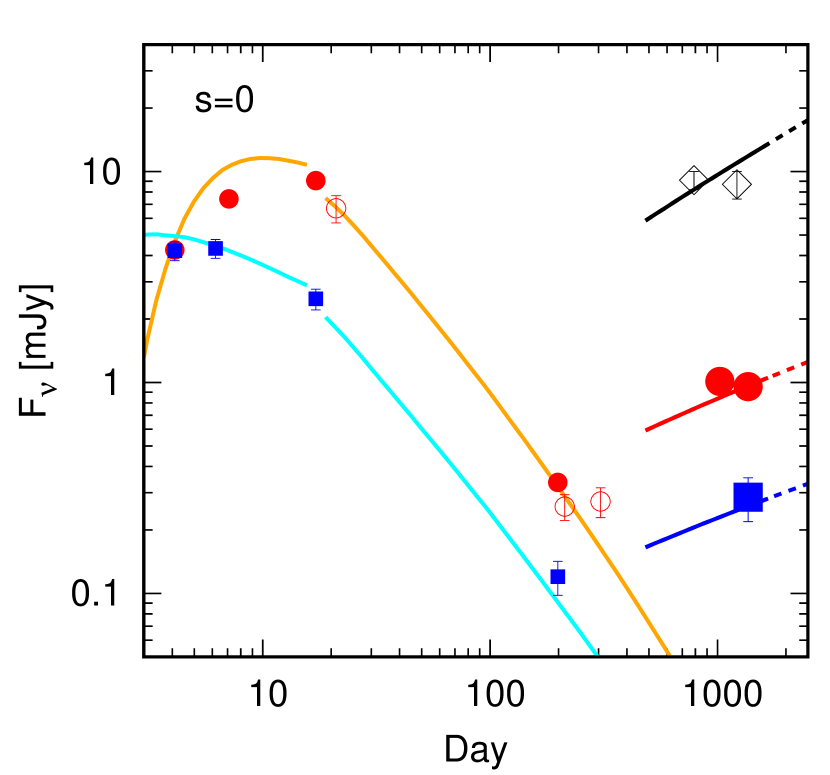
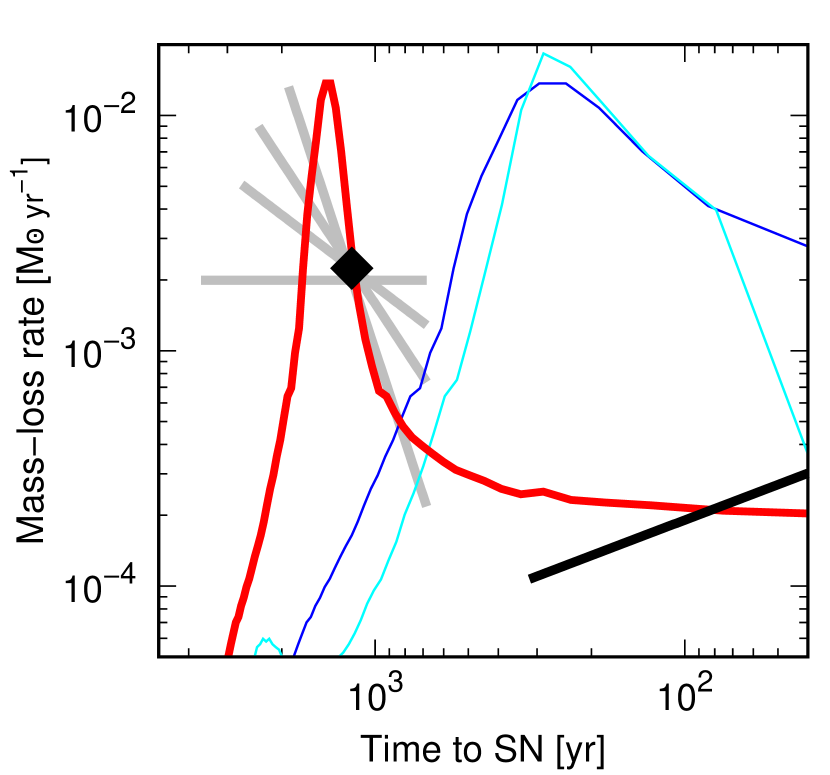
Fig. 3 shows models with four different CSM distributions; (i.e., increasing density), (constant), , and (steady-state mass loss). These CSM distributions are plotted in Fig. 4. By changing the density scale (), all the models can reproduce the flux levels at the latest epochs (1,024 and 1,364 days). The flat () and increasing () CSM distributions are not favored, given the nearly flat or slowly decaying evolution observed during this time window. The model with provides the best representation of the evolution, while our focus in the present work is the CSM density scale without aiming at constraining the value of . It is possible to explain the flux levels at 6.5/6.3 GHz in the optically-thick emission; within a simple treatment of the free-free absorption we are however not able to explain the flat or slowly-decaying evolution also seen in the cm emission. We emphasize that the cm emission, including both the model and the calibration of the data, is not a topic of this work.
While there is a degeneracy in the CSM slope given the limited temporal coverage, the CSM density at cm is strongly constrained to be g cm-3; this is where the data points exist. It is substantially above the extrapolation from the inner structure, and it is about an order of magnitude larger in terms of the mass-loss rate (assuming that did not change).

4 Discussion
In the SN ‘IIb’ scenario with an extended progenitor (Maeda et al., 2022), the mass-loss velocity would be km s-1 (e.g., Groh, 2014; Smith, 2017). Then, the location of the ‘outer’ dense CSM ( cm) corresponds to the mass-loss history yr before the explosion. Based on the binary evolution model toward SNe IIb (Ouchi & Maeda, 2017), Maeda et al. (2022) suggested that the progenitor of SN 2018ivc might have experienced an extreme case of the Case C mass transfer, where the binary mass transfer is initiated in the advanced evolution stage after the core He ignition (e.g., Langer, 2012), to explain the high-mass loss rate just before the explosion as inferred from the early-phase observation (see also Maeda et al., 2015). As compared to other SNe IIb, it is suggested that the strong binary interaction has taken place later in its evolution, closer to the time of the core-collapse explosion, which is attributed to larger initial orbital separation.
Ouchi & Maeda (2017) indeed predicted that the extreme case C mass transfer may bridge the evolution toward SNe IIb and SNe IIP, where the SN as surrounded by a dense CSM will be identified either as SNe IIL or IIn. In Fig. 4, we show two such models showing late-time binary interaction (Ouchi & Maeda, 2017), for the initial masses of the primary and the secondary of and , with the only difference in its initial orbital period (1,800 day for their Model 25, and 1,950 day for Model 28). In both models, the binary first experiences rapid mass transfer until the mass ratio is inverted, during which most of the H-rich envelope () is ejected. This is then followed by a relatively high mass-transfer rate of yr-1 as the primary keeps filling the Roche Lobe (RL). The final left-over envelope mass is in these models, which is somewhat large as an ‘SN IIb’ but qualitatively consistent with the extended ‘SN IIb’ progenitor scenario with slightly more massive envelope than canonical SNe IIb; the final envelope mass should be dependent on the binary parameters, especially on the mass ratio that roughly controls the mass of the left-over envelope after the rapid transfer phase (see above). The initial rapid transfer takes place yr and yr before the explosion, for Models 25 and 28, respectively.
While the timing is different, the mass-loss properties during the initial rapid-transfer phase are similar (Fig. 4). It is thus in principle possible to have the strong interaction phase at yr where most of the envelope, , is ejected, which form the dense CSM at cm, by a different combination of the component masses and the initial separation. This is demonstrated in Fig. 4 by comparing the mass-loss history derived for SN 2018ivc and those predicted by Models 25 and 28 of Ouchi & Maeda (2017). Indeed, if we shift the mass-loss history of Model 25 toward the explosion date, assuming slightly different binary parameters (e.g., the initial separation and/or the initial mass ratio), it can explain that derived for SN 2018ivc reasonably well.
In optical wavelengths, SNe IIb from ‘extended’ progenitors tend to show signs of the SN-CSM interaction in the late phase ( yr), as the emergence of strong Hα emission and light curve flattening (Patat et al., 1995; Matheson et al., 2000; Maeda et al., 2015; Fremling et al., 2019). However, it is more likely that the late-time emergence of the SN-CSM interaction in these cases is simply due to the decreasing importance of other powering mechanisms (e.g., 56Ni/Co decay) and it would not require an increase of the SN-CSM interaction power by a distinct high-density CSM component (Maeda et al., 2015). It is naturally expected if the timing of the strong binary interaction occurred earlier for these systems than for SN 2018ivc; in this case, the CSM created by the first, rapid mass-transfer phase must be located far outside.
To our knowledge, this is the second ‘SN IIb’ for which a clear radio rebrightening has been detected; the first example is the somewhat peculiar SN IIb 2003bg, suggested to be a broad-lined SN IIb (Hamuy et al., 2009) that showed a jump in the radio flux by a factor of two or three at days (Soderberg et al., 2006). We also note that SN IIb 2001ig showed a modulation superimposed on a long-term decline in its radio light curves (Ryder et al., 2004). These SNe IIb may share some common evolutionary path to SN 2018ivc. Possible modulations were also seen in SN IIb 2004C (DeMarchi et al., 2022), though the sparse sampling at such late times makes it hard to ascertain their magnitude and timescale. In any event SN 2004C did not show a sustained transition from decay to rebrightening. SN 2004C is nevertheless one of the only two SNe IIb included in the sample of late-time radio monitoring by Stroh et al. (2021), with the other example lacking information on its temporal evolution.
Radio rebrightening is rare for SNe, and only a handful of events are known so far (e.g., Bauer et al., 2008). Of particular interests are a few SNe Ib/c showing transition to SNe IIn and the late-time radio rebrightening with the time scale covering a year to decades (Anderson et al., 2017; Chandra et al., 2020; Thomas et al., 2022); Margutti et al. (2017) showed that about 10% of SNe Ib/c exhibit radio (cm) rebrightening at yr after the explosion with typically an order of magnitude enhancement in the flux. It should be interesting to compare the characteristics of SN 2018ivc with those events, especially SN 2014C as the most well-studied example. Margutti et al. (2017) argued that the inner region is more like a cavity, surround by an extremely dense CSM; extremely high-mass loss rate ( yr-1) at years before the explosion was followed by the mass loss consistent with a wind from a Wolf-Rayet star ( yr-1 Smith, 2017). Margutti et al. (2017) suggested as one possibility the scenario where the common envelope is responsible for the creation of the detached dense CSM, leaving a bare He star. The case for SN 2018ivc has two remarkable differences: (1) the initial, main mass loss ( yr before the explosion) is less dramatic, and then (2) it keeps a relatively high mass-loss rate toward the explosion. Therefore, it fits better to the scenario proposed here (see also Ouchi & Maeda, 2017; Maeda et al., 2022); the initial mass transfer was rapid but did not enter into the common envelope, and the rapid phase was over when the mass ratio was inverted. At that moment of the H-rich envelope was left, which keeps filling the RL. An interesting, alternative scenario may be a merger of the cores following the common envelope, in which the excited merger product may keep a high mass loss rate up until the explosion (Nomoto et al., 1995, 1996).
The mm observations of SNe are extremely rare, therefore virtually no sample is available to make any data-based estimate on the frequency of SNe showing rebrightening at mm wavelengths. Indeed, a well-defined control sample is still missing even at cm wavelengths (Bietenholz et al., 2021), which makes even a qualitative estimate of the frequency of rebrightening events somewhat fraught, with the possible exception of SNe Ib/c (see above: Margutti et al., 2017). Alternatively, we could estimate an expected rate of such events based on the scenario proposed here (i.e., the boundary between the single and binary evolution channels). Maeda et al. (2022) gave such an estimate for the ‘SN 2018ivc-like’ events based on the model sequence of Ouchi & Maeda (2017), as being % of SNe IIb and % of SESNe. This estimate indeed indicates that a non-negligible fraction of SNe Ib/c showing rebrightening ( of SNe Ib/c; see above) may be linked to this binary evolution channel. On the other hand, the same fraction was estimated to be % of SNe IIL, indicating that the evolutionary channel considered here is not a major channel toward SNe IIL, which might reflect potential ‘mixed populations’ within SNe IIL (Arcavi et al. 2012; but see also Anderson et al. 2014). As compared to SNe IIP, SN 2018ivc-like events are very rare, with the expected rate of only % of SNe IIP (with large uncertainties) where we assume that the relative proportion of SNe IIP to SNe IIL is 7:1 (Li et al., 2011). These crude estimates suggest that the SN 2018ivc-like events, or the events linking the single and binary evolution channels, are intrinsically rare in the population of H-rich SNe. SNe IIL would make especially interesting targets, as the above estimate suggests that the bulk of SNe IIL are unlikely to have originated in the specific binary evolutionary channel proposed here. A future sample of SNe IIL followed up in the radio, particularly at mm wavelengths, may reveal whether such rebrightening is exclusively associated with the SN2018ivc-like objects.
Another possibility for the detached CSM is an external effect. For the detached CSM shell associated with SN 2014C, Milisavljevic et al. (2015) considered photoionization confinement of the CSM by an external radiation field imposed by neighboring stars in a stellar cluster, based on the scenario proposed by Mackey et al. (2014). This scenario, however, is unlikely to work for SN 2018ivc; Bostroem et al. (2020) placed an upper limit of the MS mass of a ‘single star’ being that existed at the SN location in pre-SN Hubble Space Telescope images.
5 Concluding Remarks
We have presented long-term monitoring of a peculiar SN IIL 2018ivc ( days) with ALMA. SN 2018ivc started showing rebrightening in its synchrotron flux at days after the explosion. The radial CSM distribution as reconstructed from the long-term mm light curves shows a very high mass-loss rate exceeding yr-1 at years before the explosion, followed by a moderately high mass-loss rate of yr-1 in the remaining evolution toward the SN explosion. This behavior is in line with the expectation from the scenario in which SN 2018ivc is indeed more like an ‘extended SN IIb’ in its ejecta properties (i.e., He star surrounded by of the H-rich envelope) produced through the binary with a relatively large initial separation at a boundary between SNe IIb and SNe IIP (Ouchi & Maeda, 2017; Maeda et al., 2022).
To our knowledge, it is the first example where rebrightening is detected in the mm synchrotron emission from SNe. Further, in the above-mentioned scenario, it is the second example where the radio-synchrotron rebrightening has been observed for an ‘SN IIb’. Indeed, SNe showing radio rebrightening are very rare. The comparison to the properties of well-observed SN 2014C, showing a transition from SN Ib to SN IIn, shows that they likely share the similar (binary) evolution channel albeit with some different details. It is likely that the strong binary interaction started at similar epochs ( yrs before the explosion), while the outcome is different; SN 2018ivc is more likely explained by the rapid RL over-flow (non-conservative) mass transfer leaving a RL-filling primary star, while SN 2014C entered into the common envelope and stripped away essentially all the H-rich envelope. Identifying the cause of the difference is beyond the scope of the present work, but it may be for example due to the masses of the binary components (e.g., the mass ratio).
The models presented here suggest that of the CSM has been swept up by day . As this is comparable to the expected envelope mass, the shock will start experiencing rapid deceleration afterward. Therefore, we predict that the synchrotron flux will shortly turn into the decay phase again. Further, if the mass budget for the CSM is as expected in the binary evolution scenario for SNe IIb (and SESNe), we may assume that the characteristic shock velocity would be km s-1 after a substantial amount of this CSM is swept up. Given that there is additional CSM for another cm, the shock will eventually break out of this CSM in years after which the interaction will be essentially over. As such, we plan to continuously monitor SN 2018ivc, which could be done in part of the monitoring observations of NGC1068. In addition, it can be an interesting target for a continuous monitoring with Very Long Baseline Interferometry; we expect to start spatially resolving the shock expansion at yrs for the angular resolution of . It can be an interesting target not only for existing facilities, but for future facilities such as the next-generation Very Large Array (ngVLA: Murphy et al., 2018) .
References
- Anderson et al. (2017) Anderson, G. E., Horesh, A., Mooley, K. P., et al. 2017, MNRAS, 466, 3648, doi: 10.1093/mnras/stw3310
- Anderson et al. (2014) Anderson, J. P., González-Gaitán, S., Hamuy, M., et al. 2014, ApJ, 786, 67, doi: 10.1088/0004-637X/786/1/67
- Arcavi et al. (2012) Arcavi, I., Gal-Yam, A., Cenko, S. B., et al. 2012, ApJ, 756, L30, doi: 10.1088/2041-8205/756/2/L30
- Bauer et al. (2008) Bauer, F. E., Dwarkadas, V. V., Brandt, W. N., et al. 2008, ApJ, 688, 1210, doi: 10.1086/589761
- Bersten et al. (2012) Bersten, M. C., Benvenuto, O. G., Nomoto, K., et al. 2012, ApJ, 757, 31, doi: 10.1088/0004-637X/757/1/31
- Bietenholz et al. (2021) Bietenholz, M. F., Bartel, N., Argo, M., et al. 2021, ApJ, 908, 75, doi: 10.3847/1538-4357/abccd9
- Bostroem et al. (2020) Bostroem, K. A., Valenti, S., Sand, D. J., et al. 2020, ApJ, 895, 31, doi: 10.3847/1538-4357/ab8945
- Chandra et al. (2020) Chandra, P., Chevalier, R. A., Chugai, N., Milisavljevic, D., & Fransson, C. 2020, ApJ, 902, 55, doi: 10.3847/1538-4357/abb460
- Chevalier (1998) Chevalier, R. A. 1998, ApJ, 499, 810, doi: 10.1086/305676
- Chevalier & Fransson (2006) Chevalier, R. A., & Fransson, C. 2006, ApJ, 651, 381, doi: 10.1086/507606
- DeMarchi et al. (2022) DeMarchi, L., Margutti, R., Dittman, J., et al. 2022, ApJ, 938, 84, doi: 10.3847/1538-4357/ac8c26
- Dessart & Hillier (2022) Dessart, L., & Hillier, D. J. 2022, A&A, 660, L9, doi: 10.1051/0004-6361/202243372
- Fang et al. (2019) Fang, Q., Maeda, K., Kuncarayakti, H., Sun, F., & Gal-Yam, A. 2019, Nature Astronomy, 3, 434, doi: 10.1038/s41550-019-0710-6
- Filippenko (1997) Filippenko, A. V. 1997, ARA&A, 35, 309, doi: 10.1146/annurev.astro.35.1.309
- Fremling et al. (2019) Fremling, C., Ko, H., Dugas, A., et al. 2019, ApJ, 878, L5, doi: 10.3847/2041-8213/ab218f
- Groh (2014) Groh, J. H. 2014, A&A, 572, L11, doi: 10.1051/0004-6361/201424852
- Hamuy et al. (2009) Hamuy, M., Deng, J., Mazzali, P. A., et al. 2009, ApJ, 703, 1612, doi: 10.1088/0004-637X/703/2/1612
- Hiramatsu et al. (2021) Hiramatsu, D., Howell, D. A., Moriya, T. J., et al. 2021, ApJ, 913, 55, doi: 10.3847/1538-4357/abf6d6
- Langer (2012) Langer, N. 2012, ARA&A, 50, 107, doi: 10.1146/annurev-astro-081811-125534
- Li et al. (2011) Li, W., Leaman, J., Chornock, R., et al. 2011, MNRAS, 412, 1441, doi: 10.1111/j.1365-2966.2011.18160.x
- Mackey et al. (2014) Mackey, J., Mohamed, S., Gvaramadze, V. V., et al. 2014, Nature, 512, 282, doi: 10.1038/nature13522
- Maeda (2012) Maeda, K. 2012, ApJ, 758, 81, doi: 10.1088/0004-637X/758/2/81
- Maeda (2022) —. 2022, arXiv e-prints, arXiv:2210.00326. https://arxiv.org/abs/2210.00326
- Maeda et al. (2015) Maeda, K., Hattori, T., Milisavljevic, D., et al. 2015, ApJ, 807, 35, doi: 10.1088/0004-637X/807/1/35
- Maeda et al. (2021) Maeda, K., Chandra, P., Matsuoka, T., et al. 2021, ApJ, 918, 34, doi: 10.3847/1538-4357/ac0dbc
- Maeda et al. (2022) Maeda, K., Chandra, P., Moriya, T. J., et al. 2022, ApJ, accepted (arXiv:2211.04808)
- Margutti et al. (2017) Margutti, R., Kamble, A., Milisavljevic, D., et al. 2017, ApJ, 835, 140, doi: 10.3847/1538-4357/835/2/140
- Matheson et al. (2000) Matheson, T., Filippenko, A. V., Ho, L. C., Barth, A. J., & Leonard, D. C. 2000, AJ, 120, 1499, doi: 10.1086/301519
- Matsuoka et al. (2019) Matsuoka, T., Maeda, K., Lee, S.-H., & Yasuda, H. 2019, ApJ, 885, 41, doi: 10.3847/1538-4357/ab4421
- Milisavljevic et al. (2015) Milisavljevic, D., Margutti, R., Kamble, A., et al. 2015, ApJ, 815, 120, doi: 10.1088/0004-637X/815/2/120
- Murphy et al. (2018) Murphy, E. J., Bolatto, A., Chatterjee, S., et al. 2018, in Astronomical Society of the Pacific Conference Series, Vol. 517, Science with a Next Generation Very Large Array, ed. E. Murphy, 3. https://arxiv.org/abs/1810.07524
- Mutie et al. (2022) Mutie, I., Williams, D., Beswick, R., & Baki, P. 2022, The Astronomer’s Telegram, 15521, 1
- Nomoto et al. (1996) Nomoto, K., Iwamoto, K., Suzuki, T., et al. 1996, in Compact Stars in Binaries, ed. J. van Paradijs, E. P. J. van den Heuvel, & E. Kuulkers, Vol. 165, 119
- Nomoto et al. (1995) Nomoto, K. I., Iwamoto, K., & Suzuki, T. 1995, Phys. Rep., 256, 173, doi: 10.1016/0370-1573(94)00107-E
- Ouchi & Maeda (2017) Ouchi, R., & Maeda, K. 2017, ApJ, 840, 90, doi: 10.3847/1538-4357/aa6ea9
- Patat et al. (1995) Patat, F., Chugai, N., & Mazzali, P. A. 1995, A&A, 299, 715
- Ryder et al. (2004) Ryder, S. D., Sadler, E. M., Subrahmanyan, R., et al. 2004, MNRAS, 349, 1093, doi: 10.1111/j.1365-2966.2004.07589.x
- Shigeyama et al. (1994) Shigeyama, T., Suzuki, T., Kumagai, S., et al. 1994, ApJ, 420, 341, doi: 10.1086/173564
- Smith (2017) Smith, N. 2017, in Handbook of Supernovae, ed. A. W. Alsabti & P. Murdin, 403, doi: 10.1007/978-3-319-21846-5_38
- Soderberg et al. (2006) Soderberg, A. M., Chevalier, R. A., Kulkarni, S. R., & Frail, D. A. 2006, ApJ, 651, 1005, doi: 10.1086/507571
- Stroh et al. (2021) Stroh, M. C., Terreran, G., Coppejans, D. L., et al. 2021, ApJ, 923, L24, doi: 10.3847/2041-8213/ac375e
- Tartaglia et al. (2018) Tartaglia, L., Sand, D. J., Valenti, S., et al. 2018, ApJ, 853, 62, doi: 10.3847/1538-4357/aaa014
- THE CASA TEAM et al. (2022) THE CASA TEAM, Bean, B., Bhatnagar, S., et al. 2022, arXiv e-prints, arXiv:2210.02276. https://arxiv.org/abs/2210.02276
- Thomas et al. (2022) Thomas, B. P., Wheeler, J. C., Dwarkadas, V. V., et al. 2022, ApJ, 930, 57, doi: 10.3847/1538-4357/ac5fa6
- Tully et al. (2009) Tully, R. B., Rizzi, L., Shaya, E. J., et al. 2009, AJ, 138, 323, doi: 10.1088/0004-6256/138/2/323
- Valenti et al. (2018) Valenti, S., Sand, D. J., & Wyatt, S. 2018, Transient Name Server Discovery Report, 2018-1816, 1
- Woosley et al. (1994) Woosley, S. E., Eastman, R. G., Weaver, T. A., & Pinto, P. A. 1994, ApJ, 429, 300, doi: 10.1086/174319
- Yoon (2017) Yoon, S.-C. 2017, MNRAS, 470, 3970, doi: 10.1093/mnras/stx1496